1. Introduction
Buildings play an important role in providing comfortable conditions for human life and work. Therefore, it is not surprising that constructing and operating them and the related infrastructure consumes a large part of global resources [
1], both in terms of material as well as energy [
2], and directly and indirectly emits 40% of global greenhouse (GHG) gas emissions [
3]. Hence, the building industry is one of the focus areas for the reduction of energy demand and GHG emissions [
4]. Life cycle energy demand by and emissions from buildings consist of two components—embedded (also known as embodied) and operational [
5]. Due to the long lifespan of buildings, conditioning the building is responsible for the largest share of energy consumption and emissions of existing buildings. Therefore, efficiency efforts have focused on the operation phase [
4]. However, with increasing energy efficiency and a growing share of renewable energy for building operation, embedded energy and environmental impacts gain importance. The European directive on the energy performance of buildings [
6] requires all newly constructed buildings in Europe to be nearly zero energy buildings (NZEB) starting in the year 2020. This means that new buildings will consume almost no non-renewable energy during their operation. Consequently, all non-renewable energy demand and thus the largest share of GHG emissions will occur during the construction, maintenance, and end-of-life phases. Recent studies underline this trend [
5,
7].
To evaluate the environmental performance of building throughout their entire life cycle, life cycle assessment (LCA) is in the process of being established in the building industry [
8]. However, unlike operational energy calculations, LCA is not part of standard planning processes. Even operational energy calculations are conducted as late as possible in the design process when more information about the future building is available, mainly to show compliance with standards [
9]. LCA calculations are not mandatory except for certification purposes by a green or sustainable building certification system, such as DGNB (Deutsche Gesellschaft für nachhaltiges Bauen, German Sustainable Building Council) [
10] or LEED (Leadership in Leadership in Environmental and Energy Design) [
11]. In light of the increasing importance of the construction, maintenance, and end-of-life phases, both standardization and tools for evaluation are needed [
12].
Energy and environmental performance evaluation throughout the building design process bears significant improvement opportunities [
13], but at the same time, it poses multiple challenges. The assumptions made throughout the initial design stages and the decisions based on these assumptions have significant influence on building performance [
14,
15]. As the potential to minimize energy demand and GHG emissions is greatest in these early design stages [
16,
17], there is increasing demand for performance evaluation in these stages. However, there is a lack of information about future building, and information, which can serve as a basis for analysis, is uncertain. To deal with this vagueness, sensitivity analyses should be employed in order to visualize uncertainties in the results as well as influential parameters contributing significantly to result uncertainties [
18]. Moreover, for the designer, it is also valuable to see which building parts contribute most to the overall quantity of energy demand and environmental impact. For the purposes of this study, we use the term contribution analysis for this calculation.
Uncertainty analysis has recently been used extensively in building (operational) energy assessment [
19]. For LCA, which includes embedded energy and environmental impact calculations, uncertainty analysis is less common [
20], but with increasing relevance of embedded life cycle phases of buildings, it is becoming an important research field. Sources of uncertainty in embedded energy and impacts overlap with uncertainties for operational energy mainly when they pertain to exterior building parts [
21]. Of the different uncertainties present in LCA studies—parameter uncertainty, model uncertainty, and scenario uncertainty [
22]—this study is concerned with uncertainty in the building design parameters.
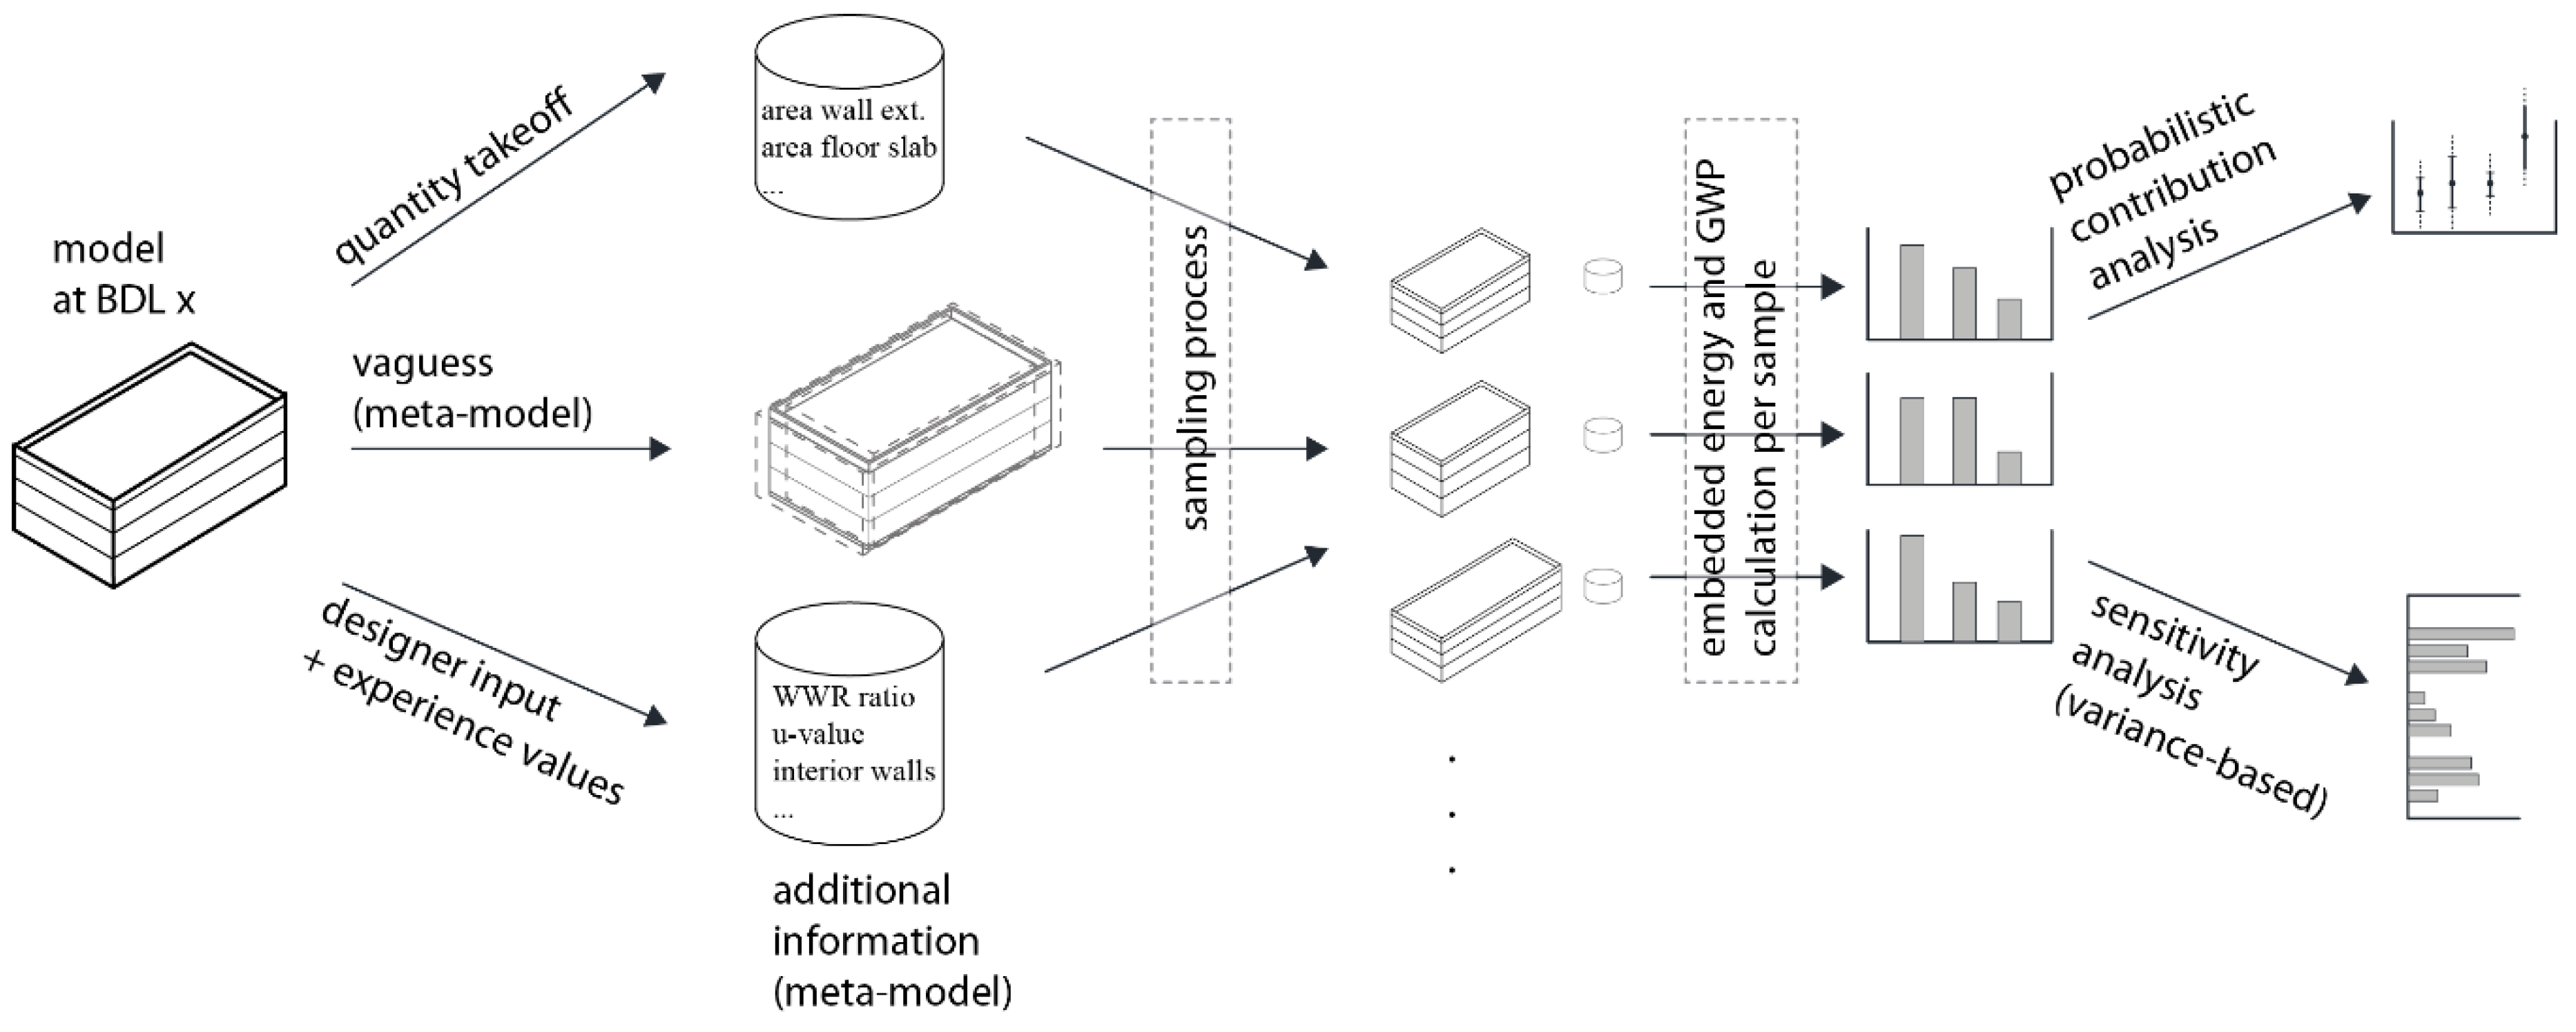
Uncertainty analysis consist of a sampling step (preprocessing), calculation (uncertainty propagation), and final analysis (post-processing) of the results [
23]. The sampling step involves varying the input parameters according to their distribution functions. Monte Carlo simulation is one of the most commonly used sampling technique in probabilistic calculations, generating random samples based on the input parameters’ distribution functions [
24]. Subsequently, the uncertainties are propagated, i.e., the output results for each sample and mean value and variance of all output values are calculated. Global sensitivity analysis then identifies how much input parameter uncertainties contribute to output variance. Only if sampling is based on distribution functions, global sensitivity analysis is possible [
25]. Global sensitivity analysis techniques usable in LCA include (squared) standardized regression coefficients, squared Spearman correlation coefficients, or Sobol indices [
25].
Full building LCA calculations require detailed information about the materials used in the building, construction processes, energy demand and generation, and end-of-life scenarios. Although there are building characteristics that influence both embedded and operational energy and impacts, the calculation methods for each are essentially different: operational energy demand ideally requires dynamic thermal simulation taking into account the exterior conditions (climate, shading provided by surrounding buildings, etc.). The calculation of environmental impacts for building operation uses the operational energy demand as an input value and calculates the related environmental impact by taking the energy sources (mechanical systems and energy carrier) into account. Embedded energy and environmental impact calculations, in contrast, are essentially matrix calculations whose complexity stems from the amount of data and information required. To reduce this complexity to a manageable level, aggregated data is provided in building LCI/LCIA databases such as the Oekobaudat [
26]. This paper explores in detail the analysis of embedded energy and GHG emissions in early design stages in addition to the uncertainty analysis of relevant parameters for both operational and embedded energy published in Harter et al. [
21]. The related operational energy calculation is described in detail by Singh and Geyer [
27].
Existing LCA and energy calculation tools work well for later design stages when the building’s shape and materials are established in detail [
28]. Current methods to calculate embedded energy and impacts do not lend themselves to early design stages, as they require more information input than commonly available at an early stage. In early stages, missing information in terms of both materials and missing building elements have to be estimated. However, estimations require expert knowledge and lack transparency for the designer. Moreover, design uncertainties are not systematically taken into account [
20]. In this context, building information modeling (BIM), a well-established modeling technology with 3D-data including geometry and information on different levels [
29], offers several opportunities: it facilitates managing the amount of data needed for calculations and providing automated or semi-automated calculations [
30,
31].
In early stage performance analysis, few, if any, variants of a project are evaluated, as standard calculations are lengthy and hence time-intensive. Commonly, only a handful of previous sample projects are available, providing guidance from experience to find the most relevant parameters. However, as various buildings are only comparable to a limited extent, even normalization to usable floor area and one building type does not provide satisfying standard values [
32], as influential parameters can differ from project to project. Hence, the aim of this project is the development of a tool for engineers and designers to provide a project-specific quick estimate of the embedded energy and GHG emissions of the building using a limited number of background datasets, but taking uncertainties caused by design vagueness into account. Subsequently, this will be integrated into the overall performance evaluation such that trade-offs between operational and embedded life cycle phases can be visualized and other criteria (cost, fire safety, etc.) are taken into account.
This paper presents the calculation methods and our sample project in
Section 2, starting with the LCA method (
Section 2.1), subsequently describing the integration into BIM (
Section 2.2) the sensitivity and contribution analysis (
Section 2.3), and finally the sample project (
Section 2.4). We split the results,
Section 3, into three parts. In
Section 3.1, we tackle the question of which parameter uncertainties contribute the most to result uncertainties (sensitivity analysis).
Section 3.2 analyses the contribution of the building parts, i.e., which parts contribute the most to total embedded energy and environmental impacts (contribution analysis).
Section 3.3 tests the influence of a different material choice for the building part with the most contribution to GHG emissions.
Section 3.4 evaluates the order of magnitude of average total rough estimate results and validates them against a complete LCA and a simplified manual LCA of the final building design.
Section 4 discusses the results, describes the limitation of this project, and provides an outlook toward future research.
3. Results
3.1. Sensitivity Analysis
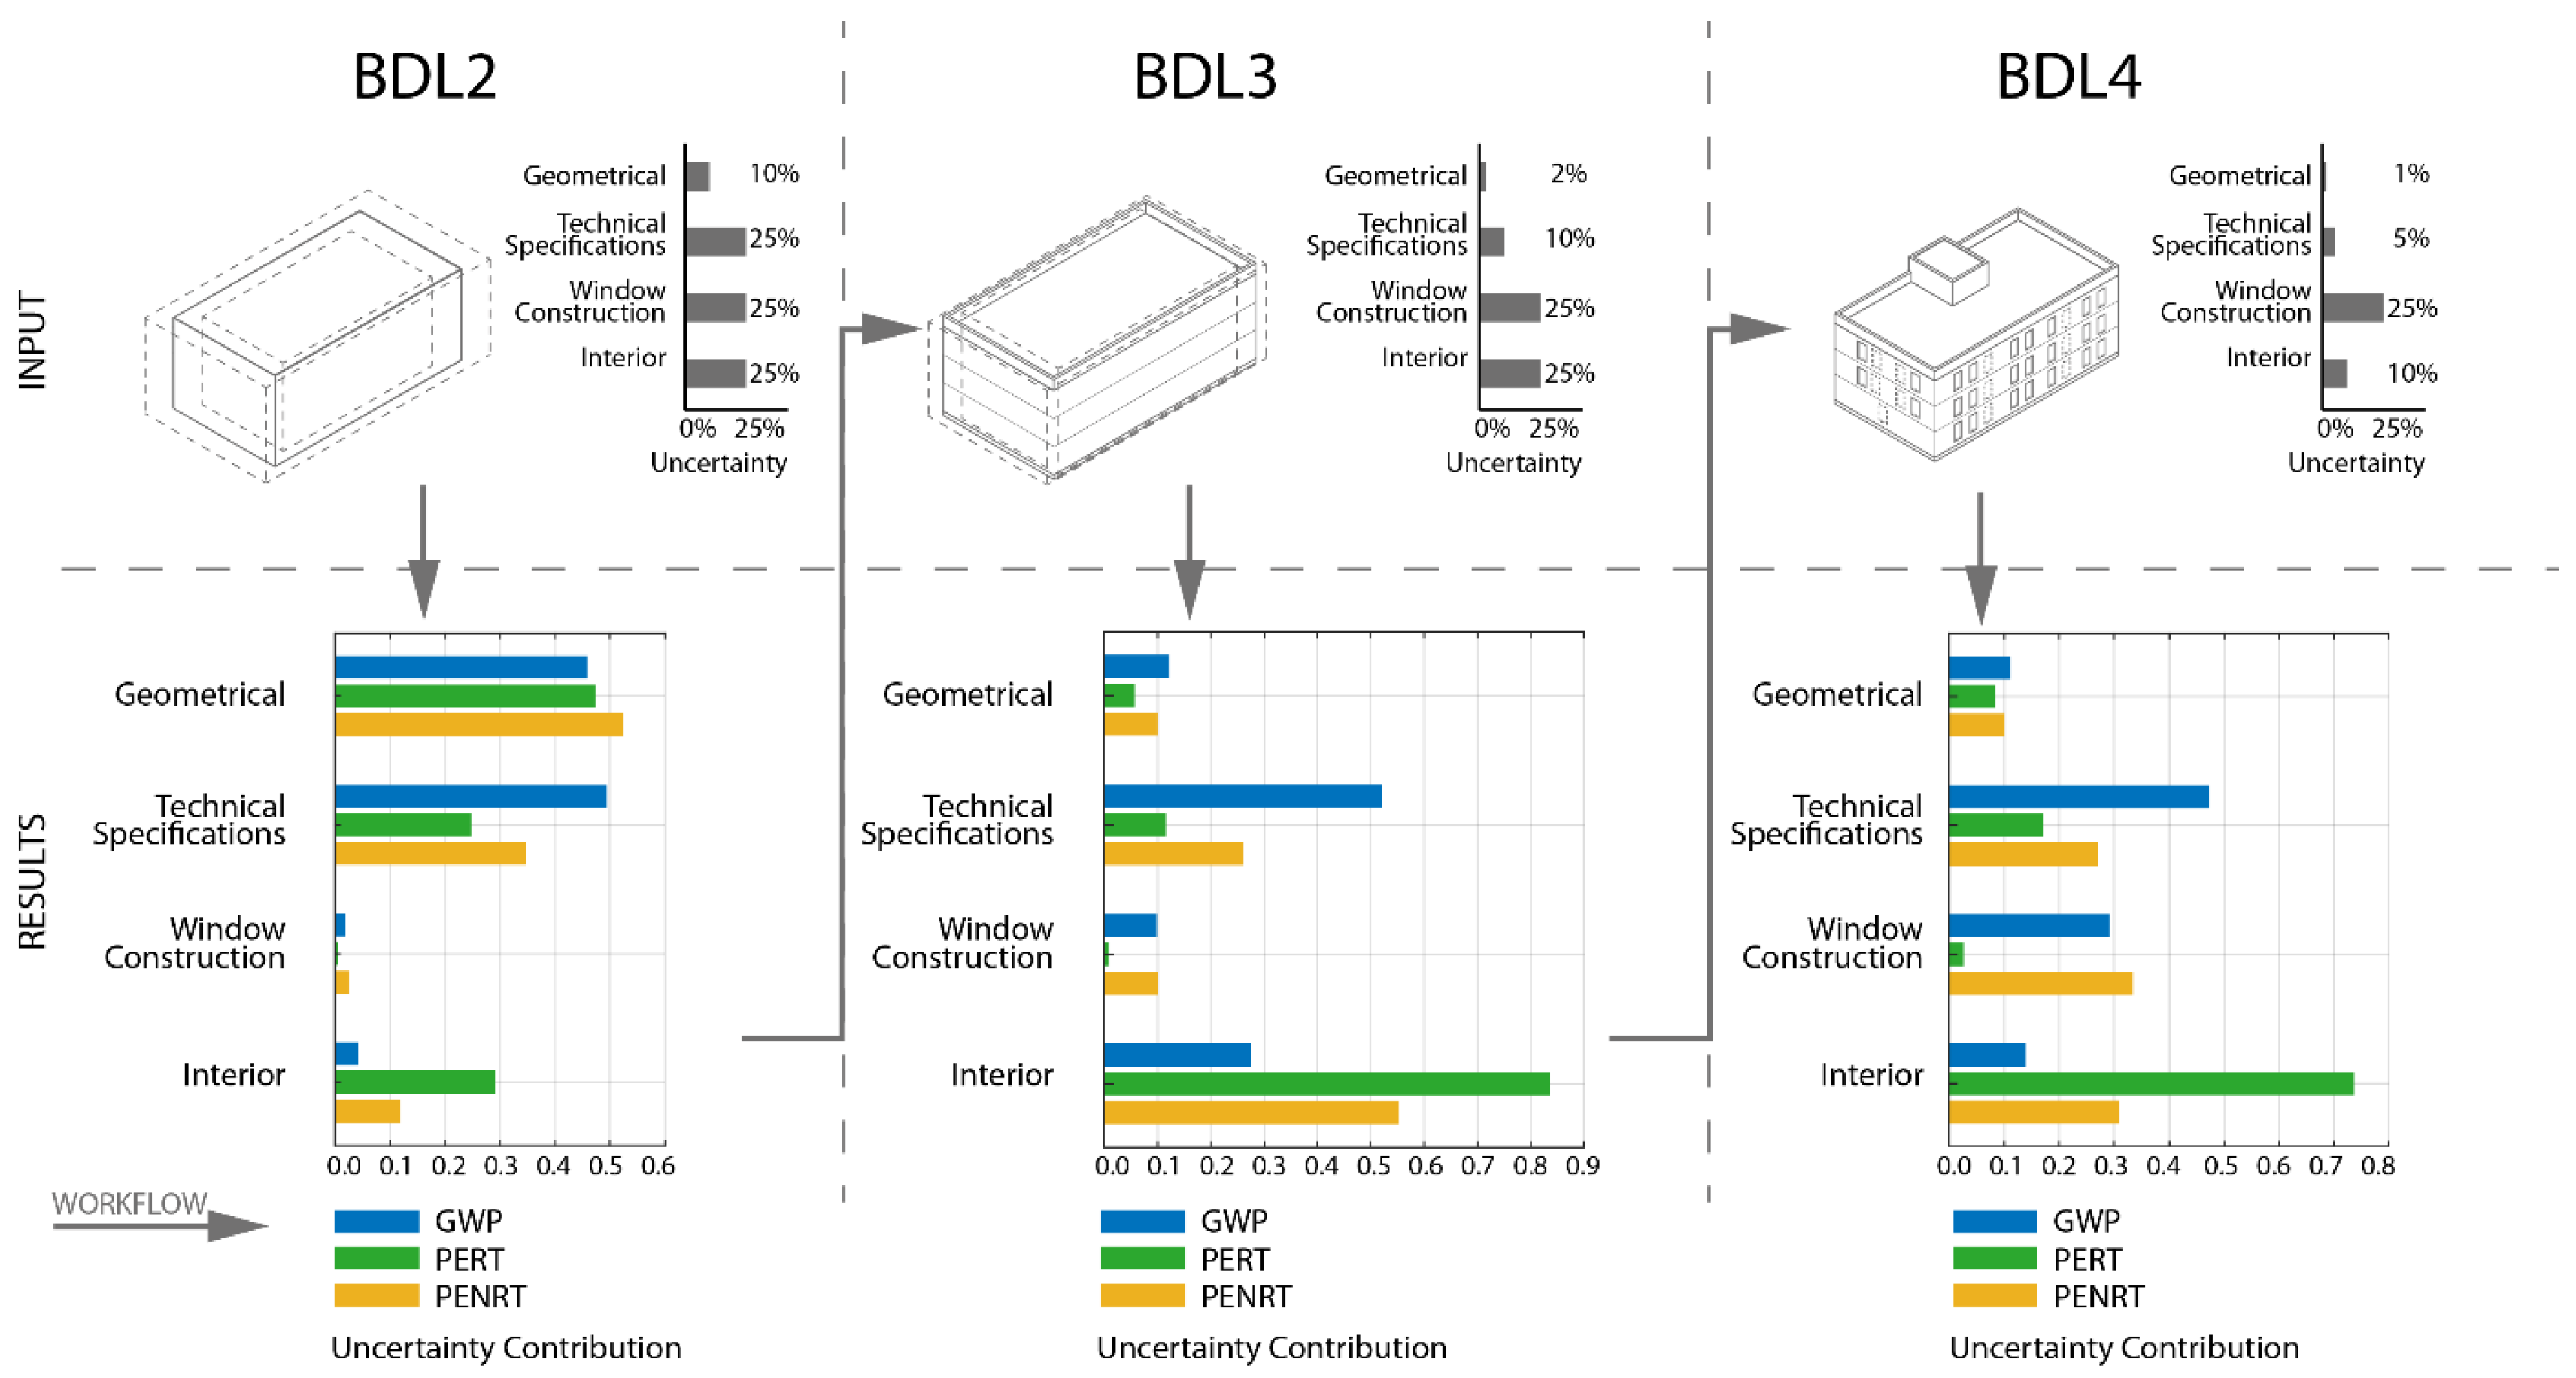
Figure 2 shows uncertainties and resulting uncertainty contribution for each parameter group according to BDL 2, 3, and 4. Exact numbers are listed in
Appendix A,
Table A1. Input parameter uncertainties are strategically reduced with increasing BDL to reduce overall uncertainty in the results. Note that the sum of uncertainty contribution is always close to one (100%) (see
Section 2.3). It has to be kept in mind that
Figure 2 shows uncertainty contribution, not overall result uncertainty. The latter is shown in
Section 3.2.
In BDL 2, result uncertainties are highly dependent on the geometrical parameter uncertainties, followed by the uncertainties in technical specifications. Hence, these input uncertainties are reduced for BDL3 in order to increase the accuracy of the results. In BDL3, result uncertainties, now overall lower than in BDL2, are strongly dependent on interior (for PERT and PENRT) and still on technical specifications (for GWP). Therefore, uncertainty in these parameters is reduced for BDL4. In BDL4, the uncertainty contribution of windows increases for GWP and PENRT, as all other uncertainties are small. In this process, it is clear that there are trade-offs involved when decreasing uncertainties simultaneously: reducing uncertainties in one parameter increases the contribution of another parameter, e.g., uncertainty contribution of the technical specifications to GWP does not change, as the uncertainty contribution of interior decreases simultaneously. However, overall uncertainty decreases significantly with increasing BDL (see
Section 3.2).
Overall, an ideal picture would show equal sensitivities for all parameters. This, however, is impossible due to the differing nature of the indicators considered. Between PENRT and GWP, parallels can be identified. This is not surprising, as the use of fossil energy sources (represented by the indicator PENRT) contributes largely to GHG emissions, represented by the indicator GWP. However, GWP and PENRT do not correlate entirely, as there are other sources of GHG emissions, such as the chemical process of clinker production, which is a step in the process of cement production. PERT behaves differently from both PENRT and GWP: Results’ uncertainty for PERT is to the largest extent due to the uncertainty of the amount of interior walls, starting from BDL3. In turn, the uncertainty in window construction is insignificant for PERT uncertainty. This is related to the fact that the materials used in interior wall construction (gyp board) have a comparatively high content of PERT, whereas the materials used in window construction (PVC, glass) do not.
The sensitivity analysis guides the workflow of strategic uncertainty reduction and thereby reduces overall uncertainties. From the BDL 2 analysis, the planning team receives the information that geometric uncertainties and technical specifications are the main sources for result uncertainty. Therefore, planning efforts should focus on these aspects to arrive at BDL3. Subsequently, the layout of the interior walls needs to be specified in addition to the aforementioned parameters. These steps increase reliability of results as will be shown in the following
Section 3.2.
3.2. Contribution Analysis
This section analyses the contribution of functional parts of the building to show how the sensitivity analysis indicates where in the building the highest potential to reduce PE demand and GHG emissions is located. This pertains to the indicator GWP for GHG emissions and PERT and PENRT for primary energy use. Building parts are defined in
Table 1.
Figure 3 shows the results for the sample building for BDL2 and BDL4. BDL 3 was omitted as results lie between BDL2 and BDL4 and do not contain additional information regarding the building part contribution.
First, the overall reduction of result uncertainty is clearly visible. Average values stay constant as we did not change any of the mean input values. The contribution of the building parts changes insignificantly from one BDL to the next. This, too, is an expected result for the same reason as the (mean) input values stay the same.
Second, the contribution analysis can guide architects and consultants towards strategic building parts, i.e., the parts that should be considered primarily when looking for ways to reduce energy demand and GHG emissions. To render a building part truly strategic a second condition must be fulfilled: alternative materials with lower PE content and GHG emissions need to be available. For example, for a concrete base plate, no alternative materials are available. However, alternatives in structural design either providing a different kind of foundation or an alternative concrete/reinforcement combination might be available. Hence, this study provides guidance toward the building parts with the highest influence but does not provide design assistance, i.e., it entrusts the design team with determining if alternative solutions are available. For GWP and PENRT, the building’s structure, made of reinforced concrete, clearly emerges as a decisive part, contributing half of the building’s GWP and 37% of PENRT. Second, windows are relevant and thirdly, interior walls. Insulation plays a lesser role despite the above average energy standard of the building.
As a building part’s contribution depends on the materials used for each building part, reducing overall emissions without changing any of the input parameters requires looking at alternative building materials.
3.3. GWP Reduction Potential
Since the structure is the largest contributor to total GWP and the use of wood is known to reduce GHG emissions, we ran the sensitivity and contribution analyses with wood instead of reinforced concrete. In general, this alternative is only available when fire safety requirements allow the use of wood (which is the case for our case study as we deal with a building of a low fire safety class) and takes into account that some parts cannot be replaced such as the base plate. All results are listed in
Appendix A,
Table A2. This case study shows the effect of a different material choice. Overall, changing the structural material reduces GWP by 25% and PENRT by 10% while at the same time increasing PERT by 123% (see
Figure 4). This result is in line with previous LCA studies, which unequivocally state that the use of wood structures reduces GHG emissions [
54]. The large increase in PERT is due to the calculation background used in Oekobaudat: the sunlight absorbed by the trees is attributed to the wood as consumption of renewable energy.
The analysis also shows that, at BDL2, uncertainties are such that there are reinforced concrete building samples with lower GWP than some of the wood building samples. However, this overlap between the probabilistic results is located outside of the interquartile range. This means that the wood structure is highly likely to perform better in this indicator. For PENRT, the wood structure is still likely to perform better, but the overlaps between the two material options are greater than for GWP. For the indicator PERT, on the other hand, there are no overlaps. Therefore, any sample of the wood building will demand more PERT than any sample of the concrete building. However, PERT is still only roughly 26% of overall PE demand, compared to 12.5% for the concrete building. In other words, total PE demand of the wood building is 7% higher than of the concrete building.
The contribution of the building parts shifts accordingly (
Figure 5). The wood structure is responsible for 33% of GHG emissions instead of 50% for the case the reinforced concrete structure. The absolute results for other building parts stay the same, but their contribution increases as the total decreases. For PERT, the same applies reversely: the contribution of the structure doubles from 36% to 73%, reducing the relevance of all other building parts.
According to this analysis, the next step to minimize GHG emissions would be to look at other material options for the window frames. This is building-specific and has to be evaluated on a case-by-case basis.
3.4. Order of Magnitude and Validation
Since we are using a simplified model with only few materials, we verified the results with a more detailed LCA calculation based on the execution drawings of the case study. Additionally, we conducted a simplified LCA manually in order to verify the probabilistic calculation. This simplified calculation uses a fixed size of the building matching the mean input values and the same reduced number of materials as the probabilistic calculation. For the probabilistic calculation, mean values of the BDL4 calculation are shown, as these are the least uncertain. However, as described in
Section 3.2, mean values are consistent throughout the BDLs.
Table 4 shows the results of the simplified and probabilistic calculations in comparison to the detailed calculation based on the execution drawings. All values are rounded without digits. Hence, the sum of all contribution percentages can differ from 100%, as it does for PERT and PENRT simplified (99%) and PENRT detailed (99%). Simplified and probabilistic calculations generally deliver similar results differing by a maximum of −5% and +8%. This indicates that the probabilistic calculation is by far superior to a manual simplified calculation, as it can calculate 10
5 samples in less than one minute, a task that is virtually impossible for a traditional calculation by hand.
Compared to the detailed calculation, the probabilistic calculation underestimates GWP and PENRT by 27% and 30%, respectively, but does not differ significantly in PERT results. Therefore, we look at GWP and PENRT separately from PERT results. Generally, for GWP and PENRT, detailed results are at the high end of the value corridor of the BDL2 calculation shown in
Figure 3. This is to be expected as the probabilistic calculation neglects all finishes and small elements and therefore is restricted to a handful of materials, whereas the detailed calculation is based on 42 different materials. Hence, the absolute values of the calculation should not be used in the planning process, for example to determine compliance to certification benchmarks. Instead, the design process should be based on comparative analyses.
However, the contribution analysis, i.e., the indication of strategic building parts, differs by +5% (GWP) or −7% (PENRT) or less. The shares of structure and windows are slightly overestimated, the shares of insulation and internal underestimated. At the same time, the ranking of the building parts remains the same as in the detailed model for GWP. For PENRT, it indicates correctly the structure as the main contributor, but differs in the ranking of the other building parts, as their contributions are very close (21%, 21%, and 23%) in the detailed calculation. As guidance to the design team, the analysis shows correctly where the largest contribution and thereby the potentially largest reduction potential lies, as the probabilistic calculation matches the detailed calculation without uncertainties. This tendency of concrete structures to be the main contributor of GWP confirms results from previous studies [
55,
56].
For PERT, the overall result differs by a maximum of +5% (simplified calculation) and +2% (probabilistic calculation), but contribution differs by up to −5% and +9%, changing the ranking of building parts. The detailed calculation indicates that the structure offers the largest reduction potential, whereas the probabilistic and simplified calculations suggest the internal walls as the largest contributor. The underlying reason for this is the fact that the probabilistic calculation uses one material, gypsum board, for the interior walls; whereas the interior of the as-built building consists of a mixture of different wall types, e.g., glass partitions or masonry walls. Gypsum board demands about 10 times more renewable energy pro volume (m3) than masonry (2167 MJ vs. 263 MJ) but shows only roughly three times as much GWP. Hence, for a building part with an inhomogeneous mix of materials, the simplification to just one material can have a large influence on results. For building parts with fewer materials, like the building’s structure, where the bulk of the building part is made of one material, the probabilistic calculation should render accurate indications of their relevance within the building.
4. Discussion
Our results highlight the possibility of real-time life cycle analysis in early stages of design. Although the early stage analysis tends to underestimate the absolute values for PE demand and GHG emissions, valuable advice can be provided in two ways. First, the sensitivity analysis guides the designer towards the input parameters whose uncertainty causes the highest result uncertainties. Second, a contribution analysis reveals the strategic building parts where the potential is largest to reduce emissions and energy consumption.
The design team can use the results of the sensitivity analysis to reduce result uncertainties systematically by reducing the vagueness of the most relevant input parameters during the design process. Although reducing vagueness is a natural part of the detailing process, in a regular design process the design team is not aware of the impact on the precision of environmental analysis if an input parameter is detailed. Our analysis provides guidance toward which parameter’s uncertainty to reduce first to get a more precise indication of environmental impact. A previous study [
21] showed that this method can also applied to the entire life cycle including operational energy consumption. Future work should add other criteria (such as cost) and take into account the multi-criterial nature of decision processes in building design.
The contribution analysis shows the building parts contributing most to PE demand and GHG emissions hence revealing their theoretical reduction potential. In order to determine the reduction that can be realized, alternative materials need to be tested. We provided an example of this by replacing the concrete structure by a wood structure where possible. To integrate this trial-and-error process into a design assistance tool, a database containing alternatives for different materials and building parts needs to replace our simplified database containing only fixed materials. Hollberg et al. [
57] and Röck et al. [
58] employ a component catalogue to address this challenge showing the realizable reduction potential.
The contribution analysis works well for homogenous building parts, such as the structure, and confirms results from previous studies. On the other hand, the contribution analysis tends to skew results when building parts with a multitude of materials, such as the building’s interior, are concerned. One way to counteract this would be to subdivide the building into more parts but thereby losing the early design stage simplicity. In addition, this phenomenon relates to material uncertainties in early design stages, which were not included in this study, but are subject to current (e.g., Tecchio et al. [
51]) and future research.
For our early stage analysis, we considered three indicators. This represents a simplification from all 23 indicators available in Oekobaudat. However, the analysis shows that strategically reducing uncertainties in parallel for all three indicators is unachievable because result uncertainty for each indicator is dependent on input uncertainty of different parameters. This was to be expected regarding non-renewable and renewable energy, as increasing the use of renewable energy sources reduces non-renewable PE demand, i.e., these two indicators should inversely correlate. It is somewhat surprising that GWP and PENRT do not correlate, as the burning of fossil fuels, i.e., the use of PENRT, causes GHG emissions. In part, the fact that the chemical process of clinker production in the cement production process emits CO2 provides an explanation. For other materials than concrete, the reasons for the lack of correlation are less clear. Generally, this points to the fact that LCA results should not be reduced to one indicator, as none of the indicators can be regarded as representative for all others. Instead, decisions based on LCA results need to be treated as multi-criteria decisions.
To increase the completeness of results, more building materials will be implemented in our model. In order to achieve this, additional input parameters will have to be considered (e.g., concrete strength) and additional information (e.g., type of waterproofing) will have to be estimated. Additionally, the structural material types, reinforced concrete and wood, will be complemented by structural steel and hybrid structures. This has implications on the possible application of the method but does not change the methodological approach.
As shown in our previous work [
21], LCA is incomplete if it neglects the operational phase. Therefore, we direct future research efforts towards integrating all life cycle phases, which implies also including the building’s mechanical systems. We expect multiple interdependencies calling for a detailed sensitivity and contribution analysis in conjunction with a weighting system for results.


