1. Introduction
Water security is a major concern in many watersheds across the globe [
1]. Climate change and human-induced activities have made the issue of water scarcity even worse. Climate change/variability, coupled with the ever-increasing population and limited availability of freshwater, has added challenges in securing water for various uses; both human and environmental [
2]. Climate change has influenced freshwater systems and their management through impacts on water quantity, quality, and timing. Furthermore, climate-induced exacerbations of the hydrological cycle have increased or intensified the magnitude as well as the frequency of extreme weather events (e.g., floods and droughts), which may have contributed to the variation in the streamflow. As a consequence, it is increasing the concentration of pollutants, and sediment transport mechanism, endangering the aquatic life, and aggravating the spread of water-borne diseases. Human activities such as land use/cover changes and a concurrent increase in water withdrawals for various uses have reduced water availability. This trend worsens the issue of water scarcity in the future. Therefore, changes in freshwater availability, either due to climatic or human-induced factors, could impact the wellbeing of human societies through implications in multiple dimensions, such as social, economic, and environmental. Therefore, assessing alterations in water resources, their attributions, and implications are imperative to inform the design and implementation of strategies for safeguarding water and food security.
The assessment of variability in streamflow, an important component of the hydrological cycle, is likely to reflect impacts of climate change and land use/cover changes on the water resources systems. A large number of meso-scale and micro-scale parameters are responsible for changes in hydro-climatic variables at a basin [
3]. For example, population growth may lead to higher utilization of river water for human needs and subsequent decrease in streamflow, which could propel water scarcity in the region, if not managed properly. Similarly, land use/cover is one of such variable that may lead the changes in the circulation of moisture to the atmosphere through evapotranspiration, which would consequently affect rainfall and runoff characteristics, and thus, alter streamflow regimes, such as the baseflow, mean streamflow, and extreme events (magnitude, timing, and frequency) [
4].
The trend analysis in a hydro-climatic time-series, which can be either abrupt (a shift) or gradual (a trend) or their combinations, can provide some meaningful insights on the stationarity of the hydrological cycle in a watershed [
1]. Abrupt changes in hydrological time-series could be due to the shift in the climatic regime, induced by changes in local environment, influence of natural disasters, or human interventions [
5]. Such a change may influence the mean, median, variance, autocorrelation, or any other statistical aspect of the data [
6]. Streamflow measurements may exhibit variability for various reasons, such as climatic, topographical, land use/cover, and degree of streamflow regulation, among others. Therefore, an investigation on the degree of such changes at a watershed would provide a comprehensive understanding of runoff change mechanism [
7].
Streamflow alterations in the watersheds are associated with anthropogenic factors, such as irrigation intensification [
8], increase in water withdrawal for increasing population [
9], deforestation and sprawling urbanization leading to landscape alterations [
10], in addition to watershed-level climatic factors (e.g., air temperature, precipitation and relative humidity) [
11,
12]. Various methods are available and used widely to quantify abrupt (or shift or change point) and gradual (or monotonic) changes in streamflow time series. For the abrupt change, Pettit’s test [
13] and Standard Normal Homogeneity (SNH) test [
14] are generally applied by many studies [
1,
12,
15,
16]. For gradual or monotonic trends, parametric (as well as non-parametric) tests are used. However, Mann-Kendall (MK) test [
7] or modified MK test [
17], the rank-based non-parametric method, is widely used due to its applicability to data of any distribution and robustness against the interference to outliers. The method is applied in various geographical regions of the world—including Tapi basin in India [
1], Upper Huaihe basin in China [
7], four states in USA [
3], 26 river basins in Turkey [
18], and 33 hydrological stations in Nepal [
19]. The attribution of the alteration to the drivers (anthropogenic or climatic) can be made using statistical approaches, such as climate elasticity [
20] and double mass curve [
21,
22] as applied in many studies over the time like Jiang et al. [
23]; Zhu et al. [
7]; Wu et.al [
22], Sharma et.al [
1]. When many methods are available for trend analysis or attribution of changes in streamflow, using multiple methods, where feasible, are valuable to avoid possible limitation and uncertainty by the individual method [
12].
Each watershed is unique in its characteristics and the hydrological phenomenon. The fundamental science that derives hydrological processes are of course the same—however, extent of implications on streamflow alterations are expected to be different given their unique biophysical, climatic, social, and development characteristics. This paper attempts to detect the long-term changes in streamflow, their quantitative attribution to climatic and anthropogenic roots, and assess socio-economic implications in a non-snow-fed Extended East Rapti (EER) watershed located in Central-Southern Nepal (
Figure 1), for which such information are not available for informed decision-making. Key research questions that the study aims to address are: (i) What are trends in rainfall and streamflow in the EER watershed? (ii) What are relative contributions of rainfall variability and anthropogenic activities towards streamflow changes? Finally, (iii) what are potential socio-environmental implications of streamflow alterations in the watershed?
2. Study Area
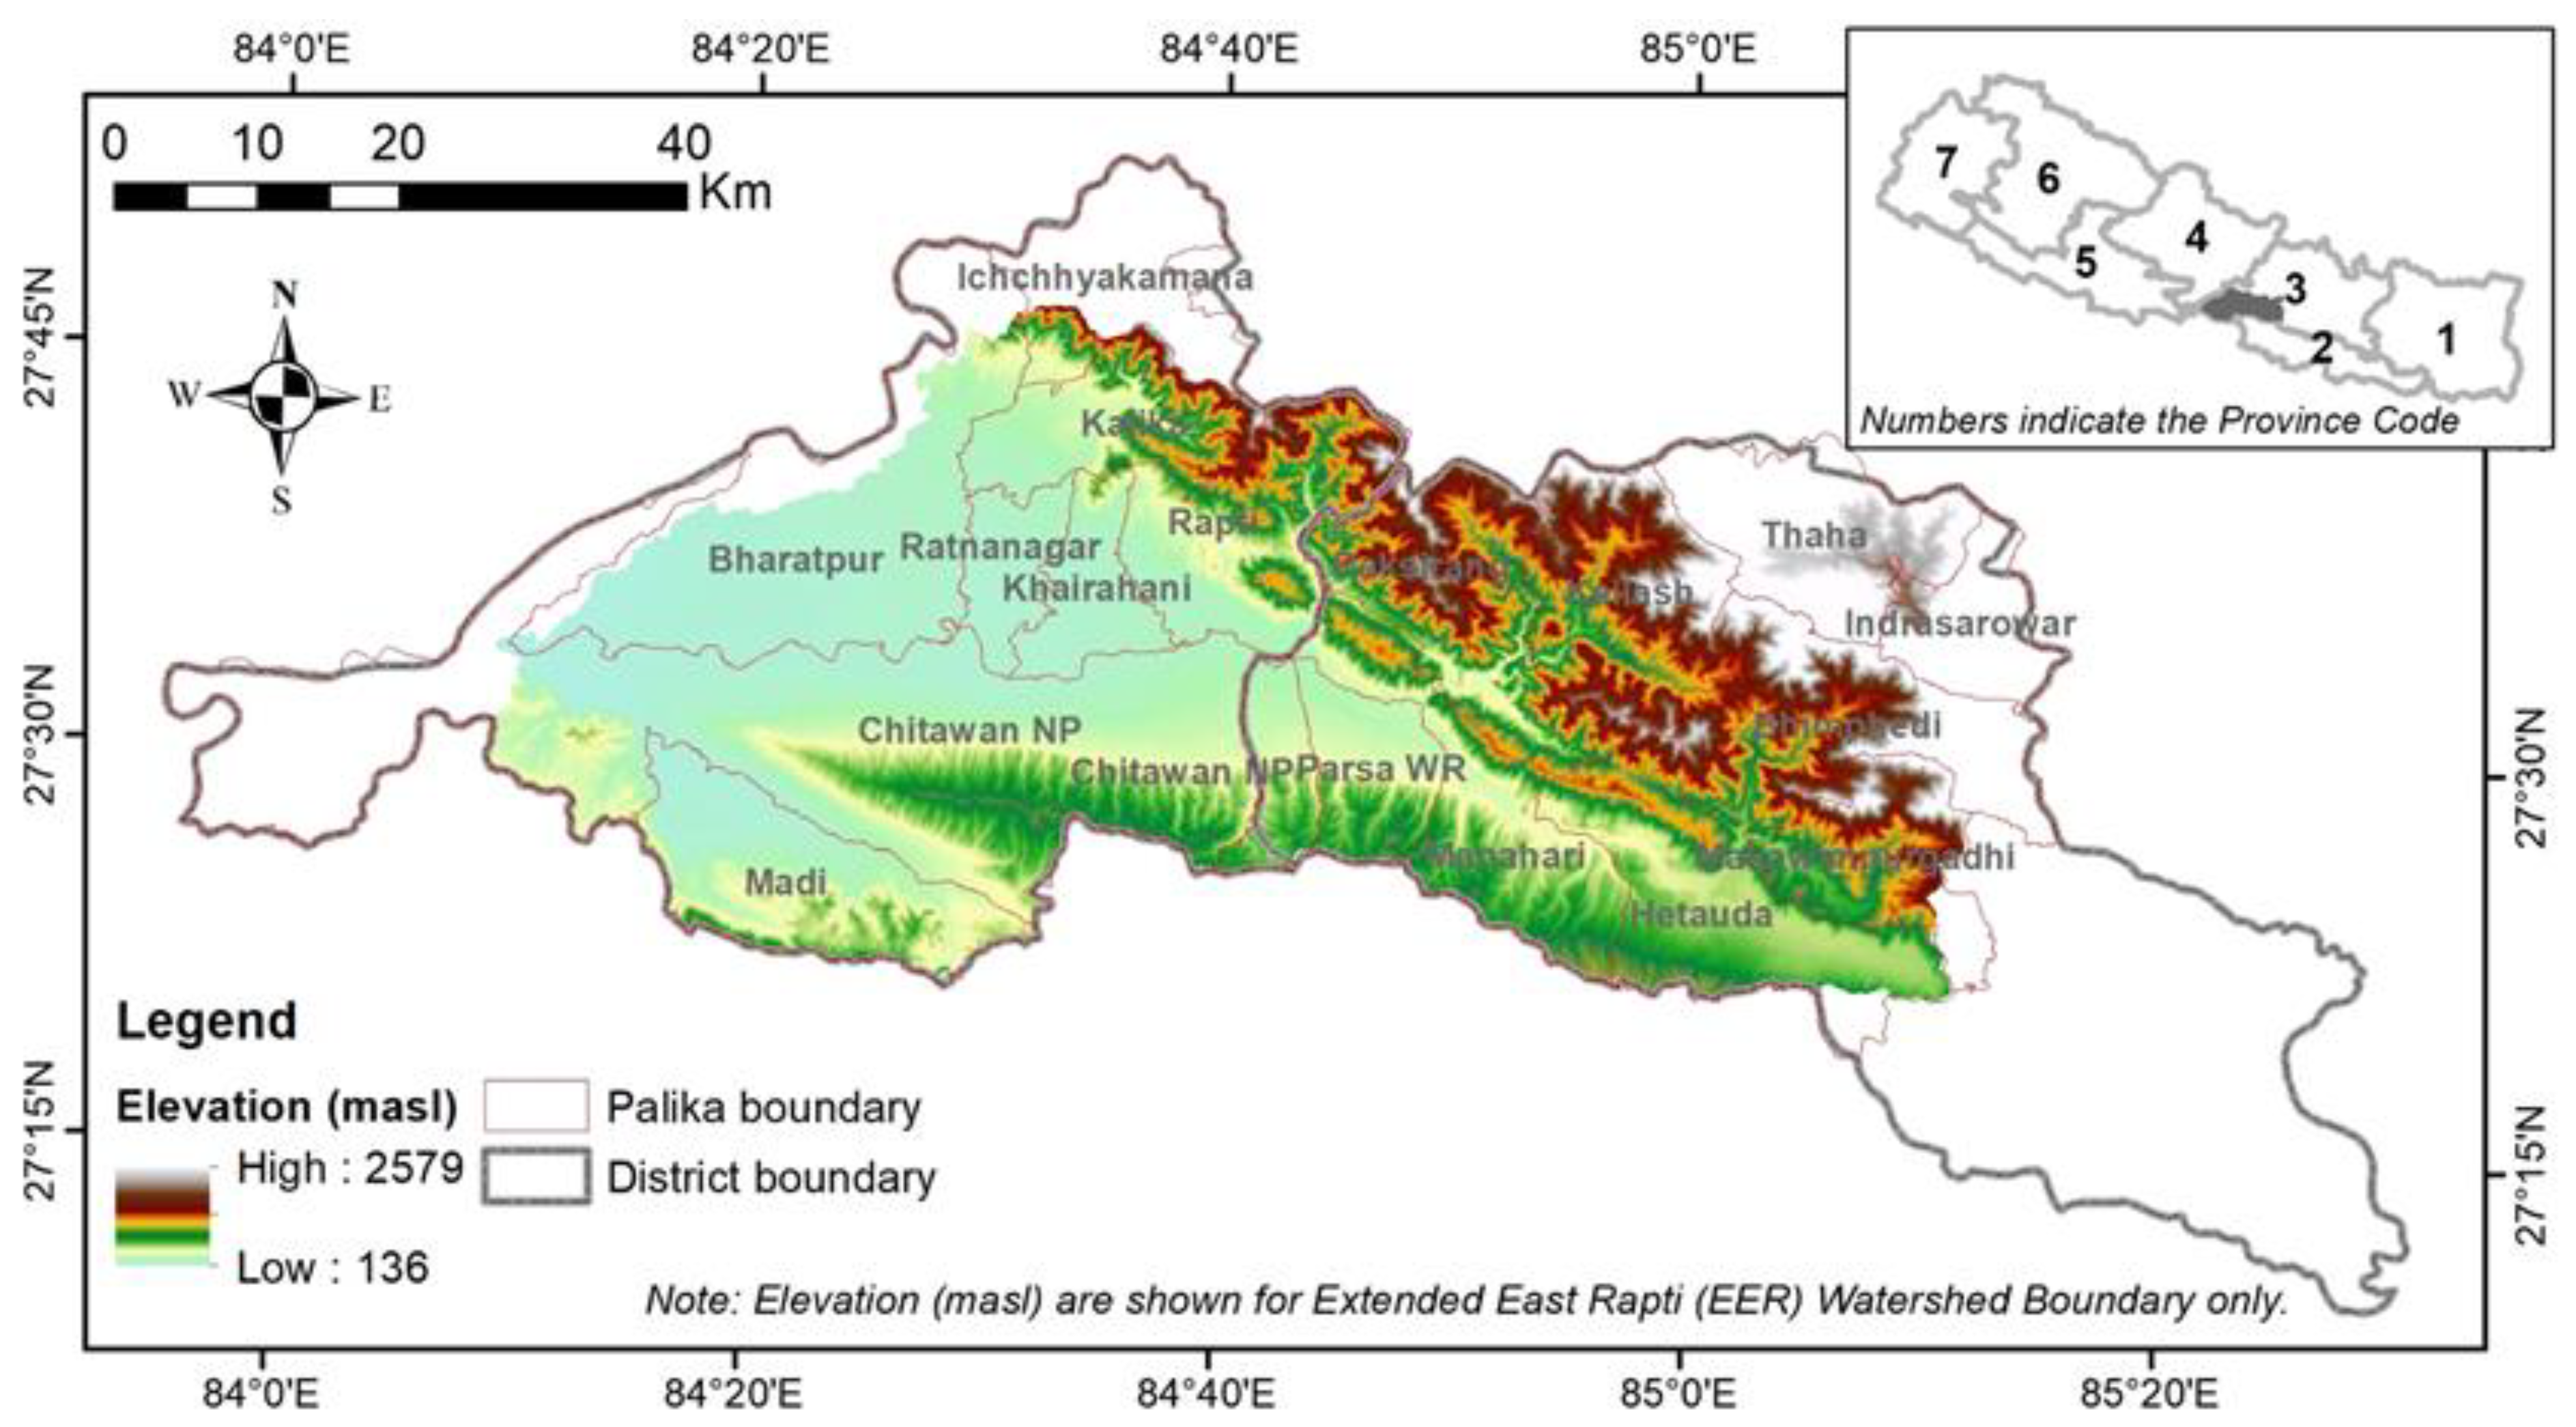
The EER watershed located in Province-3 in central-southern Nepal extends from 84.148° E to 85.206° E longitude and 27.353° N to 27.783° N latitude, (
Figure 1). The total catchment area of 3202 km
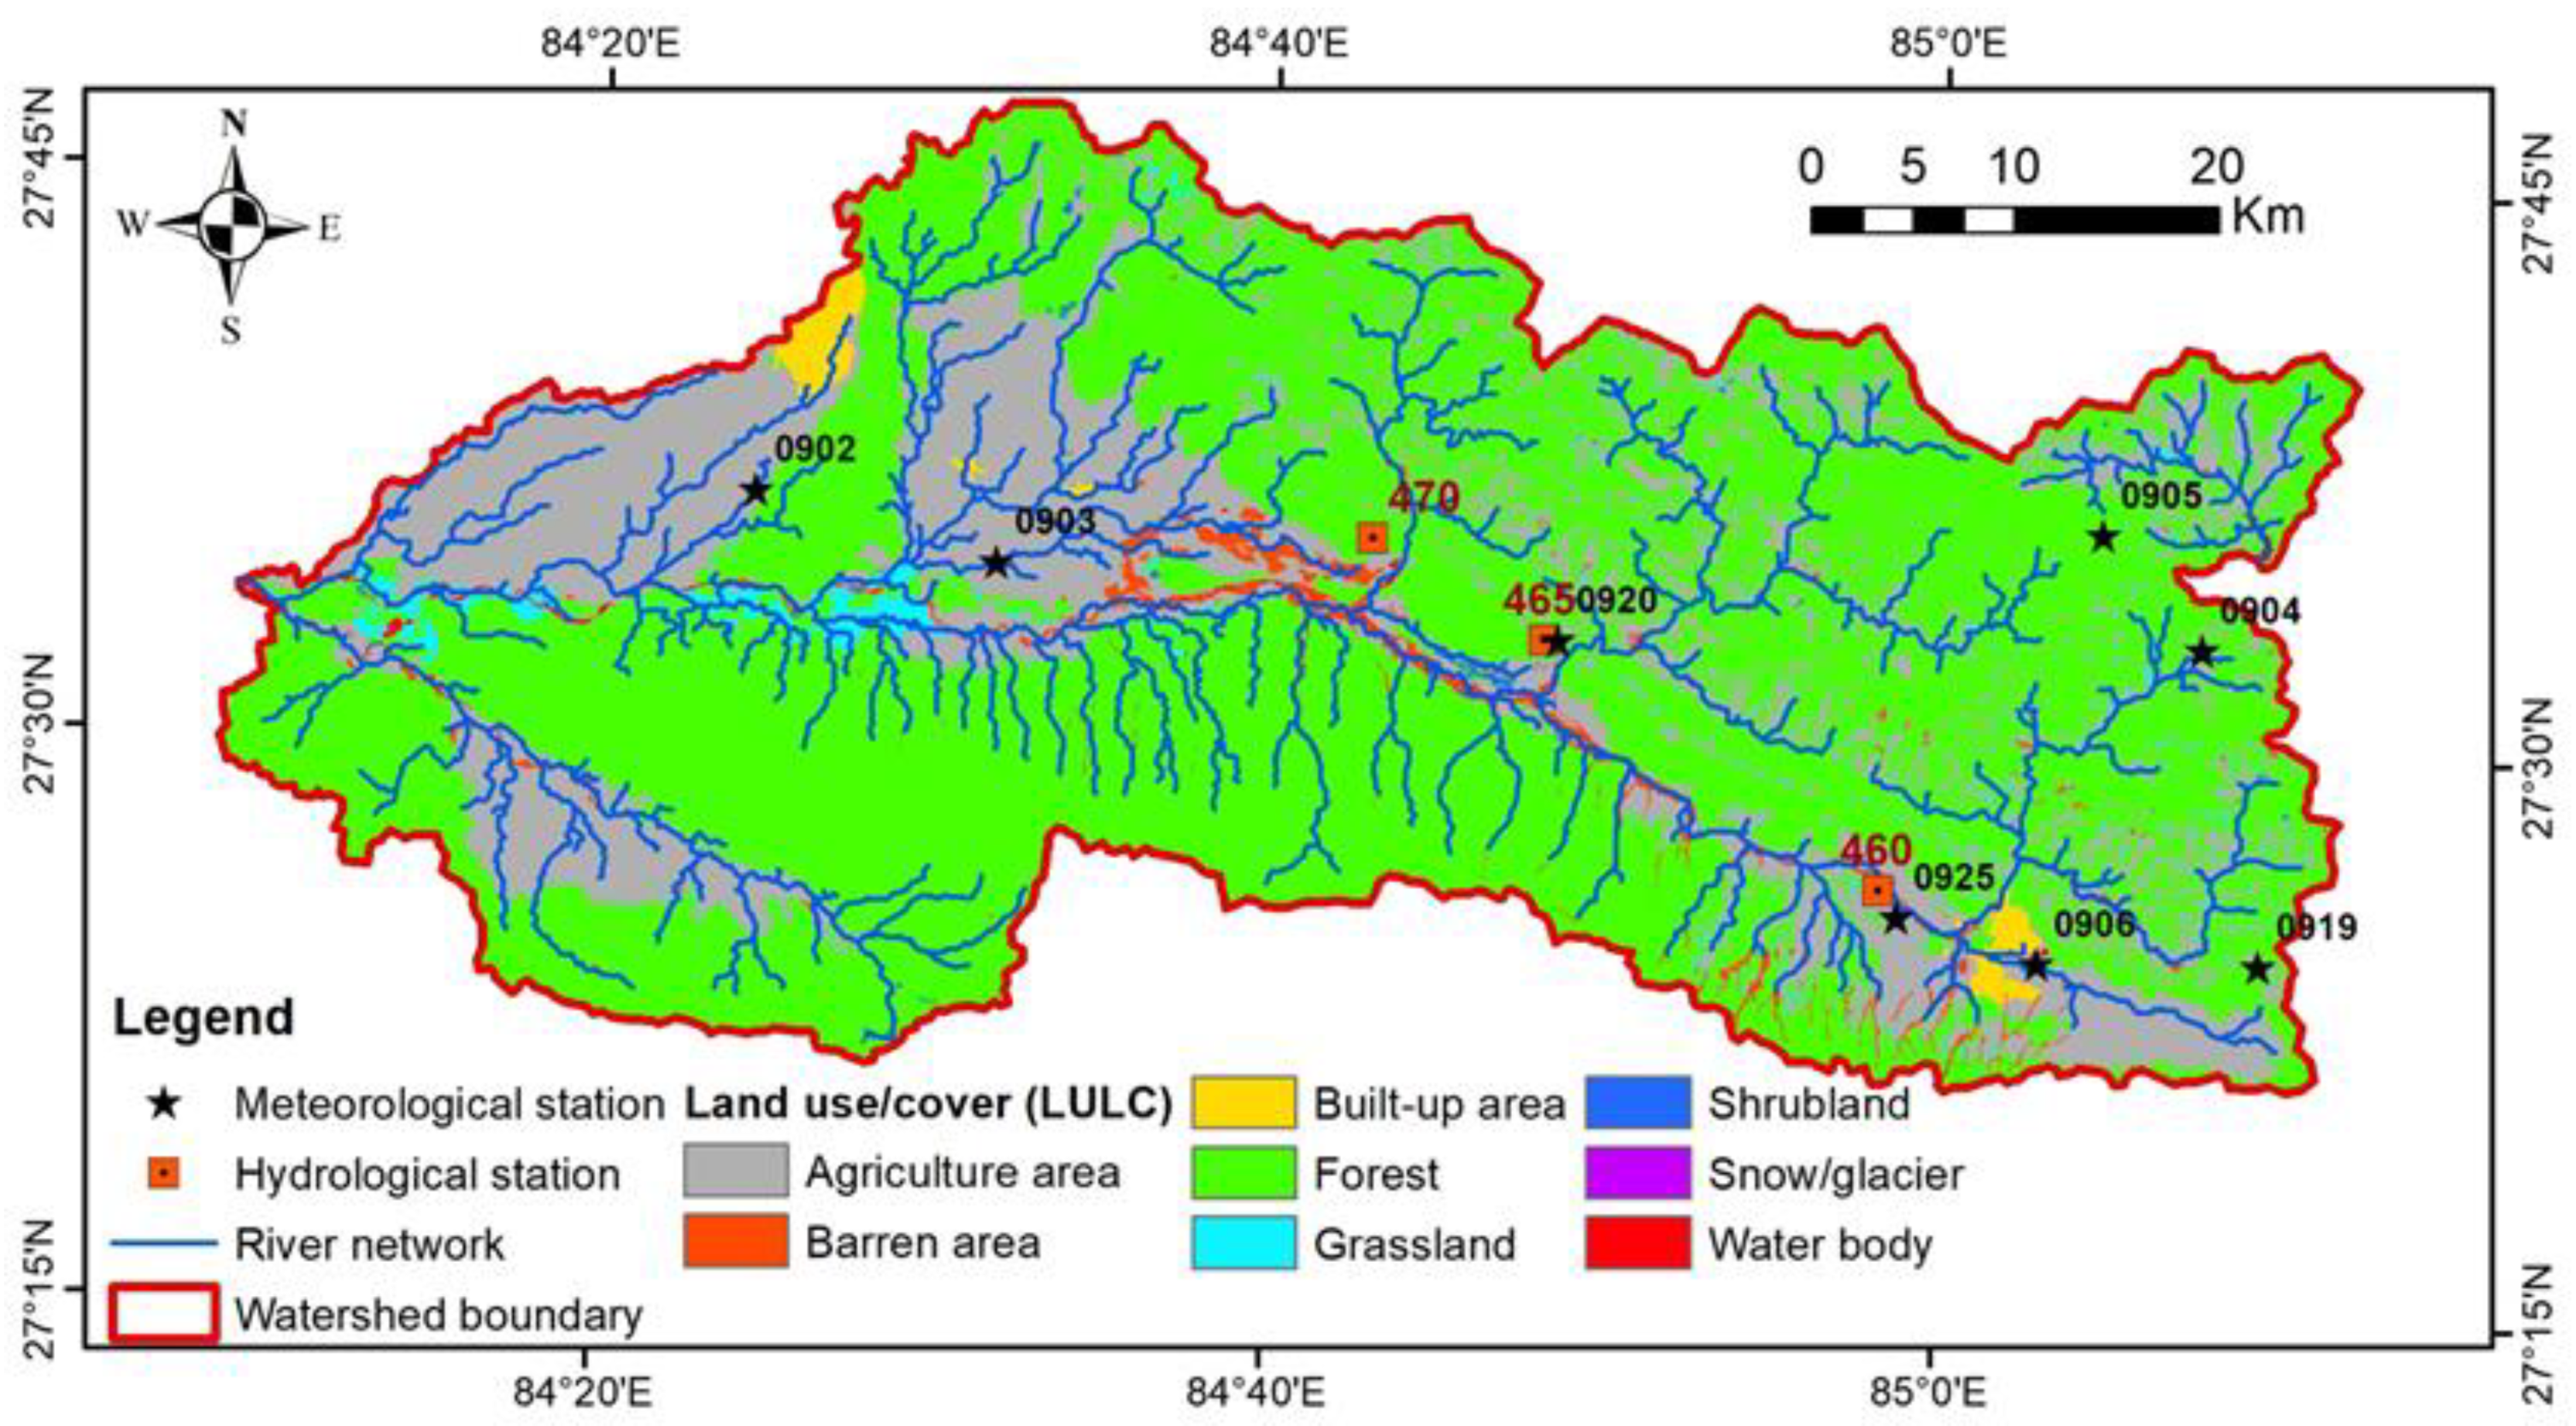
2 above the confluence with Narayani, and including Kulekhani watershed extends over two districts, 15 Palikas (i.e., new local government units in federal Nepal), the Chitwan National Park and the Parsa Wildlife Reserve. The topography of the watershed varies from 136 to 2579 m above the mean sea level (masl). About 29.5% of the watershed area falls in the Hill and the remaining 70.5% in the Siwalik. The EER watershed has a dominance of forest (65.5%) and agricultural area (28.8%), followed by barren and grassland areas (2.1% each), built-up area (0.9%), waterbody (0.4%) and shrubland (0.2%) (
Figure 2). There are two hydrological stations and eight meteorological stations in the watershed (
Figure 2); two of the meteorological stations (Station-902 at Rampur and Station-905 at Daman) are climatic stations. Details of the hydro-meteorological stations in the study area are provided in
Table 1.
Average annual rainfall in the EER watershed, based on data at eight meteorological stations, vary from 1750 mm (at st905, Daman, Elevation = 2312 masl) to 2365 mm (at st906, Hetauda NFI, Elevation = 474 masl) (
Table 1). Analysis of rainfall at Rampur (Station Inde = 902) shows strong seasonality in the rainfall, with about 80% of the average annual rainfall is available only during four rainy months (June-August). Similarly, average monthly maximum temperature (Tmax) in the EER watershed varies from 22.0 °C in January to 35.9 °C in June, whereas average monthly minimum temperature (Tmin) varies from 7.7 °C in January to 25.4 °C in August.
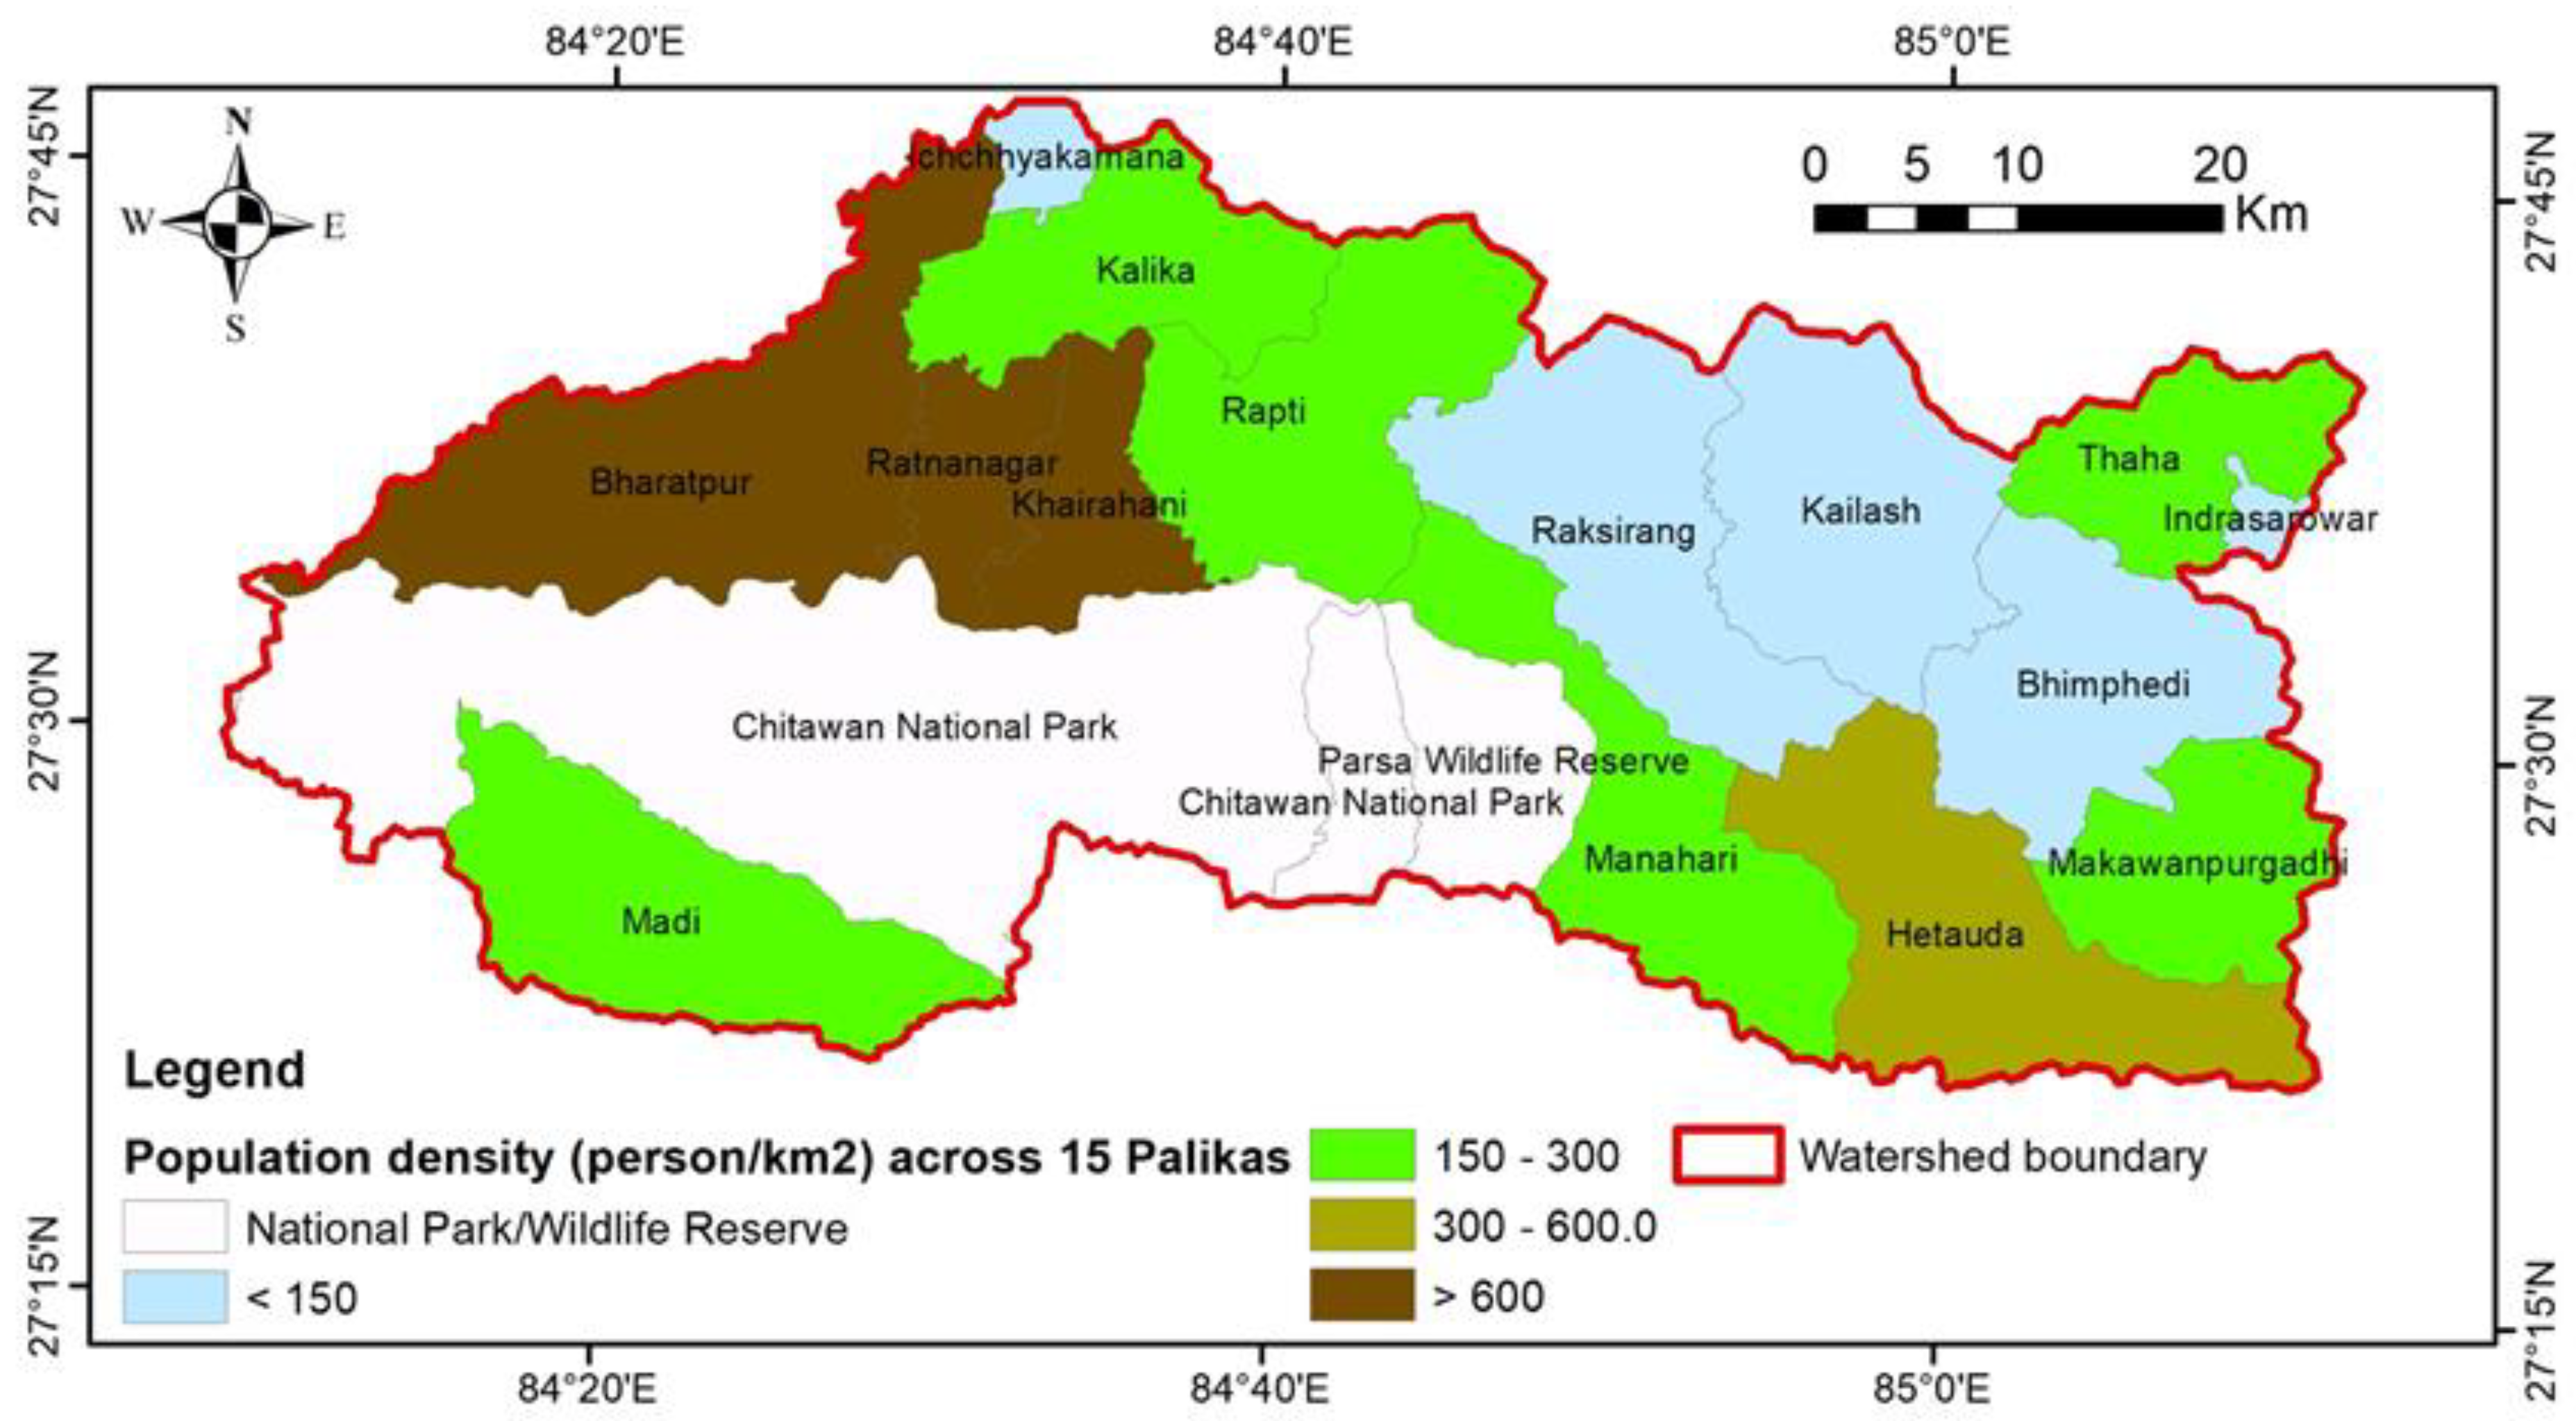
About 843.5 thousand people, with 51.01% female, are residing within the EER watershed. The population density varies across Palikas, with higher population density in the two large urban centers, such as Hetauda Sub-Metropolitan city and nearby areas, and Bharatpur Metropolitan City (
Figure 3). Hetauda and Bharatpur accounts for 44.7% of the total population in the EER watershed.
3. Methods and Data
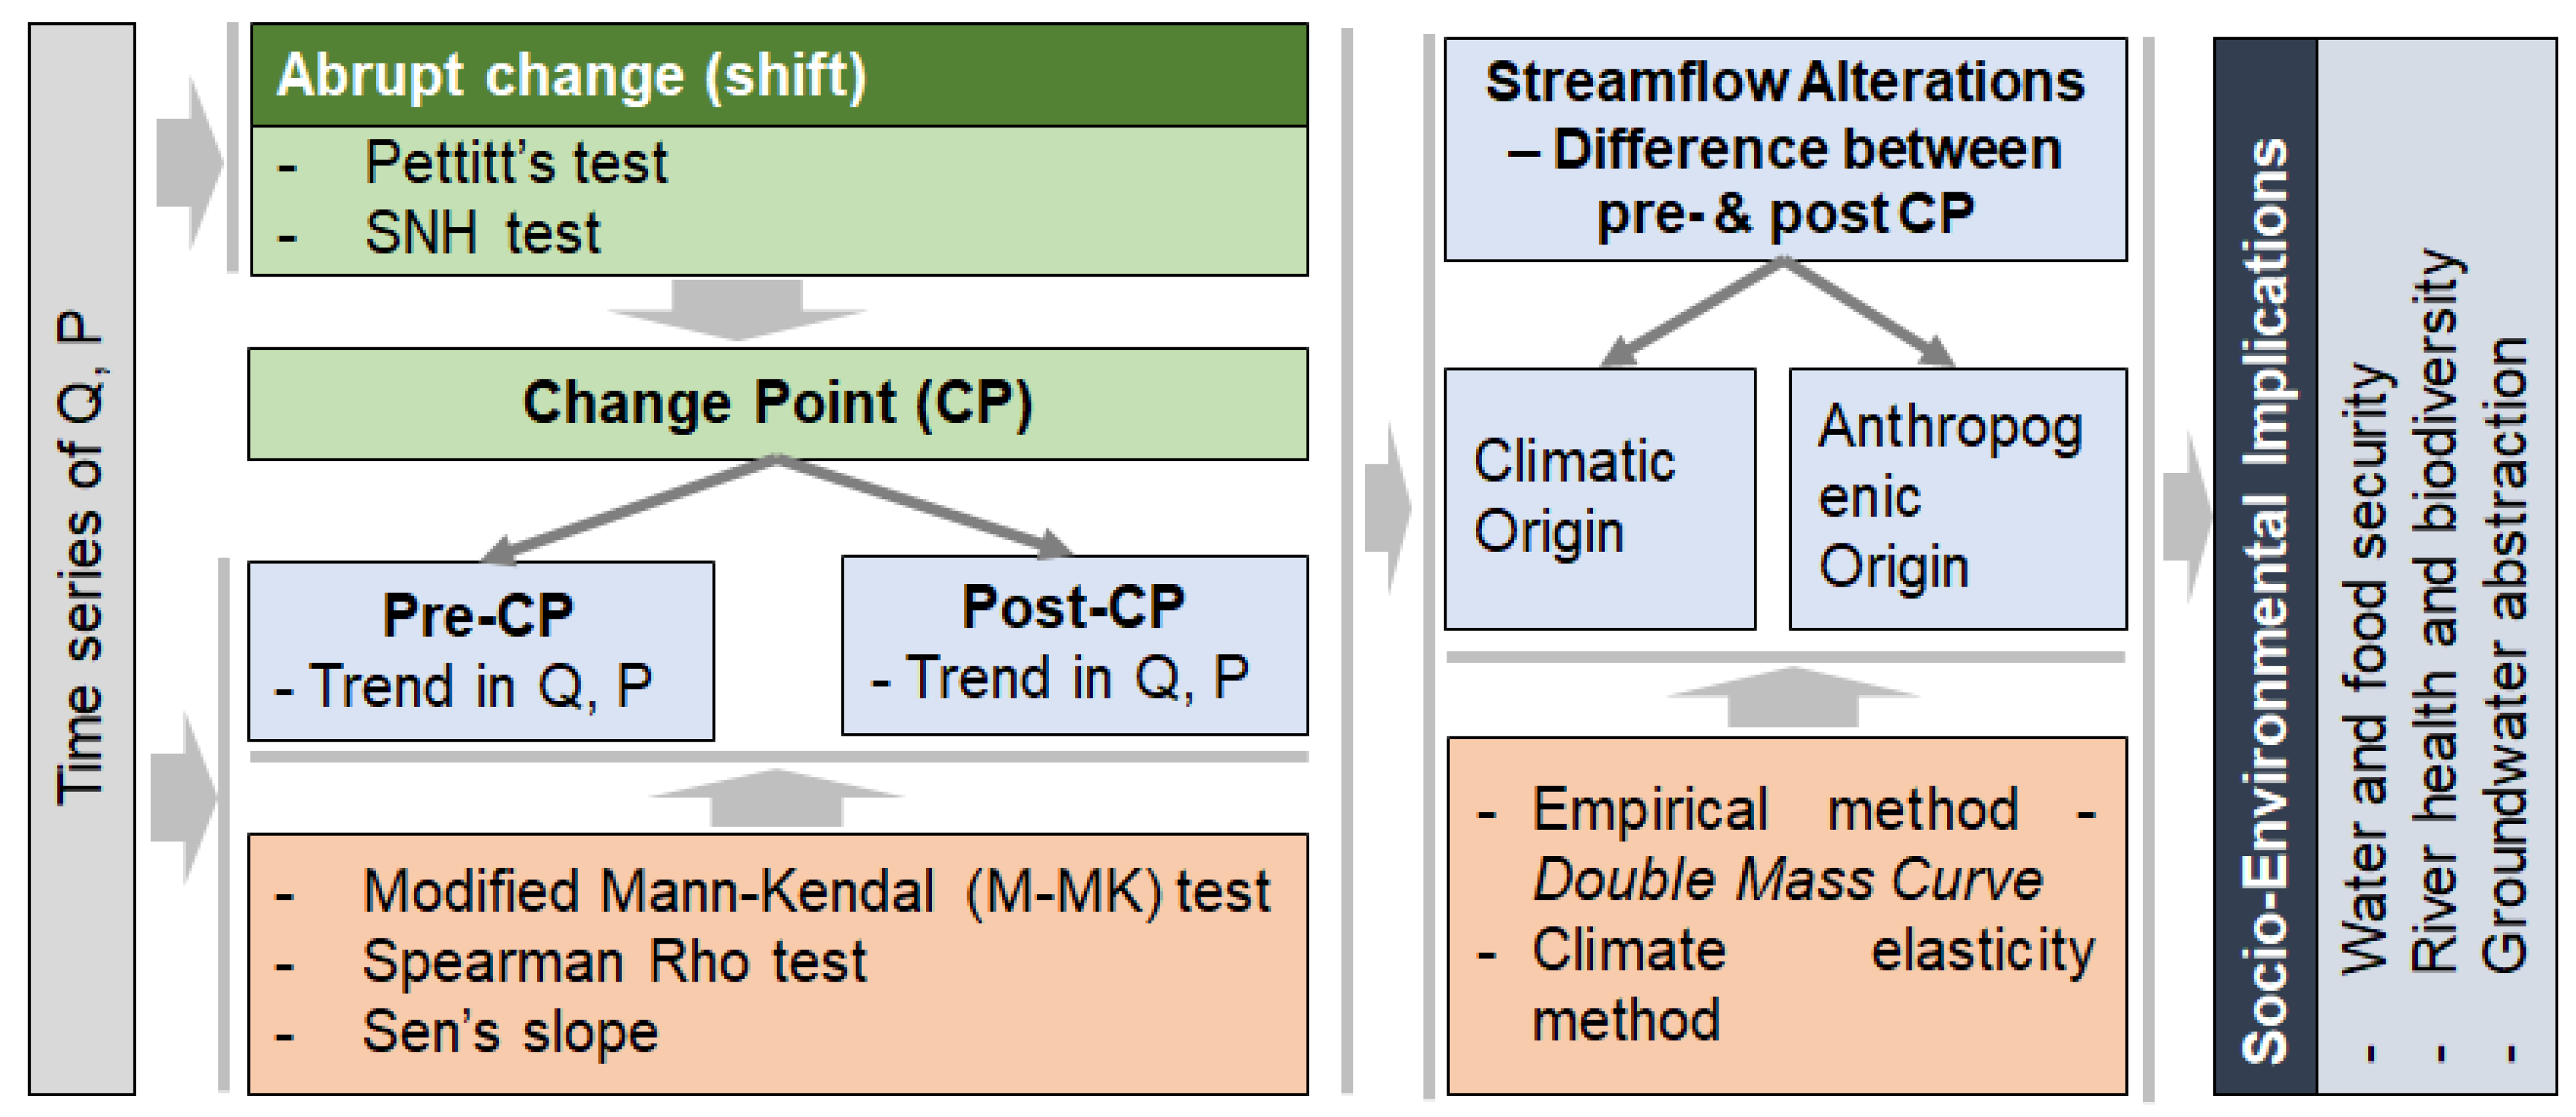
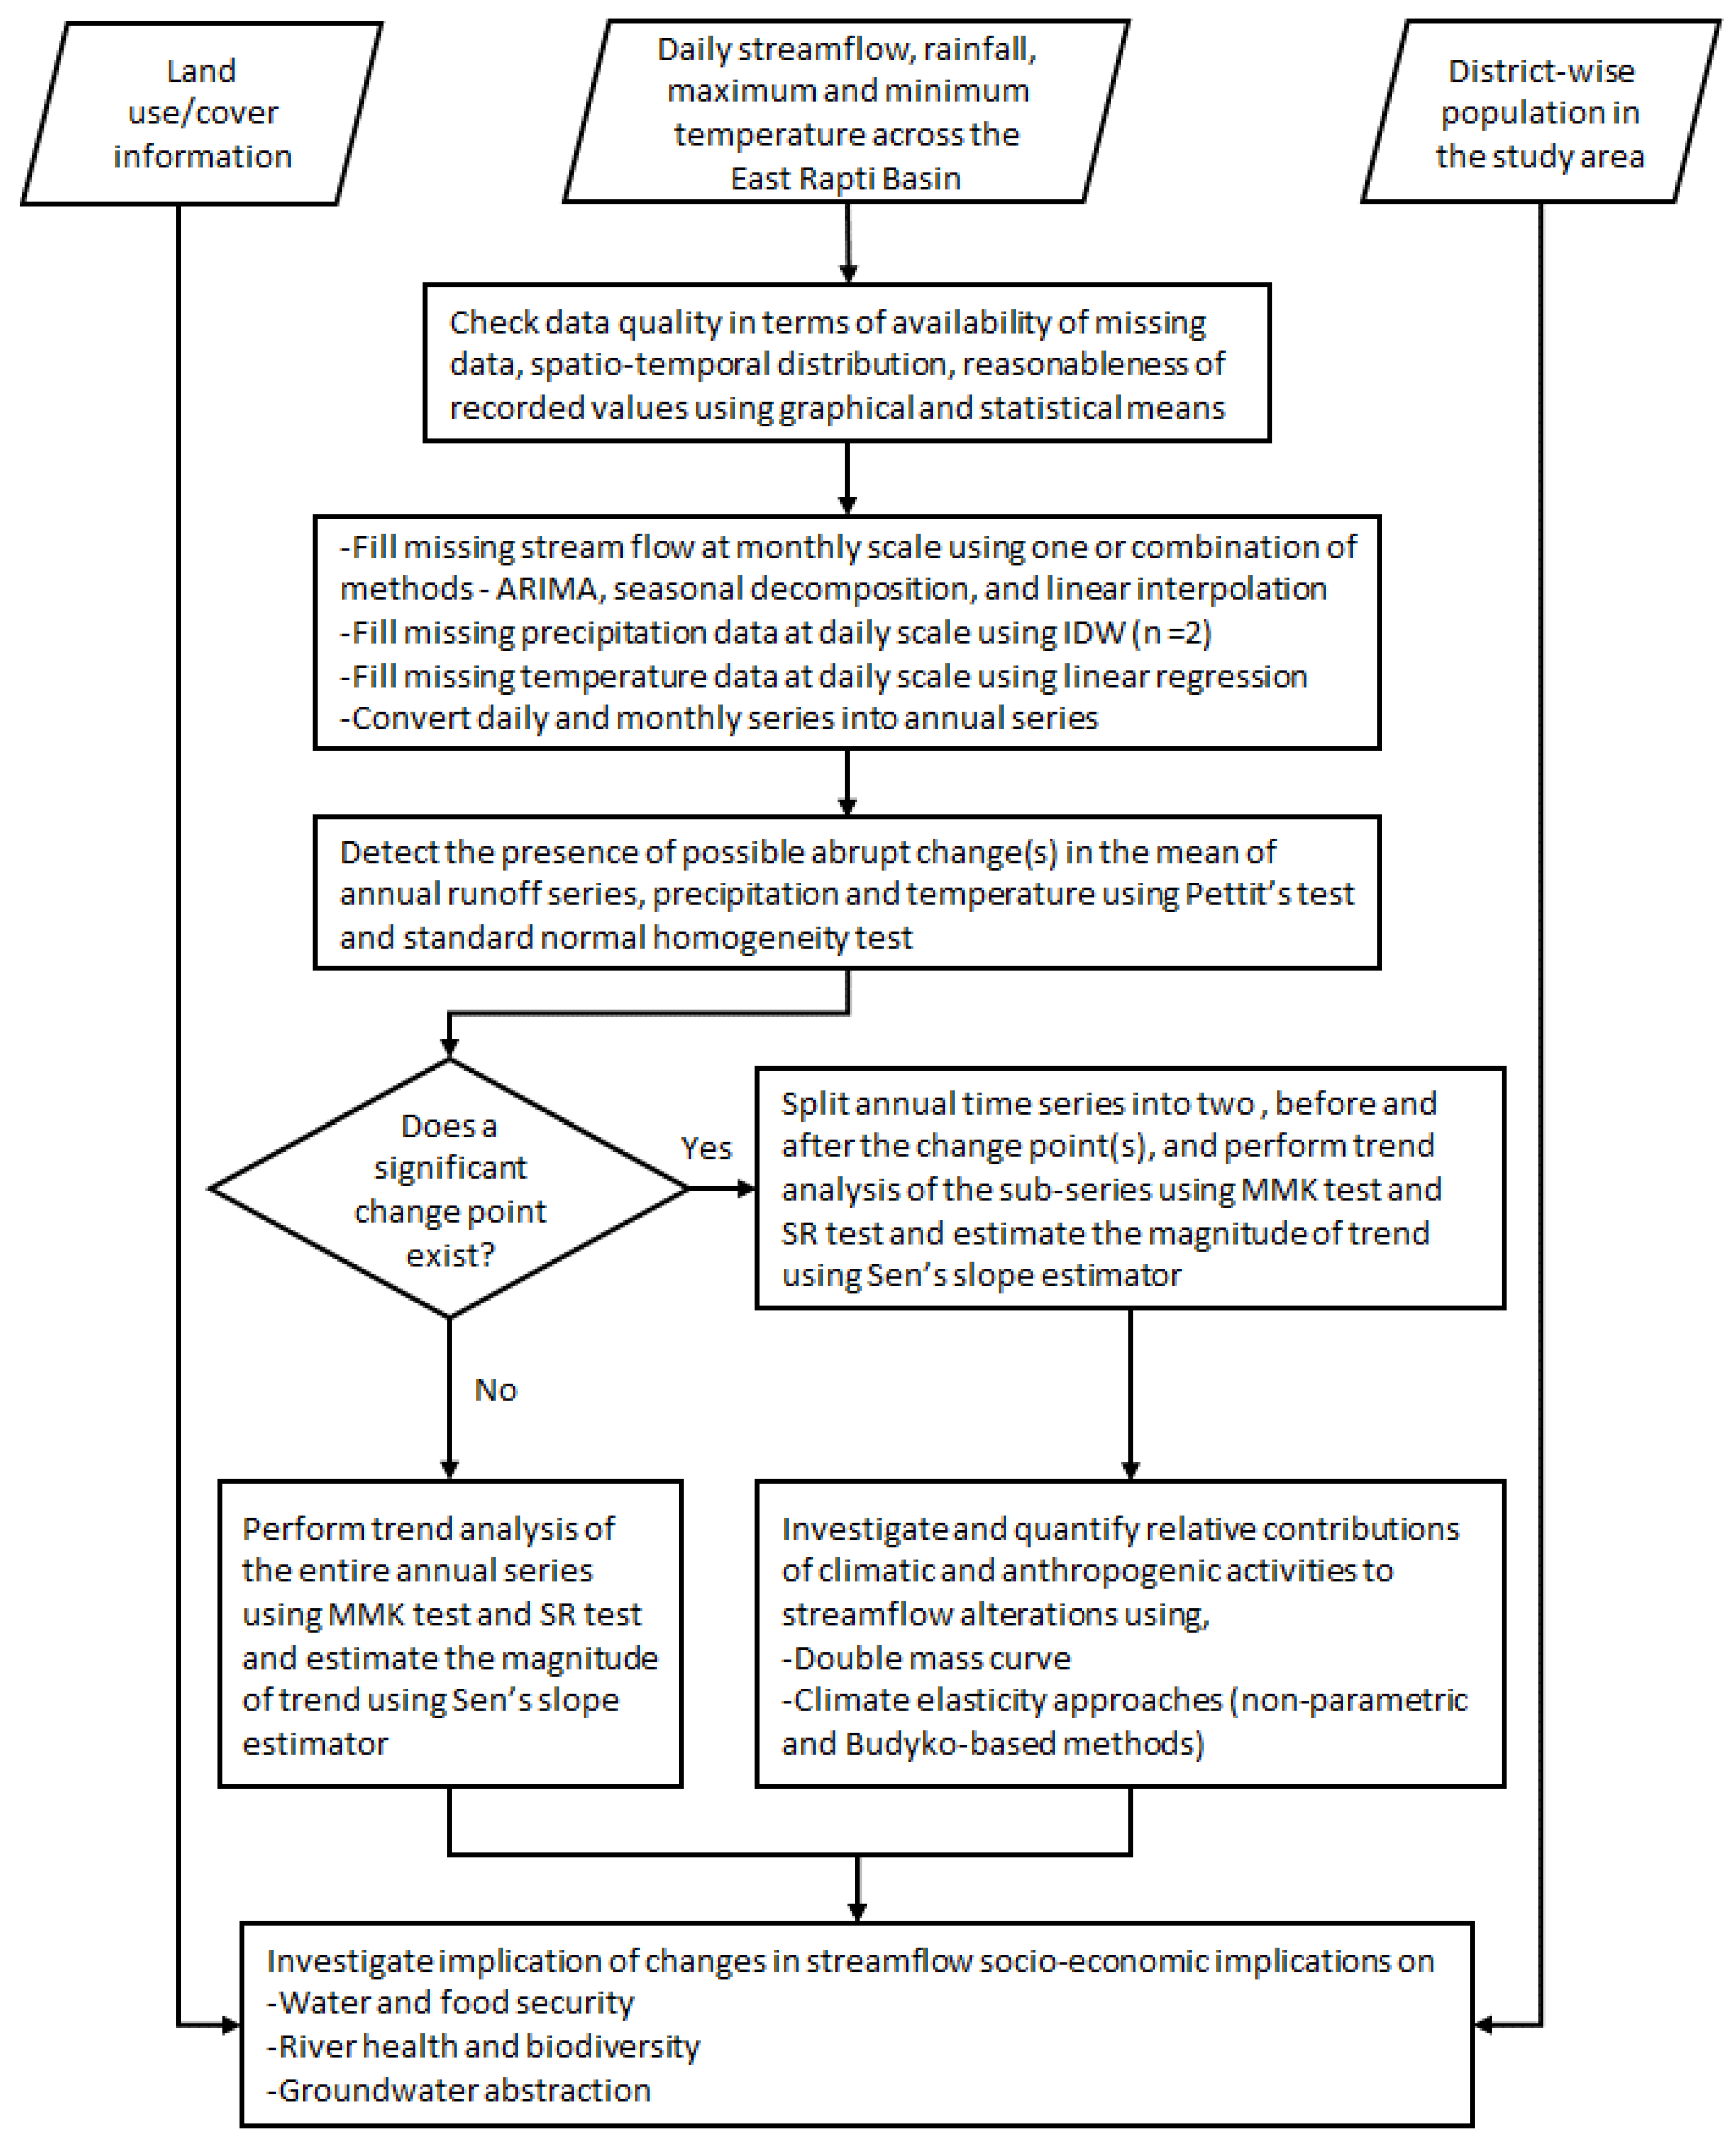
The study followed the methodological framework depicted in
Figure 4, and the steps are detailed as a flow chart in
Figure 5. Daily rainfall and streamflow at eight and three stations, respectively, are considered in the analysis. Key aspects of methodology, as shown in
Figure 4, are described in the following subsections.
3.1. Data Collection, Screening and Pre-Processing
Observed daily time series or streamflow at three stations and rainfall at eight stations were collected as secondary data (
Table 2) from the Department of Hydrology and Meteorology (DHM), the government of Nepal. Data quality were assessed in terms of missing data and their distribution/concentration, and the reasonableness of recorded values. Data reading, hydrograph/hyetographs for different temporal scales, plot of mass curves, and comparison of means were used as an approach for assessing data quality. Finally, quality controlled data set was prepared for further analysis. Details of hydro-meteorological stations, data availability, and their characteristics, are shown in
Table 1 and
Table 2.
In addition to the observed hydrological and rainfall data, population and land use/cover were also collected, as mentioned in
Table 2. Population data were collected from Village Development Committee (VDC) (or Palika) and then aggregated for the watershed level to estimate the basin-average population.
Annual time-series of streamflow and basin-average rainfall were generated based on daily time-series. Thiessen Polygon method was adopted for generating basin-average rainfall. Basic statistics, such as mean, median, range, quartile ranges, and coefficient of variation were calculated and analyzed for both streamflow and rainfall time-series to investigate heterogeneity in rainfall and streamflow behavior.
3.2. Dealing with Missing Data
The status of missing data in hydrological and precipitation time series is indicated in
Table 2. Missing discharge data were filled using ‘imputeTS’ package in R [
25]. One or combination of four methods—Kalman Smoothing, ARIMA, seasonal decomposition, and linear interpolation—depending upon their performance, were used for filling missing data for each of the three series. The method that resulted in positive discharge for the station of interest was used—therefore, methods varied as per station. For instance, at station 470, ARIMA method yielded negative discharges. Seasonal decomposition gave similar results but with few negative values on low flows month, whereas linear was not good in filling 2006 data. Hence, seasonal decomposition was chosen, but negative values were set to value of the preceding month. At station 465, except linear interpolation all other yield negative results. For station 460, ARIMA approach performed well over other methods. In the case of precipitation data, missing daily data were imputed using Inverse Weighted Distance (IDW) interpolation at daily scale with a power factor of 2.
3.3. Detection of Abrupt Shift and Gradual Shift (or Trends)
A number of studies have used change point problem in streamflow analysis for identification of time point where anthropogenic activities started to have significant alterations in magnitude of flow over the natural changes [
1,
22,
26,
27]. Basically, the process involves detection of an abrupt change point from an analysis of the statistical characteristics of a long-term hydrological series, and then further analysis like quantification of climatic and anthropogenic influences to streamflow is carried out for before and after change point series. Statistical tests, such as Pettitt’s test and standard normal homogeneity (SNH) tests, are generally carried out to detect change point. Pettitt test has the advantage of being non-parametric where the assumption of the prior distribution of data is relaxed [
13]. SNH test assumes a normal distribution of data [
28]. Wu et al. [
22] carried out Pettitt’s test to detect an abrupt change point for observed runoff from the Yanhe River basin in China during the period 1972–2011, where after 1996, climate change played a dominant role in the decline in the runoff from the basin. Likewise, a study by Sharma et al. [
1] also used Pettitt’s test, and attributed the decline in streamflow in Tapi River Basin, India to anthropogenic activities, such as changes in the land use patterns at different points of time in different tributaries of Tapi River. Likewise, SNH test has been applied to test the artificial and natural homogeneity of the average annual discharge for eight hydrological stations in the Kupa River Basin, between Slovenia and Croatia [
29]. It has also been used to carry a homogeneity analysis of precipitation in Iran [
30]. Due to successful application of abrupt change point method in various studies as mentioned, in this study we adopted Pettitt’s test together with SNH test [
13,
14,
28] to detect abrupt change (or shift) in the mean of annual runoff, precipitation and temperature time series Both of these methods have been applied in order to complement each other and reinforce the analysis. The significance of the detected change point is determined using a Mann-Whitney U test [
31]. Details of the method are provided in
Appendix A. Data for the period of 1963–2017 was used. In the case of existence of significant change point, entire time-series was split into two, and the gradual trend was analyzed for two sub-series, before and after the change point. In the case of non-existence of significant change point, gradual shift (or trend) analysis was performed on the entire time series.
Presence of trends in streamflow time series was analyzed using non-parametric Modified Mann-Kendall (M-MK) [
17], Spearman’s Rho [
32] and Sen’s slope estimator [
33] tests. Mann-Kendall test and Modified Mann-Kendall tests are widely used for the analysis of trends in climatic and hydrological time series [
17]. Mann-Kendall test is non-parametric in nature, however it suffers from bias introduced by autocorrelation in nature. The M-MK test addresses this issue by accounting for the presence of autocorrelation in the data in addition to other advantages from the original MK test. Spearman’s Rho test, which is also non-parametric is a rank-based approach like M-MK. These tests are, therefore, not affected by distribution nature and are relatively insensitive to outliers. The magnitude of the trend was estimated using Sen’s slope estimator. The significance of the detected trend was evaluated using Spearman’s Rho test. For this study, like other similar studies on streamflow and climatic series (such as Pirnia et al. [
34], Zhu et al. [
7], Zhang et al. [
35], Zhang et al. [
36], Partal and Kahya [
37]), the methods mentioned above were used though there are other approaches like segmented regression analysis, which also deals with analyzing trend of time series having change points [
38]). Details on these methods are provided in
Appendix A.
Furthermore, temporal trends in rainfall time-series were also performed using the same approach as used for streamflow. Spatial variation of trends in annual rainfall and runoff across the study watershed was analyzed in ArcGIS. It was basically done for rainfall data, as there was a good spatial representation of rainfall data compared to runoff data.
3.4. Attribution of Streamflow Alterations to Climatic and Anthropogenic Sources
The generic concept for this attribution is that for the catchments with streamflow not subject to any regulation, it can be modelled as a function of climatic variables and catchment characteristics. Furthermore, human factors are assumed to be independent of climatic factors. Therefore, the total change in the streamflow (ΔQ) can be expressed as a sum of ΔQ
P and ΔQ
H [
22], where subscripts P and H stands for changes in streamflow, due to rainfall variability and anthropogenic (or human) activities, respectively. We also follow the approach used by Wu et al. [
22] for estimating attribution of streamflow changes to climate and anthropogenic changes.
At the local scale, changes in climatic variables are independent to the human behavior shaping catchment characteristic. In the absence of any hydro-regulation, the streamflow response of a catchment can be modelled as a function of climatic variables and catchment characteristics [
1]. Here, we have defined the base period (before 1990) and variation period (after 1990). Therefore, the total change in the streamflow over these two periods can be expressed as a sum of changes in streamflow, due to climatic variability and anthropogenic activities [
1,
22]. They are expressed as:
Here, is the total change in the mean annual runoff between the variation period, , and the baseline period, . and are the changes in the mean annual runoff caused by climatic variability/change and human activities, respectively. and are the contributions from climate variability/change and anthropogenic factors, respectively, on the runoff variation. Methods like empirical statistics (double mass curve) and elasticity-based can be applied in estimating and .
In this study, we also applied statistical approaches, such as climate elasticity [
20] and double mass curve [
21,
22]. Their details are provided in
Appendix A. After attribution to the streamflow alterations, we further discussed the linkage of attribution to changes in land use/cover and population in the study watershed.
3.5. Assessing Socio-Environmental Implications
Streamflow alterations and associated changes in water availability are linked to various aspects of society and environment; therefore, changes in streamflow is expected to have implications in the socio-environmental system. Based on the understanding of the relative contribution of rainfall variability and anthropogenic activities in streamflow changes, necessary secondary data, as well as qualitative information, were collected from various sources, including field studies commissioned during August to October, 2019. The implications were discussed from following three perspectives, which were identified as relevant for the study watersheds after field study: (i) Water and food security; (ii) river health and aquatic biodiversity; and (iii) groundwater abstraction.
5. Conclusions
This study, regarding the Extended East Rapti (EER) watershed in central-southern Nepal, evaluated trends in rainfall and streamflow, estimated relative contributions of rainfall variability and anthropogenic activities towards streamflow changes, and discussed potential socio-environmental implications of the streamflow alterations. Key conclusions from the analysis are:
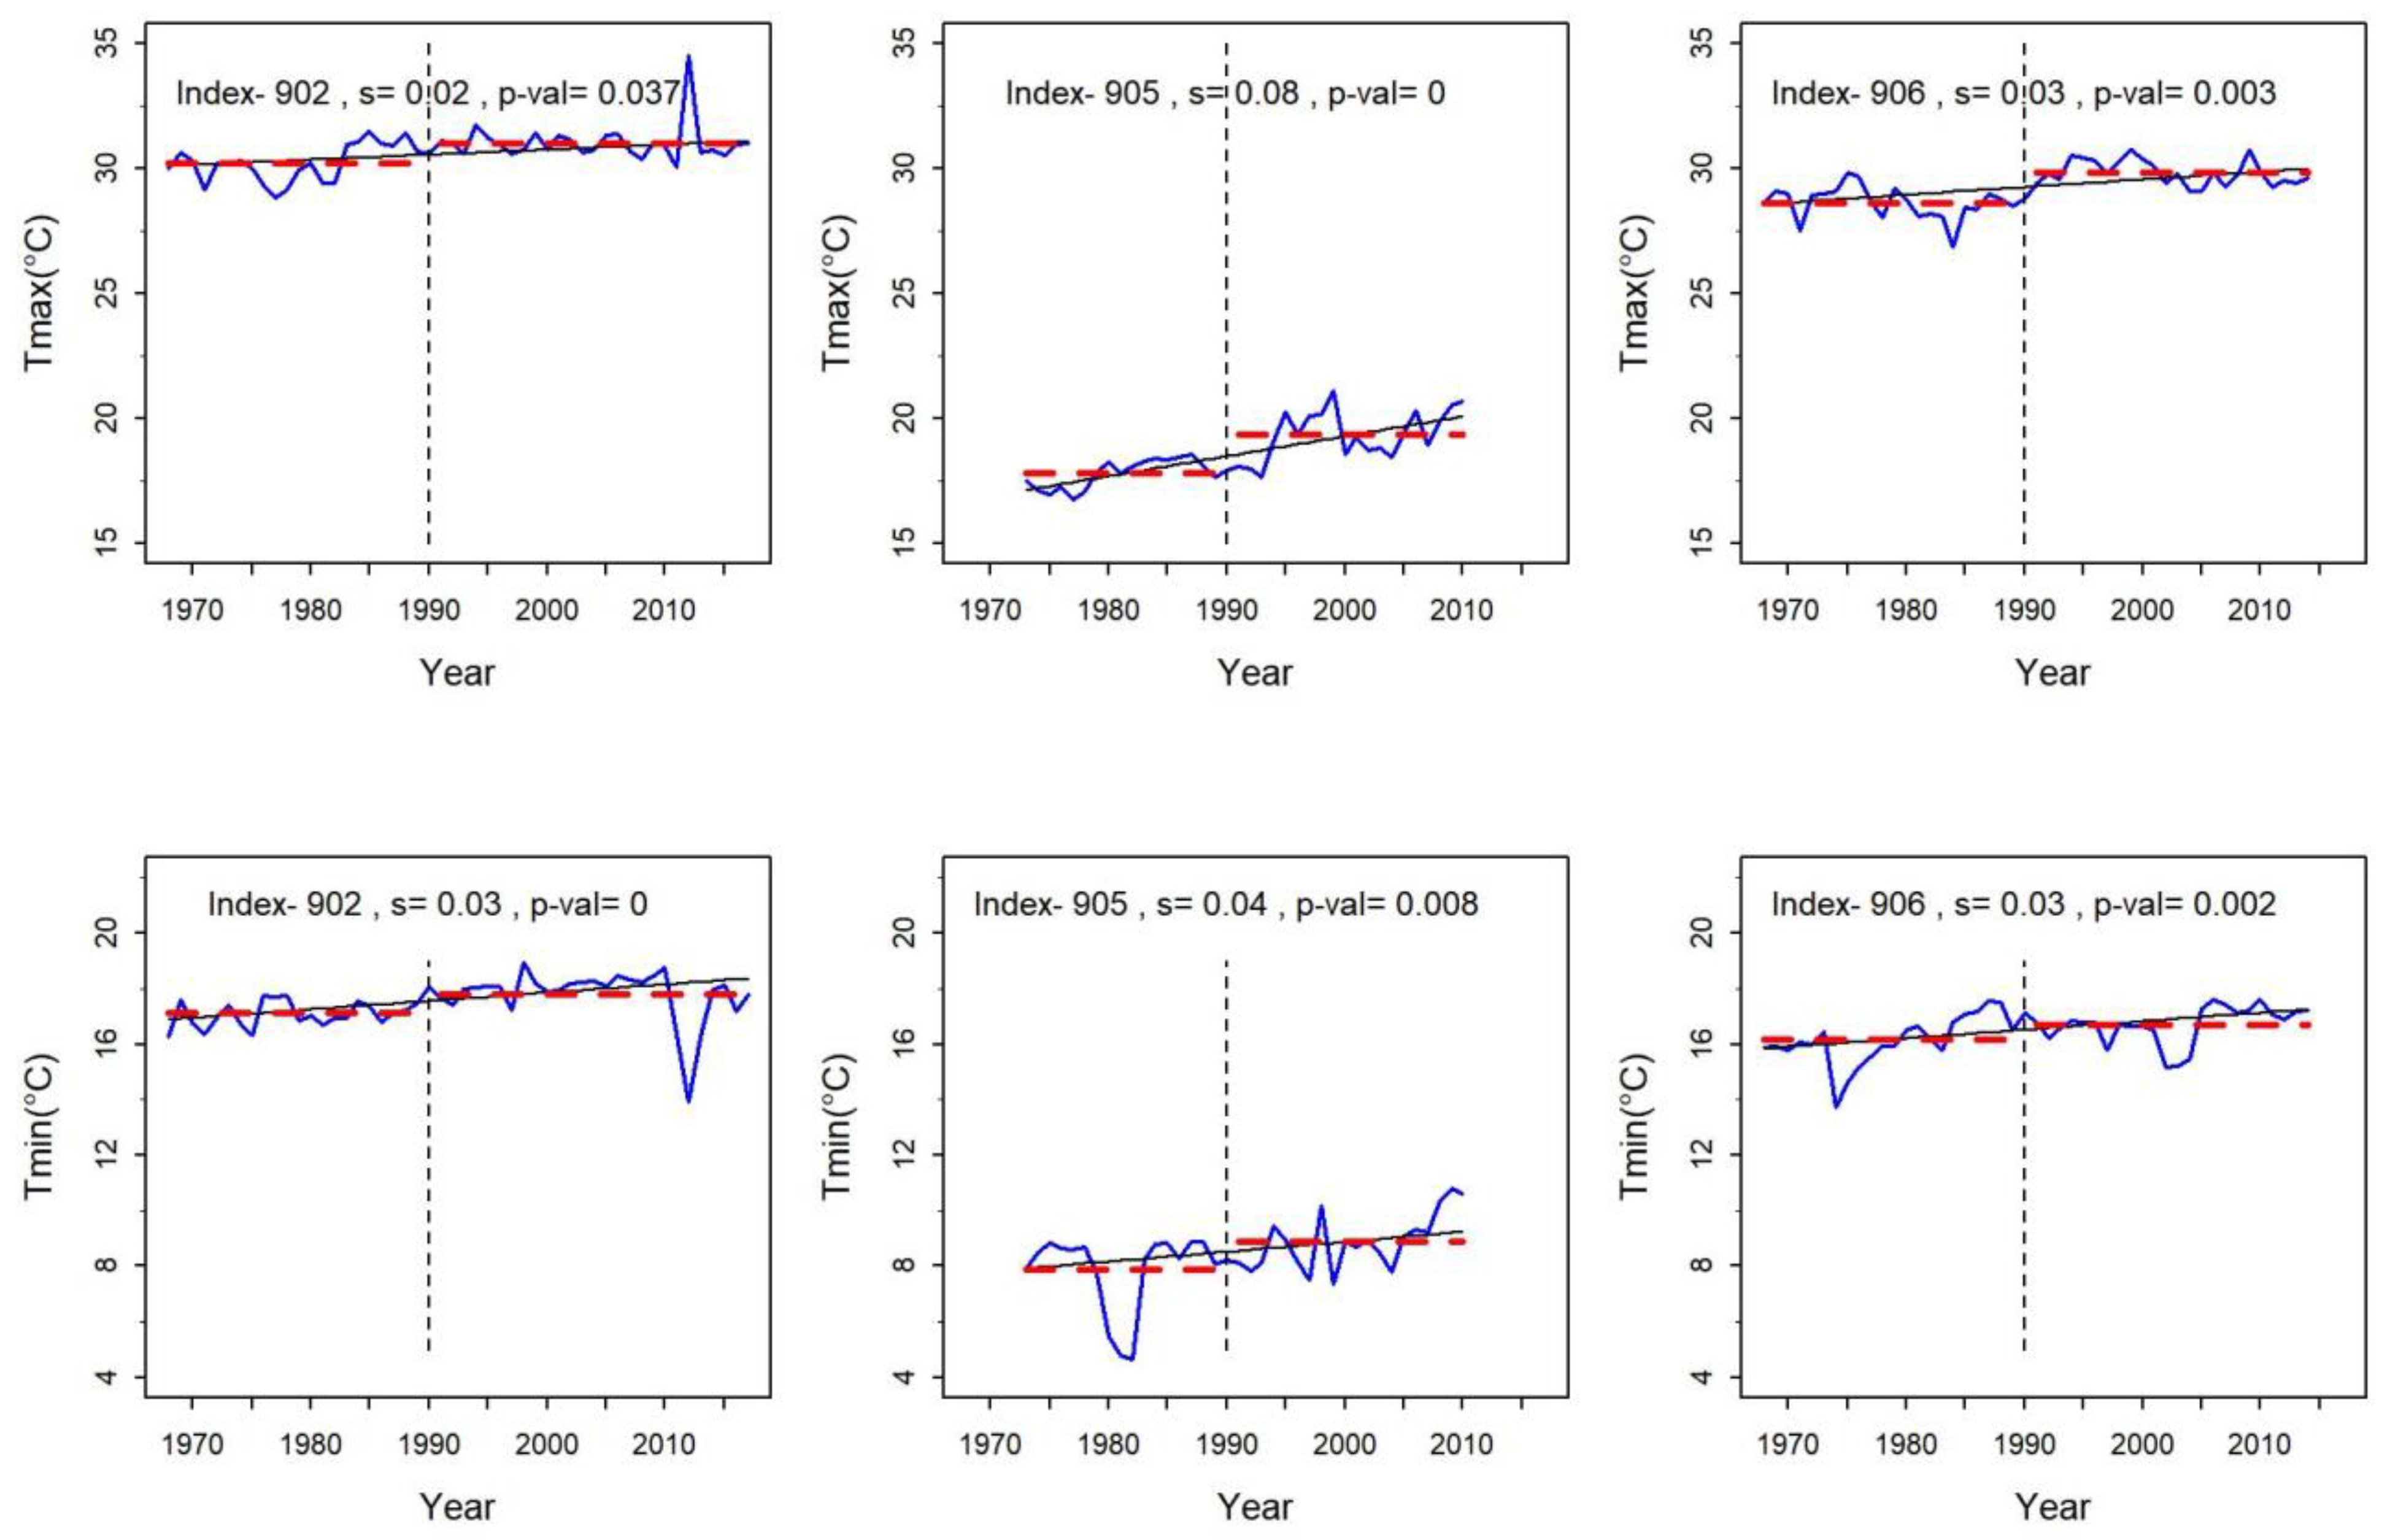
Two distinct trends in hydro-climatic time series (temperature) exist before and after 1990. Therefore, 1990 can be considered as the change point for the abrupt change in the EER watershed.
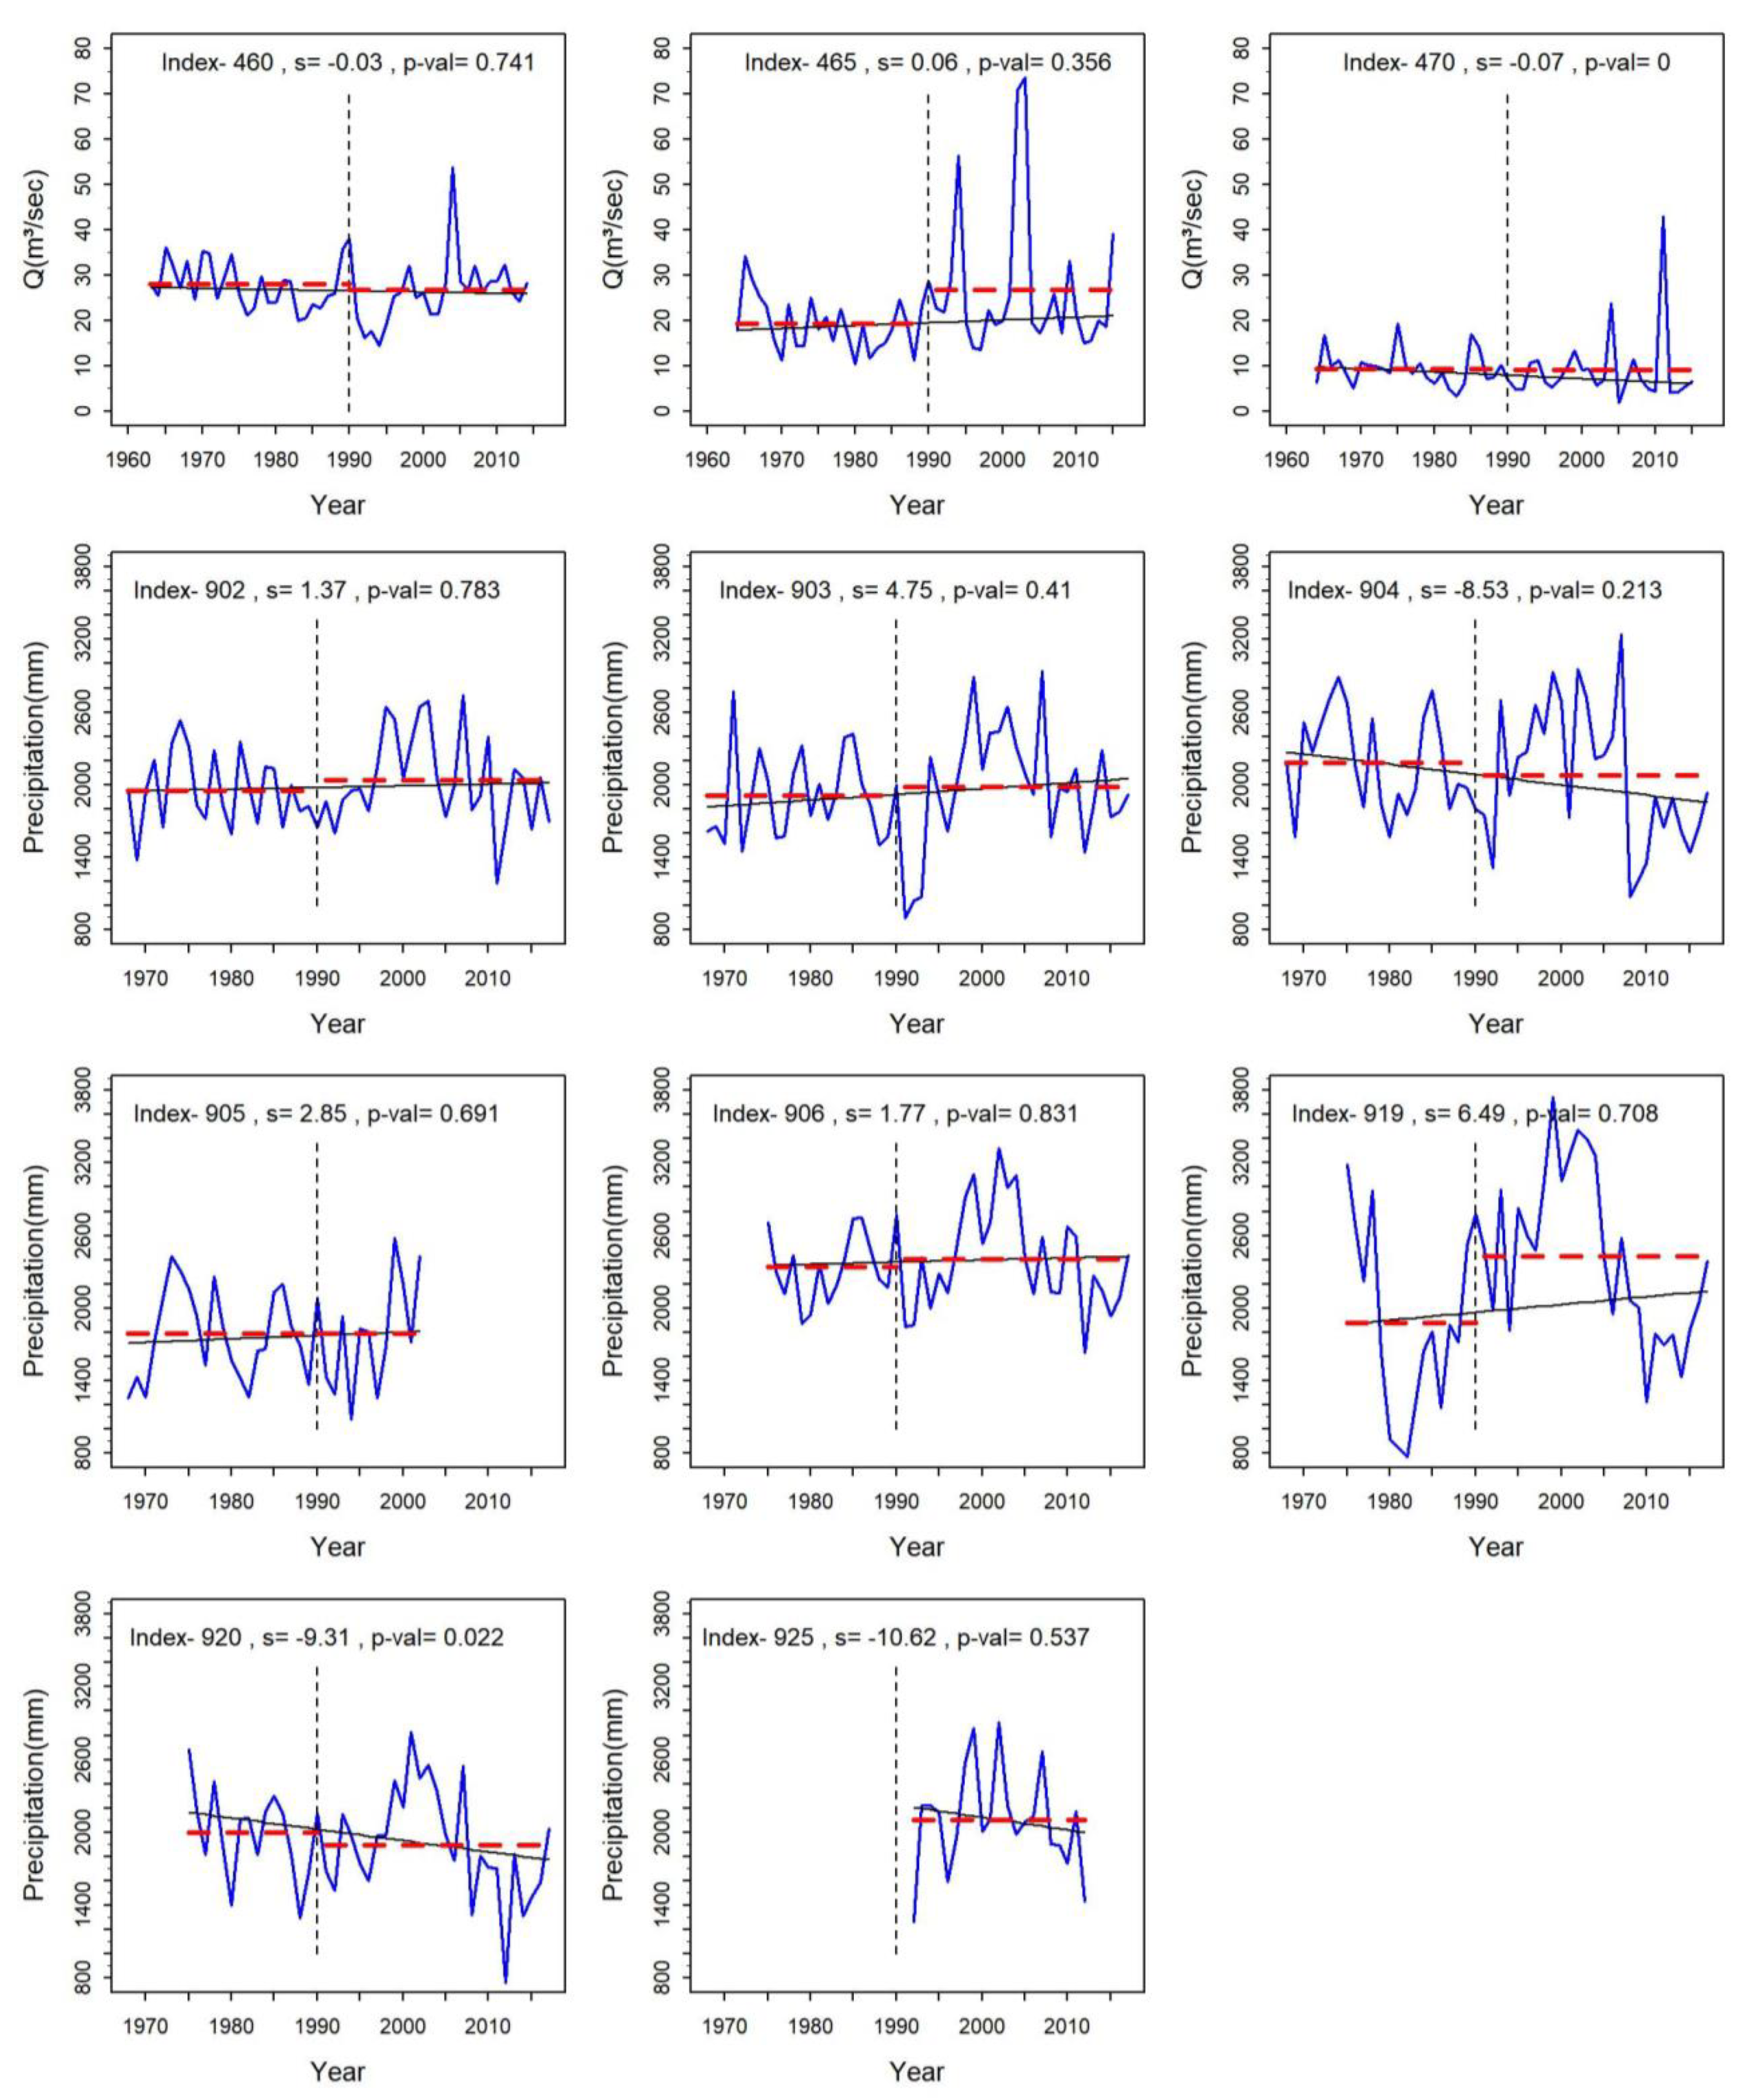
There is a decreasing trend in streamflow observed at two hydrological stations post-1990. The rate of decrease at Manahari (station 465), a major tributary of the EER watershed, and Lothar Khola (station 470) for the period of 1991–2015 are 0.097 m3/s/yr and 0.054 m3/s, respectively. In the case of precipitation, most of the precipitation has statistically insignificant trends. For example, station 920, though there is a statistically significant decrease for the period of 1975–2017, there is a decreasing trend of 15 mm/year (insignificant) after 1990.
Most of alterations/decrease in streamflow in the EER watershed after 1990 are attributed to the anthropogenic origin, though the rate of alteration varies across the stations. Climate-induced alterations in streamflow are associated dominantly to evapotranspiration.
Streamflow alterations are having implications to water and food security; river health and aquatic biodiversity; and groundwater abstraction. However, a separate study is required to quantify precisely the extent of impacts.
To ensure water and food security, river health, aquatic biodiversity, and to be able sustainably abstract groundwater, it is recommended to devise strategies for water use efficiency through both supply-and demand-side management of water. It is also crucial to develop a water co-operation framework among the local governments, which share the same water resources, for strategic and sustainable use the water resources, and river health preservation.


