4.2.1. Lifeline
The gas consumption of a gas fireplace is affected by many factors, including the house insulation, house location, plain or mountainous area, and surrounding occupancy (whether there is heating around). The rated thermal output of a gas wall-hung furnace is usually measured in kW. The common wall-hung furnaces are 18, 20, 24, 28, 32, and 35 kW. The larger the household’s area, the more powerful the gas fireplace needs to be. According to actual data obtained from the surveyed households, for a three-room residential house with a building area of 110 m2 and using a steel plate-type radiator heating system, the daily gas consumption ranges from 15 to 20 m3 if the indoor temperature is maintained at 18 °C. The heating behavior of households also affects gas consumption. Some households divide their rooms into several heating zones, heating the living room during the daytime and the bedroom at night, which consumes less gas.
Therefore, a common low-income household gas consumption scenario is a 24 kW wall-hung furnace, a heating area for only one room (approximately 30 m2) or different rooms in rotation, an indoor temperature maintained at 18 °C, and a minimum daily gas consumption of 6 m3. Then, about 700 m3 of gas will be required in a heating season, which is estimated at 4 months. Therefore, we estimate that the lifeline level of gas heating in the Hengshui area is approximately 700 m3. Farmers have to endure the cold in the winter when the gas consumption is below 700 m3.
4.2.2. Classification of Household Gas Use Behavior
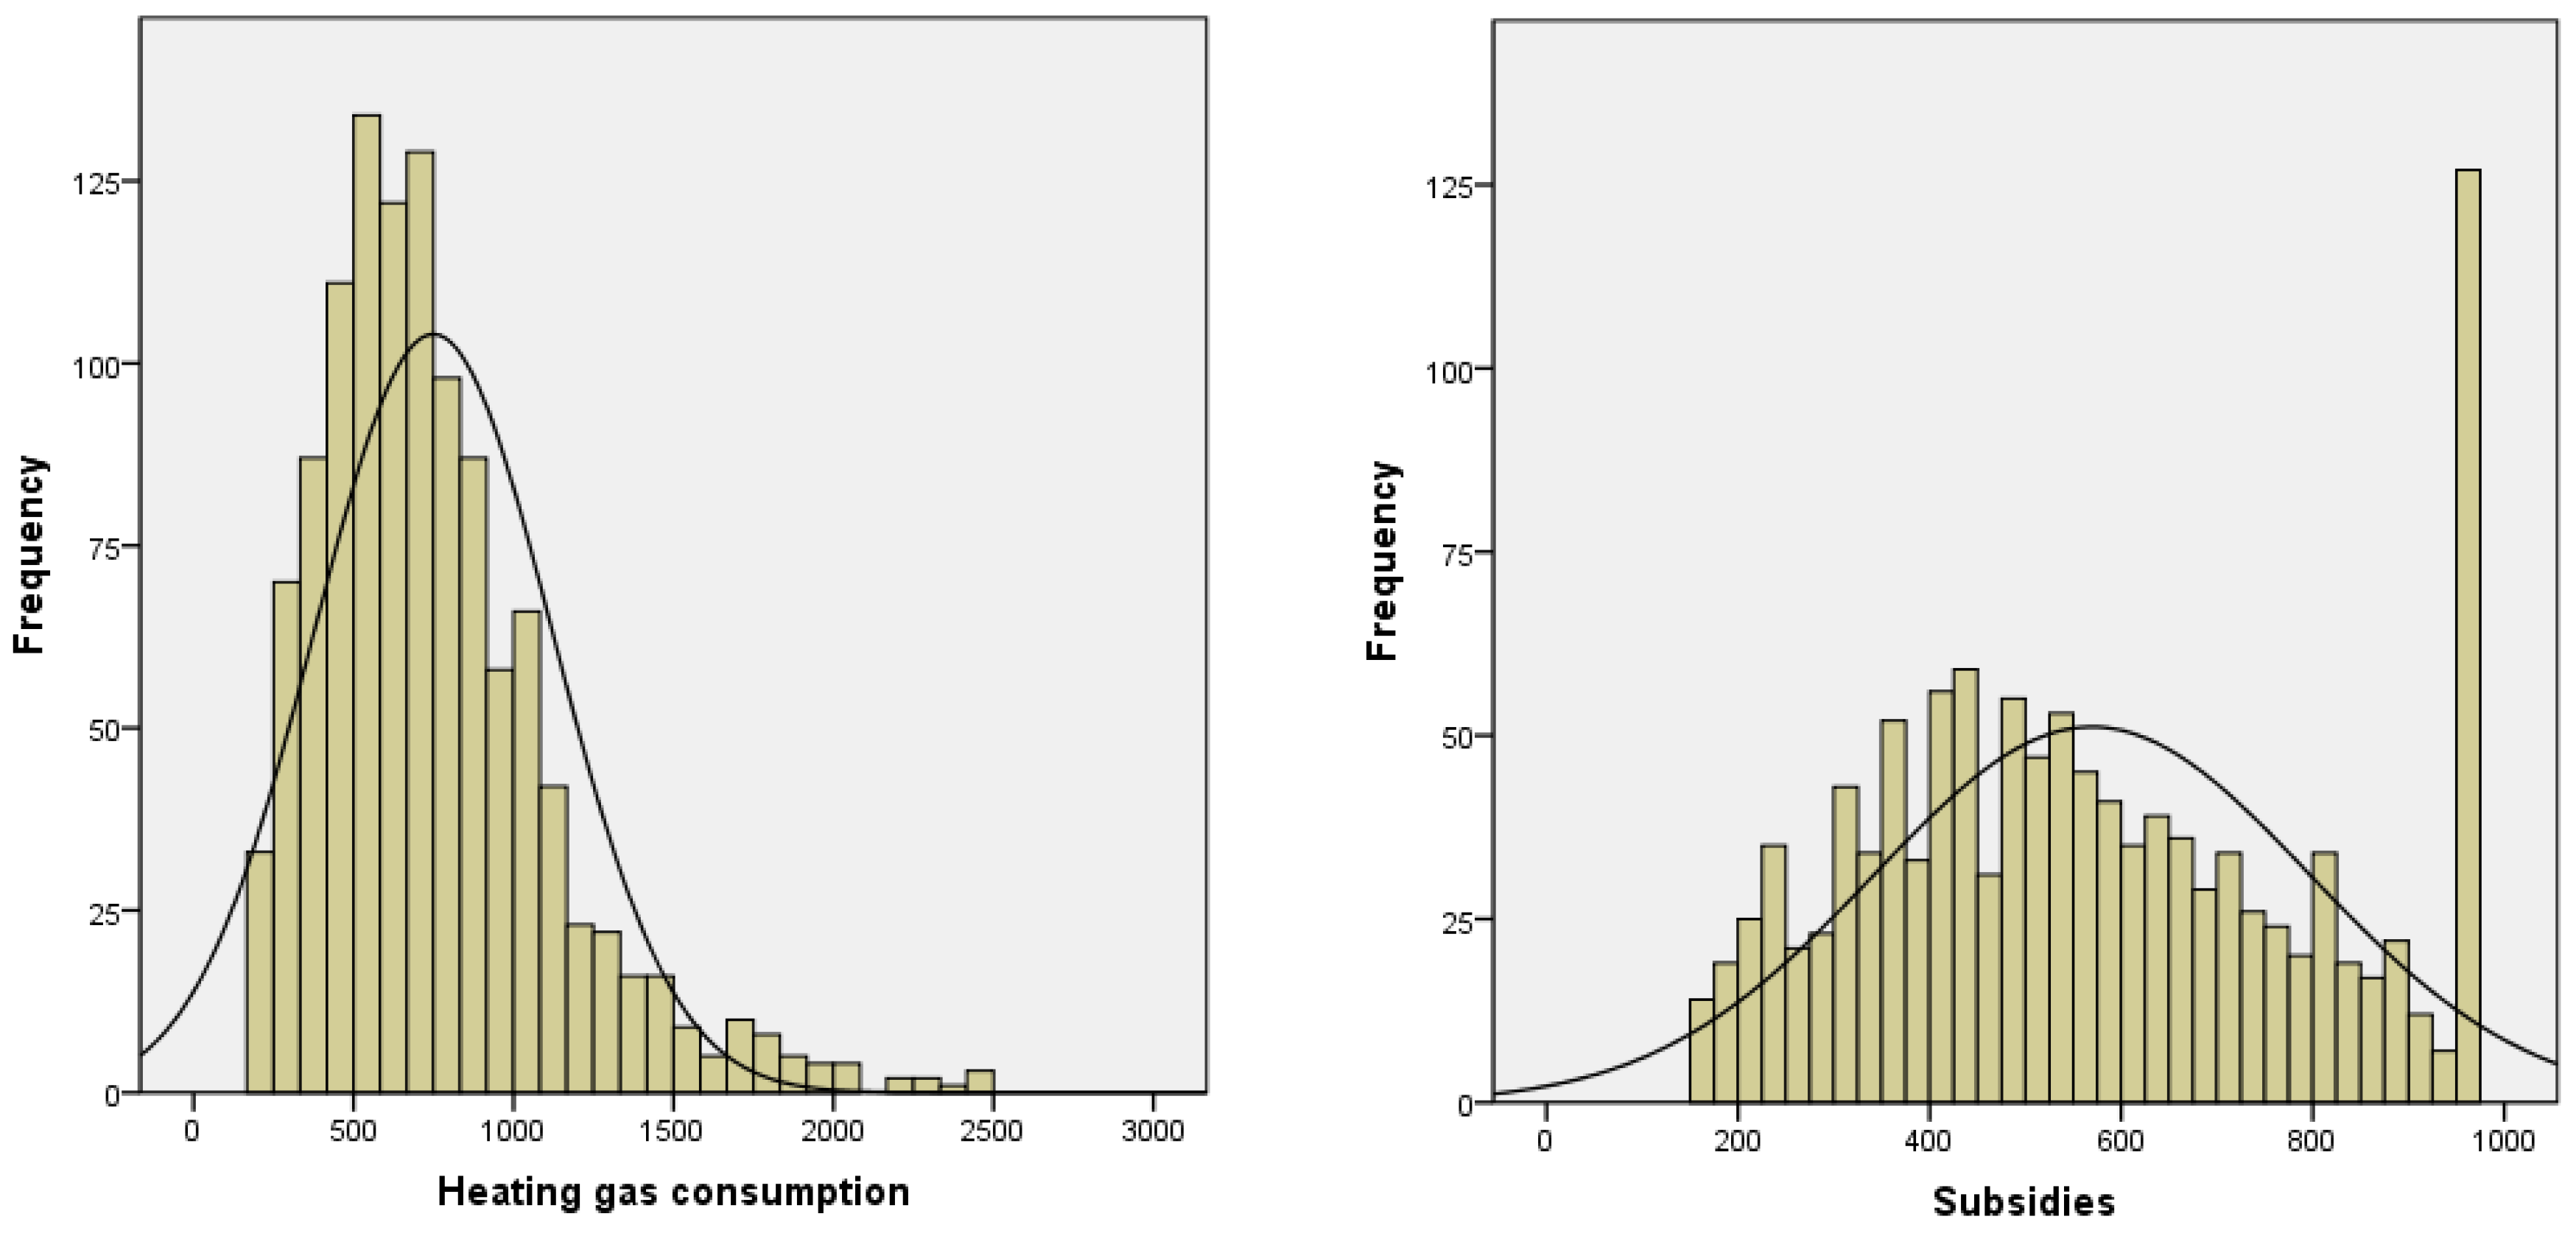
Cluster analysis was conducted for the data on household gas consumption to obtain the classification of household gas consumption. The K-means algorithm was used for clustering analysis. Two characteristic quantities were utilized for clustering, i.e., the annual heating gas consumption and payment amount. Using SPSS, the K-means clustering algorithm based on the Euclidean distance was employed for clustering analysis, and the values of the two characteristic quantities and the classification of households corresponding to three categories were determined. The classification results and descriptions of the households are shown in
Table 2. Clustering found three different types of gas consumption. Since the income level is considered to be the main factor affecting gas consumption, we consider that the three obtained categories correspond to the following three types of households with different incomes: low-income households; middle-income households; and high-income households.
According to the data from the 1166 households, if the lowest 31% are regarded as low-income households, then, the corresponding heating gas consumption boundary is 549 m3, and the low-income households have values lower than 549 m3. If the highest 9% are high-income households, then, the corresponding boundary of heating gas consumption is 1254 m3, and those who have values higher than 1254 m3 are high-income households. The heating gas consumption between 549 and 1254 m3 represents middle-income households, thereby accounting for 60% of those included in this study.
Since the concept of “low income” has a considerable relativity, several situations need to be taken into account to better fit the actual classification of the gas consumption behavior of households.
According to the statistical data of Hebei Province, in 2017, 40% of the low-income households in rural Hebei Province had a per capita disposable income of less than CNY 8697 and 20% of the high-income households displayed a value of CNY 15,508 [
27]. According to China Dispersed Coal Governance Report 2019 [
28], 47.38% of households in the valid sample earn less than CNY 30,000, corresponding to the gas consumption of 668 m
3, representing low-income farmers. As for the high-income households, 8.16% of households earn more than CNY 50,000. It is also reported that residents are generally reluctant to spend more than CNY 2000, corresponding to 1170 m
3 of heating. Several provinces and cities set 1200 m
3 as the upper limit of subsidies. Therefore, the households who use more than 1200 m
3 of gas are defined as high-income households.
Combined with the coal consumption of households, this research indicates that in rural areas, the purchase cost of general bulk coal for low- and middle-income households is CNY 1000 and 1300, respectively, and the corresponding gas consumption is 537 and 699 m3, respectively.
On the basis of the above consideration, three types of heating households are presented as follows: low-gas-consumption households with less than 700 m
3; middle-gas-consumption households with 700~1200 m
3; and high-gas-consumption households with more than 1200 m
3. The final classification results, including 132 non-heating households, are shown in
Table 3. The current research and analysis revealed that in rural areas, the heating capacities of households in the 25th, 50th, and 90th percentile are 490, 679, and 1222 m
3, respectively, with an average of 750 m
3, that is to say, half of the heating households (51.34%) use gas below the lifeline, which cannot guarantee the heating demand in winter. Moreover, the risk of reburning is high.
Consumption of Low-Income Households
The typical heating scenario of this kind of household is as follows: Gas is only used to meet the most basic living needs. The heating area can only satisfy one room, the heating temperature is set as the minimum acceptable temperature (18 °C), and the heating period is four months. This estimation indicates that the monthly gas consumption required to meet the basic heating needs of low-income group households is approximately 700 m3. This gas consumption can be regarded as the lowest gas consumption of the group of households.
Table 3 reveals that the number of households of this type is 615, thereby accounting for 47.38% of all households. The average gas consumption is 484.62 m
3, which accounts for 33.64% of the total gas consumption of households.
Consumption of Middle-Income Households
The typical scene of the farmer is as follows: Taking a 70 m2 households as an example, there are four permanent residents, the house is a brick and concrete structure with wooden doors and windows, the family conditions are general, the heating season is four months, and the heating temperature is set at 18 °C. The study indicates that the gas consumption required to meet the basic heating needs of middle-income households is approximately 1000 m3.
Table 3 shows that the number of households of this type is 426, which accounts for 32.82% of all households. The average gas consumption is 895 m
3, thereby, accounting for 43.04% of the total gas consumption of households.
Consumption of High-Income Households
The typical scene of the farmer is as follows: Taking a 100 m2 of household as an example, there are four permanent residents, the house is a brick concrete structure with wooden doors and windows, the family conditions are good, the heating season is four months, and the heating temperature is set at 18 °C. The results reveal that the monthly gas consumption required for the basic heating of high-income households is approximately 1200 m3.
Table 3 also shows that the number of households of this type is 125, thus, accounting for 9.63% of all households. The average gas consumption is 1547 m
3, which accounts for 21.82% of the total gas consumption of households.
4.2.3. Price Elasticity of the Gas Demand
The gas price elasticity is key to analyzing the changes in the heating behavior of households due to subsidy variation. The impact of canceling the gas subsidy on households depends on the demand price elasticity [
23]. The definition of IEA in 1999 indicates that the function of the energy demand is as follows:
The impact of a gas price rise on the demand can be expressed as follows:
.The logarithm is taken to obtain the following:
where
is the reduced gas demand after the gas subsidy is canceled;
ε is the price elasticity of the long-term demand;
and
represent the gas price and demand before the subsidy is canceled, respectively; and
and
represent the gas price and demand before the subsidy is canceled, respectively.
Albertini et al. estimated that the price elasticity of natural gas in 50 metropolitan areas of the United States from 1997 to 2007 was in the range of −0.693 to −0.566, and the short- and long-term self-price elasticity of natural gas under the dynamic model were −0.572 and −0.647, respectively [
29]. Zhang et al. estimated the natural gas consumption data of greater North China from 2000 to 2012 and found that regions with a high economic level and strong user price tolerance has small demand price elasticity and vice versa [
30]. Wang et al. also used the logarithmic linear model to build a natural gas demand model in China and estimated that the price elasticity of the natural gas demand was −2.88 and the natural gas price elasticity of the industrial sector was −0.4 [
31]. Hu et al. estimated that the average price elasticity of natural gas of Beijing residents was −0.608 [
32]. Yu et al. used city average gas data and estimated an income elasticity of 0.21 [
33]. Solheim et al. estimated a slightly lower price elasticity from −0.003 to −0.223 for natural gas in OECD countries [
34]. Meier et al. estimated values in the range of −0.34 to −0.56 for the U.K. [
35]. The estimates of price elasticity for gas and coal in China ranged from −0.94 to −0.46 in the research of Cao et al. [
36].
The above studies revealed that the price elasticity of natural gas in China was negative and the absolute value was less than one. This finding indicates that the demand for natural gas lacks price elasticity, and the natural gas consumption of residents’ decreases with a rise in the natural gas price. This phenomenon is attributed to the subsidization of residential gas by the Chinese government and the lower price of residential gas than its marginal cost. In addition, research on the price elasticity of the natural gas consumption demand of rural residents is lacking. The research on high-income households is believed to refer to the research results of urban residents. Therefore, consideration of the unique situation of some low-income rural households is necessary.
The double logarithm model was used to obtain the elastic coefficients. Considering the influence of many factors on the demand of heating gas, the gas price, income, and payment amount were finally selected, and the factors that are difficult to quantify and measure, such as the environment and weather, were excluded. Therefore, the explanatory variables were the gas price
after subsidy, per capita income of households in counties and districts
, and average payment amount
. The explanatory variable was the heating gas consumption
, which is expressed as follows:
where
is the heating gas consumption,
is the subsided price,
is the per capita income of households in the county,
is the average payment amount,
is the random error,
is the price elasticity of the gas demand, and
is the income elasticity of the gas demand.
The sample data of high-income households were used because the gas price of the low-income group is the same after subsidy, and only the gas prices of the high-income group are different from each other. The price elasticity model of the heating gas demand of rural residents in Hengshui can be obtained as follows:
where the price elasticity of the high-income group is −0.187. Therefore, the situation of other groups must be further estimated. The price elasticity of China’s gas demand was estimated to be −15.31, in 2010. Li et al. estimated the price elasticity of the urban and rural gas demand. The price elasticity of urban low-, middle-, high-, rural low-, rural middle-, and rural high-income families was −0.31, −0.51, −0.21, −0.11, −0.21, and −0.11, respectively [
24]. Therefore, the demand price elasticity of high-income households (−0.187) can be used as a benchmark value to estimate other groups. The demand price elasticity of middle-income households is the highest, which can increase by approximately 0.1. Therefore, the demand price elasticity of middle-income households was estimated to be −0.31. The demand price elasticity of low-income households is low and was estimated to be −0.15. The demand price elasticity of Hengshui rural residents for gas heating is shown in
Table 4.


