Article

Dynamics Variation of Soil Labile Organic Carbon Fractions in Different Wetland Types of Dongting Lake under Seasonal Water Level Fluctuation

1
Department of Resources and Environment, Zunyi Normal University, Zunyi 563006, China
2
Department of Biology and Agriculture, Zunyi Normal University, Zunyi 563006, China
3
Department of Chemistry and Chemical Engineering, Zunyi Normal University, Zunyi 563006, China
*
Author to whom correspondence should be addressed.
Sustainability 2021, 13(24), 13836; https://doi.org/10.3390/su132413836
Submission received: 18 October 2021 / Revised: 1 December 2021 / Accepted: 6 December 2021 / Published: 15 December 2021

Abstract

:
Soil labile organic carbon (LOC) fractions are very sensitive to environmental change and closely related to soil quality. They play an important role in the study of terrestrial carbon cycles. This study aimed to explore the sensitivity of soil LOC fractions to environmental changes and analyze their main influencing factors during three seasonal water level periods for scientific management of Dongting Lake wetlands. Soil under three typical wetland types (Carextristachya wetland (CTW), Phragmites australis wetland (PAW) and Salix babylonica (SBW)) in East Dongting Lake in China were collected during the normal season (May), rainy season (August) and dry season (December). Seasonal dynamics of soil LOC fractions (i.e., dissolved organic carbon (DOC), microbial biomass carbon (MBC) and easily oxidized carbon (EOC)) within these wetlands and their relationship to soil nutrients and carbon-cycle enzyme activity were analyzed. The results showed that the soil DOC contents of the three wetlands first increased and then decreased, with the exception of CTW from the normal season to the dry season, while the seasonal changes of soil MBC and EOC for all wetlands followed an opposite pattern. CTW had the largest DOC concentration (228.29 mg·kg−1) during dry season, while the highest contents of soil DOC, MBC and EOC were found in PAW during the three observed seasons, which ranged from 82.05 to 203.60 mg·kg−1, 262.54 to 325.74 mg·kg−1 and 3.30 to 4.61 g·kg−1, respectively. However, the contents of soil DOC and their proportions to soil organic carbon (SOC) of all wetlands during the normal season were 56.58~82.05 mg·kg−1 and 0.41~0.47%, respectively, which were the lowest among the three seasons. Nevertheless, the contents of both MBC and EOC as well as their ratios to SOC in these wetlands showed similar seasonal dynamics, with the lowest values recorded in the rainy season. From the normal season to the dry season, invertase activity in all wetlands increased, while cellulase activity decreased by 12.5–31.3%. The seasonal variation of catalase activity for all wetlands was less distinctive, and the highest enzyme activity was during the rainy season. Correlation analysis revealed that soil LOC fractions for all wetlands were closely related to SOC, TN, TP and invertase for the three seasons, especially during the rainy season, but were negatively correlated with TK, cellulase and catalase activity. Generally, soil LOC fractions of the three wetlands were affected by the seasonal fluctuations of water levels and presented different distribution characteristics.

1. Introduction

Although wetlands cover only about 5–8% of the world’s terrestrial area, their soil organic carbon (SOC) stock accounts for 20–30% or more of global SOC stocks [1]. Wetlands exhibit the highest carbon density among terrestrical ecosystems, they are typically carbon sinks [2,3]. Therefore, wetlands play an important role in global climate change mitigation. However, the change of total SOC is relatively stable and not easily detected in the short term [4]. Soil carbon pools that promote microbial activity and nutrient cycling are primarily the labile pools. The labile pool is the most active fraction of SOC and governs the production and flux of CO2 from soils to atmosphere [5]. Compared to the total SOC, soil labile organic carbon (LOC) fractions (i.e., dissolved organic carbon (DOC), microbial biomass carbon (MBC) and easily oxidizable carbon (EOC)) in soil carbon pool are fast-moving, unstable, easily decomposable and utilized by soil microorganisms, and more rapidly responsive to soil disturbance [6,7]. Soil LOC fractions not only regulate soil nutrient availability but also participate in the cycling of soil C directly, as well as provide other essential ecosystem functions and services [8,9]. Hence, these components have been suggested as early sensitive indicators for predicting changes in total SOC and soil quality, which influence soil function in specific ways [10,11].
LOC is extremely vulnerable to anthropogenic activities and environmental changes, such as land use change, fluctuations in water levels and shifts in vegetation location and types [12,13]. Furthermore, there are several mineral factors (such as soil composition, soil stability and clay minerals) that control SOC changes and its LOC dynamic [14]. Due to the interaction of these multiple factors, the characteristics of soil LOC fractions vary seasonally [15,16]. The seasonal hydrological cycle caused by climate change is an important factor affecting the storage and loss of SOC in wetlands [17]. Especially in long-term floods or excessive humidity, a significant amount of LOC (e.g., DOC) may migrate downward via leaching [18]. Fenner, Freemana and Reynolds [19] reported that both drought and an increase in precipitation could change microbial community structure and microbial activity, leading to shifts in the carbon cycle mechanism. Meanwhile, Yang, Yang and Ou [20] found that continuous waterlogging markedly weakened the likelihood of increased soil EOC. In addition, soil water content is lower with higher soil temperature, which may potentially create more beneficial conditions to enhance soil LOC fractions [21]. Thus, hydrological conditions in wetlands, which lead to changes in the material circulation rate in soil, can strongly influence the production and loss of LOC fractions in wetland soil. However, knowledge concerning the variation of soil LOC content under varying water levels associated with particular seasons is poor.
Dongting Lake is the second largest freshwater lake in China with the distribution area of wetlands cumulating in approximately 8.578 × 10⁵ hm2, accounting for more than 60% of the lake’s total area [22]. It is an important international natural wetland with abundant biological resources under the Three Gorges Dam on the Yangtze River. It not only has the function of flood regulation and storage, but also serves as important habitat for migrant birds. Due to the evolution of hydrological and morphologic characteristics, Dongting Lake has been divided into three major parts: East Dongting Lake, West Dongting Lake and South Dongting Lake. East Dongting Lake is the largest water basin in the region. Dongting Lake wetlands experience drastic seasonal water levels changes due to the impacts of incoming water from the Yangtze River and four additional rivers, including the Xiangjiang, Zishui, Yuanjiang and Lishui River. It presents the hydrologic characteristics of a “lake formed by flood, continent formed by falling water levels” [23]. This results in a high diversity of vegetation types and complex succession patterns. Changes in hydrology, reclamation and severe silt deposition in Dongting Lake over long temporal periods have caused the water area to shrink, the regulation and storage function to decline, and the wetland ecological environment to seriously deteriorate [24]. Clarifying the dynamic changes of soil LOC fractions under varying seasonal water levels could guide management practices aimed at improving the environmental quality and carbon storage of Dongting Lake wetlands.
In this study, three typical vegetation type wetlands, located in the National Nature Reserve of East Dongting Lake, were selected on the direction of succession from aquatic to terrestrial. Our study was conducted to: (i) investigate the dynamic changes of soil LOC fractions (i.e., DOC, MBC and EOC) among the three typical wetlands during normal, rainy and dry seasons; (ii) quantify the relationships between soil LOC fractions and soil nutrients, enzyme activity; and (iii) identify the main soil environmental factors that affect the distribution of soil LOC fractions for these wetlands. Our results will make clear the primary factors influencing the seasonal distributions of soil LOC fractions and provide a theoretical basis for improving SOC accumulation and soil fertility restoration in the wetlands of Dongting Lake.

2. Materials and Methods
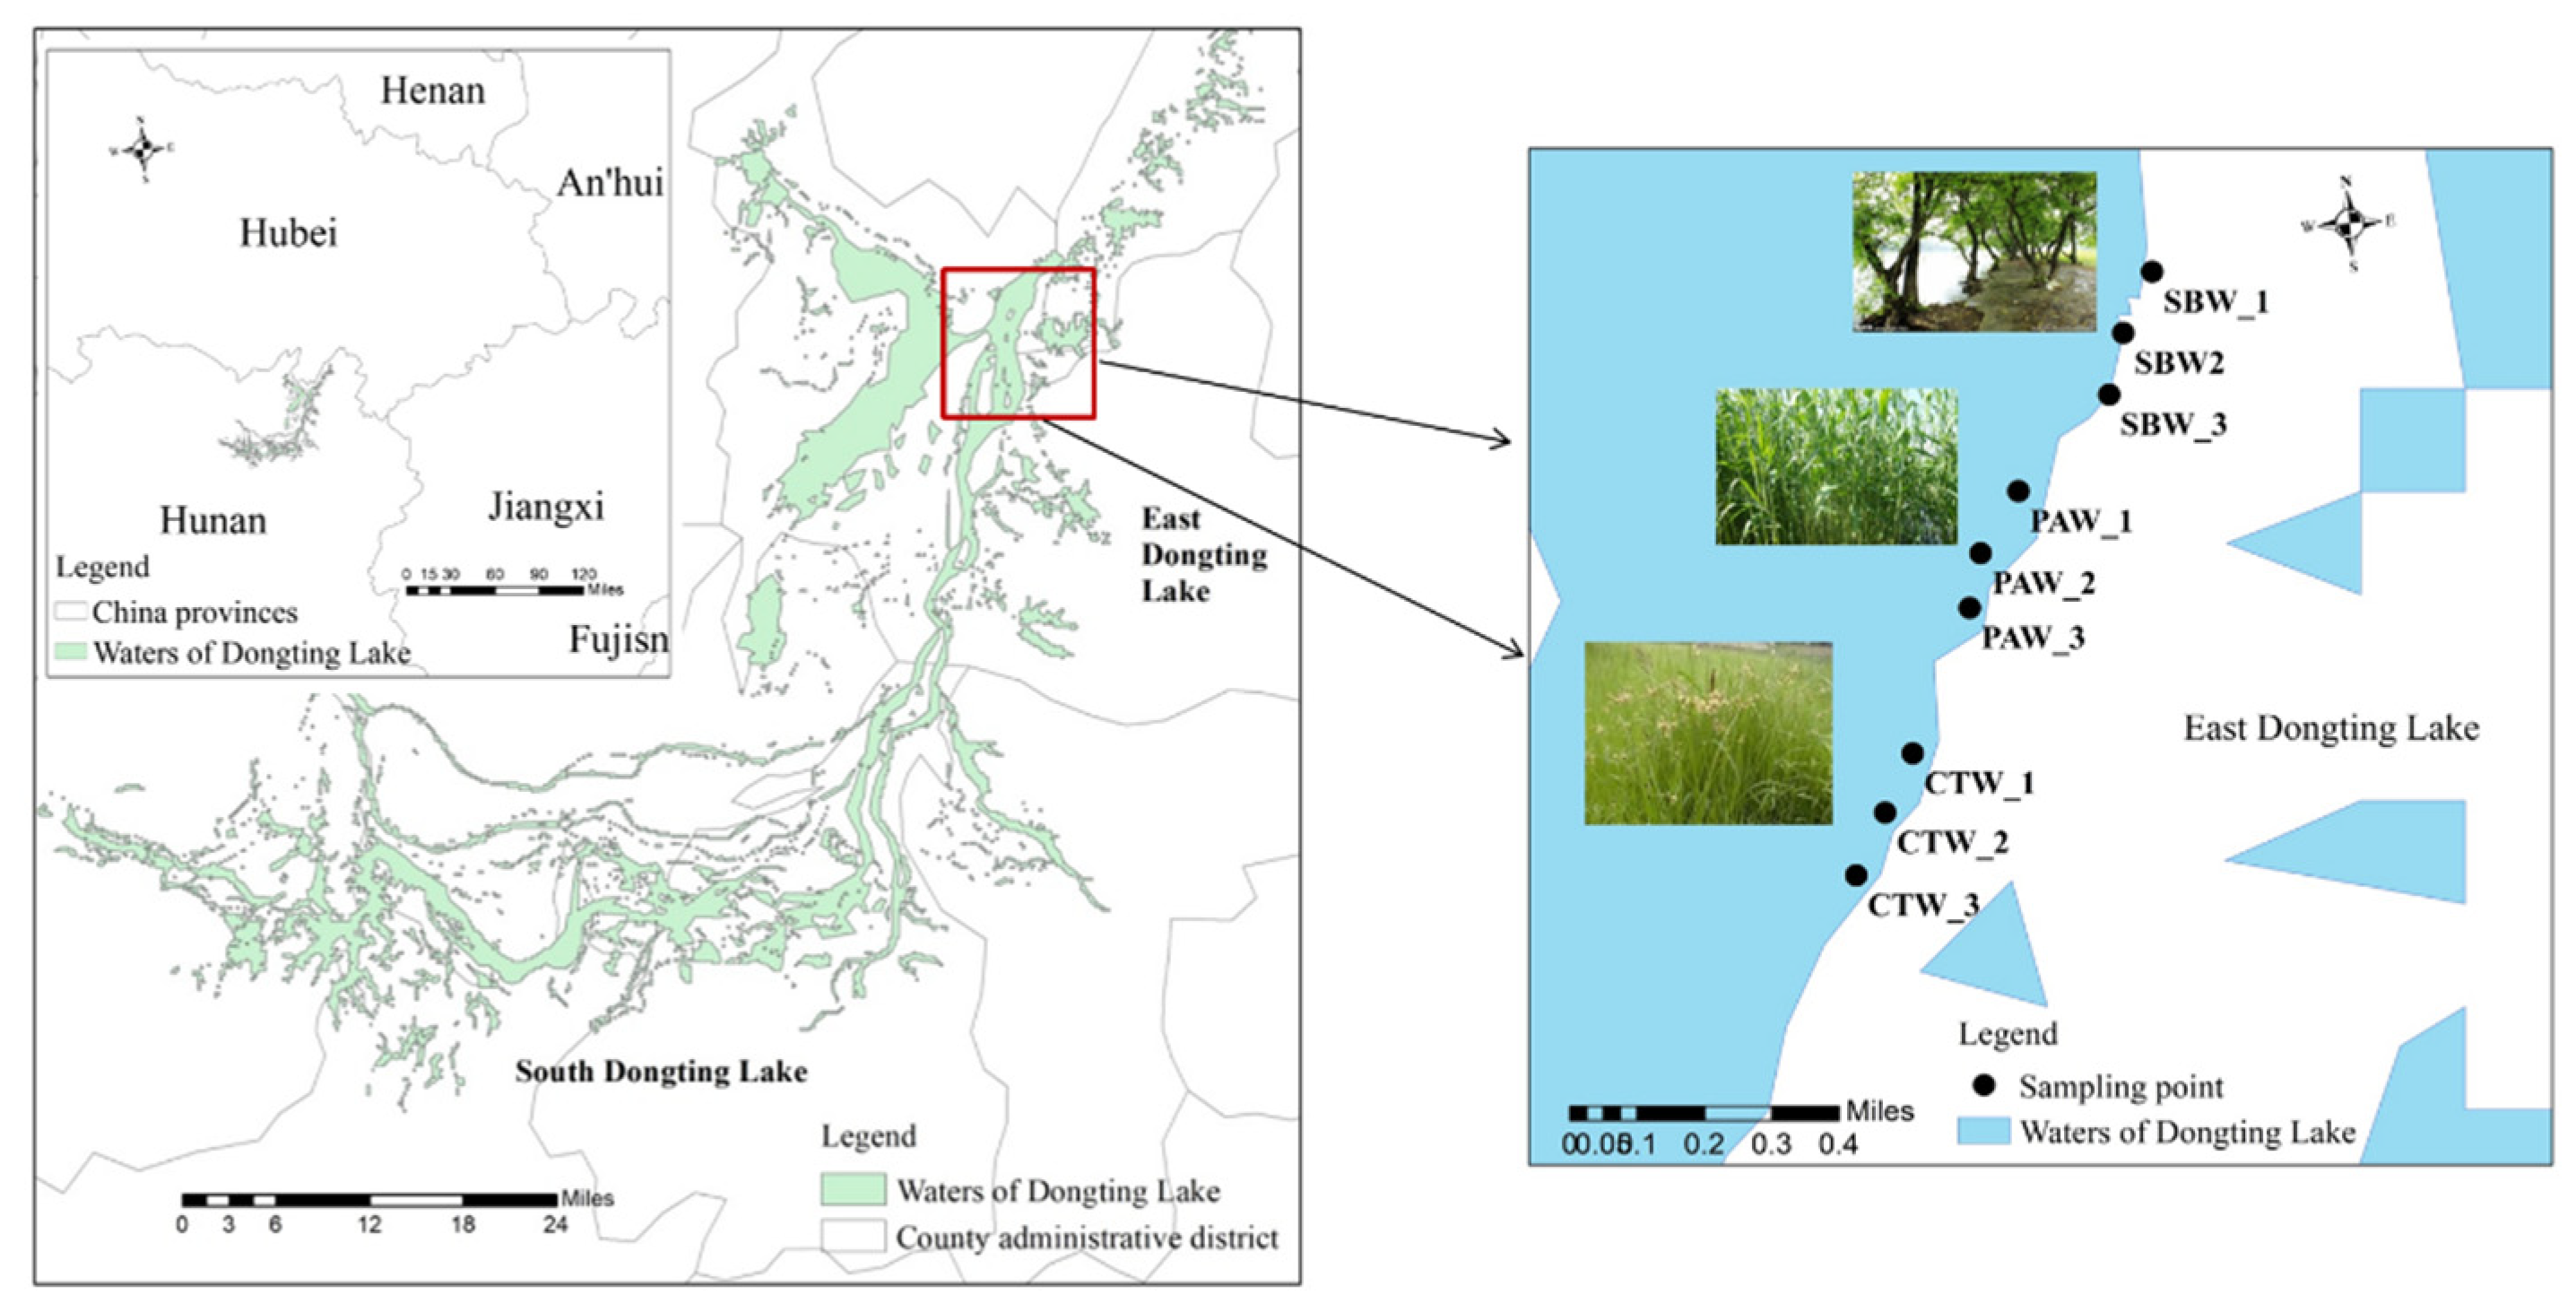
2.1. Study Area

The study was conducted during three different water level seasons (normal season, rainy season and dry season) in 2018 in the National Nature Reserve of East Dongting Lake (28°59′~29°38′ N, 112°43′~113°15′ E), located in northeastern Hunan Province, China (Figure 1). East Dongting Lake, with an area of 1328 km2, is the main lake basin of Dongting lake [25]. This area is characterized by a humid subtropical monsoon climate. The annual average temperature is 16.4–17.0 °C, with the coldest in January (3.9–4.5 °C) and the hottest in July (28.6–29.1 °C) [26]. The mean annual precipitation is 1200–1300 mm, with 80% of this amount occurring from the July to September during the growing season. The water level of the lake fluctuates by approximately 12.5 m a year [27]. Differences in water levels by season in Dongting Lake are as follows: during the normal water level season (April to May), the water level starts to rise due to increasing precipitation. During the rainy season (July to September), the Yangtze River enters the flooding period, which causes the tributary flow to increases sharply until the lake hits its water level peak of the year. During the dry season (December to the following March), the water level is at its lowest of a year due to less rainfall. Affected by periodic fluctuations in water level, complex natural landforms such as water, swamp, shoal and low bank are formed in the lake area, and the soil is lacustrine bog soil and river marsh soil.

2.2. Study Sites and Soil Sampling

Soil samples were collected from three typical vegetation type wetlands along a succession gradient from aquatic to terrestrial, namely, Carex tristachya wetland (CTW), Phragmites australis wetland (PAW) and Salix babylonica wetland (SBW) during the normal season (May), rainy season (August) and dry season (December). These wetlands are located in the lakeside zone of East Dongting Lake Nature Reserve (Figure 1). During the normal season, the water level of the lake rose with the gradual increase of rainfall, causing shallow water in CTW. The soil of PAW and SBW was moist but lacked stagnant water. During the rainy season, low-lying CTW was flooded. Besides, locations of PAW and SBW at slightly higher elevations had more water because of abundant rainfall, but not enough to completely submerge reed plants. Due to little rainfall during the dry season, CTW and PAW were fully exposed with some of the lower mud flats being visible. In order to minimize disturbance to the natural reserve, three sampling quadrants (5 m × 5 m) were arbitrarily established in each wetland, with the distance between each quadrant more than 20 m apart. In each sampling quadrant, five sampling points were randomly selected for collection of the surface soil layer (0–20 cm) using a metal soil sampler (length 50 cm, diameter 4.0 cm). The soil samples from each quadrant were thoroughly mixed to obtain one composite sample. A total of 27 composite soil samples were collected from three wetlands during the three seasons (normal season, rainy season and dry season). The collected soil samples were placed in sterile self-sealing bags, then stored in a portable cooler and brought back to the laboratory. After removal of visible roots, stones and other debris by hand, each sample was divided into two subsamples. One subsample was stored at 4 °C for analyses of DOC, MBC and enzymatic activity within one week. The other was air-dried at room temperature and sieved to 2 mm for determining total SOC, EOC and other basic soil properties.

2.3. Sample Analyses

2.3.1. Soil Physical-Chemical Analysis

SOC was measured using a total organic carbon analyzer (Shimazu, SOC-VCPH, Tokyo, Japan). Total nitrogen (TN) was determined by the Kjeldahl method using the Kjeltec Auto Analyzer (Behr Labor Technik, Düsseldorf, Germany). Total phosphorus (TP) was digested by a mixed acid solution of H2SO4 and HClO4, then measured using the molybdenum antimony colorimetry method. Total kalium (TK) was determined using an ammonium acetate-flame photometer [28]. Soil pH was determined in a 1:2.5 (soil: deionized water) suspensions using a standard pH meter. Moisture content was determined by drying to a constant weight at 105 °C.

2.3.2. Determination of Soil LOC Fractions

Soil DOC was measured using the methods described by Jones and Willett [29]. Briefly, the liquor was extracted from fresh-moist soil (2.5 g) with a soil to water ratio of 1:10. Solutions were filtered using a 0.45-µm carbon-free membrane, and the DOC of the filtrate was determined with a Shimadzu TOC-TN analyzer (Shimadzu Corp., Kyoto, Japan). MBC was analyzed using the CHCl3 fumigation-extraction method [30]. EOC was determined by the chemical oxidation method using 0.333 M KMnO4 [31].

2.3.3. Soil Enzyme Activity Analysis

Soil invertase and cellulose activities were determined by the methods of Guan [32]. The former, moist soil (2.0 g) was incubated with 15 mL of 8% sucrose solutions in 5 mL of phosphate buffer (pH 5.5) and 0.25 mL methylbenzene at 37 °C for 24 h. The latter, moist soil (20.0 g) was incubated with 5 mL of 1% carboxymethyl-cellulose in 5 mL of phosphate buffer (pH 5.5) and 1.5 mL methylbenzene at 37 °C for 72 h. Both needed to be set up no-sample contrasts culture. Then filtrates of the former and latter samples after they were cultured were subject to color reaction and the produced substances were analyzed colorimetrically at 508 nm and 540 nm, respectively. The invertase activity was expressed as mg glucose g−1 soil 24 h−1 and the cellulose activity was expressed as mg glucose g−1 soil 72 h−1. Catalase activity was measured using KMnO4 titration and expressed as the amount of 0.01 mol·L−1 KMnO4 consumed in 1 g of dry soil within 1 h [33].

2.4. Statistical Analysis

Basic analyses and figures for the experiment were carried-out in Microsoft Excel 2007 (Microsoft Corporation, Albuquerque, NM, USA) and statistical analyses were completed using IBM-SPSS 18.0 (IBM, Armonk, NY, USA). All data were subjected to a one-way analysis of variance (ANOVA) and a separation of means by least significant difference (LSD) test calculated at p < 0.05. Pearson’s correlation coefficients between soil LOC fractions and C-cycle enzyme activity or soil nutrients were assessed using IBM-SPSS 18.0 with an accepted significance level of p < 0.05.

3. Results

3.1. Dynamic Changes of Soil Nutrients under Seasonal Water Level Fluctuation

Soil nutrient contents of wetland soils in this study varied during the three water levels observed by seasons (Table 1). During the normal season, there were no significant differences in the concentrations of SOC, TP and TK among the investigated wetlands. However, soil TN had a minimum of 1.10 g·kg−1 in CTW, significantly lower than the other two wetlands (p < 0.05). During the rainy season, the contents of SOC, TN and TP in PAW were significantly greater than those in other wetlands (p < 0.05), while SBW showed the lowest soil TK content. Compared with the normal and rainy seasons, the contents of SOC, TN and TP in SBW during the dry season were significantly lower than that in the other wetlands (p < 0.05). The content of soil TK in CTW was the lowest. The contents of soil TN and TP in three wetlands during the rainy season were 0.93~1.18 g kg−1 and 0.91~1.01 g kg−1, respectively, which were lower than those in the other two seasons. The contents of SOC, TK and C/N ratios in these wetlands showed no consistent change pattern among the three water level seasons. The content of TP for the investigated wetlands across the three seasons was 0.92~1.01 g·kg−1, lower than that of TN.

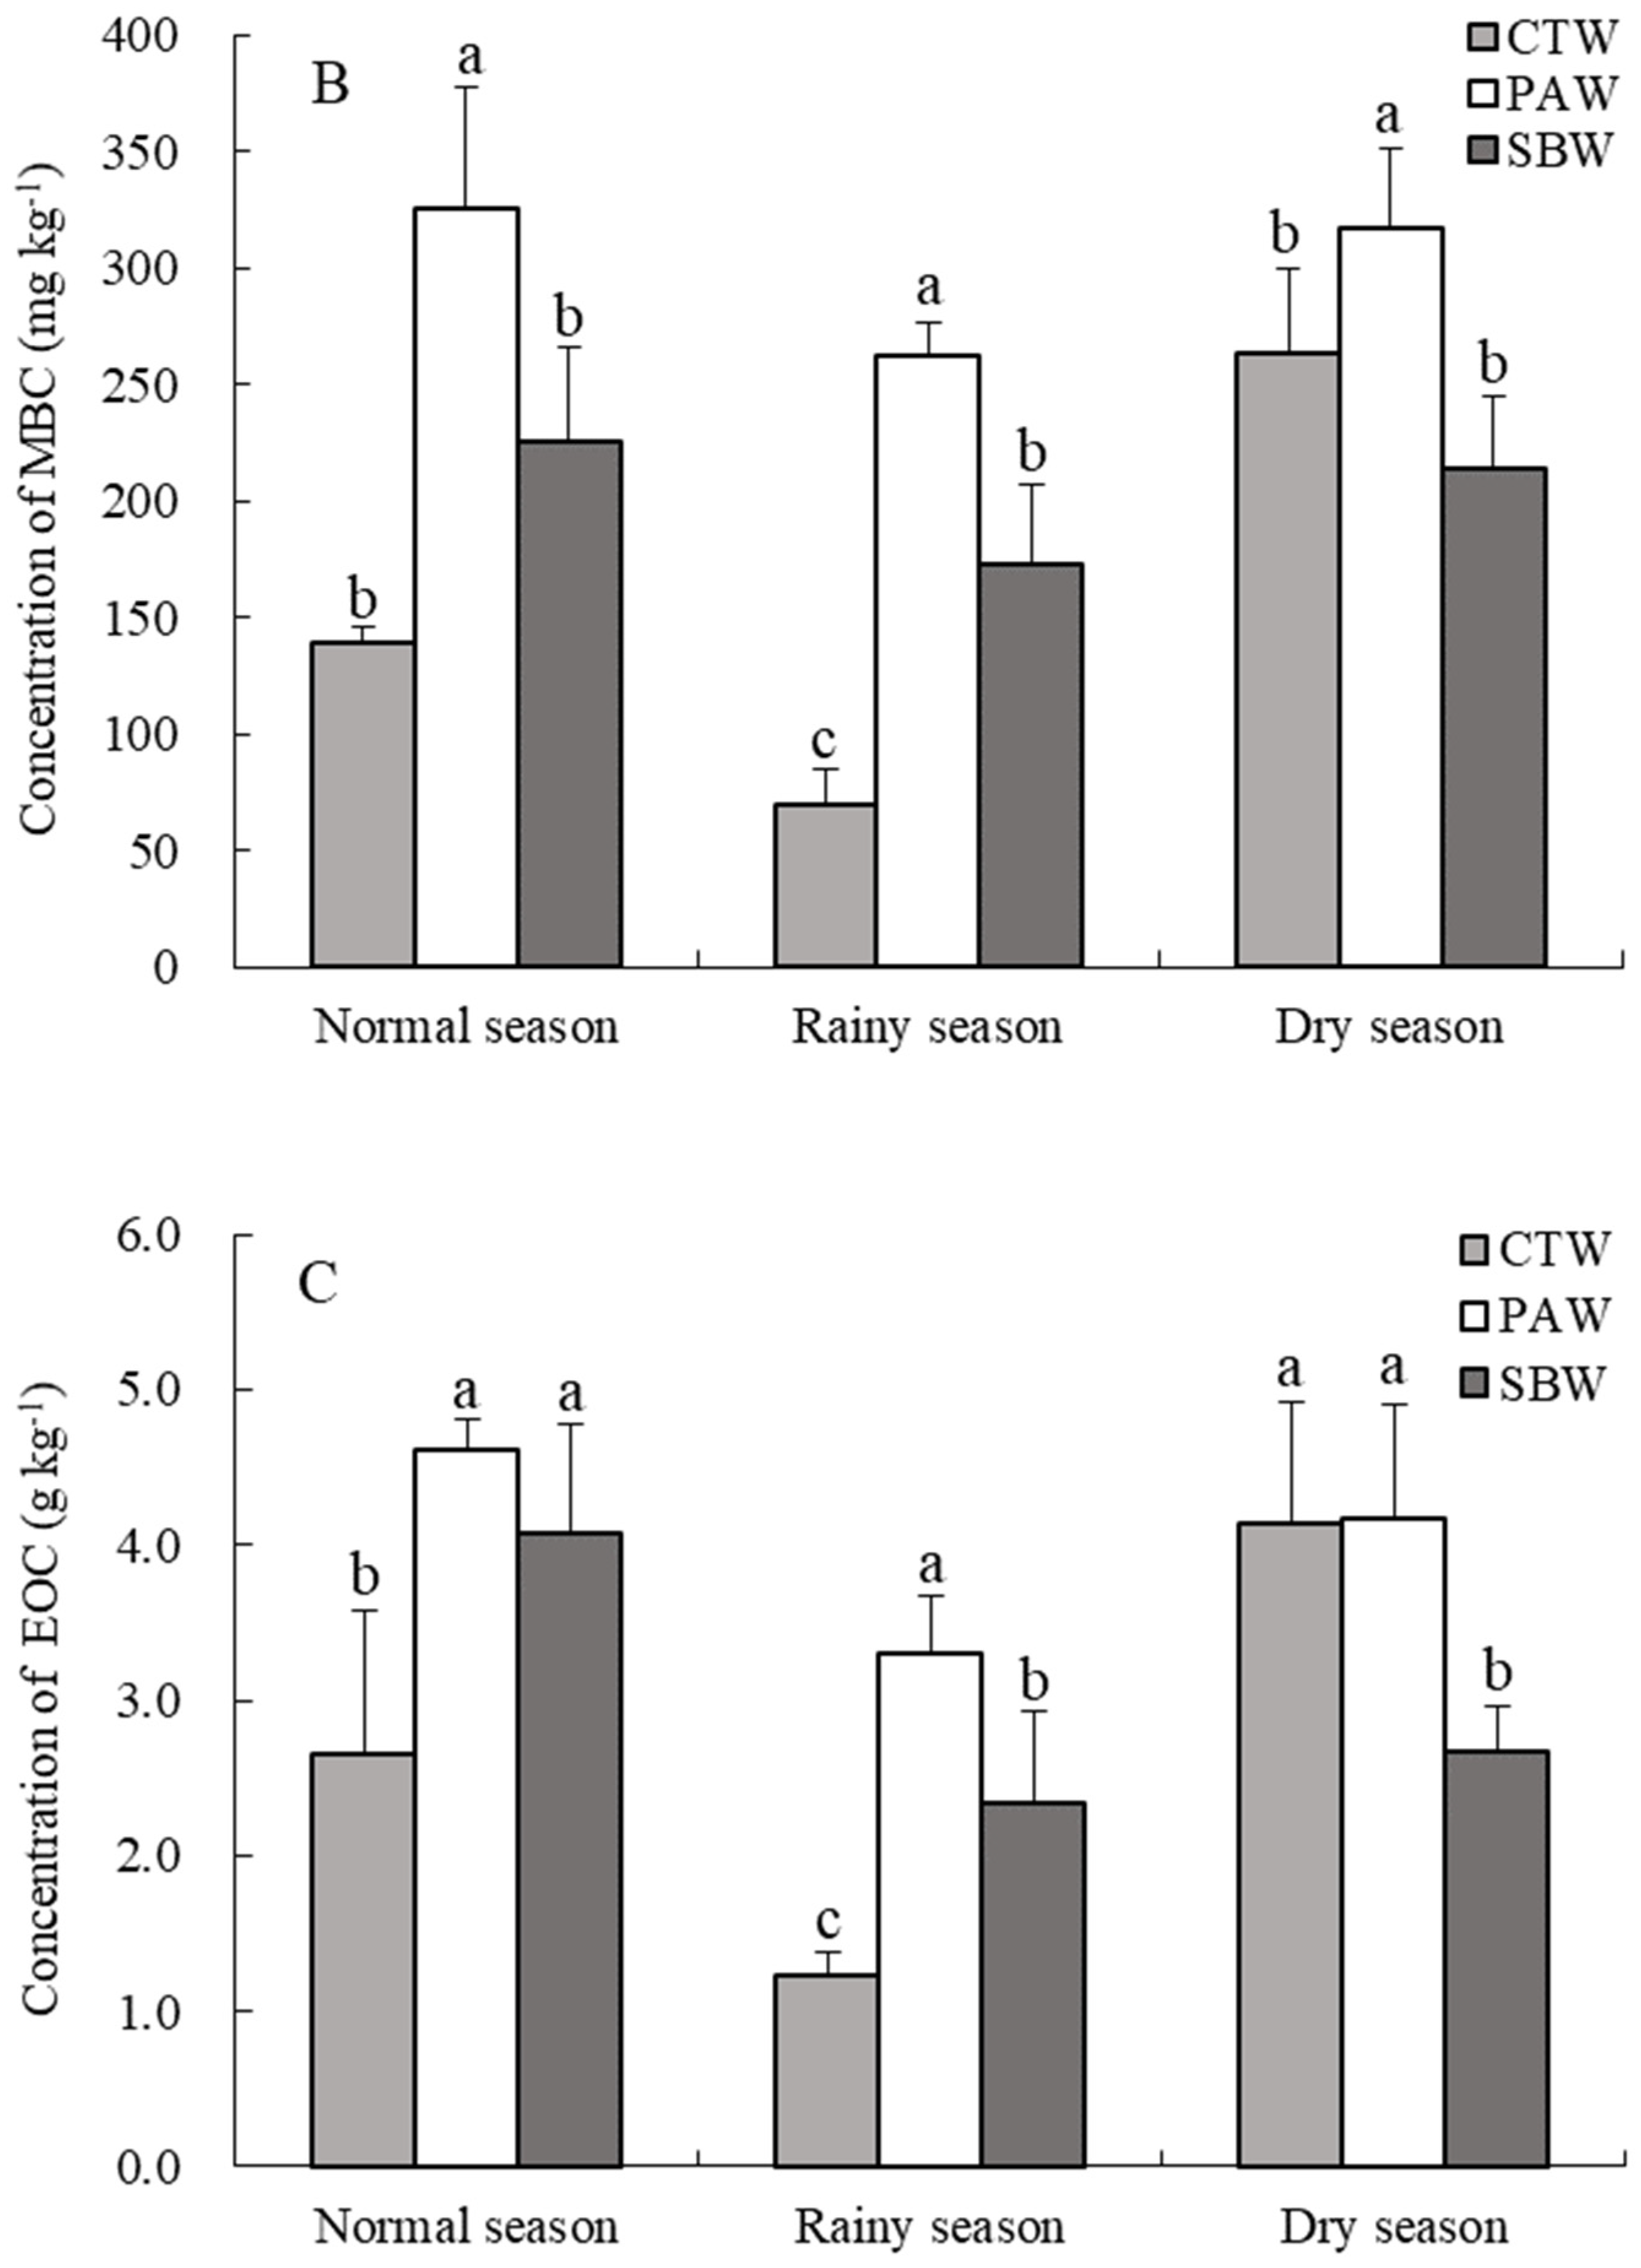
3.2. Seasonal Distribution Characteristics of Soil LOC Fractions among Wetlands

Soil LOC fractions showed clear variation corresponding with season among the different wetlands (Figure 2). As shown in Figure 2A, soil DOC content in CTW increased from the normal season to the dry season, while in PAW and SBW, soil DOC contents tended to first increase and then decrease. The minimum values of soil DOC concentrations for all wetlands were observed during the normal season. Within seasons, there was some difference in soil DOC contents among wetlands. During the normal season, soil DOC contents of the three wetlands ranged from 56.85 to 82.05 mg·kg−1, with no significant difference among them. Alternatively, soil DOC concentration in PAW was 1.89–2.23 times higher than in the other two wetlands during the rainy season. During the dry season, soil DOC concentration of CTW was 228.29mg·kg−1, significantly greater (p < 0.05) than that of PAW (184.54 mg·kg−1) and SBW (83.60 mg·kg−1).
In contrast to soil DOC content, soil MBC concentrations in the three wetlands first decreased and then increased from the normal to dry season (Figure 2B). In each water level season, the MBC concentrations of PAW were significantly higher (p < 0.05) than measurements obtained from other wetlands. Soil MBC contents in the three wetlands varied from 139.33 to 325.74 mg·kg−1 in the normal season and 214.23 to 263.30 mg·kg−1 in the dry season, which were larger than those observed in the rainy season (69.16~262.54 mg·kg−1).
Soil EOC variation characteristics were similar to those observed for soil MBC concentrations, and the lowest soil EOC concentration for all wetlands (1.23~3.30 g·kg−1) also appeared during the rainy season (Figure 2C). Soil EOC contents in PAW were the greatest for all three seasons, which was consistent with soil MBC content. Furthermore, soil EOC contents of CTW were significantly lower (p < 0.05) than that of the other two wetlands in normal and rainy seasons. Compared with CTW (4.13 g·kg−1) and PAW (4.16 g·kg−1), SBW had the lowest concentration of soil EOC (2.67 g·kg−1) during the dry season.

3.3. The Proportions of Soil DOC, MBC and EOC Content in SOC of Different Wetland Types

The proportions of soil DOC, MBC and EOC account for SOC across the different wetlands in three seasons were 0.41~1.07%, 0.70~1.86% and 12.47~26.36%, respectively (Table 2). EOC accounts for a large proportion of SOC. For all wetlands, the lowest DOC/SOC ratios were found during the normal season, while the lowest MBC/SOC and EOC/SOC ratios were observed during the rainy seasons. The ratios of DOC/SOC for all wetlands during the normal and rainy seasons were 0.41~0.47% and 0.89~1.05%, respectively, with no significant difference among the wetlands observed in these two seasons. However, the DOC/SOC ratios in CTW and PAW (1.07% and 0.91%, respectively) were significantly higher than that in SBW (0.57%) during the dry season (p < 0.05). In contrast, the ratios of MBC/SOC and EOC/SOC for the three wetlands had similar seasonal variation characteristics, both of which showed no significant differences during normal and dry seasons. Nevertheless, PAW and SBW showed greater ratios of MBC/SOC and EOC/SOC compared to CTW during the rainy season.

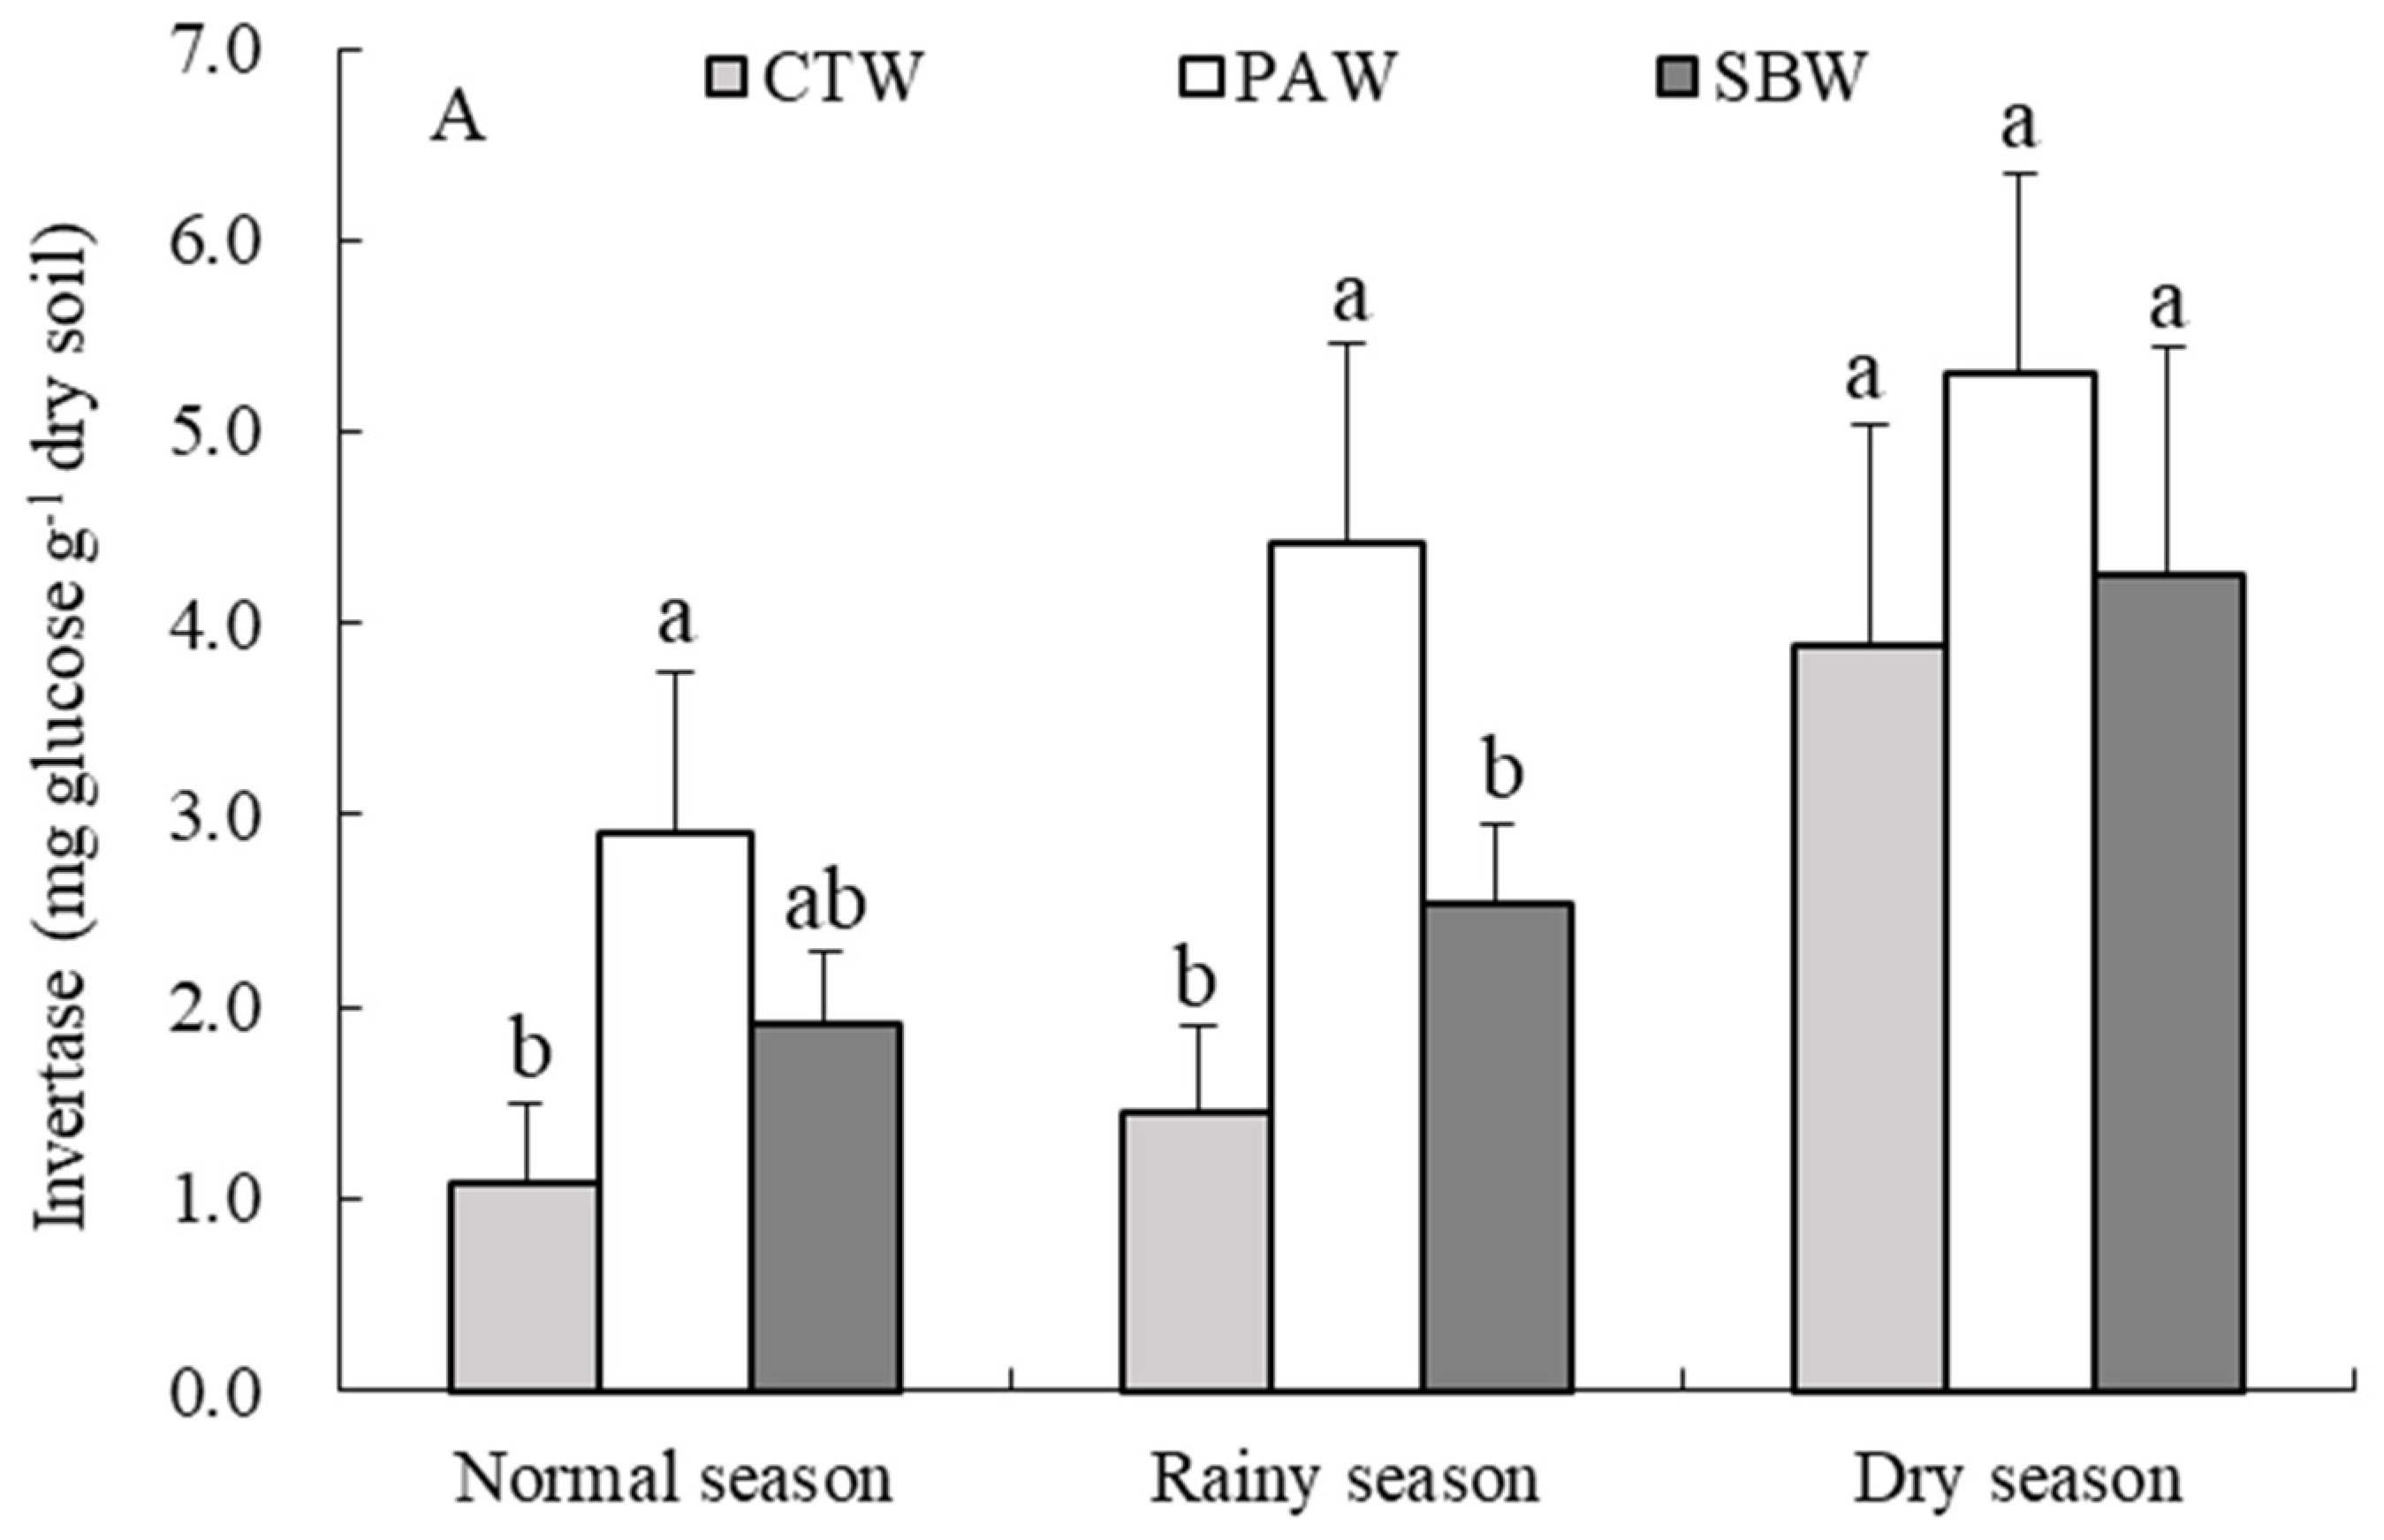
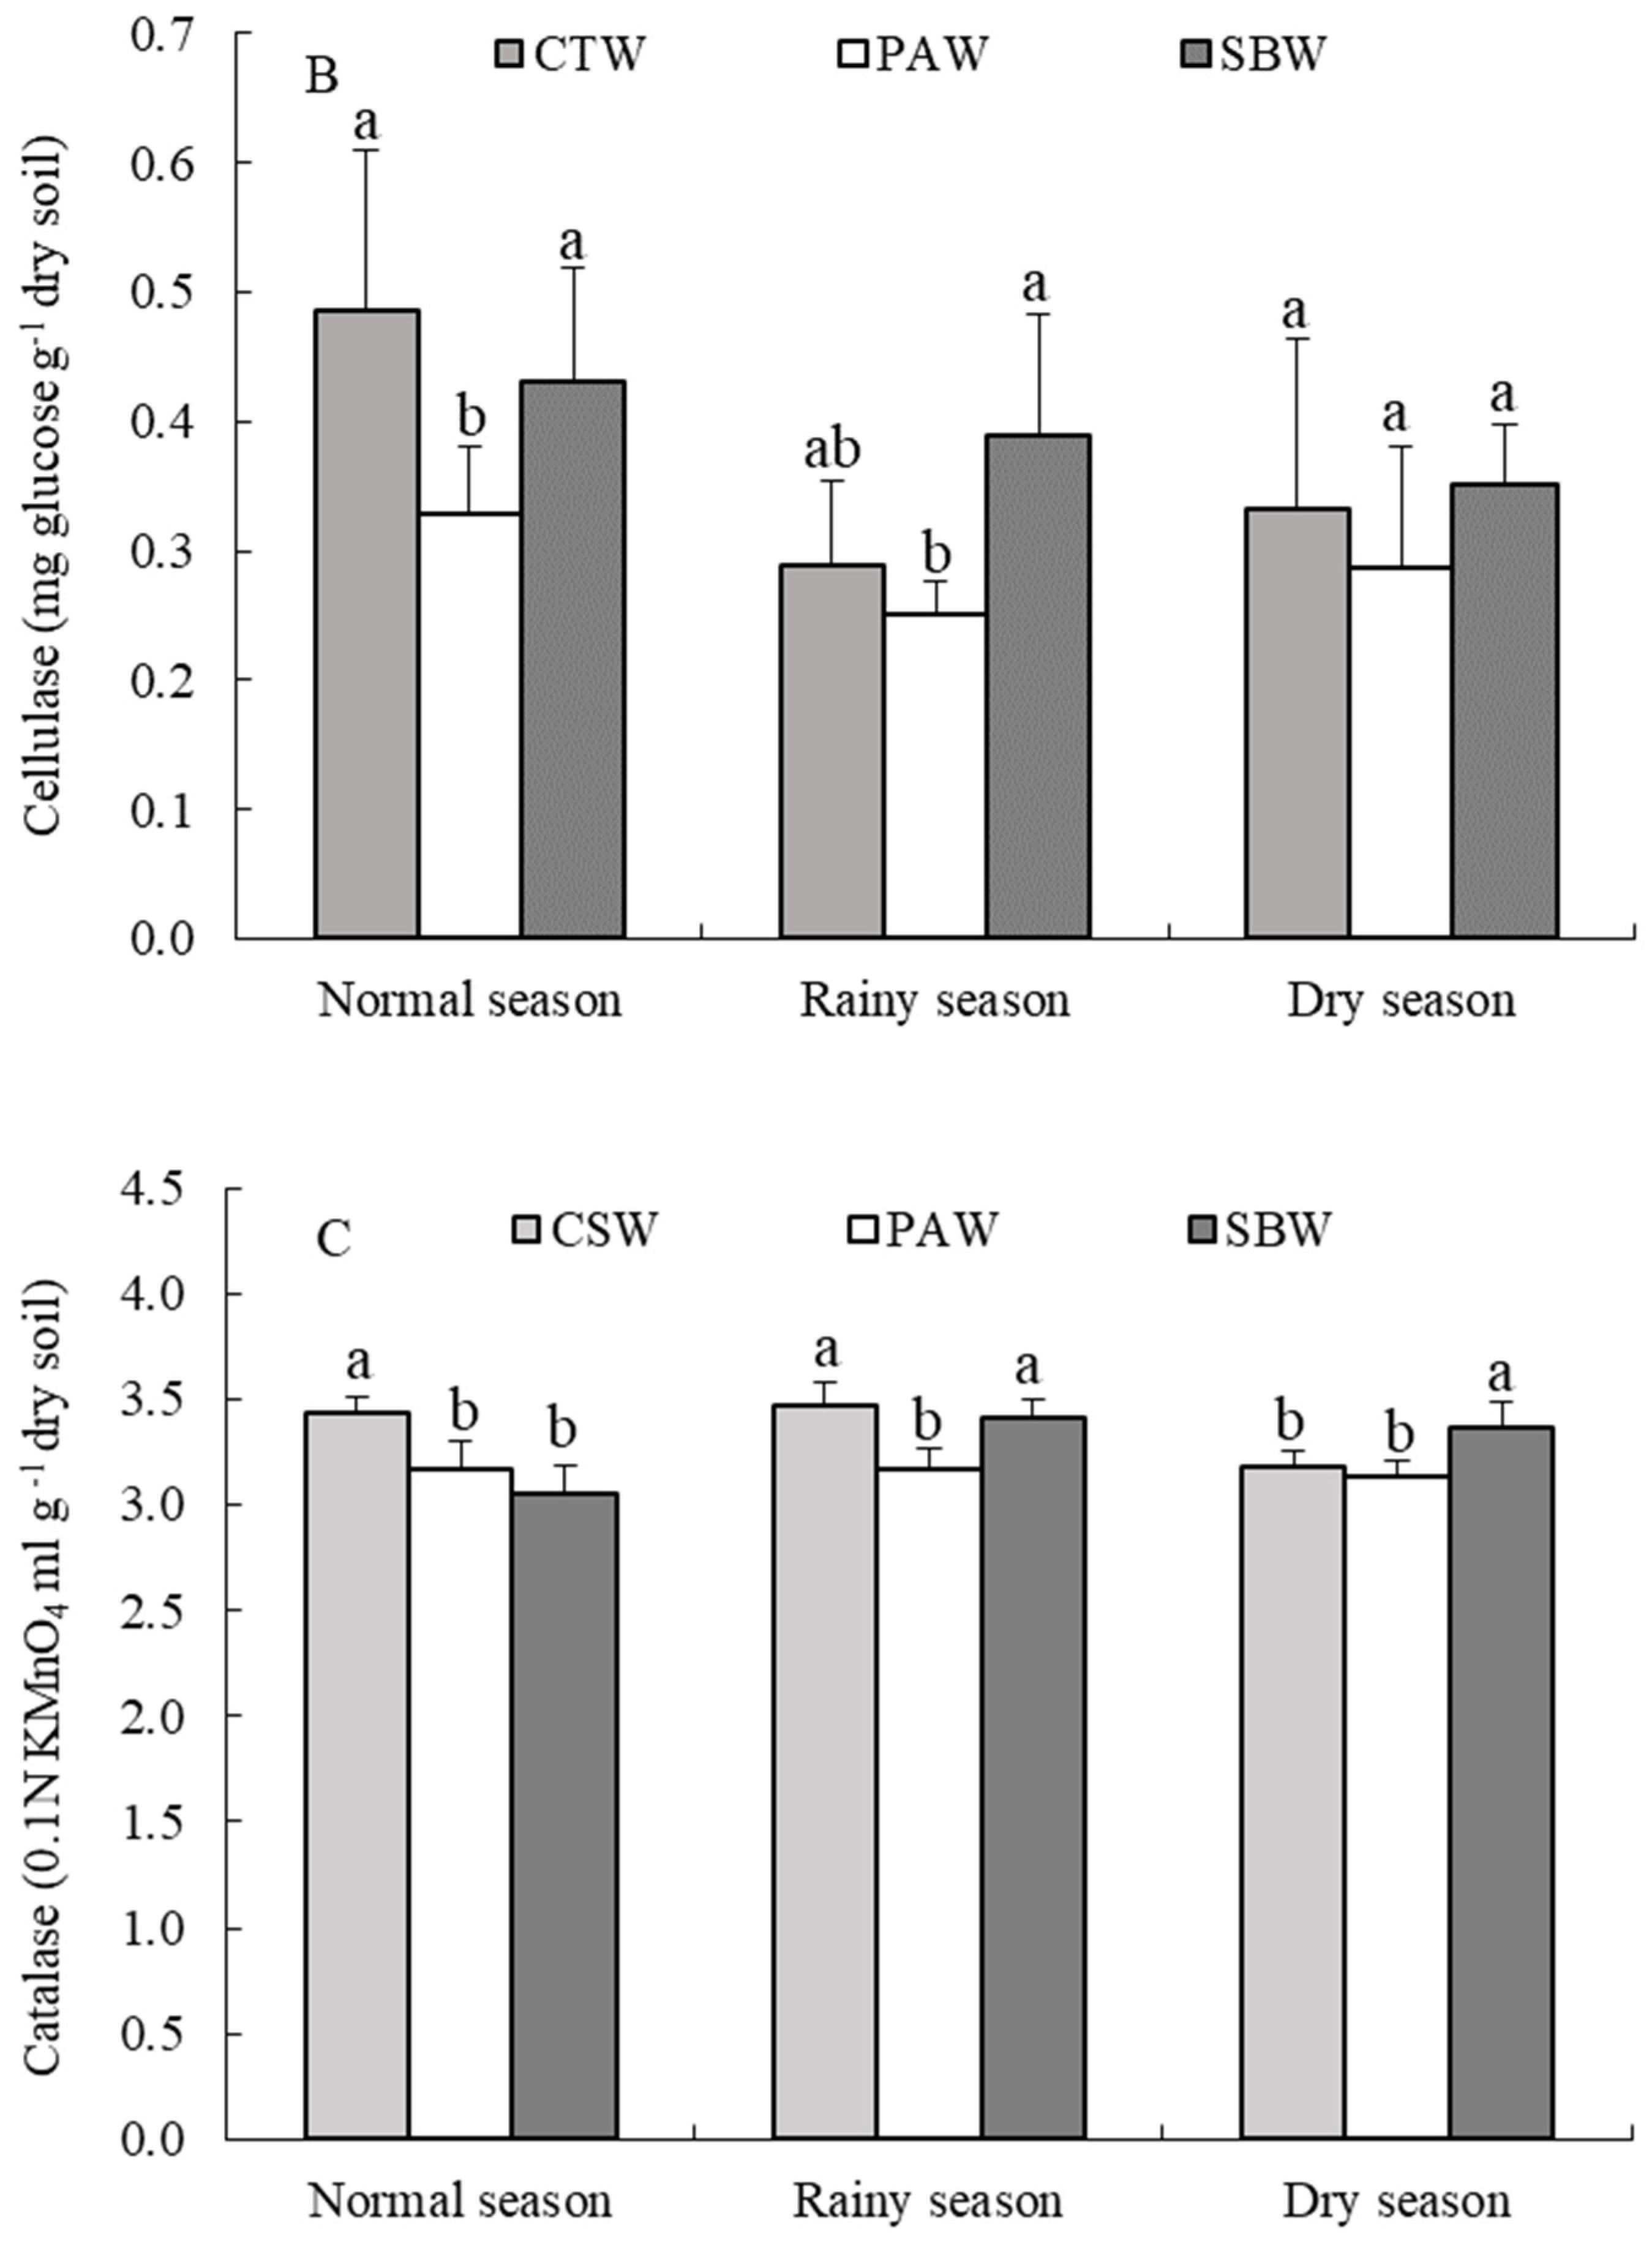
3.4. Seasonal Dynamic Changes of Soil Enzyme Activity in Different Wetland Types

The changes of enzyme activity are presented in Figure 3. Changes consisted of a general increasing trend for invertase activities in all wetlands from the normal season to the dry season (Figure 3A). Invertase activities during each season were observed in the order of CTW < SBW < PAW. Contrary to the invertase activity, it appeared 12.5–31.3% of cellulase activity was lost for all wetlands from the normal season to the dry season (Figure 3B). Cellulase activities in PAW were significant lower (p < 0.05) than in the other two wetlands during the normal and rainy seasons, but no significant difference was observed among the three wetlands during the dry season. Compared to the invertase and cellulase activities, the seasonal variation of catalase activity for all wetlands was less distinctive (Figure 3C). During the normal season, catalase activity in CTW was significantly greater than that of the other two wetlands (p < 0.05). Whereas during the rainy season, there were no significant differences in catalase activities between CTW and SBW, but they were significantly higher than PAW (p < 0.05). During the dry season, catalase activity in SBW was significantly higher than that of the other two wetlands (p < 0.05). Generally, catalase activities in the three wetlands were highest during the rainy season.

3.5. Correlation Analysis of Soil LOC Fractions with Soil Nutrient and Enzyme Activity for Different Wetlands across Three Seasons

Correlations among soil LOC fractions and soil nutrient as well as enzyme activities in the three typical wetlands during different seasonal water level periods were analyzed by Pearson’s test, and the results shown in Table 3. In terms of soil nutrients, soil LOC fractions in the three seasons were strongly correlated with SOC (p < 0.05) and positively related to TN and TP in varying degrees, while they were negatively related to TK (except MBC during the normal and dry seasons). As far as enzyme activities were concerned, there was a positive correlation between soil LOC fractions and invertase across the three seasons. In particular, correlations were significant or extremely significant during the normal and rainy seasons (p < 0.05 or p < 0.01). However, soil LOC fractions were inversely related to cellulase and catalase activities to varying degrees in the three seasons.

4. Discussion

4.1. Characteristics of Seasonal Variation in Soil LOC Fractions across Different Wetland Types

Owing to uneven silt deposition, a succession rule from aquatic to terrestrial has been formed in the lake riparian wetlands of Dongting Lake as follows: sediment beach → lake-grass beach → Phragmites australis beach → woodland wetland [22]. Under the influence of seasonal flooding, the vegetative succession of lakeside wetlands was accompanied by the change of soil properties, which further affected the migration and transformation of soil LOC fractions.
In this study, there were significant seasonal differences in soil LOC fractions in the topsoil layer of wetlands with different vegetation types. Soil DOC is easily used by microorganisms, it has some characteristics such as certain solubility, easy flow and decomposition, and high biological activity [34]. The variation of soil DOC content was caused by differences in litter, rainfall, temperature and microorganisms and varies with seasons according to previous studies [35]. Our work indicated that soil DOC contents of the three wetlands were the lowest during the normal season (May). This may be because microbial activity increased with the gradual warming temperatures during this season, which promoted the degradation of soil DOC. Furthermore, this time experiences precipitation at Dongting Lake and soil DOC is easily lost with rain. August is the rainy season in Dongting Lake and in this season adequate hydrothermal conditions greatly increased the consumption of soil DOC by microorganisms. What’s more, frequent rainfall also intensified the leaching of DOC from topsoil [36]. However, this season is a vigorous period of plant growth, and the litter input was large, increasing the rate of decomposition in hot and humid environments, which was conducive to the enrichment of soil DOC [37]. A study by Michalzik, Tipping, Mulder, et al. [38] demonstrated that the DOC released by litter accounts for about 5–30% of the total carbon content of annual litters under proper hydrothermal conditions. Compared with CSW and SBW, PAW had a large amount of root biomass, so its abundant root exudates and litter humus under the leaching of rain increased soil DOC content. Consequently, PAW showed the highest soil DOC content during the rainy season. During the dry season (December), soil DOC contents for all wetlands were higher than in the normal season. This could be because there was more plant litter in winter, from which DOC entered the soil by leaching, causing the soil DOC content to significantly increase. The other reason could be that the low temperature in winter limited microbial activities, resulting in a decrease of soil DOC degradation. In addition, the lower rainfall during this time of year may have also reduced DOC loss. Studies have shown that soil DOC concentration increases with the decrease of rainfall [39,40]. CSW and PAW had more litter, fine root biomass and root secretion in winter compared to SBW. Moreover, the litter return amount was large and easy to decompose and transform [41]. Therefore, their soil DOC contents were significantly higher than that of SBW with less flooded areas (p < 0.05).
Soil microbial biomass is directly involved in ecosystem cycling of C, N and other nutrients, and is closely related to ecosystem productivity [42]. Therefore, seasonal variation of soil MBC can reflect soil organic carbon turnover and nutrient cycling to some extent [43]. It is mainly determined by soil temperature, soil moisture, plant growth rhythm and soil available carbon and nutrient resources. In our study, soil MBC content of all wetlands were maintained at a high level in the initial stage of plant growth during the normal season, which was in agreement with the studies of Yu, [44] and Zhang, Ma, Ding, et al. [45]. This phenomenon was attributed to increased temperatures and moderate rainfall during the normal season, which not only improved substrate availability and root activity but also accelerated the decomposition of large amounts of dead roots and litter. These provided abundant nutrient sources for soil microorganisms. Moreover, the enhanced root activity also accelerated the accumulation of root exudates [46]. Smith and Paul’s, [47] have reported that root exudates and decaying roots served as abundant energy material for microorganisms. This made the activity and reproduction of microorganisms significantly increase; therefore, their metabolism accelerated and soil MBC accumulated [48]. During the rainy season, a large number of nutrients in the soil were consumed by plants during their vigorous growth period, which reduced nutrient availability of microorganisms, and the anaerobic soil environment, limiting the growth and reproduction of microorganisms. Barbhuiya, Arunachalam, Pandey, et al. [49] also concluded that the large demand for soil nutrients by plants during the rainy season limited utilization of soil nutrients by soil microorganisms, so it is intuitive that soil MBC was low in this season. Additionally, sufficient hydrothermal conditions in August enhanced microbial metabolism and accelerated turnover rate, which greatly consumed energy and thus was not conducive to the accumulation of soil MBC. Therefore, soil MBC contents of all wetlands in our study significantly decreased during the rainy season compared with the normal season. As plants entered the decay stage in the dry season, the competition for nutrients between plant roots and microbes was weakened. Furthermore, the decomposition of a large number of litters and dead roots provided sufficient nutrients for soil microorganisms, which accelerated the microorganism’s own anabolism and promoted the growth of soil microbial biomass [50]. Therefore, soil MBC contents of all wetlands increased again in the dry season. For each season, the highest soil MBC content was in PAW, which might be related to more above-ground litter and plant root biomass in this wetland. A previous relevant study showed that carbon input from litter into soil was an important factor affecting microbial biomass [51].
Soil EOC is easily oxidized and has high availability to plants and microorganisms. It mainly comes from litter decomposition and root exudates [52]. For three seasons, the lowest contents of soil EOC for all wetlands appeared in the rainy season. It could be that plant growth during the rainy season (August) requires more nutrients from the soil, accelerating the mineralization of soil organic carbon [53]. In the normal and rainy seasons, soil permeability of CTW was poor due to low terrain, leading to the decrease of microbial activity, which was not conducive to the deposition of soil EOC. While SBW showed the lowest soil EOC content during dry season, this was primarily related to the distribution of aboveground plant roots as well as the quantity and quality of litter produced. Ordinarily, Salix babylonica is a straight root system, with well-developed taprots but few fibrous roots. In addition, there was less litter in SBW, which can easily be lost with wind and rain, so the soil EOC formation in this wetland was relatively low.
In terms of seasonal fluctuations, the soil DOC content of all wetlands peaked in the rainy season (summer) and the lowest in the normal season (spring), which was consistent with the seasonal changes of soil DOC in the four wetlands in Hangzhou bay [54] and Carex lasiocarpa Calamagrostis wetland in Sanjiang Plain [55]. However, our results were the opposite to that of research conducted by Lu et al. in the Estuary wetland of Hongze Lake [56]. They concluded the DOC peaked in spring (April). Our results were attributable to seasonal precipitation fluctuations, which was the highest in summer, followed by spring, and the lowest in autumn. It has been previously indicated that Soil moisture was the main limiting factor for the variations in DOC contents and the positive correlation between DOC and soil moisture [57]. The contents of soil MBC and EOC for all wetlands in our study were the lowest in the rainy season (summer), which is similar to the results reported by Cui, Yan and Liu, et al. in the Phragmites australis wetland of Yili Valley [58]. Previous studies also observed a negative correlation between MBC and soil moisture [59,60]. The reason may be that the elevated soil water content resulted in an anaerobic environment which would limit the metabolism of aerobic microorganisms [61]. The continuous waterlogging also can markedly weaken to increase soil EOC [20]. In addition, temperature controls the organic matter decomposition rate, resulting in seasonal variations in SOC and microbial metabolism activities. Therefore, soil temperature and humidity mainly affect the soil LOC content by influencing SOC inputs and plant growth. Under different hydrothermal conditions, the quality and quantity of litter and its decomposition rate are different among different vegetation types. Therefore, the high heterogeneity of soil environment results in seasonal variation of soil LOC fractions.

4.2. The Difference in Proportions of Soil LOC Fractions in SOC among Different Wetland Types

The proportion of soil LOC fractions to total SOC can reflect the influence of water level conditions on SOC. Across the three seasons, the proportion of soil DOC in SOC for all wetlands ranged from 0.41% to 1.07%. There was little litter input and soil DOC was easily lost with rain during the normal season, so the proportions of soil DOC for all wetlands were lower than in other seasons. While during the dry season, CTW and PAW had significantly higher proportions of soil DOC than SBW (p < 0.05), which was mainly due to larger litter input.
The ratio of soil MBC to SOC (microbial entropy) reflects the conversion efficiency of soil organic matter to microbial biomass carbon, and the turnover rate of bioactive organic carbon pool [62]. Generally speaking, higher the soil microbial entropy, leads to more soil carbon accumulation, and higher quality soil. Conversely, it means that soil fertility is declining [30]. In our study, the lowest ratio of MBC to SOC was in CTW and PAW during the rainy season. This may be because these low-lying wetlands were saturated and poorly ventilated, which inhibited microbial utilization of organic carbon. However, SBW showed the lowest MBC/SOC during the normal season, so the above observation may also be related to lower litter input.
The proportion of soil EOC in SOC can reflect the stability of the SOC. The higher the ratio of EOC/SOC, the faster the nutrient cycling rate. Consequently, the SOC stability becomes worse and soil fertility decreases [63]. The ratios of soil EOC to SOC in all wetlands were higher (12.47–26.36%) than soil DOC/SOC and MBC/SOC (0.41–1.07% and 1.23–1.86%, respectively). This demonstrates that soil EOC had a shorter turnaround time than soil DOC and MBC. The ratios of EOC to SOC in all wetlands were the lowest in the rainy season, indicating that soil surface nutrients were easily lost due to frequent rainfall, which was not conducive to the accumulation of EOC. Meanwhile, soil EOC in these two seasons was unstable and easily transformed under the influence of precipitation and increasing temperature. During the rainy season, the soil EOC/SOC values in PAW and SBW were significantly higher than that in CTW (p < 0.05), indicating that the stability of SOC in PAW and SBW was poor.

4.3. Effects of Soil Nutrients and Enzyme Activity on Soil LOC Fractions

Wetlands have strong interception and filtration of nutrient elements such as carbon, nitrogen and phosphorus. Thus, it has an important effect on soil labile organic carbon pool. The results in this study showed that soil LOC fractions were positively associated with SOC, TN, and TP to varying degrees. Therefore, improving soil nutrient level is the key to increasing soil LOC accumulation. However, a negative correlation was found between soil LOC fractions and TK. Gu, Zhang, Xiang, et al. [64] also obtained the same conclusion in their study of four forest types in the central Asia tropics. Thus, TK may not be the main factor affecting the variation of soil LOC fractions.
Soil enzymes, as an important part of wetland soil, participate in the nutrient cycling process of wetland, and affect soil labile organic carbon pool to a certain extent [52]. During three seasons, soil LOC fractions in all wetlands were positively associated with invertase, but negatively correlated with cellulase and catalase. Xiao, Huang, and Lu [65] reported that soil invertase was positively correlated with soil DOC, MBC and EOC contents. Li, Zhang, Pu, et al. [66] concluded that peroxidase was a negative factor for soil LOC fractions in their research. Ma, Li, Wu, et al. [13] reported that there was no correlation between cellulase activity and SOC or MBC. This indicates that different soil enzymes contributed differently to the conversion cycle of soil labile organic carbon index in wetlands. Soil enzyme activity had a significant effect on the soil labile organic carbon pool, and invertase had the most significant effect on the labile organic carbon pool.

5. Conclusions

Our results reveal that under seasonal hydrological conditions, soil LOC fractions of different wetland types showed obvious seasonal changes, with soil nutrients and enzymes having significant effects on them. From the normal season to the dry season, soil DOC contents in all wetlands first increased and then decreased except for in CTW, while the trends observed in soil MBC and EOC in all wetlands were opposite. For all wetlands, the minimum values of soil DOC appeared during the normal season, while the lowest contents of soil MBC and EOC were found in the rainy season. Soil LOC fractions of all wetlands had positive correlations with SOC, TN, TP and invertase during the three seasons, yet negatively correlated with TK (except MBC in the normal and dry seasons) as well as cellulase and catalase activities to varying degrees. The abundance of soil nutrients determines the growth and reproduction of soil microorganisms and enzyme activities during the three studied water level seasons. Nevertheless, soil enzymes are the primary driving force of soil nutrient conversion and organic carbon metabolism. Based on our results, soil C, N, P nutrients and invertase activity profoundly affected the seasonal variation of soil LOC fractions.

Author Contributions

Conceptualization, formal analysis, investigation, writing—original draft, Y.X.; formal analysis, investigation, writing—review and editing, Y.L. (Youfeng Li) and Y.L. (Yulin Ling); investigation, writing—review and editing, H.X.; Conceptualization, formal analysis, funding acquisition, supervision, writing—review and editing, Z.H. All authors have read and agreed to the published version of the manuscript.

Funding

This study was supported by Guizhou Provincial Science and Technology Foundation (Qiankehejichu[2020]1Y194), the Youth Science and Technology talent Growth Project of Universities in Guizhou Province (Qianjiaohe KY-[2019]105), Zunyi Science and Technology Bureau Zunyi Normal University united Science Technology Research Foundation (Zunshikehe HZ-268) and Scientific Research Project of Zunyi Normal University (Zunshi BS[2019]30 and BS[2019]33).

Institutional Review Board Statement

Not applicable.

Informed Consent Statement

Not applicable.

Data Availability Statement

Not applicable.

Acknowledgments

Thanks for the help provided by the staff of Dongting Lake Wetland Ecosystem Observation and Research Station (Changsha, China). We thank Charlotte Hacker (Pittsburgh, PA, USA) for editing the English text of this manuscript.

Conflicts of Interest

The authors declare no conflict of interest.

References

  1. Mitsch, W.J.; Bernal, B.; Nahlik, A.M.; Mander, Ü.; Zhang, L.; Anderson, C.J.; Rgensen, S.E.J.; Brix, H. Wetlands, carbon, and climate change. Landsc. Ecol. 2013, 28, 583–597. [Google Scholar] [CrossRef]
  2. Perez-Rojas, J.; Moreno, F.; Quevedo, J.C.; Villa, J. Soil organic carbon stocks influvial and isolated tropical wetlands from Colombia. Catena 2019, 179, 139–148. [Google Scholar] [CrossRef]
  3. Dong, H.Y.; Qian, L.W.; Yan, J.F.; Wang, L. Evaluation of the carbon accumulation capability and carbon storage of different types of wetlands in the Nanhui tidal flat of the Yangtze River estuary. Environ. Monit. Assess. 2020, 192, 585. [Google Scholar] [CrossRef] [PubMed]
  4. Bhattacharyya, R.; Kundu, S.; Srivastva, A.K.; Gupta, H.S.; Prakesh, V.; Bhatt, J.C. Long term fertilization effects on soil organic carbon pools in a sandy loam soil of the Indian sub-Himalayas. Plant Soil 2011, 341, 109–124. [Google Scholar] [CrossRef]
  5. Silveira, M.; Comerford, N.; Reddy, K.; Cooper, W.; El-Rifai, H. Characterization of soil organic carbon pools by acid hydrolysis. Geoderma 2008, 144, 405–414. [Google Scholar] [CrossRef]
  6. Liu, X.; Rashti, M.R.; Dougall, A.; Esfandbod, M.; Zwieten, V.L.; Chen, C. Subsoil application of compost improved sugarcane yield through enhanced supply and cycling of soil labile organic carbon and nitrogen in an acidic soil at tropical Australia. Soil Tillage Res. 2018, 180, 73–81. [Google Scholar] [CrossRef]
  7. Pang, D.; Cui, M.; Liu, Y.; Wang, G. Responses of soil labile organic carbon fractions and stocks to different vegetation restoration strategies in degraded karst ecosystems of southwest China. Ecol. Eng. 2019, 138, 391–402. [Google Scholar] [CrossRef]
  8. Thaysen, E.M.; Reinsch, S.; Larsen, K.S.; Ambus, P. Decrease in heathland soil labile organic carbon under future atmospheric and climatic conditions. Biogeochemistry 2017, 133, 17–36. [Google Scholar] [CrossRef] [Green Version]
  9. Guo, J.; Wang, B.; Wang, G.B.; Wu, Y.Q.; Cao, F.L. Vertical and seasonal variations of soil carbon pools in ginkgo agroforestry systems in eastern China. Catena 2018, 171, 450–459. [Google Scholar] [CrossRef]
  10. Li, Z.Q.; Zhao, B.Z.; Hao, X.Y.; Zhang, J.B. Effects of residue incorporation and plant growth on soil labile organic carbon and microbial function and community composition under two soil moisture levels. Environ. Sci. Pollut. Res. Int. 2017, 24, 18849–18859. [Google Scholar] [CrossRef]
  11. Zhao, S.X.; Ta, N.; Li, Z.H.; Yang, Y.; Zhang, X.; Liu, D.; Zhang, A.; Wang, X.D. Varying pyrolysis temperature impacts application effects of biochar on soil labile organic carbon and humic fractions. Appl. Soil Ecol. 2018, 123, 484–493. [Google Scholar] [CrossRef]
  12. Sippo, J.Z.; Maher, D.T.; Schulz, K.G.; Sanders, C.J.; McMahon, A.; Tucker, J.; Santos, I.R. Carbon outwelling across the shelf following a massive mangrove dieback in Australia: Insights from radium isotopes. Geochim. Cosmochim. Acta 2019, 253, 142–158. [Google Scholar] [CrossRef]
  13. Ma, W.W.; Li, G.; Wu, J.H.; Xu, G.R.; Wu, J.Q. Response of soil labile orgainc carbon fractons and carbon-cycle enzyme activities to vegetation degradation in a wet meadow on the Qinghai-Tibet Plateau. Geoderma 2020, 377, 114565. [Google Scholar] [CrossRef]
  14. Zeraatpishe, M.; Khormali, F. Carbon stock and mineral factors controlling soil organic carbon in a climatic gradient, Golestan province. J. Soil Sci. Plant Nutr. 2012, 12, 637–654. [Google Scholar] [CrossRef]
  15. Soucėmarianadin, L.N.; Cecillon, L.; Guenet, B.; Chenu, C.; Baudin, F.; Nicolas, M.; Girardin, C.; Barre, P. Environmental factors controlling soil organic carbon stability in French forest soils. Plant Soil 2018, 426, 267–286. [Google Scholar] [CrossRef]
  16. Yang, X.; Wang, D.; Lan, Y.; Meng, J.; Jiang, L.L. Labile organic carbon fractions and carbon pool management index in a 3-year field study with biochar amendment. J. Soils Sediments 2018, 18, 1569–1578. [Google Scholar] [CrossRef]
  17. Liu, S.L.; Jiang, Z.J.; Deng, Y.Q.; Wu, Y.C.; Zhao, C.Y.; Zhang, J.P.; Shen, Y.; Wang, X.P. Effects of seagrass leaf litter decomposition on sediment organic carbon compositon and the key transformation processes. Sci. China-Earth Sci. 2017, 60, 2108–2117. (In Chinese) [Google Scholar] [CrossRef]
  18. Lou, X.; Zhai, S.; Kang, B.; Hu, Y.; Hu, L. Rapid response of hydrological loss of DOC to water table drawdown and warming in Zoige peatland: Results from a mesocosm experiment. PLoS ONE 2014, 9, e109861. [Google Scholar]
  19. Fenner, N.; Freemana, C.; Reynolds, B. Hydrological effects on the diversity of phenolic degrading bacteria in a peatland: Implications for carbon cycling. Soil Biol. Biochem. 2005, 37, 1277–1287. [Google Scholar] [CrossRef]
  20. Yang, C.; Yang, L.; Ou, Y.Z. Organic carbon and its fractions in paddy soil as affected by different nutrient and water regimes. Geoderma 2005, 124, 133–142. [Google Scholar] [CrossRef]
  21. Chen, X.; Chen, H.Y.; Chen, X.; Wang, J.; Chen, B.; Wang, D.; Guan, Q. Soil labile organic carbon and carbon-cycle enzyme activities under different thinning intensities in Chinese fir plantations. Appl. Soil Ecol. 2016, 107, 162–169. [Google Scholar] [CrossRef]
  22. Peng, P.Q.; Zhang, W.J.; Tong, C.L.; Wang, X.L.; Cai, C.A. Vertical distribution of soil organic carbon, nitrogen and microbial biomass C, N at soil profiles in wetlands of Dongting Lake Floodplain. J. Soil Water Conserv. 2005, 19, 49–53. (In Chinese) [Google Scholar]
  23. Hou, Z.Y.; Chen, X.S.; Xie, Y.H.; Li, X. Characteristics of soil seed bank and its relationship with aboveground vegetation in Lake Dongting. J. Lake Sci. 2012, 24, 287–293. (In Chinese) [Google Scholar]
  24. Wang, L.J.; Wang, X.; Liu, L.S.; Zheng, B.H.; Li, L.Q. Multivariate analysis of water factors in Dongting Lake. Res. Environ. Sci. 2013, 26, 1–7. (In Chinese) [Google Scholar]
  25. Liu, X.H.; Liu, Y.; Lu, S.; Guo, X.; Lu, H.; Qin, P.; Bi, B.; Wan, Z.F.; Xi, B.D.; Zhang, T.T.; et al. Occurrence of typical antibiotics and source analysis based on PCAMLR model in the East Dongting Lake, China. Ecotoxicol. Environ. Saf. 2018, 163, 145–152. [Google Scholar] [CrossRef]
  26. Chen, X.S.; Li, X.; Xie, Y.H.; Li, F.; Hou, Z.Y.; Zeng, J. Combined influence of hydrological gradient and edaphic factors on the distribution of macrophyte communities in Dongting Lake wetlands. China. Wetl. Ecol. Manag. 2014, 23, 481–490. [Google Scholar] [CrossRef]
  27. Zhou, J.; Wan, R.; Wu, X.H.; Zhang, Y. Patterns of long-term distribution of typical wetland vegetation (1987–2016) and its response to hydrological processes in Lake Dongting. J. Lake Sci. 2020, 32, 1723–1735. (In Chinese) [Google Scholar]
  28. Lu, R.K. Soil Agrochemistry and Analytical Methods; Chinese Agricultural Science and Technology Press: Beijing, China, 2000. [Google Scholar]
  29. Jones, D.L.; Willett, V.B. Experimental evaluation of methods to quantify dissolved organic nitrogen (DON) and dissolved organic carbon (DOC) in soil. Soil Biol. Biochem. 2006, 38, 991–999. [Google Scholar] [CrossRef]
  30. Muqaddas, B.; Lewis, T.; Esfandbod, M.; Chen, C.G. Responses of labile soil organic carbon and nitrogen pools to long-term prescribed burning regimes in a wet sclerophyll forest of southeast Queensland, Australia. Sci. Total Environ. 2019, 647, 110–120. [Google Scholar] [CrossRef] [PubMed]
  31. Wang, Z.; Liu, S.S.; Chang, H.; Liu, Y.; Bu, Z. Impact of land use change on profile distributions of organic carbon fractions in peat and mineral soils in Northeast China. Catena 2017, 152, 1–8. [Google Scholar] [CrossRef]
  32. Guan, S.Y. Soil Enzymes and Their Research Methods; Agriculture Press: Beijing, China, 1986. (In Chinese) [Google Scholar]
  33. Li, Z.G.; Luo, Y.M.; Teng, Y. Research Methods of Soil and Environmental Microbiology; Science Press: Beijing, China, 2008. (In Chinese) [Google Scholar]
  34. Karhu, K.; Wall, A.; Vanhala, P.; Liski, J.; Esala, M.; Regina, K. Effects of afffforestation and deforestttation on boreal soil carbon stocks: Comparison of measured C stocks with Yasso07 model results. Geoderma 2011, 164, 33–45. [Google Scholar] [CrossRef]
  35. Kalbitz, K.; Solinger, S.; Park, J.H.; Michalzik, B.; Matzner, E. Controls on the dynamics of dissolved organic matter in soils: A review. Soil Sci. 2000, 165, 277–304. [Google Scholar] [CrossRef]
  36. Kaiser, K.; Guggenberger, Q.; Haumaier, L.; Zech, W. Seasonal variations in the chemical composition of dissolved organic matter in organic forest floor layer leachates of old-growth Scots pine (Pinus sylvestris L.) and European beech (Fagus sylvatica L.) stands in northeastern Bavaria, Gennany. Biogeochemistry 2001, 55, 103–143. [Google Scholar] [CrossRef]
  37. Song, Y.Y.; Song, C.C.; Tao, B.X.; Wang, J.Y.; Zhu, X.Y.; Wang, X.W. Short-term responses of soil enzyme activities and carbon mineralization to added nitrogen and litter in a freshwater marsh of Northeast China. Eur. J. Soil Biol. 2014, 61, 72–79. [Google Scholar] [CrossRef]
  38. Michalzik, B.; Tipping, E.; Mulder, J.; Lancho, J.F.G.; Matzner, E.; Brant, C.L.; Clarke, N.; Lofts, S. Modeling the production and transport of dissolved organic carbon in forest soils. Biogeochemistry 2003, 66, 241–264. [Google Scholar] [CrossRef]
  39. Borken, W.; Ahrens, B.; Schulz, C.; Zimmermann, L. Site-to-site variability and temporal trends of DOC concentrations and fluxes in temperate forest soils. Glob. Chang. Biol. 2011, 17, 2428–2443. [Google Scholar] [CrossRef]
  40. Fu, L.C.; Xie, J.S.; Xu, C.; Lv, S.K.; Chen, T.; Liu, X.F.; Yang, Y.S. Effects of rainfall intensity on runoff and water-soluble organic carbon in Castanopsis carlesii and Cunninghamia lanceolata plantations. J. Subtrop. Resour. Environ. 2014, 9, 9–14. [Google Scholar]
  41. Chen, J.L.; Zhong, X.F.; Liu, W.J.; Lin, J.H.; Chen, Z.; Chen, G.S. Seasonal dynamics of soil dissolved organic carbon content of urban park vegetations in Fuzhou. J. Subtrop. Resour. Environ. 2016, 11, 88–94. [Google Scholar]
  42. Yang, X.; Meng, J.; Lan, Y.; Chen, W.F.; Yang, T.X.; Yuan, J.; Liu, S.N.; Han, J. Effects of maize stover and its biochar on soil CO2 emissions and labile organic carbon fractions in Northeast China. Agric. Ecosyst. Environ. 2017, 240, 24–31. [Google Scholar] [CrossRef]
  43. McGill, W.B.; Cannon, K.R.; Robertson, J.A.; Cook, F.D. Dynamics of soil microbial biomass and water-soluble organic C in Breton L. after 50 years of cropping to two rotations. Can. J. Soil Sci. 1986, 66, 1–19. [Google Scholar] [CrossRef]
  44. Yu, X.L. Interactions between Soil Microbial Biomass Carbon and Soil Enzyme Activities in Momoge National Nature Reserve. J. Northeast For. Univ. 2020, 48, 59–63. [Google Scholar]
  45. Zhang, J.; Ma, L.; Ding, X.H.; Chen, X.R.; Ma, W. Seasonal dynamics of soil microbial biomass C and N in different habitats in Zhalong Wetland. Acta Ecol. Sin. 2014, 34, 3712–3719. (In Chinese) [Google Scholar]
  46. Yuan, Y.; Zhao, Z.Q.; Li, X.Z.; Wang, Y.Y.; Bai, Z.K. Characteristics of labile organic carbon fractions in reclaimed mine soils: Evidence from three reclaimed forests in the Pingshuo opencast coal mine, China. Sci. Total Environ. 2018, 613, 1196–1206. [Google Scholar] [CrossRef] [PubMed]
  47. Smith, J.L.; Paul, E.A. The Significance of Soil Microbial Biomass Estimations. In Soil Biochemistry; Bollag, J.M., Stotzky, G., Eds.; Marcel Dekker: New York, NY, USA, 1991. [Google Scholar]
  48. Sruthi, S.N.; Ramasamy, E.V. Enrichment of soil organic carbon by native earthworms in a patch of tropical soil, Kerala, India: First report. Sci. Rep. 2018, 8, 5784. [Google Scholar] [CrossRef] [PubMed]
  49. Barbhuiya, A.R.; Arunachalam, A.; Pandey, H.N.; Arunachalam, K.; Khan, M.L.; Nath, P.C. Dynamics of soil microbial biomass C, N and P in disturbed and undisturbed stands of a tropical wetevergreen forest. Eur. J. Soil Biol. 2004, 40, 113–121. [Google Scholar] [CrossRef]
  50. Fan, Y.X.; Yang, Y.S.; Yang, Z.J.; Xie, J.S.; Chen, G.S.; Zhong, X.J.; Guo, J.F. Seasonal dynamics and content of soil labile organic carbon of mid-subtropical evergreen broadleaved forest during natural succession. Acta Ecol. Sin. 2013, 33, 5751–5759. (In Chinese) [Google Scholar]
  51. Tosi, M.; Correa, O.S.; Soria, M.A.; Vogrig, J.A.; Sydorenko, O.; Montecchia, M.S. Land-use change affectes the functionality of soil microbial communities: A chronosequence approach in the Argentinian Yungas. Appl. Soil Ecol. 2016, 108, 118–127. [Google Scholar] [CrossRef]
  52. Wang, H.Y.; Wu, J.Q.; Li, G.; Yan, L.J. Changes in soil carbon fractions and enzyme activities under different vegetation types of the northern Loess Plateau. Ecol. Evol. 2020, 10, 12211–12223. [Google Scholar] [CrossRef]
  53. Bucheridge, K.M.; Banerjee, S.; Siciliano, S.D.; Grogan, P. The seasonal pattern of soil microbial community structure in mesic low arctic tundra. Soil Biol. Biochem. 2013, 65, 338–347. [Google Scholar] [CrossRef]
  54. Shao, X.; Yang, W.; Wu, M. Seasonal Dynamics of Soil Labile Organic Carbon and Enzyme Activities in Relation to Vegetation Types in Hangzhou Bay Tidal Flat Wetland. PLoS ONE 2015, 10, e0142677. [Google Scholar]
  55. Wan, Z.M.; Song, C.C.; Yang, G.S.; Huang, J.Y.; Wang, L.L.; Li, Y.C. The active soil organic carbon fraction and its relationship with soi lenzyme activity in different types of marshes in the Sanjiang Plain. Acta Sci. Circumst. 2009, 29, 406–412. (In Chinese) [Google Scholar]
  56. Lu, Y.; Xu, H. Distribution characteristic of soil organic carbon fraction in different types of wetland in Hongze Lake of China. Sci. World J. 2014, 2014, 487961. [Google Scholar] [CrossRef]
  57. Sugihara, S.; Funakawa, S.; Kilasara, M.; Kosaki, T. Effect of land management and soil texture on seasonal variations in soil microbial biomass in dry tropical agroecosystems in Tanzania. Appl. Soil Ecol. 2010, 44, 80–88. [Google Scholar] [CrossRef]
  58. Cui, D.; Yan, J.J.; Liu, H.J.; Chen, C. Soil labile organic carbon fractions and the differences of their concentrations in different types of wetlands in Yili valley. Chin. J. Ecol. 2019, 38, 2087–2093. (In Chinese) [Google Scholar]
  59. Huo, L.; Pang, H.; Zhao, Y.; Wang, J.; Lu, C.; Li, Y. Buried straw layer plus plastic mulching improves soil organic carbon fractions in an arid saline soil from Northwest China. Soil Tillage Res. 2017, 165, 286–293. [Google Scholar] [CrossRef]
  60. Ross, D.J. Soil microbial biomass estimated by the fumigation-incubation procedure: Seasonal fluctuations and influence of soil moisture content. Soil Biol. Biochem. 1987, 19, 397–404. [Google Scholar] [CrossRef]
  61. Wang, L.X.; Yan, B.X.; Prasher, S.O.; Ou, Y.; Bian, Y.; Cui, H. The response of microbial composition and enzyme activities to hydrological gradients in a riparian wetland. J. Soil Sediment. 2019, 19, 4031–4041. [Google Scholar] [CrossRef]
  62. García-Díaz, A.; Marqués, M.J.; Sastre, B.; Bienes, R. Labile and stable soil organic carbon and physical improvements using groundcovers in vineyards from central Spain. Sci. Total Environ. 2018, 621, 387–397. [Google Scholar] [CrossRef] [Green Version]
  63. Zhao, Z.Z.; Li, Y.; Zhao, Z.Y.; Xing, Y.L.; Liu, Y.Y. Effects of Land Use Patterns on Soil Organic Carbon and Easily Oxidized Organic Carbon in the Eastern Part of Hainan Island. Trop. Geogr. 2019, 39, 144–152. [Google Scholar]
  64. Gu, X.; Zhang, S.J.; Xiang, W.H.; Li, L.D.; Liu, Z.D.; Sun, W.J.; Fang, X. Seasonal dynamics of active soil organic carbon in four subtropical forests in Southern China. Chin. J. Plant Ecol. 2016, 40, 1064–1076. [Google Scholar]
  65. Xiao, Y.; Huang, Z.; Lu, X. Changes of soil labile organic carbon fractions and their relation to soil microbial characteristics in four typical wetlands of Sanjiang plain, Northeast China. Ecol. Eng. 2015, 82, 381–389. [Google Scholar] [CrossRef]
  66. Li, S.; Zhang, S.R.; Pu, Y.L.; Li, T.; Xu, X.X.; Jia, Y.X.; Deng, O.P.; Gong, G.S. Dynamics of soil labile organic carbon fractions and C-cycle enzyme activities under straw mulch in Chengdu Plain. Soil Tillage Res. 2016, 155, 289–297. [Google Scholar] [CrossRef]
Figure 1. The sketch map of the location of the study area.
Sustainability 13 13836 g001
Figure 2. Seasonal dynamic changes of soil labile organic carbon fractions in the study areas. Notes: Different lower-case letters above the error bar represent significant difference among three wetlands in the same season at the 0.05 level.
Sustainability 13 13836 g002aSustainability 13 13836 g002b
Figure 3. Seasonal dynamic changes of soil enzymatic activities in the three wetlands. Note: Different lower-case letters (a,b) above the error bar represent significant difference among three wetlands in the same season at the 0.05 level.
Sustainability 13 13836 g003aSustainability 13 13836 g003b
Table 1. The physical-chemical properties found in 0–20 cm soil layer of the three typical wetlands during three water level seasons.
Water Level
Periods
SitepHMoisture
(g·100g−1)
SOC
(g·kg−1)
TN
(g·kg−1)
TP
(g·kg−1)
TK
(g·kg−1)
C/N Ratio
Normal seasonCTW7.9 ± 0.05 a36.7 ± 8.19 a11.98 ± 2.76 a1.10 ± 0.12 b0.95 ± 0.04 a22.30 ± 2.23 a10.89 ± 1.15 a
PAW7.8 ± 0.09 a33.3 ± 2.88 a17.56 ± 4.30 a1.79 ± 0.21 a1.02 ± 0.02 a24.57 ± 0.70 a9.81 ± 1.09 a
SBW7.7 ± 0.20 a30.1 ± 5.46 a15.33 ± 4.55 a1.68 ± 0.23 a0.98 ± 0.07 a22.41 ± 2.72 a9.13 ± 0.96 a
Rainy seasonCTW7.9 ± 0.00 a44.9 ± 2.32 a9.88 ± 1.40 b0.93 ± 0.03 b0.92 ± 0.02 b25.20 ± 1.03 a10.62 ± 1.29 a
PAW7.7 ± 0.00 b40.2 ± 1.89 b19.47 ± 1.12 a1.67 ± 0.10 a1.01 ± 0.05 a23.08 ± 0.94 ab11.66 ± 1.05 a
SBW7.8 ± 0.03 a35.2 ± 0.45 c13.00 ± 2.70 b1.18 ± 0.27 b0.91 ± 0.01 b21.51 ± 0.44 b11.02 ± 1.00 a
Dry seasonCTW7.7 ± 0.00 a34.0 ± 3.93 a21.38 ± 1.67 a1.80 ± 0.14 a1.00 ± 0.06 a20.56 ± 0.97 b11.88 ± 0.43 a
PAW7.6 ± 0.03 b33.2 ± 0.27 a20.38 ± 3.20 a1.98 ± 0.31 a1.04 ± 0.01 a23.94 ± 0.57 a10.29 ± 1.27 a
SBW7.7 ± 0.02 a28.0 ± 2.43 a14.68 ± 2.43 b1.35 ± 0.11 b0.93 ± 0.02 b23.14 ± 1.26 a10.87 ± 0.84 a
Note: By column, the letter (a–c) indicates a significant difference at p < 0.05 in the same season. CTW: Carextristachya wetland; PAW: Phragmites australis wetland; SBW: Salix babylonica wetland. SOC, total organic carbon; TN, total nitrogen; TP, total phosphorus. TK, total kalium.
Table 2. The proportion of soil DOC, MBC and EOC content in SOC at a 0–20 cm depth in different wetland types.
SeasonsWetland TypesDOC/SOC
(%)
MBC/SOC
(%)
EOC/SOC
(%)
Normal season
(May)
CTW0.47 ± 0.08 a1.16 ± 0.21 a22.18 ± 1.24 a
PAW0.47 ± 0.05 a1.86 ± 0.35 a24.99 ± 2.03 a
SBW0.41 ± 0.07 a1.30 ± 0.14 a26.36 ± 2.87 a
Rainy season
(August)
CTW0.93 ± 0.10 a0.70 ± 0.09 b12.47 ± 2.56 b
PAW1.05 ± 0.24 a1.40 ± 0.12 a16.97 ± 1.65 a
SBW0.89 ± 0.13 a1.25 ± 0.14 a17.92 ± 1.02 a
Dry season
(December)
CTW1.07 ± 0.22 a1.23 ± 0.11 a19.32 ± 1.86 a
PAW0.91 ± 0.18 a1.55 ± 0.24 a20.43 ± 2.03 a
SBW0.57 ± 0.07 b1.46 ± 0.18 a18.16 ± 1.11 a
Note: Lower case letters (a,b) indicate the difference among different wetland types in the same season (p < 0.05).
Table 3. Correlation analysis between soil LOC fractions and SOC, soil nutrients, enzyme actives.
SeasonsLOC FractionsSOCTNTPTKInvertaseCellulaseCatalase
Normal seasonDOC0.977 **0.879 **0.624−0.1160.854 **−0.407−0.495
MBC0.500 *0.669 *0.4960.3820.779 *−0.757 *−0.640
EOC0.722 *0.739 *0.702 *−0.1770.583 *−0.430−0.850 **
rainy seasonDOC0.980 **0.922 **0.921 **−0.2190.867 **−0.577−0.850 **
MBC0.817 **0.863 **0.709 *−0.693 *0.809 **−0.086−0.755 *
EOC0.934 **0.951 **0.762 *−0.5170.848 **−0.314−0.774 *
Dry seasonDOC0.810 **0.695 *0.620−0.4670.155−0.230−0.773 *
MBC0.477 *0.4980.803 **0.3110.493−0.275−0.731 *
EOC0.821 **0.6230.797 *−0.0760.258−0.202−0.910 **
Note: ** Correlation is significant at the 0.01 level; * Correlation is significant at the 0.05 level.
Publisher’s Note: MDPI stays neutral with regard to jurisdictional claims in published maps and institutional affiliations.

