The results of this study were analyzed from two different approaches. First, we employed a multidimensional analysis to evaluate, through the regressions, the impact of the different variables in the pedagogical model Flipped Learning and the methodologies Project-Based Learning and Gamification. The second analysis evaluated the associations between the most relevant variables of the study, because of their weight in the selected pedagogical choices and the general profile of the mathematics teacher in the A.C. of Melilla, according to the scores in the variables of greater impact.
3.1. Analysis of the Study´s Pedagogical Choices
This first analysis sought to identify the study variables that had a significant influence on each of the study´s pedagogical choices. To do this, a regression analysis was applied using numerical variables. In this way, an answer is given to RQ1: Which variables of the study had the most influence on the selection of the pedagogical model and the methodologies analyzed?
Table 3,
Table 4 and
Table 5 illustrate the most significant variables and their level of correlation.
The statistical analysis in
Table 4 shows that the model is significant for indicator items B2, (F(6,11) = 4.392,
p < 0.05); C.1, (F(7,10) = 5.722,
p < 0.05); C2, (F(7,10) = 2.438,
p < 0.05), that is, it is a reliable predictor of the scores obtained in the selection of the FPL model. In addition, the present model with the items VED, EAA, and ODA of indicator B.2 Teaching Practice explains 54.49% of the variability of the response (R2). It is noteworthy that a single item, FCW of indicator C.1, ICT Training, predicts 66.04%. In contrast, PCD of indicator C.2, ICT and Teaching, explains 37.19%. These results suggest that 62.81% of the variance in the choice of the FPL model cannot be explained with the variables employed and that there must be other variables that also influence the results.
A more in-depth analysis of
Table 4 shows that the largest number of items that correlate very significantly with this pedagogical model is 3: VED, EAA, and ODA, corresponding to indicator B.2 “Teaching Practice”. Significant negative correlations are observed with teaching approaches, student assessment in a broad sense, and the time spent preparing digital content. In this sense, Sanchez-Rodriguez et al. (2017), argued that the overexertion in the preparation of the contents limits the use of the Flipped Learning model [
32]. Furthermore, the results of “A high ratio in the classroom makes my teaching practice difficult”, seem to confirm that it did not significantly impact the election of the Flipped Learning model. Contrary to this study’s results, the literature postulates that this methodology favors the personalization of the teaching–learning processes [
23].
Another result suggests that the scores of the items of the indicators C.1 “ICT Training” and C.2 “ICT and Teaching” had little weight in the Flipped Learning model. In fact, the findings of this study show a significant positive correlation only in the training for the creation of web pages. The rest of the training options for the mathematics teacher, the use of technologies for the preparation of contents, and for teaching practice in the classroom had little significant impact on the choice of this model. Furthermore, the data obtained for indicators C.5 “Communication and Collaboration” and D.3 “ICT in the Classroom” indicate a weak correlation between the mathematics teacher’s use of technology for communication and collaboration among the educational community and the choice of the Flipped Learning model for teaching mathematics; however, the literature highlights the importance of technology for this methodology [
22] by transferring the work of certain learning processes outside the classroom [
20] and providing students with resources at any time for their learning [
35]. Despite the positive assessment, some authors maintain that the effect on student and teacher satisfaction is moderate [
31]. Other authors also highlighted other disadvantages associated with the teacher’s perception and the students’ capacity and economic resources [
32].
The statistical analysis in
Table 5 shows that the model is significant for the items of indicators B.2, (F(6,11) = 9.635,
p < 0.05); C.5, (F(6,11) = 3.437,
p < 0.05); D.3 (F(5,12) = 4.252,
p < 0.05), that is, it is a reliable predictor of the scores obtained in the election of the FPL model. It is noteworthy that the VED and MTM items of indicator B.2 “Teaching Practice” explain 75.29% of the variability of the response (R2). In contrast, CIC and PPT of indicator C.5 “Communication and Collaboration” predict 46.24% and PEM and SEA of indicator D.3 “ICT in the Classroom” explain 48.89%. These results suggest that around 50% of the variation in the choice of the FPL model cannot be explained by the variables used in indicators C.5 and D.3, and that, therefore, there must be other variables that also contribute.
An unexpected finding was that only two VED and MTM items of indicator B.2 “Teaching Practice” had a significant negative influence on Project-Based Learning. In addition, this study found that other factors associated with teaching practice did not have a significant weight in this methodology. These data should be interpreted with caution since they seem contradictory. On the other hand, a high ratio did not have a significant impact on this methodology either. Along the same lines as our findings, the literature postulates that the assessment of the Project-Based Learning against traditional methodology, even if it is positive, does not depend on the educational level or the ratio, although geographic factors, as well as available ICT resources and the commitment by teachers and students, do influence it [
54].
However, the results of this study show that the participation in educational projects of the center, related to technologies and the exchange of information and digital content associated with the indicator C.5 “Communication and Collaboration” and the use of educational software to teach mathematics related to the indicator D.3 “ICT in the Classroom” has a significant influence on the choice of Project-Based Learning. Along the same lines, other authors maintain that Project-Based Learning integrates, in a practical way, values such as cooperation and organization [
54]. This methodology can coexist with the traditional model, combining the teacher’s expository work with practical collaborative work [
56].
Nevertheless, our findings show that the use of online communication tools, blogs, and wikis to develop learning and educational platforms did not have a relevant weight in this methodology. Nor was there any significant correlation between this methodology with the use of Interactive Whiteboard tools or software or virtual learning environments (Moodle, WebCT...) to teach mathematics and the use of computers, laptops, and tablets, to learn or review mathematics. Several authors highlight that Project-Based Learning requires a high dedication to design and develop projects [
60]. Consequently, there is a low level of creativity and originality in their work [
57].
Likewise, the absence of items from the indicators C.1 “ICT Training” and C.2 “ICT and Teaching” suggests that the ICT training and the use of technologies by the mathematics teacher for the preparation of contents and in their teaching practice in the classroom had little significant impact on the choice of this methodology. On the other hand, some authors maintain that this methodology represents, for the teacher, a high dedication, training, and time to improve self-efficacy [
60]. Along the same lines, the importance of this methodology for teaching appears in the LOMCE curriculum, regarding the Spanish educational system, as a tool to promote learning to and help students to achieve competence in all subjects.
The statistical analysis in
Table 6 shows that the model is significant for the items of indicators B.2 and B.3, (F(6,11) = 3.543,
p < 0.05); C2, (F(7,10) = 2.370,
p < 0.05); D.3, (F(5,12) = 3.238,
p < 0.05), that is, it is a reliable predictor of the scores obtained in the election of the FPL model. It is noteworthy that the items VED and OAA of indicator B.2 “Teaching Practice” and RPD of indicator B.3 “Ratio”, explain only 47.30% of the variability of the response (R2). On the other hand, the UHD of indicator C.2 “ICT and Teaching” predicts 36.07%, and the EVA of Indicator D.3 “ICT in the Classroom” explains 36.69%. These results suggest that around 60% of the variation in the choice of the GML model cannot be explained by the variables used in indicators B2, B3, C2, and D.3, and that, therefore, there must be other variables that also contribute.
The present study’s findings show that the use of tools for online communication, blogs, and wikis to develop learning platforms, as well as the use of educational software to teach mathematics related to indicator D.3 “ICT in the Classroom”, did not have a relevant weight in this methodology; however, the use of educational platforms related to indicator D.3 “ICT in the Classroom” had a significant influence on the choice of Gamification. In this sense, the literature maintains that the teacher is fundamental in applying Gamification with the appropriate pedagogical criteria and obtaining a significant positive impact on the students’ mathematical learning [
70]; however, in our findings, the use of tools for online communication, blogs, and wikis to develop learning platforms and the use of educational software to teach mathematics did not have a relevant weight in this methodology.
No significant correlation was found between this methodology and the use of Interactive Whiteboard tools or software, virtual learning environments (Moodle, WebCT, etc.) to teach mathematics, and the use of computers, laptops, and tablets to learn or review mathematics. In this sense, some authors suggest applying this methodology without using technologies by applying the mechanics of the game to motivate and involve students [
66]; however, some authors maintain that the divergence between the virtual and real worlds could limit the use of Gamification by teachers [
77].
On the other hand, the absence of items from the C.1 “ICT Training” indicators suggests that whether the mathematics teacher had undergone ICT training had little significant impact on the choice of this methodology. Likewise, the data obtained related to indicator C.5 “Communication and Collaboration” could indicate that the use of technologies by the mathematics teacher for communication and collaboration among the educational community did not have a significant impact on Gamification either. Nevertheless, several authors argue that preservice teachers, trained in technologies, consider this methodology adequate for teaching mathematics [
71]. On the other hand, the literature postulates that the use of this methodology is dependent upon the costs derived from the educational games and the technological resources necessary [
68].
Based on the overall results, these data should be interpreted with caution since there are wide variations in the effect of some study variables on the choice of models and methodologies analyzed in this study. Contrary to expectations, the most determining value of teaching practice had a significant negative correlation in all methodologies. On the other hand, this study did not provide evidence of the significant influence of training on the Flipped Learning model, Project-Based Learning, and Gamification Methodologies, nor does it show the impact of technology used for educational purposes by the mathematics teacher as a determining factor. Several reasons could explain these surprising and apparently contradictory results: (1) due to the use of a traditional methodology for teaching mathematics by the mathematics teachers in the A.C. of Melilla; (2) due to a lack of knowledge on the part of teachers about the Flipped Learning model and active methodologies PBL and GML; (3) due to confusion about the terms used, which is associated with low digital competence.
In this sense, the mathematics teacher is fundamental and must be trained and updated on the use of tools and resources proper to mathematics teaching [
5], establishing pedagogical links between contents and technologies through “instrumental genesis” [
6]. It is a laborious process for the teacher that requires time [
8]. In this sense, the teacher has the ability and responsibility to properly integrate ICTs into teaching mathematics (Forsstrom, 2019).
On the other hand, a global analysis shows that the indicators that most influenced the Flipped Learning model and the Project-Based Learning and Gamification methodologies were B.2 “Teaching Practice”, followed by the dimension C.5 “Communication and Collaboration” and D.3 “ICT in the Classroom”. The least impactful indicators were C.1 “ICT Training” and C.2 “ICT and Teaching”. We can interpret these results as follows: the choice of the model and active methodologies by mathematics teachers in the A.C. of Melilla has been influenced by variables associated with teaching practice, communication, and collaboration through technologies and the use of ICTs in the classroom. On the other hand, variables related to technology training and ICT skills in teaching practice did not have a significant impact on the choice of the Flipped Learning model and Project-Based Learning and Gamification methodologies by mathematics teachers in the A.C. of Melilla. These results differ from some published studies, which affirm the fact that collaborative learning benefits from any of the active methodologies through technologies, as in the case of the Flipped Learning model for teacher training [
34] and the students [
35]. Nevertheless, the values of cooperation and collaboration are also integrated into Project-Based Learning [
54,
56] and Gamification [
24].
3.2. Analysis of the Study Variables
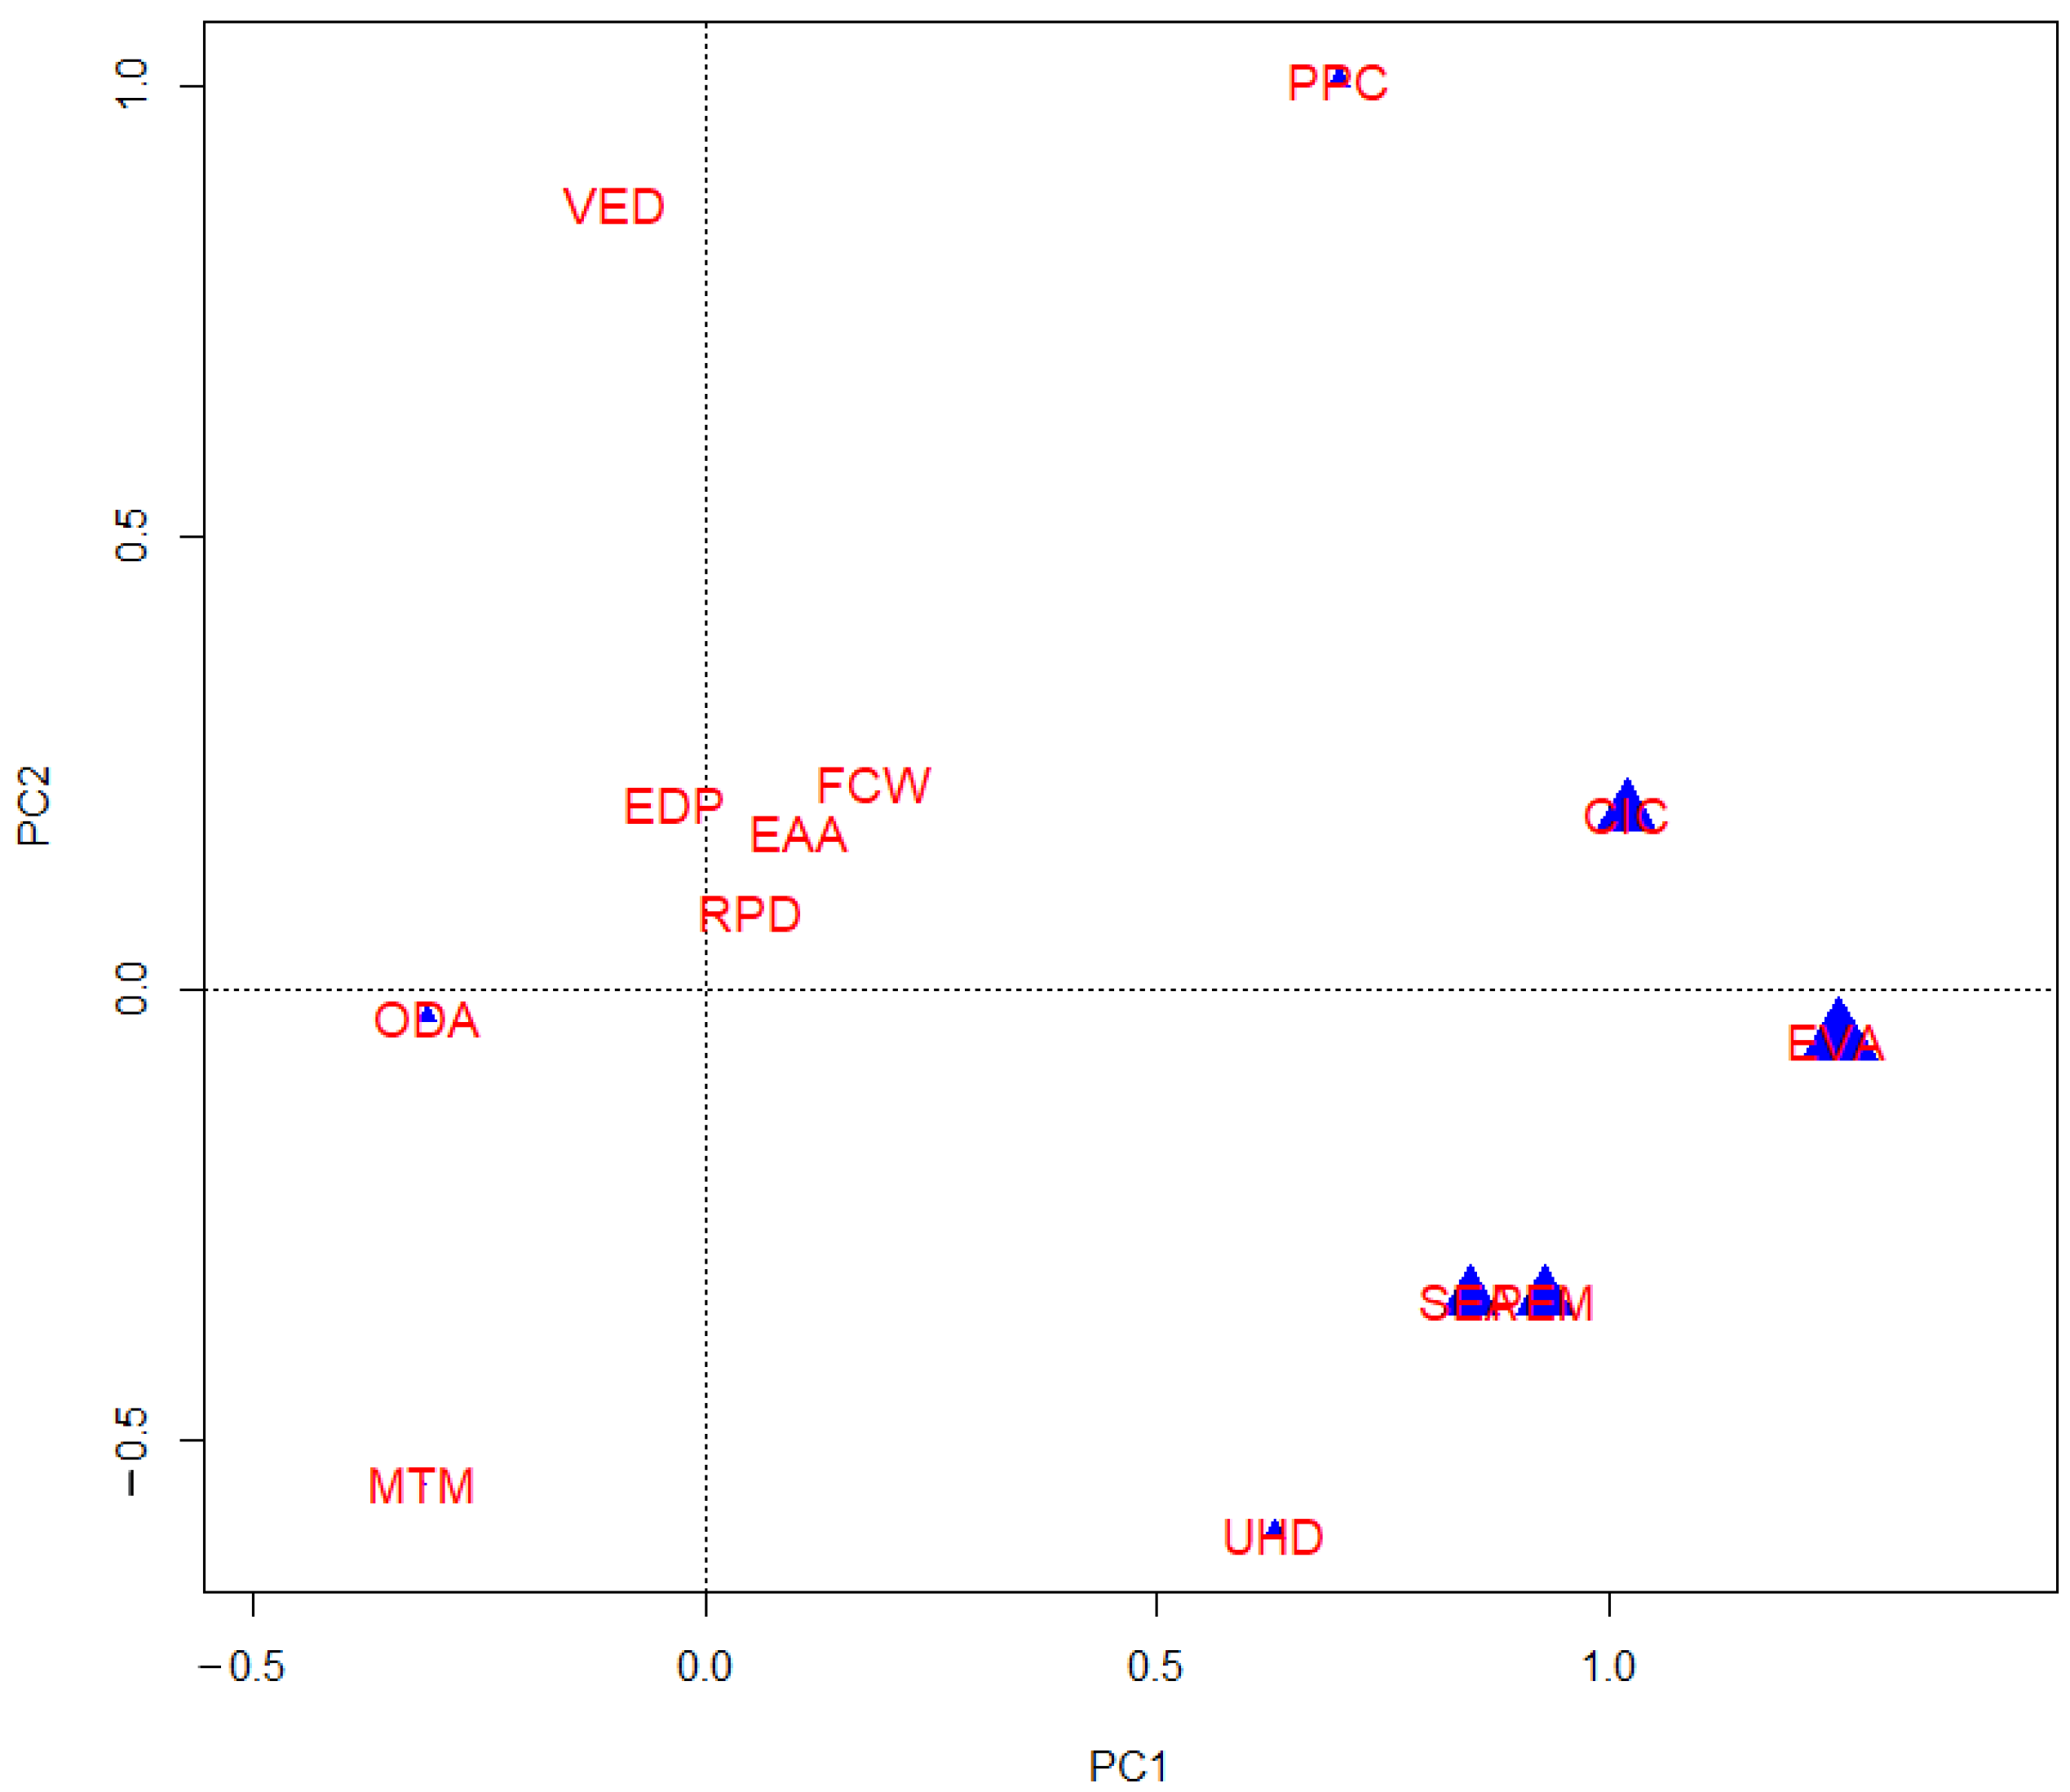
An analysis of the relationship between the study variables with the greatest impact was conducted to evaluate the correlations between them, answering the research question RQ2: What relationship is observed between the variables that had the greatest weight? To obtain information about the existing correlations between the items of the study, a principal component analysis (PCA) was proposed, using a symmetrical biplot (
Figure 1). The PCA allows the graphic visualization of the existing correlations in a multivariate analysis. For this purpose, the dimensionality was reduced, avoiding collinearity problems with minimal loss of information.
Figure 1 shows that the variables ODA and MTM are negatively correlated in a significant way with RPD, EAA, FCW, PPC, and CIC. A possible interpretation of the results suggests that those teachers with a traditional approach to teaching are identified with the variables associated with teaching practice, scoring high on ODA and MTM and low on the items related to training and communication with ICT. In contrast, teachers who use ICTs give higher scores to the technological component of teaching. On the other hand, the significant negative correlation with RPD can be interpreted as a high ratio that can depend upon the use of active methodologies in the classroom.
VED and EDP variables are significantly negatively correlated with SEA, EVA, UHD, and PEM. These results reinforce the previous interpretation of the traditional and technological approaches to teaching by the mathematics teachers in the A.C. of Melilla.
The variables PEM and SEA are strongly correlated. These results show that the mathematics teacher with technological competencies who uses educational platforms also uses educational software for teaching mathematics.
It is observed that the most important variables in the present study were EVA, PEM, SEA of indicator D.3, and CIC of indicator C.5. The less important indicators were ODA of indicator B.2, UHD of indicator C.2, and PPC of indicator C.5. The rest of the items, VED, EDP, EAA, RPD, MTM of indicator B.2, RPD of indicator B.3, and FCW of indicator C.1, had little relevance. These results suggest that the general perception of the A.C. of Melilla’s mathematics teachers is that they consider themselves capable of adequately managing classroom dynamics, using digital resources to share educational information/content, employing software and educational platforms for teaching mathematics, and using digital tools for student evaluation/monitoring.
Numerous empirical studies emphasize that the advantages of learning through active methodologies affect the motivation, autonomy, and digital competence of mathematics students [
25,
65,
68,
76]. On the other hand, these methodologies can be integrated and complemented by expanding the pedagogical scope to improve the academic performance of students [
78]. In contrast, other authors maintain that teaching experience correlates negatively with active methodological approaches [
45].
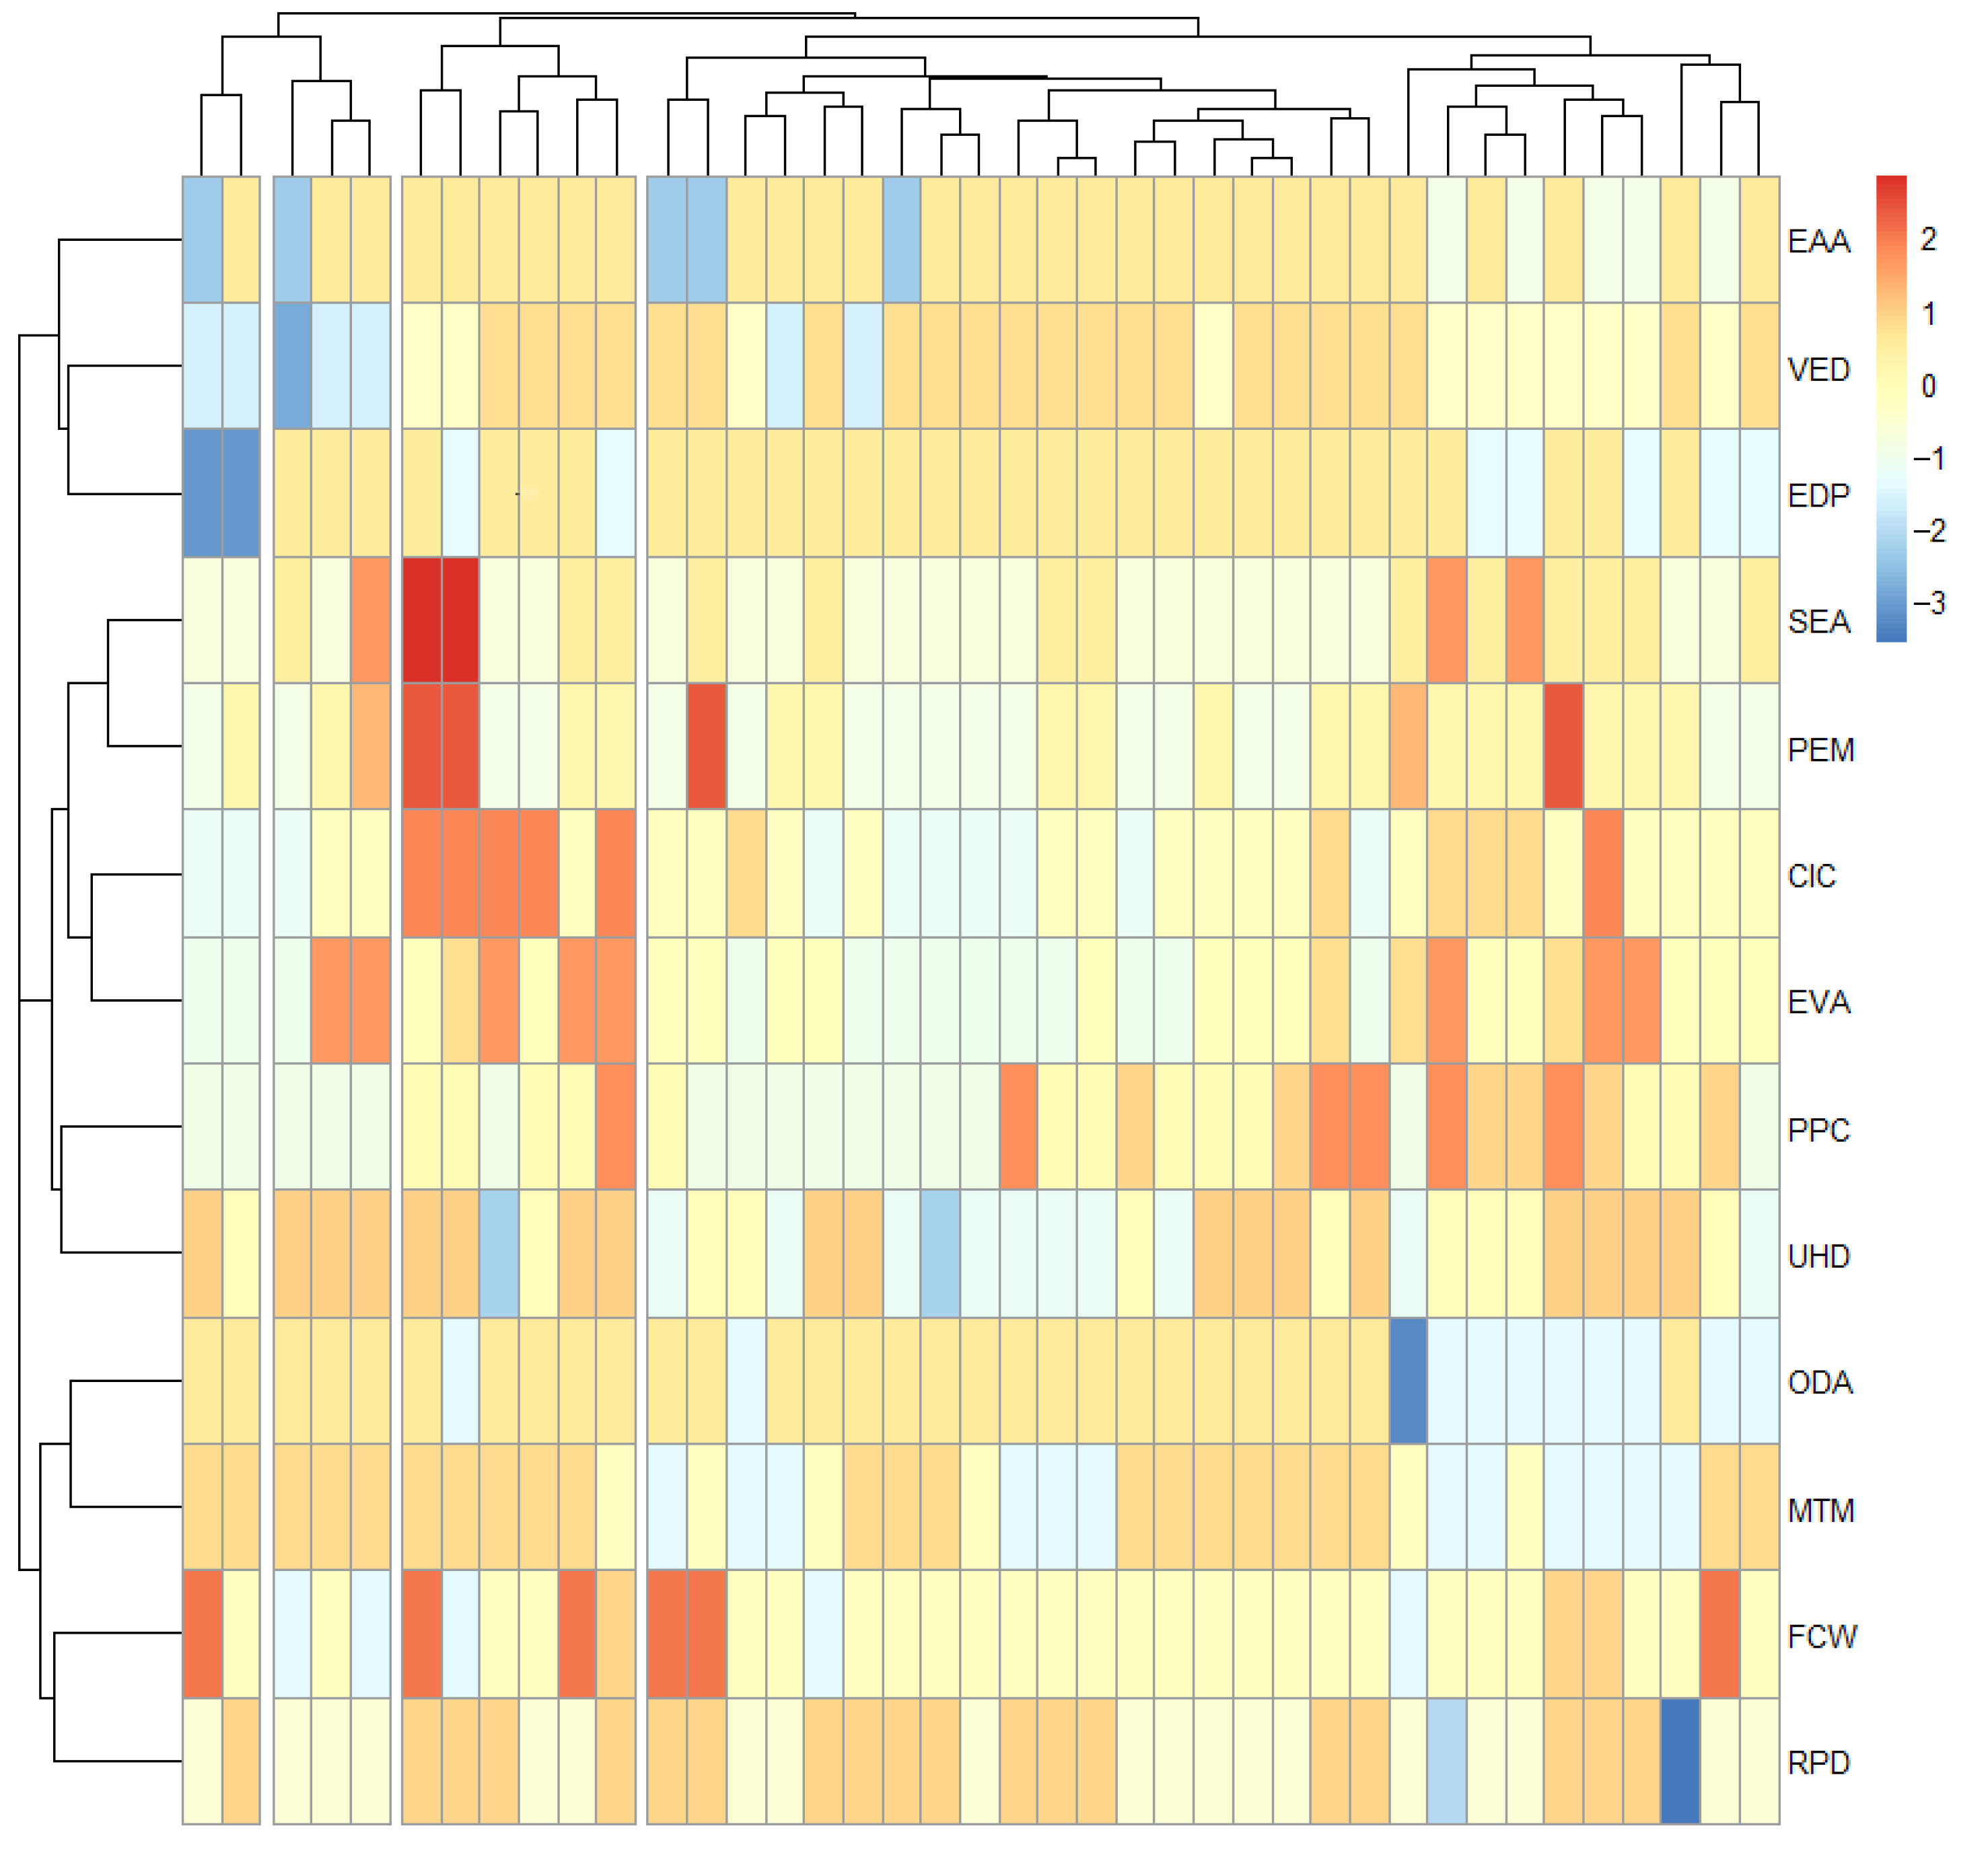
In addition, to answer the research question RQ3 (What score did the mathematics teachers assign to the variables with the greatest impact?), a heat map was used with the most relevant variables (
Figure 2). For this purpose, the algorithm selected a random subsample (n = 40).
In order to create the heat map, the matrix data were scaled. The results were then visualized following a twofold process: the use of the R package “pheatmap” and, secondly, the cutree_rows not being specified and, instead, selected randomly. As can be seen, it is a heat map that incorporates, as a novelty, a hierarchical clustering analysis among the study participants, obviating their identities. We were not interested in performing a comparative analysis of the participants, but rather in seeing, for each of them, the variables that had the greatest impact on their response in order to contrast this with the findings.
This graph shows that the subsample responded in a general way with average scores in all the dimensions of the study; however, response peaks are observed for the variables SEA, PEM, CIC, EVA, PPC, and FCW.
Along the same lines, the subsample can be subdivided into four clusters (of 2, 3, 6, and 29 individuals) according to the scores. In total, 5% of teachers in the subsample present pedagogical preferences without a clear technological orientation; 7.5% of teachers in the subsample present a mixed profile between indicators B2 and D3; 15.0% of teachers in the subsample present a profile more oriented to the use of ICT in the classroom and to online communication and collaboration. The largest group, which accounted for 72.5% of the subsample, presents a mixed profile among the different technological indicators.


 ,
, 


