Article

An Attempt to Evaluate the Green Construction of Large-Scale Hydropower Projects: Taking Wudongde Hydropower Station on the Jinsha River, China as an Example

1
State Key Laboratory of Hydraulics and Mountain River Engineering, College of Water Resource and Hydro-Power, Sichuan University, Chengdu 610065, China
2
China Three Gorges Construction Engineering Corporation, Chengdu 610065, China
*
Author to whom correspondence should be addressed.
Sustainability 2022, 14(1), 194; https://doi.org/10.3390/su14010194
Submission received: 10 November 2021 / Revised: 18 December 2021 / Accepted: 22 December 2021 / Published: 25 December 2021

Abstract

:
Huge amounts of energy and resources will be consumed, and a large quantity of environmental pollutants will be produced during the construction process of large-scale hydropower projects. As a core link of green supply chain in hydropower projects, green construction is particularly critical. To objectively evaluate the green construction level of large-scale hydropower projects, an evaluation indicator system was constructed in the study. The evaluation system consisted of 30 quantitative indicators and 7 qualitative indicators from the perspectives of environmental protection, resource saving and comprehensive management on the basis of the construction characteristics of large-scale hydropower projects. The quantitative and qualitative evaluation standards were proposed by combining with relevant laws and regulations, specifications and standards, and the environmental management maturity model. Furthermore, taking the second quarter of 2018 in Wudongde Hydropower Station on the Jinsha River, China, as an example, green construction level was assessed by the analytic hierarchy process fuzzy comprehensive evaluation (AHP-FCE) method. The calculation results indicated that the evaluation value of green construction in Wudongde Hydropower Station was 3.697, at “Good” level. The evaluation values of environmental protection, resource saving, and comprehensive management were 3.681, 3.473, and 3.965, respectively, within the range of 3 to 4, so they were all evaluated to be “Good”. To further improve the green construction level, it was necessary to supervise some aspects of construction process, i.e., treatment of waste slag in construction, economical and intensive utilization of land, publicity and training, soil erosion control, and saving water resources. In particular, management of soil erosion control should be strengthened. The proposed green construction evaluation system is relatively reliable and practical for professionals in the green hydropower industry, and can provide a reference for other large-scale hydropower projects.

1. Introduction

With rapid economic development and continuous environmental degradation, humans are more and more concerned about the environment and resources. The enterprises are being encouraged to develop sustainably, to reduce the damage to the environment and ecology. Therefore, the green supply chain management which refers to the system that reduces environmental pollution and improves the efficiency of resource utilization during firms’ procurement, production, and emissions has been practiced in many industries, such business corporations, electrical and electronics industries, private corporations, retailing industries, etc. [1,2,3,4,5,6]. It can be concluded from practice that green supply chain management can improve resource efficiency, reduce environmental costs, expand market share, protect a firm’s corporate reputation, and provide companies with greater competitive advantage [7].
Engineering project construction is a human activity that consumes more natural resources, and has a great impact on the environment, resources, and ecology. Therefore, it is essential to implement green supply chain management in the construction of engineering projects. According to the life cycle process, the green supply chain of engineering projects includes green planning, green design, green construction, and green operation. Green construction is the realization stage of green planning and green design, the foundation of green operation, thus green construction is the core link for implementing green supply chain management of engineering projects.
However, despite advocation of green construction, there are many problems in the construction process, such as environmental pollution, huge energy consumption, unhealthy living environments of workers, and so on. Therefore, it is urgent to reasonably evaluate whether the project is green to ensure the sustainability of project construction. At present, the reports on green construction evaluation mainly focus on building projects [8,9,10,11,12,13,14], and various scholars have investigated materials, equipment, and methods used in green construction. Scholars in China have evaluated green construction in the engineering of houses, roads, bridges, deep foundation pits, and decoration [15,16,17]. Lee et al. [13] proposed an energy regeneration system (ERS) to reduce energy consumption required by operating a construction hoist and found that the average energy recovery reached 55.5% through prototype verification. Onubi et al. [14] studied a construction project’s implementation of green practices in its site processes influenced its economic performance by meeting environmental performance standards. By testing 168 samples from construction projects completed by class A contractors in Nigeria, it was concluded that not all projects meeting the environmental performance standards would make economic profit. In the green construction, the contractor should be flexible and strive for a balance between environmental performance and economic performance. Zhang et al. [15] established a green construction comprehensive evaluation system of bridges in mountain areas and evaluated a bridge by the grey clustering method. Wang et al. [16] proposed an evaluation system for the green construction of railway subgrade working in north-western cold, arid regions and evaluated green construction levels of different construction schemes by TOPSIS method. However, there are few reports on the green construction evaluation of hydropower projects.
As a clean energy, hydropower provides a strong green power for the development of the national economy [18,19]. The construction of large-scale hydropower projects (the installed capacity exceeding 250,000 kW) is complex, necessitating a long period, and is subject to a wide range of influencing factors. A lot of energy and resources are consumed during construction, and many environmental pollutants, such as sewage, dust, and solid waste, are produced in the construction period [20]. Hence, green construction, the important measure to save resources and energy and protect environment, is the inevitable trend of hydropower industry development. Nevertheless, the green evaluation of hydropower projects mainly focused on the operation period [21], whereas no research was carried out to evaluate the green level during the construction period, especially for large-scale hydropower projects. Thus, establishing an objective and highly operable evaluation system and standard for green construction of large-scale hydropower projects is of practical significance to promote green management of the whole life cycle and improve resource saving and pollution reduction in the hydropower industry.
Therefore, according to the construction characteristics of Wudongde Hydropower Station, a representative large-scale hydropower station under construction in China, we established an evaluation indicator system for green construction in the study. Based on environmental monitoring at construction site and acquired data related to energy and resource consumption, the evaluation indicators were classified, and corresponding evaluation standards were proposed. The essence of the fuzzy comprehensive evaluation method (FCE) firstly presented by Zadeh [22,23] is to determine the value of an evaluation objective element through the membership matrix and factor weightings. The fuzzy comprehensive evaluation method based on analytic hierarchy process (AHP-FCE) has been effectively applied in many fields, such as mineral prospecting and mapping [24], seawater desalination projects [25], geothermal extraction [26], and mine safety training [27]. Further, the AHP-FCE was introduced in green construction level evaluation of large-scale hydropower projects, and the second quarter of 2018 in Wudongde Hydropower Station was selected as an example. The evaluation results could provide an objective guideline for green construction management of the hydropower station.

2. Materials and Methods

2.1. Framework for Green Construction Assessment

The construction of the evaluation indicator system is crucial for multi-criteria analysis. Referring to the mature green construction evaluation system of building engineering which involved construction management, environmental protection, material saving and utilization of material resources, water conservation, and utilization of water resources, land saving and protection of construction land [28], relevant indicators for green construction of large-scale hydropower projects were identified mainly focusing on resource saving and environmental protection based on their construction characteristics. Although the construction management process for large-scale hydropower projects has many similarities with the building engineering, the construction management of hydropower projects involves a more complex social environment and a wider scope of management than building construction. Therefore, taking comprehensive management instead of construction management, three types of indicators were considered for green construction of large-scale hydropower projects, i.e., environmental protection, resource saving, and comprehensive management.

2.1.1. Environmental Protection

In accordance with the environmental impact factors in the construction process of large-scale hydropower projects, the environmental protection indicators cover many aspects, such as water, atmosphere, noise, solid waste, terrestrial organisms, aquatic organisms, and water and soil conservation. In the construction process, the impact of the above factors on environment is expected to be controlled after taking relevant measures, which are reflected as green.

2.1.2. Resource Saving

The construction process of large-scale hydropower projects such as earth and rock excavation and support, concrete production and pouring, grouting engineering and mechanical and electrical installation will consume a lot of energy and resources including steel, cement, sand, diesel, gasoline, electricity, and water. Meanwhile, the construction site of key projects in the large-scale hydropower project (buildings and the permanent management of key projects, stock yards, slag yards, construction enterprises, etc.) occupies a lot of land. How to optimize the construction scheme and layout during construction, reduce energy and resource utilization, strengthen recycling of various resources, and improve the utilization rate of energy and land, is also the embodiment of green engineering.

2.1.3. Comprehensive Management

According to the construction characteristics of large-scale hydropower projects, and based on the principle of full coverage without overlapping, comprehensive management mainly includes organizational management, implementation management, health management among personnel, and external supervision.
Organizational management is an institutional guarantee for smooth progress of the large-scale hydropower project. It is difficult to implement green construction under the disordered organizations. The “three-simultaneousness” system, a system enables the environmental protection facilities in the construction project to be designed, constructed, and put into use simultaneously with the main project, complements the evaluation system for environmental impact. It is an important institutional guarantee of the effective implementation of pollution prevention and control measures.
Implementation management is designed to control green construction process. The rate of rectification of environmental problems reflects implementation of rectification the problems raised by the environmental regulators during construction, and it is an important symbol reflecting the maturity of the closed-loop plan–do–check act (PDCA) cycle pertaining to the project. A wide range of knowledge about environmental protection is required in the construction area of hydropower projects. As the field management personnel mainly major in hydraulic engineering, metal structures, and geology, they do not know enough about the environmental protection characteristics in hydropower projects. Through field investigation, it is found that some construction management personnel are aware of the importance of environmental protection, whereas they do not know how to do. Therefore, it is necessary to conduct publicity and training to improve the awareness of environmental protection of management personnel. The construction of large-scale hydropower projects may increase the surrounding environmental risks. However, based on environmental risk prevention and emergency management measures, the environmental risk status of the project itself can be mastered and reasonable and feasible prevention, emergency and mitigation measures can be proposed, people’s lives and security of property in the construction area and its surroundings can be protected.
Health management of personnel embodies the “people-oriented” concept in green construction. There are many construction personnel gathered in the construction process. If the management of sanitation and epidemic prevention, and hygiene of drinking water is not strengthened, infectious diseases are likely to be spread. In the meanwhile, construction personnel from different regions may bring pathogens from their places of residence and infect each other. If prevention and quarantine measures are not strengthened, disease may be prevalent. In addition, a large-scale hydropower project carries a high construction safety risk and comes with poor environmental conditions, such as construction dust and noise. Therefore, it is particularly important to strengthen the safety and occupational health of construction personnel.
External supervision is an external guarantee of green construction. Supervision by government departments can urge construction units to implement various environmental protection measures, and the relationship with the residents around the construction site can reflect the impact of the construction process on the surrounding environment.
Therefore, the evaluation indicator system for the green construction of large-scale hydropower projects was constructed (Figure 1). The evaluation system contained three rule layer indicators that Environmental protection D, Resource saving E, Comprehensive management F, 16 classification layer indicators of the water environment D1, Ground water environment D2, Organizational management F1, Implementation management F2, Material Utilization E1, Utilization of water resources E2, etc., and 37 indicator layer indicators that Treatment of production wastewater D11, Treatment of domestic sewage D12, Control of production water consumption E21, etc.

2.2. Standards for Evaluation Indicators

The indicator layer indicators in Figure 1 were classified into quantitative and qualitative indicators. Among the 37 indicators, D51, D52, D61, D62, D71, E11, F11, F12, F21, and F23 were qualitative, and the others were quantitative. The quantitative indicators were calculated based on monitoring data or relevant statistical data of approved energy and resource consumption, and the evaluation standards referred to relevant national laws, regulations, specifications, and standards, and the literature of Ye in 2012 [29]. The standards for evaluation grades of qualitative indicators are listed in Table 1. Because the qualitative indicators cannot be quantified, the evaluation mainly depends on subjective judgment, so we adopted the maturity levels of environmental management for judgement in the study [30].

2.2.1. Classification Standard for Quantitative Indicators

The five grades describing “Better, Good, Medium, Poor, and Worse” environmental management correspond to the following score ranges of evaluation values: (4, 5], (3, 4], (2, 3], (1, 2], and (0, 1]. The evaluation indicators contained in water environment D1, groundwater environment D2, atmospheric environment D3 and acoustic environment D4, etc., were generally monitored at multiple sites. Based on the cask theory [30], monitoring sites whose indicators all meet the standard were evaluated as “Better”, with the score of 5. For those whose indicators exceeded the standard, they were evaluated as “Worse” and assigned a score of 1. By weighting treatment capacity designed for each pollution source or the number of monitoring sites, the values of indicators were calculated, namely evaluation values in this case. For the evaluation indicators, such as Collection and disposal of hazardous waste D53 and Rate of using local materials E12, their values were firstly calculated according to evaluation standards and then converted to the evaluation values by interpolation method.

2.2.2. Classification Standard for Qualitative Indicators
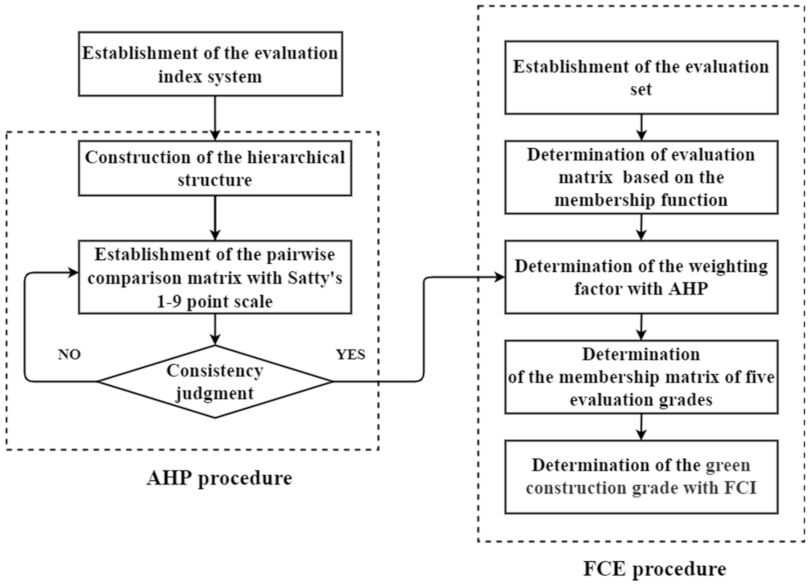
The classification standard of qualitative indicators refers to the environmental management maturity level. The environmental management maturity which reflects the attitude and ability of enterprises to deal with environmental issues can reflect which environmental management level that a construction project reaches [30,31,32,33]. According to the project management maturity model [32], a development maturity of 5 levels was constructed, namely “Disordered”, “Simple”, “Standard”, “Improved”, and “Lean” levels (Table 2). The maturity was measured using five grades, being “Better”, “Good”, “Medium”, “Poor”, and “Worse”.
The qualitative indicators were scored by the expert scoring method based on the environmental management maturity levels. The expert group (number m) evaluated the qualitative indicators according to the maturity levels: (0, 1] refers to “Disordered” maturity level and the maximum value is N1 = 1; (1, 2] indicates the “Simple” maturity level and the maximum value is N2 = 2. In a similar fashion, the maximum value is recorded as Ni. The number of votes of the expert group on the indicator Aij at the ith level is Nj (0 ≤ jm). According to Equation (1), the values of qualitative indicators were calculated, because the maturity level was consistent with the division of grades; therefore, the calculated values were the evaluation values.
X i j = i = 1 5 ( N i × N j ) m ( i = 1 , 2 , 3 , 4 , 5 ; 0 j m )

2.3. AHP-FCE Method

The analytic hierarchy process fuzzy comprehensive evaluation method (AHP-FCE) is a comprehensive evaluation method based on fuzzy mathematics. A flowchart through the integrated AHP-FCE method procedure is depicted in Figure 2, and the basic steps can be summarized as follows:
  • Step 1. Construct a fuzzy membership matrix of evaluation indicators.
According to the original values of indicators U = (u1, u2, …, un) (n represents the number of indicators) and the classification standard, an evaluation matrix was calculated based on the membership function.
R = r 11 r 15 r i j r n 1 r n 5
where rij is the membership degree that the i-th indicator belongs to the j-th evaluation grades. The membership function R was established to depict the membership degree of evaluation factors to certain evaluation grades through certain functional operation to visualize the original fuzzy mathematical concept. According to the thresholds of evaluation standards as inflection points, a linear membership function was built by using the lower semi-trapezoid method (Table 3).
  • Step 2. Weight of each indicator was calculated using the AHP method
The analytic hierarchy process (AHP) established by Saaty is a decision-making method combined qualitative and quantitative assessments [4,34,35]. The process is explained below. To evaluate the weight of each indicator, a pair-wise comparison matrix was formed as follows:
A = ( P i j ) n × n P 11 P 12 P 1 n P 21 P 22 P 2 n P n 1 P n 2 P n n
where Pij is the relative importance value of indicator i in comparison with indicator j, calculated by Satty’s 1–9 points scale [34,36]. Pij > 0 and Pij × Pji = 1.
In the next step, the elements of matrix A were normalized using Equation (4).
P i j = P i j j = 1 n P k j i ξ j = 1 , 2 , , n
To obtain the relative importance of each criterion, Equation (5) was applied.
w i = j = 1 n P i j i = 1 , 2 , , n
In the fourth step, the criteria weight vector, w = (w1, w2, …, wn) was calculated using Equation (6):
w i = w i k = 1 n w k i = 1 , 2 , , n
To determine the reliability of compaction performed between criteria in each branch of the hierarchy tree, the consistency rate CR presented in Equation (7) has to be examined. If CR < 0.1, it means that the judgement matrix exhibits good consistency, otherwise the elemental values thereof should be adjusted.
C R = C I R I
where CI is the consistency indicator calculated by Equation (8).
C I = ξ max n n 1
where λmax (the maximum eigenvalue) is calculated by using Equation (9):
ξ max = 1 n i = 1 n ( p w ) i w i
where RI in Equation (7) is a random indicator. The value of RI, changing with variations in the dimensions, is given in Table 4.
Step 3. Based on the weight vector w and evaluation matrix R, FCE was conducted.
B = w · R = w 1 , w 2 , , w n · r 11 r 15 r n 1 r n 5 = b 1 , b 2 , b n
where B indicates the membership matrix of five evaluation grades. The calculated result for evaluation is shown as follows:
F C I = B · S = b 1 , b 2 , b n · 5 4 3 2 1 1
where S represents the vector of evaluation standards, FCI indicates the fuzzy comprehensive result. FCI ≤ 1, 1 < FCI ≤ 2, 2 < FCI ≤ 3, 3 < FCI ≤ 4, and 4 < FCI represent green construction with “Worse, Poor, Medium, Good, and Better” evaluation results, respectively.

3. Results and Discussions

3.1. Case Analysis

Wudongde Hydropower Station, the most upstream among the four cascade hydropower stations (Wudongde, Baihetan, Xiluodu, and Xiangjiaba) in the lower reaches of the Jinsha River, China, has a normal storage level of 975 m and installed capacity of 10, 200 MW. Moreover, the annual average power generation is 3.891 × 10¹⁰ kW·h, and the maximum dam height is 270 m. The hydropower station ranking seventh in the world in terms of installed capacity is mainly responsible for power generation and takes into consideration of flood control, shipping, and promotion of local economic and social development. Due to the large scale of Wudongde Hydropower Station, green construction can save a lot of resources and protect the ecological environment.
The second quarter of 2018 was the construction peak period for Wudongde Hydropower Station. Various environmental protection measures were under construction or operation, and the indicators were relatively complete and representative. Thus, the green construction level of Wudongde Hydropower Station in the second quarter of 2018 was evaluated.

3.2. Evaluation Values of Indicators for Green Construction

Quantitative indicators were calculated according to monitoring reports and construction statistics of Wudongde Hydropower Station in the second quarter of 2018. For qualitative indicators, fifteen engineers familiar with the site conditions from the building, design, environmental supervision, environmental impact assessment, supervision, and construction units were selected to score maturity, and then the value of each indicator was calculated according to Equation (1). The evaluation value between (0, 5] of each indicator is summarised in Table 5.

3.3. Comprehensive Evaluation of Green Construction

3.3.1. Determination of Indicator Weight

In accordance with the indicator system for green construction established in Figure 1, indicators in the rule, classification and indicator layers were scored in pairs by six engineers familiar with the site conditions from the building, design, environmental supervision, environmental impact assessment, supervision, and construction units. For example, in the indicator layer, the relative importance of the controlled ratio of soil erosion D81, slag retention rate D82, and recovery rate of forest and grass vegetation D83 were measured by the expert scoring method, and the pair-wise judgment matrix was constructed as follows
A = 1 4 1 0.25 1 0.25 1 4 1
It was obvious to find that D81 and D83 were more relatively important than D82. According to Equations (4)–(6), the weight coefficients of D81, D82, and D83 were calculated as 0.444, 0.112, and 0.444, respectively. Then, the maximum eigenvalue λmax, the consistency indicator CI, and the consistency rate CR was calculated according to Equations (7)–(9), that λmax = 3, CI = –4.4409 × 10⁻¹⁶, RI = 0.58, CR = –8.6248 × 10⁻¹⁶. Since CR < 0.1, the judgment matrix of the indicator layer had complete consistency. Similarly, the weight coefficients of the indicator layer, classification layer and rule layer indicators were calculated, which all passed the consistency test. The final weight of each indicator relative to the overall objective was determined and illustrated in Table 6.
The indicator weight implies the influence degree of the indicator on the evaluation results of green construction. The indicators ranked in the top ten according to the weight values were as follows: treatment of production wastewater (D11), controlled ratio of soil erosion (D81), recovery rate of forest and grass vegetation (D83), treatment of domestic sewage (D12), control of groundwater level (D21), implementation of “three simultaneousness” (F21), and energy utilization rate (E31), as well as treatment of waste slag in construction (D51), disposal of domestic waste (D52), and collection and disposal of hazardous waste (D53) which had the same weight. It could be concluded that construction wastewater, water and soil conservation, and treatment of solid waste were closely related to green construction of the large-scale hydropower projects, which confirmed to the nature of their environmental impact during construction period.

3.3.2. Comprehensive Evaluation

Firstly, the membership degrees of the indicator layer indicators were obtained according to their evaluation values. For example, the evaluation values of D11 and D12 were 4.83 and 3.71, respectively, so the membership matrix were 0.83 0.17 0 0 0 0 0.71 0.29 0 0 . Since the weights of D11 and D12 were 0.667 0.333 , the evaluation value FCI of the classification layer indicator water environment D1 corresponding to D11 and D12 was 0.667 0.333 × 0.83 0.17 0 0 0 0 0.71 0.29 0 0 × 5 4 3 2 1 1 = 4.457 . The evaluation values of classification layer indicators were calculated according to the corresponding indicator layer indicators evaluation values and weights, and the membership degrees of classification layer indicators were obtained (Table 7).
Similarly, the evaluation values and membership degrees of the rule layer indicators for green construction could be calculated, and the results are demonstrated in Table 8. The evaluation values of environmental protection D, resource saving E, and comprehensive management F were 3.681, 3.473 and 3.965, respectively. In accordance with the membership degrees of the rule layer indicators in Table 8 and the weights of the rule layer indicators, FCE was conducted such that B = (0, 0.694, 0.307, 0, 0) according to Equation (3). By using Equation (4), the fuzzy evaluation result of the green construction level was calculated as FCI = 3.697.

3.4. Analysis of Evaluation Results

3.4.1. Evaluation Results

According to the standards for evaluation grades of green construction, the green construction level of Wudongde Hydropower Station in the second quarter of 2018 was deemed to be “Good”. The evaluation values of Environmental protection D, Resource saving E, and Comprehensive management F in the rule layer were 3.681, 3.473, and 3.965, within the range of 3 to 4, thus they were evaluated to be “Good”.
For indicators in the classification layer, the evaluation values of water environment D1, groundwater environment D2, acoustic environment D4, energy utilization E3, organizational management F1, health management of personnel F3 and external supervision F4 were between 4 and 5, at the “Better” grade. Of them, the evaluation values of groundwater environment D2, energy utilization E4, health management of personnel F3, and external supervision F4 reached 5. Atmospheric environment D3, water and soil conservation D8, material utilization E1, and utilization of land resources E4 were scored between 3 and 4, at the “Good” grade, of which the evaluation value of atmospheric environment D3 reached 4. In addition, the evaluation values of solid waste D5, protection of terrestrial ecosystem D6, protection of aquatic ecosystem D7, utilization of water resources E2, utilization of land resources E4, and implementation management F2 were scored between 2 and 3, at the “Medium” grade (the score for protection of aquatic ecosystem D7 reached 3).
In the indicator layer, the evaluation values of the controlled ratio of soil erosion D81 and Saving rate of water resources E22 were 1, indicating that they were deemed to be “Worse”. The evaluation values of control of ambient air in the construction site D32, treatment of waste slag in construction D51, treatment of domestic waste D52, collection and disposal of hazardous waste D53, protection measures for terrestrial plants D61, protection measures for terrestrial animals D62, protection measures for aquatic ecosystem D71, control of production water consumption E21, economical and intensive utilization of land E41, implementation of “three simultaneousness” F21, rectification rate of environmental problems F22, and publicity and training F23 were found in the range of 2–3, at the “Medium” grade. The evaluation values of the other 23 indicators were greater than 3, which were evaluated above the level of “Good”. There were 15 indicators with evaluations of 5, at the “Better” level, i.e., control of groundwater level D21, control of groundwater quality D22, and control of ambient air in sensitive areas outside the boundary of the construction site D31.
In the indicators ranked in the top ten by weight values, the treatment of production wastewater D11 (first), control of groundwater level D22 (fifth), recovery rate of forest and grass vegetation D83 (third), and energy utilization rate E31 (seventh) were at the “Better” grade. The treatment of domestic sewage D12 (fourth) belonged to the “Good” grade. The treatment of waste slag in construction D51 (eighth), treatment of domestic waste D52 (ninth), collection and disposal of hazardous waste D53 (tenth) and Implementation of “three simultaneousness” (sixth) were found at the “Medium” grade, of which the evaluation value of treatment of waste slag in construction D51 approached 2, at the “Poor” grade. The controlled ratio of soil erosion D81 (second) was evaluated as “Worse”.

3.4.2. Application of Evaluation Results

Based on the above analysis, the controlled ratio of soil erosion, saving rate of water resources, treatment of waste slag in construction, treatment of domestic waste, collection and disposal of hazardous waste, and implementation of “three simultaneousness” should be well managed in the next stage of the project construction.
For the controlled ratio of soil erosion, the focus was to strengthen control, and consistent with the main project, the bare ground should be afforested and improved timeously, thus further undue soil erosion should be avoided. As for the saving rate of water resources, in this stage, it was necessary to strengthen recovery and utilization of reclaimed water, and water used for aggregate mixing, and for pouring and cooling dam concrete (each of which entails significant water consumption). Meanwhile, water saving measures should be promulgated and economic measures should be adopted in the construction site to encourage the construction unit to save water. In the treatment of water slag in construction, it was necessary to strengthen management of slag-transporting trucks, require the waste slag to be transported to the designated slag yard, and prohibit littering and dumping along both sides of the road. Otherwise, slag-transporting trucks shall be paid, and penalties shall be imposed on them. Meanwhile, in the slag yard, slag should be stockpiled according to the design requirements and protected timeously. In the treatment of domestic waste, refuse bins should be increased in each area of the construction site, and the waste should be classified for recycling. At the same time, domestic waste should be transported to a designated landfill according to the requirements of clearing waste on the same day of its production, thus avoiding its accumulation. The collection and disposal of hazardous waste should mainly focus on the management of waste engine oil in the construction site. Discarded waste engine oil should be collected in a storage for hazardous waste, and the corresponding protection and records should be kept. When managing implementation of “three simultaneousness”, the environmental protection measures should be deconstructed, and a progress plan should be prepared. The process control should be strengthened using progress management software, such as Oracle Primavera P6. In addition, it was necessary to make continuous improvements and take effective optimisation steps to ensure that each measure was designed, constructed, and implemented simultaneously across the main project.
With the development of green construction evaluation in engineering projects, the study contributed to construct the green construction evaluation indicator system of large-scale hydropower projects. The evaluation indicator system used in the study was proposed by combining with the actual engineering construction situations, which can provide reference for other hydropower projects. Nevertheless, there are some differences in the geographical location and construction conditions of different hydropower stations. Although the evaluation indicator system constructed in our study can provide reference for the green construction evaluation of other hydropower stations, it was suggested that more in-depth studies be undertaken according to the actual influence range and construction conditions of projects, so that the evaluation system will become more rational and widely applicable. Aside from the AHP fuzzy comprehensive evaluation method, there are many other evaluation methods, such as set pair analysis and artificial neural network evaluation methods, which should be mutually verified in future research.

4. Conclusions

The green construction assessment of large-scale hydropower projects was to objectively evaluate the construction influence on energy, resource consumption and the environment. The overall standard is designed to minimize the negative influence in the construction process and protect the environment. At present, the green construction evaluation indicator system of large-scale hydropower projects is lacking. Therefore, in the study, an evaluation system containing 37 indicators for green construction of large-scale hydropower projects was proposed regarding environmental protection, resource saving, and comprehensive management. The fuzzy comprehensive evaluation method based on analytic hierarchy process (AHP-FCE) widely used in multi-indicator and multi-level complex evaluations was employed to evaluate the green construction level. Furthermore, the green construction level evaluation was performed by taking the second quarter of 2018 in Wudongde Hydropower Station on Jinsha River as an example.
The result of weight calculation by AHP method was that the treatment of production wastewater (D11), the controlled ratio of soil erosion (D81), recovery rate of forest and grass vegetation (D83), and treatment of domestic sewage (D12) had higher weights; therefore, construction wastewater, water and soil conservation, and the treatment of solid waste were closely related to green construction of the large-scale hydropower projects. The evaluation value of Wudongde Hydropower Station by FCE was 3.697, indicating that the green construction level was at the “Good” grade. The evaluation values of comprehensive management, environment protection, and resource saving approached 4, at the “Good” grade. However, in order to further improve the green construction level of the station, it was necessary to strengthen the management of some construction processes, such as treatment of waste slag in construction, economical and intensive utilization of land, publicity and training, and the controlled ratio of soil erosion and the saving rate of water resources. Since the controlled ratio of soil erosion accounted for a large weight, its management should be particularly strengthened.

Author Contributions

Conceptualization, L.L. and L.Z.; methodology, L.L. and Y.Z.; data curation, L.L. and C.Z.; writing original draft preparation, L.L.; writing review and editing, L.Z., Y.Z., C.Z., and C.L.; visualization, L.L. All authors have read and agreed to the published version of the manuscript.

Funding

This research was funded by the Key Program of National Natural Science Foundation of China (Grant No. 52039006).

Institutional Review Board Statement

Not applicable.

Informed Consent Statement

Not applicable.

Data Availability Statement

Not applicable.

Acknowledgments

We would like to thank the Wudongde Hydropower Station Construction Department for providing the data used in this study.

Conflicts of Interest

The authors declare no conflict of interest.

References

  1. Li, B.; Wang, H.; Zheng, W. Who will take on green product development in supply chains? Manufacturer or retailer. J. Clean. Prod. 2021, 314, 128000. [Google Scholar] [CrossRef]
  2. Brammer, S.; Walker, H.L. Sustainable procurement in the public sector: An international comparative study. Int. J. Oper. Prod. Man. 2011, 31, 452–476. [Google Scholar] [CrossRef]
  3. Hsu, C.W.; Hu, A.H. Green supply chain management in the electronic industry. Int. J. Environ. Sci. Technol. 2008, 5, 205–216. [Google Scholar] [CrossRef] [Green Version]
  4. Zhu, Q.; Tian, Y.; Sarkis, J. Diffusion of selected green supply chain management practices: An assessment of Chinese enterprises. Prod. Plan Control. Manag. Oper. 2012, 23, 837–850. [Google Scholar] [CrossRef]
  5. Grosvold, J.; Hoejmose, S.; Roehrich, J. Squaring the circle: Management, measurement and performance of sustainability in supply chains. Supply Chain. Manag. 2014, 19, 292–305. [Google Scholar] [CrossRef]
  6. Amann, M.; Roehrich, J.; Eßig, M.; Harland, C. Driving sustainable supply chain management in the public sector: The importance of public procurement in the EU. Supply Chain. Manag. 2014, 19, 351–366. [Google Scholar] [CrossRef] [Green Version]
  7. Hoejmose, S.U.; Roehrich, J.K.; Grosvold, J. Is doing more, doing better? The relationship between responsible supply chain management and corporate reputation. Ind. Market Manag. 2014, 43, 77–90. [Google Scholar] [CrossRef]
  8. Zuo, J.; Zillante, G.; Wilson, L.; Davidson, K.; Pullen, S. Sustainability policy of construction contractors: A review. Renew. Sustain. Energy Rev. 2012, 16, 3910–3916. [Google Scholar] [CrossRef]
  9. Zhao, D.; McCoy, A.P.; Kleiner, B.M.; Smith-Jackson, T.L. Control measures of electrical hazards: An analysis of construction industry. Saf. Sci. 2015, 77, 143–151. [Google Scholar] [CrossRef]
  10. Zhao, X.; Hwang, B.G.; Gao, Y. A fuzzy synthetic evaluation approach for risk assessment: A case of Singapore’s green projects. J. Clean. Prod. 2016, 115, 203–213. [Google Scholar] [CrossRef]
  11. Hwang, B.G.; Shan, M.; Phuah, S.L. Safety in green building construction projects in Singapore: Performance, critical issues, and improvement solutions. KSCE J. Civ. Eng. 2018, 22, 447–458. [Google Scholar] [CrossRef]
  12. Lee, M.; Kim, T.; Jung, H.K.; Lee, U.K.; Cho, H.; Kang, K.I. Green construction hoist with customized energy regeneration system. Autom. Constr. 2014, 45, 66–71. [Google Scholar] [CrossRef]
  13. Badi, S.; Murtagh, N. Green supply chain management in construction: A systematic literature review and future research agenda. J. Clean. Prod. 2019, 223, 312–322. [Google Scholar] [CrossRef]
  14. Onubi, H.O.; Yusof, N.; Hassan, A.S. Understanding the mechanism through which adoption of green construction site practices impacts economic performance. J. Clean. Prod. 2020, 254, 120170. [Google Scholar] [CrossRef]
  15. Zhang, H.; He, X.J.; Yang, J.F.; Wang, T. Study of the comprehensive evaluation system of green construction of bridge. J. Wuhan Univ. Technol. (Transp. Sci. Eng.) 2015, 39, 621–624. [Google Scholar]
  16. Wang, B.T.; Bao, X.Y.; Li, A.C. Comprehensive evaluation of the green construction level of railway subgrade in the northwest cold arid region. J. Civ. Eng. Manag. 2019, 36, 197–202. [Google Scholar]
  17. Wang, Y. Research of Evaluation System of Green Construction of Decoration Engineering; Tianjin University: Tianjin, China, 2017. [Google Scholar]
  18. Li, Y.; Li, Y.B.; Ji, P.F.; Yang, J. The status quo analysis and policy suggestions on promoting China’s hydropower development. Renew. Sustain. Energy Rev. 2015, 51, 1071–1079. [Google Scholar] [CrossRef]
  19. Chu, P.H.; Liu, P.K.; Pan, H. Prospects of hydropower industry in the Yangtze River Basin: China’s green energy choice. Renew. Energy. 2019, 131, 1168–1185. [Google Scholar]
  20. Rosenberg, D.M.; Bodaly, R.A.; Usher, P.J. Environmental and social impacts of large scale hydroelectric development: Who is listening? Glob. Environ. Chang. 1995, 5, 127–148. [Google Scholar] [CrossRef]
  21. Yu, X.Z.; Xia, J.X.; Yang, J.; Ma, W. Preliminary study on the indicator system and assessment method of green hydropower. J. Hydroc. Engin. 2011, 30, 71–77. [Google Scholar]
  22. Zadeh, L.A. Fuzzy sets. Inf. Control. 1965, 8, 338–353. [Google Scholar] [CrossRef] [Green Version]
  23. Zadeh, L.A. Fuzzy sets as a basis for a theory of possibility. Fuzzy Sets Syst. 1978, 1, 3–28. [Google Scholar] [CrossRef]
  24. Zhang, N.; Zhou, K.; Du, X. Application of fuzzy logic and fuzzy AHP to mineral prospectivity mapping of porphyry and hydrothermal vein copper deposits in the Dananhu-Tousuquan island arc, Xinjiang, NW China. J. Afr. Earth Sci. 2017, 128, 84–96. [Google Scholar] [CrossRef]
  25. Zhang, Y.; Wang, R.H.; Huang, P.F.; Wang, X.L.; Wang, S.H. Risk evaluation of large-scale seawater desalination projects based on an integrated fuzzy comprehensive evaluation and analytic hierarchy process method. Desalination 2020, 478, 114286. [Google Scholar] [CrossRef]
  26. Guo, H.; Zhao, J. The surface rupture zone and paleoseismic evidence on the seismogenic fault of the 1976 Ms 7.8 Tangshan earthquake, China. Geomorphology 2019, 327, 297–306. [Google Scholar] [CrossRef]
  27. Zhang, H.; He, X.; Mitri, H. Fuzzy comprehensive evaluation of virtual reality mine safety training system. Saf. Sci. 2019, 120, 341–351. [Google Scholar] [CrossRef]
  28. Ministry of Housing and Urban-Rural Development of the People’s Republic of China (MOHURD). Green Construction Guidelines; MOHURD: Beijing, China, 2007; Volume 36, pp. 1–5.
  29. Ye, H. Research on Green Construction Evaluation System Suitable for China; Chongqing University: Chongqing, China, 2012. [Google Scholar]
  30. Luo, X.; Yang, L.; Yu, X.Z.; Zhang, N.N. Study on environmental management maturity of oil and gas exploration and development project. Nat. Gas Techno. Econ. 2019, 13, 74–79. [Google Scholar]
  31. Li, Y.; Mu, X.D.; Song, W.; Shi, H.W. Analytic Hierarchy Process Method Based on the Cask Theory. Appl. Mechan. Mater. 2015, 713, 1610–1614. [Google Scholar] [CrossRef]
  32. Bai, L.; Wang, H.; Huang, N.; Du, Q.; Huang, Y. An Environmental Management Maturity Model of Construction Programs Using the AHP-Entropy Approach. Int. J. Environ. Res. Public Health 2018, 15, 1317. [Google Scholar] [CrossRef] [Green Version]
  33. Yang, L.; Qin, H.; Xia, W.; Gan, Q.; Li, L.; Su, J.; Yu, X. Resource slack, environmental management maturity and enterprise environmental protection investment: An enterprise life cycle adjustment perspective. J. Clean Prod. 2021, 309, 127339. [Google Scholar] [CrossRef]
  34. Saaty, T.L. A scaling method for priorities in hierarchical structures. J. Math. Psychol. 1977, 15, 234–281. [Google Scholar] [CrossRef]
  35. Tan, R.R.; Aviso, K.B.; Huelgas, A.P.; Promentilla, M.A.B. Fuzzy AHP approach to selection problems in process engineering involving quantitative and qualitative aspects. Process Saf. Environ. Protect. 2014, 92, 467–475. [Google Scholar] [CrossRef]
  36. Kheybari, S.; Rezaie, F.M.; Ali Naji, S.; Najafi, F. Evaluation of energy production technologies from biomass using analytical hierarchy process: The case of Iran. J. Clean Prod. 2019, 232, 257–265. [Google Scholar] [CrossRef]
Figure 1. The evaluation system for green construction of large-scale hydropower projects.
Sustainability 14 00194 g001
Figure 2. Flowchart through the integrated AHP-FCE process.
Sustainability 14 00194 g002
Table 1. Evaluation standards of quantitative indicators for green construction of large-scale hydropower projects.
Classification LayerIndicator LayerEvaluation Method and StandardBetterGoodMediumPoorWorse
Water environment D1Treatment of production wastewater D11Integrated Wastewater Discharge Standard or recycling without dischargingMeeting ///Exceeding
Treatment of domestic sewage D12Meeting ///Exceeding
Groundwater environment D2Control of groundwater level D21No impact of cavern excavation on groundwater or surface waterYes///No
Control of groundwater quality D22Quality Standard for GroundwaterMeeting ///Exceeding
Atmospheric environment D3Control of ambient air in sensitive areas outside the boundary of the construction site D31Ambient Air Quality StandardsMeeting ///Exceeding
Control of ambient air in the construction site D32Meeting ///Exceeding
Acoustic environment D4Control of noise from sensitive areas outside the boundary of the construction site D41Environmental Quality Standard for NoiseMeeting ///Exceeding
Control of noise from the construction site D42Emission Standard of Environment Noise for Boundary of Construction SiteMeeting ///Exceeding
Control of noise from construction roads D43Meeting ///Exceeding
Control of blasting noise D44The blasting time in summer and winter shall be strictly within the specified time (blasting at night is strictly prohibited)Yes///No
Solid waste D5Collection and disposal of hazardous waste D53Standardized Management indicator System of Hazardous Waste (No. 99 of the General Office of the Ministry of Environmental Protection in 2015)5550~5543~5033~43<32
Water and soil conservation D8Controlled ratio of soil erosion D81Control Standards for Soil and Water Loss on Development and Construction Projects ≥0.7///<0.7
Slag retention rate D82≥95%///<95%
Recovery rate of forest and grass vegetation D83≥80%80~60%60~0%40~20%<20%
Material utilization E1Rate of using local materials E12Proportion of building materials that are produced within 500 km of the construction site in the total consumption of building materials (%)≥70%70~50%50~40%40~20%<20%
Utilization of water resources E2Control of production water consumption E21Ratio of water consumption indicator per unit gross domestic product (GDP) to national average≤60%60~80%80~120%120~150%≥150%
Saving rate of water resources E22Ratio of amount of recycled wastewater to water consumption≥90%90~70%70~50%50~30%<30%
Energy utilization E3Energy utilization rate E31Ratio of the comprehensive energy consumption indicator of the project to the comprehensive energy consumption indicator of GDP formulated by the central or local governments≤60%60~80%80~120%120~150%≥150%
Utilization of land resources E4Economical and intensive utilization of land E41Ratio of GDP per unit construction land to national average≤60%60~80%80~120%120~150%≥150%
Topsoil collection E42Ratio of collected topsoil to that required in the Report for Soil and Water Conservation Plan≥90%90~70%70~50%50~30%<30%
Implementation management F2Rectification rate of environmental problems F22Rectification and solving rate of problems found on site100%100~90%90~70%70~50%<30%
Environmental risk prevention and emergency management F24Whether the environmental emergency plan has been filed and drilled on site?Yes///No
Health management of personnel F3Sanitation and epidemic prevention F31Whether there are infectious diseases and endemic diseases induced by environmental changes caused by the project and whether there are cross-infections or epidemic infectious diseases due to poor living and sanitary conditions?No///Yes
Drinking water quality F32Standards for Drinking Water QualityYes///No
Safety and occupational health F33Standardization of Safety Production of Power Engineering Construction Projects and Rating Standard (No. 247 document of South China Energy Regulatory Bureau of National Energy Administration of the People’s Republic of China in 2012)≥9090~8080~7070~60<30
External supervision F4Supervision of government sectors F41Whether the problems found by government supervision are rectified in time as required?Yes///No
Relationship with residents around the construction site F42Whether smooth communication and problem-solving channels are established, and whether complaints are handled timeously?Yes///No
Table 2. The characteristics of environmental management maturity levels.
Maturity LevelScoreGradeMain Characteristics
Disordered0~1WorseThe project is completely economic-interest-oriented, without awareness of environmental management.
Simple1~2PoorWith the awareness of environmental management, the impact on the ecological environment is only considered in theoretical analysis while being applied less in implementation and evaluation.
Standard2~3MediumThe influence on the ecological environment is assessed and appropriate countermeasures are taken according to standards during the construction of the project. Moreover, the environmental benefits of the project are well considered.
Improved3~4GoodThe ecological environment factors are profoundly analyzed qualitatively and quantitatively, and corresponding measures are taken in each stage of implementation.
Lean4~5BetterEnvironmental management means is constantly improved and optimized, and the goal of ecological and environmental protection is achieved at an appropriate cost to the economic benefits.
Table 3. The calculation of membership degrees.
xi IntervalCalculation of Membership Degrees in Different Intervals
54321
xi > c510000
c4 < xic5(xic4)/(c5c4)(c5xi)/(c5c4)000
c3 < xic40(xic3)/(c4c3)(c4xi)/(c4c3)00
c2 < xic300(xic2)/(c3c2)(c3xi)/(c3c2)0
c1 < xic2000(xic1)/(c2c1)(c2xi)/(c2c1)
c0 < xic100001
Notes: xi indicates the evaluated value; ci represents the inflection point of the corresponding evaluation intervals (4, 5], (3, 4], (2, 3], (1, 2], and (0, 1].
Table 4. RI values.
Table 4. RI values.
Dimension123456789
RI0.000.000.580.901.121.241.321.411.45
Table 5. Calculation and evaluation values of each indicator for green construction assessment of Wudongde Hydropower Station.
IndicatorD11D12D21D22D31D32D41D42D43D44
Calculation value4.833.7155533.673.6755
Evaluation value4.833.7155533.673.6755
IndicatorD51D52D53D61D62D71D81D82D83E11
Calculation value2.163382.5330.6297.16%87.77%3.16
Evaluation value2.1632.52.5331553.16
IndicatorE12E21E22E31E41E42F11F12F21F22
Calculation value0.74110.08%24%0.407102.82%88.22%4.334.332.6671.43%
Evaluation value52.75152.434.9114.334.332.662.072
IndicatorF23F24F31F32F33F41F42
Calculation value2.3355596.655
Evaluation value2.33555555
Table 6. Weight of each indicator for green construction of large-scale hydropower projects.
Rule LayerWeightClassification LayerWeightIndicator LayerWeightFinal WeightRanking
D0.667D10.239D110.6670.1061
D120.3330.0534
D20.089D210.7500.0455
D220.2500.01524
D30.089D310.5000.03014
D320.5000.03015
D40.089D410.3000.01820
D420.3000.01821
D430.3000.01822
D440.1000.00636
D50.171D510.3330.0388
D520.3330.0389
D530.3330.03810
D60.042D610.8000.02219
D620.2000.00637
D70.042D711.0000.02816
D80.239D810.4440.0712
D820.1110.01823
D830.4440.0713
E0.167E10.250E110.8000.03311
E120.2000.00834
E20.250E210.7500.03112
E220.2500.01025
E30.250E311.0000.0427
E40.250E410.7500.03113
E420.2500.01026
F0.167F10.190F110.7500.02418
F120.2500.00835
F20.420F210.6250.0446
F220.1250.00931
F230.1250.00932
F240.1250.00933
F30.269F310.2000.00929
F320.2000.00930
F330.6000.02717
F40.210F410.5000.01027
F420.5000.01028
Table 7. The evaluation values and membership degrees of the classification layer indicators for green construction.
Classification Layer IndicatorEvaluation Value54321
Water environment D14.4570.4570.543000
Groundwater environment D25.00010000
Atmospheric environment D34.00001000
Acoustic environment D44.2020.2020.798000
Solid waste D52.551000.5510.4490
Protection of terrestrial ecosystem D62.600000.6000.4000
Protection of aquatic ecosystem D73.000001.00000
Water and soil conservation D83.21900.2190.78100
Material utilization E13.528 00.5280.47200
Utilization of water resources E22.313 000.3130.6870
Energy utilization E35.000 10000
Utilization of land resources E43.050 00.0500.95000
Organizational management F14.330 0.3300.670000
Implementation management F22.838000.8380.1620
Health management of personnel F35.00010000
External supervision F45.00010000
Table 8. The evaluation values and membership degrees of the rule layer indicators for green construction.
Rule Layer IndicatorEvaluation Value54321
Environmental protection D3.68100.6810.31900
Resource saving E3.47300.4730.52700
Comprehensive management F3.96500.9650.03500
Publisher’s Note: MDPI stays neutral with regard to jurisdictional claims in published maps and institutional affiliations.

