
A GIS-Based Spatiotemporal Modelling of Urban Traffic Accidents in Tabriz City during the COVID-19 Pandemic

 ,
,  ,
,  ,
, 


Abstract
:1. Introduction
2. Materials and Methods
2.1. Study Area
2.2. Dataset
2.3. Methodology
2.3.1. Urban Traffic Accident Hotspot Analysis
2.3.2. Comap Method
2.3.3. Severity Index
2.3.4. Kernel Density Estimation Technique
2.3.5. Global Moran’s Index
3. Results
3.1. Trend Analysis of Urban Traffic Accidents
3.2. Applying the Severity Index to Analyze the High-Risk Areas
4. Discussion
5. Conclusions
Author Contributions
Funding
Institutional Review Board Statement
Informed Consent Statement
Data Availability Statement
Acknowledgments
Conflicts of Interest
References
- Ghosh, S.K.; Parida, M.; Uraon, J.K. Traffic accident analysis for Dehradun city using GIS. ITPI J. 2004, 1, 40–54. [Google Scholar]
- Al-Aamri, A.K.; Hornby, G.; Zhang, L.C.; Al-Maniri, A.A.; Padmadas, S.S. Mapping road traffic crash hotspots using GIS-based methods: A case study of Muscat Governorate in the Sultanate of Oman. Spat. Stat. 2020, 42, 100458. [Google Scholar] [CrossRef]
- Sameen, M.I.; Pradhan, B. A two-stage optimization strategy for fuzzy object-based analysis using airborne LiDAR and high-resolution orthophotos for urban road extraction. Sensors 2017, 2017. [Google Scholar] [CrossRef] [Green Version]
- Sameen, M.I.; Pradhan, B.; Shafri, H.Z.; Mezaal, M.R.; Bin Hamid, H. Integration of ant colony optimization and object-based analysis for LiDAR data classification. IEEE J. Sel. Top. Appl. Earth Obs. Remote Sens. 2017, 10, 2055–2066. [Google Scholar] [CrossRef]
- Pradhan, B.; Sameen, M.I. Modeling traffic accident severity using neural networks and support vector machines. In Laser Scanning Systems in Highway and Safety Assessment; Springer: Cham, Germany, 2020; pp. 111–117. [Google Scholar]
- Cheba, K.; Saniuk, S. Sustainable urban transport—The concept of measurement in the field of city logistics. Transp. Res. Proedria 2016, 16, 35–45. [Google Scholar] [CrossRef] [Green Version]
- Erdoğan, S.; Ali Derel, M.; Şeno, H.I. A GIS-based assessment of long-term trafc accidents using spatiotemporal and empirical Bayes analysis in Turkey. Appl. Geomat. 2022, 14, 147–162. [Google Scholar] [CrossRef]
- Raicu, S.; Costescu, D.; Burciu, S. The evaluation of road safety performances in urban areas. Urban Transp. 2014, 138, 447–458. [Google Scholar]
- Naboureh, A.; Feizizadeh, B.; Naboureh, A.; Bian, J.; Blaschke, T.; Ghorbanzadeh, O.; Moharami, M. Traffic Accident Spatial Simulation Modeling for Planning of Road Emergency Services. ISPRS Int. J. Geo-Inf. 2019, 8, 371. [Google Scholar] [CrossRef] [Green Version]
- Shazad, M. Review of road accident analysis using GIS technique. Int. J. Inj. Control. Saf. Promot. 2020, 27, 472–481. [Google Scholar] [CrossRef]
- Le, K.G.; Liu, P.; Lin, L.-T. Determining the road traffic accident hotspots using GIS-based temporal-spatial statistical analytic techniques in Hanoi, Vietnam. Geo-Spat. Inf. Sci. 2020, 23, 153–164. [Google Scholar] [CrossRef] [Green Version]
- Hsu, Y.C.; Shiu, Y.M.; Chou, P.L.; Chen, Y.M.J. Vehicle insurance and the risk of road traffic accidents. Transp. Res. Part A Policy Pract. 2015, 74, 201–209. [Google Scholar] [CrossRef]
- Saladié, O.; Bustamante, E.; Gutiérrez, A. COVID-19 lockdown and reduction of traffic accidents in Tarragona province, Spain. Transp. Res. Interdiscip. Perspect. 2020, 8, 100218. [Google Scholar] [CrossRef] [PubMed]
- WHO (World Health Organization). Global Status Report on Road Safety 2018: Summary (No. WHO/NMH/NVI/18.20). 2018. Available online: https://www.who.int/publications/i/item/9789241565684 (accessed on 5 October 2018).
- WHO. Global Status Report on Road Safety 2018; World Health Organization: Geneva, Switzerland, 2018.
- WHO. Road Traffic Injuries. 2021. Available online: https://www.who.int/news (accessed on 10 September 2021).
- Gorea, R.K. Financial impact of road traffic accidents on the society. Int. J. Ethics Trauma Vict. 2016, 2, 6–9. [Google Scholar] [CrossRef]
- Wan, Y.; He, W.; Zhou, J. Urban Road Accident Black Spot Identification and Classification Approach: A Novel Grey Verhuls–Empirical Bayesian Combination Method. Sustainability 2021, 13, 11198. [Google Scholar] [CrossRef]
- Retallack, A.E.; Ostendorf, B. Current understanding of the effects of congestion on traffic accidents. Int. J. Environ. Res. Public Health 2019, 16, 3400. [Google Scholar] [CrossRef] [PubMed] [Green Version]
- Dereli, M.A.; Erdogan, S. A New Model for Determining the Traffic Accident Black Spots Using GIS-aided Spatial Statistical Methods. Transp. Res. Part A Policy Pract. 2017, 103, 106–117. [Google Scholar] [CrossRef]
- Tortum, A.; Atalay, A. Spatial analysis of road mortality rates in Turkey. Proc. Inst. Civ. Eng. Transp. 2015, 168, 532–542. [Google Scholar] [CrossRef]
- Yalcin, G.; Duzgun, H.S. Spatial analysis of two-wheeled vehicles traffic crashes: Osmaniye in Turkey. KSCE J. Civ. Eng. 2015, 19, 2225–2232. [Google Scholar] [CrossRef]
- Zahran, E.-S.M.M.; Tan, S.J.; Tan, E.H.A.; Putra, N.A.B.M.; Yap, Y.H.; Rahman, E.K.A. Spatial analysis of road traffic accident hotspots: Evaluation and validation of recent approaches using road safety audit. J. Transp. Saf. Secur. 2021, 13, 575–604. [Google Scholar] [CrossRef]
- WHO. Global Status Report on Road Safety 2015; Management of Noncommunicable Diseases, Disability, Violence and Injury Prevention (NVI): Geneva, Switzerland, 2015. Available online: https://www.afro.who.int/publications/global-status-report-road-safety-2015 (accessed on 20 October 2015).
- MOT (Ministry of Transport). Regulations on the Identification and Handling of Hazardous Locations on Roads Being Exploited. Circular 2012, 96, 774. [Google Scholar] [CrossRef]
- Li, L.; Zhu, L.; Sui, D.Z. A GIS-based Bayesian approach for analyzing spatial–Temporal patterns of intra-city motor vehicle crashes. J. Transp. Geogr. 2007, 15, 274–285. [Google Scholar] [CrossRef]
- Shi, Z.; Pun-Cheng, L.S. Spatiotemporal data clustering: A survey of methods. ISPRS Int. J. Geo-Inf. 2019, 8, 112. [Google Scholar] [CrossRef] [Green Version]
- Han, H.S.; Lee, G.H. Analysis of children traffic accidents around school area using GIS and data mining techniques. ICIC Express Lett. Part B Appl. 2020, 11, 161–167. [Google Scholar]
- Halimi, L.; Bagheri, N.; Hoseini, B.; Hashtarkhani, S.; Goshayeshi, L.; Kiani, B. Spatial analysis of colorectal cancer incidence in Hamadan Province, Iran: A retrospective cross-sectional study. Appl. Spat. Anal. Policy 2019, 13, 1–11. [Google Scholar] [CrossRef]
- Harirforoush, H. An integrated GIS-based and spatiotemporal analysis of traffic accidents: A case study in Sherbrooke. Ph.D. Thesis, Université de Sherbrooke, Sherbrooke, QC, Canada, 2017. [Google Scholar]
- Huang, C.; Wang, Y.; Li, X.; Ren, L.; Zhao, J.; Hu, Y.; Cheng, Z. Clinical features of patients infected with 2019 novel coronavirus in Wuhan, China. Lancet 2020, 395, 497–506. [Google Scholar] [CrossRef] [Green Version]
- McKenzie, G.; Adams, B. A country comparison of place-based activity response to COVID-19 policies. Appl. Geogr. 2020, 125, 102363. [Google Scholar] [CrossRef]
- Feizizadeh, B.; Omarzadeh, D.; Ronagh, Z.; Sharifi, A.; Blaschke, T.; Lakes, T. A scenario-based approach for urban water management in the context of the COVID-19 pandemic and a case study for the Tabriz metropolitan area, Iran. Sci. Total Environ. 2021, 790, 148272. [Google Scholar] [CrossRef]
- Mouratidis, K.; Papagiannakis, A. COVID-19, internet, and mobility: The rise of telework, telehealth, e-learning, and e-shopping. Sustain. Cities Soc. 2021, 74, 103182. [Google Scholar] [CrossRef]
- Iranian Statistical Research and Training Center. Analytical Report for Road Accidents and Damages. 2022. Available online: https://srtc.ac.ir/ (accessed on 17 June 2022).
- Shilling, F.; Waetjen, D. Special Report: Impact of COVID-19 on California Traffic Accidents. Road Ecol. Cent. 2020. [CrossRef]
- Brodeur, A.; Cook, N.; Wright, T. On the Effects of COVID-19 Safer-at-Home Policies on Social Distancing, Car Crashes and Pollution. J. Environ. Econ. Manag. 2021, 106, 102427. [Google Scholar] [CrossRef]
- Sharifi, A.; Khavarian-Garmsir, A.R. The COVID-19 pandemic: Impacts on cities and major lessons for urban planning, design, and management. Sci. Total Environ. 2020, 749, 142391. [Google Scholar] [CrossRef] [PubMed]
- Dehghani, M.H.; Hopke, P.K.; Asghari, F.B.; Mohammadi, A.A.; Yousefi, M. The effect of the decreasing level of Urmia Lake on particulate matter trends and attributed health effects in Tabriz, Iran. Microchem. J. 2020, 153, 104434. [Google Scholar] [CrossRef]
- MOHME. Ministry of Health and Medical Education. Monthly Report for COVID-19 Disease. 2021. Available online: https://irangov.ir/ministry-of-health-and-medical-education (accessed on 10 November 2021).
- Traffic Police of Tabriz. Annual Report and Trend Analysis. 2021. Available online: www.traffic.tabriz.ir (accessed on 15 September 2021).
- Geurts, K.; Wets, G.; Brijs, T.; Vanhoof, K. Identification and ranking of black spots: Sensitivity analysis. Transp. Res. Rec. 2004, 1897, 34–42. [Google Scholar] [CrossRef]
- Li, T.; Corcoran, J. Using flow-Comap technique to visualize spatial-temporal patterns of public bike sharing program and the effect of weather and contender events. In CUPUM 2015-14th International Conference on Computers in Urban Planning and Urban Management; CUPUM: Cambridge, MA, USA, 2015. [Google Scholar]
- Brunsdon, C.; Corcoran, J.; Higgs, G. Visualising space and time in crime patterns: A comparison of methods. Comput. Environ. Urban Syst. 2007, 31, 52–75. [Google Scholar] [CrossRef]
- Brunsdon, C. The Comap: Exploring spatial pattern via conditional distributions. Comput. Environ. Urban Syst. 2001, 25, 53–68. [Google Scholar] [CrossRef]
- Han, J.; Pei, J.; Kamber, M. Data Mining: Concepts and Techniques, 3rd ed.; Elsevier: Amsterdam, The Netherlands, 2012. [Google Scholar]
- Sandhu, H.A.S.; Singh, G.; Sisodia, M.S.; Chauhan, R. Identification of Black Spots on Highway with Kernel Density Estimation Method. J. Indian Soc. Remote Sens. 2016, 44, 457–464. [Google Scholar] [CrossRef]
- Vemulapalli, S.S.; Ulak, M.B.; Ozguven, E.E.; Sando, T.; Horner, M.W.; Abdelrazig, Y.; Moses, R. GIS-based spatial and temporal analysis of aging-involved accidents: A Case Study of Three Counties in Florida. Appl. Spat. Anal. Policy 2017, 10, 537–563. [Google Scholar] [CrossRef]
- Harirforoush, H.; Bellalite, L. A new integrated GIS-based analysis to detect hotspots: A case study of the city of Sherbrooke. Accid. Anal. Prev. 2019, 130, 62–74. [Google Scholar] [CrossRef]
- Cheng, Z.; Zu, Z.; Lu, J. Traffic Crash Evolution Characteristic Analysis and Spatiotemporal Hotspot Identification of Urban Road Intersections. Sustainability 2019, 11, 160. [Google Scholar] [CrossRef] [Green Version]
- Achu, A.L.; Aju, C.D.; Suresh, V.; Manoharan, T.P.; Reghunath, R. Spatio-temporal analysis of road accident incidents and delineation of hotspots using geospatial tools in Thrissur District, Kerala, India. KN-J. Cartogr. Geogr. Inf. 2019, 69, 255–265. [Google Scholar] [CrossRef]
- Özcan, M.; Küçükönder, M. Investigation of Spatiotemporal Changes in the Incidence of Traffic Accidents in Kahramanmaraş, Turkey, Using GIS-Based Density Analysis. J. Indian Soc. Remote Sens. 2020, 48, 1045–1056. [Google Scholar] [CrossRef]
- Wang, S.; Li, W.; Zhang, X.; Jia, Q.; Tian, Y. Understanding intra-urban human mobility through an exploratory spatiotemporal analysis of bike-sharing trajectories. Int. J. Geogr. Inf. Sci. 2020, 34, 2451–2474. [Google Scholar]
- Dudzińska, M.; Prus, B.; Cellmer, R.; Bacior, S.; Kocur-Bera, K.; Klimach, A.; Trystuła, A. The Impact of Flood Risk on the Activity of the Residential Land Market in a Polish Cultural Heritage Town. Sustainability 2020, 12, 10098. [Google Scholar] [CrossRef]
- Hussain, M.D.H.; Goswam, A.K.; Gupta, A. Predicting pedestrian crash locations in urban India: An integrated GIS-based spatiotemporal HSID technique. J. Transp. Saf. Secur. 2022, 1–34. [Google Scholar] [CrossRef]
- Anderson, T.K. Kernel density estimation and K-means clustering to profile road accident hotspots. Accid. Anal. Prev. 2009, 41, 359–364. [Google Scholar] [CrossRef]
- O’Sullivan, D.; Unwin, D.J. Geographic Information Analysis; John Wiley and Sons: New York, NY, USA, 2010. [Google Scholar]
- Nazmfar, H.; Alavi, S.; Feizizadeh, B.; Mostafavi, M.A. Analysis of Spatial Distribution of Crimes in Urban Public Spaces. J. Urban Plan. Dev. 2020, 146. [Google Scholar] [CrossRef]
- Nazmfar, H.; Alavi, S.; Feizizadeh, B.; Eshgi, A. An integrated approach of the analytic network process and barometer model mapping of human settlement sustainability in Ardebil Province, Iran. Appl. Geomat. 2022, 14, 237–252. [Google Scholar] [CrossRef]
- Bíl, M.; Andrášik, R.; Sedoník, J. A detailed spatiotemporal analysis of traffic crash hotspots. Appl. Geogr. 2019, 107, 82–90. [Google Scholar] [CrossRef]
- Schabenberger, O.; Gotway, C.A. Statistical Methods for Spatial Data Analysis; CRC Press: Boca Raton, FL, USA, 2017. [Google Scholar]
- Feizizadeh, B.; Ronagh, Z.; Pourmoradian, S.; Gheshlaghi, H.A.; Lakes, T.; Blaschke, T. An efficient GIS-based approach for sustainability assessment of urban drinking water consumption patterns: A study in Tabriz city, Iran. Sustain. Cities Soc. 2020, 64, 102584. [Google Scholar] [CrossRef]


| Year | Number of Vehicles | Number of Road Accidents | Number of Deaths |
|---|---|---|---|
| 2013 | 15,752,815 | 14,488 | 17,994 |
| 2014 | 18,129,053 | 13,975 | 16,872 |
| 2015 | 20,341,520 | 14,213 | 16,868 |
| 2016 | 23,581,222 | 13,875 | 16,150 |
| 2017 | 26,842,915 | 14,107 | 16,509 |
| 2018 | 30,116,599 | 14,323 | 17,183 |
| 2019 | 33,680,906 | 11,408 | 13,703 |
| Year | Deaths | Injured |
|---|---|---|
| 2016 | 118 | 6218 |
| 2017 | 100 | 7172 |
| 2018 | 88 | 7272 |
| 2019 | 100 | 4981 |
| 2020 | 109 | 3008 |
| Time Division | Trash Type | Injury Type | ||||||||
|---|---|---|---|---|---|---|---|---|---|---|
| Year | Season | Month | Damage | Injury | Death | Accident Total | Driver | Pedestrian | Passenger | Total Injury |
| 2018–2019 | Spring | April | 155 | 144 | 0 | 511 | 69 | 59 | 50 | 180 |
| May | 178 | 210 | 1 | 399 | 79 | 73 | 92 | 245 | ||
| June | 190 | 228 | 1 | 440 | 99 | 78 | 84 | 262 | ||
| Summer | July | 198 | 264 | 0 | 462 | 93 | 60 | 95 | 248 | |
| August | 222 | 251 | 2 | 475 | 82 | 74 | 104 | 260 | ||
| September | 239 | 207 | 3 | 449 | 65 | 56 | 87 | 208 | ||
| Autumn | October | 230 | 206 | 3 | 439 | 68 | 63 | 79 | 210 | |
| November | 259 | 197 | 2 | 458 | 59 | 43 | 88 | 190 | ||
| December | 290 | 220 | 1 | 511 | 58 | 73 | 102 | 233 | ||
| Winter | January | 300 | 209 | 2 | 419 | 63 | 68 | 84 | 215 | |
| February | 260 | 136 | 4 | 389 | 52 | 45 | 59 | 156 | ||
| March | 257 | 182 | 1 | 419 | 70 | 52 | 83 | 205 | ||
| 2019–2020 | Spring | April | 145 | 137 | 2 | 284 | 67 | 51 | 59 | 177 |
| May | 203 | 159 | 2 | 363 | 74 | 43 | 65 | 182 | ||
| June | 213 | 165 | 3 | 381 | 70 | 56 | 74 | 199 | ||
| Summer | July | 237 | 226 | 2 | 465 | 125 | 77 | 89 | 291 | |
| August | 275 | 226 | 0 | 501 | 99 | 73 | 93 | 265 | ||
| September | 198 | 207 | 1 | 406 | 103 | 50 | 77 | 230 | ||
| Autumn | October | 110 | 164 | 4 | 278 | 82 | 46 | 70 | 198 | |
| November | 36 | 165 | 6 | 207 | 63 | 43 | 62 | 168 | ||
| December | 25 | 149 | 3 | 177 | 65 | 31 | 60 | 157 | ||
| Winter | January | 21 | 139 | 0 | 160 | 50 | 49 | 50 | 149 | |
| February | 41 | 116 | 1 | 158 | 41 | 27 | 53 | 121 | ||
| March | 22 | 107 | 2 | 131 | 62 | 34 | 31 | 127 | ||
| 2020 | Spring | April | 19 | 68 | 6 | 98 | 34 | 20 | 22 | 76 |
| May | 21 | 104 | 4 | 127 | 61 | 29 | 26 | 116 | ||
| June | 10 | 99 | 2 | 112 | 47 | 26 | 33 | 105 | ||
| Summer | July | 9 | 91 | 1 | 101 | 54 | 25 | 31 | 111 | |
| August | 14 | 131 | 6 | 151 | 67 | 27 | 48 | 142 | ||
| September | 30 | 184 | 5 | 219 | 82 | 52 | 70 | 202 | ||
| Autumn | October | 25 | 143 | 2 | 170 | 65 | 31 | 50 | 146 | |
| November | 1 | 88 | 3 | 92 | 51 | 31 | 28 | 110 | ||
| Data | Class | Scale and Details |
|---|---|---|
| Land use | Administrative educational Services Urban Facilities Commercial Recreational Industrial Residential areas Agriculture and Livestock Transportation | update data in the scale of 1/2000 |
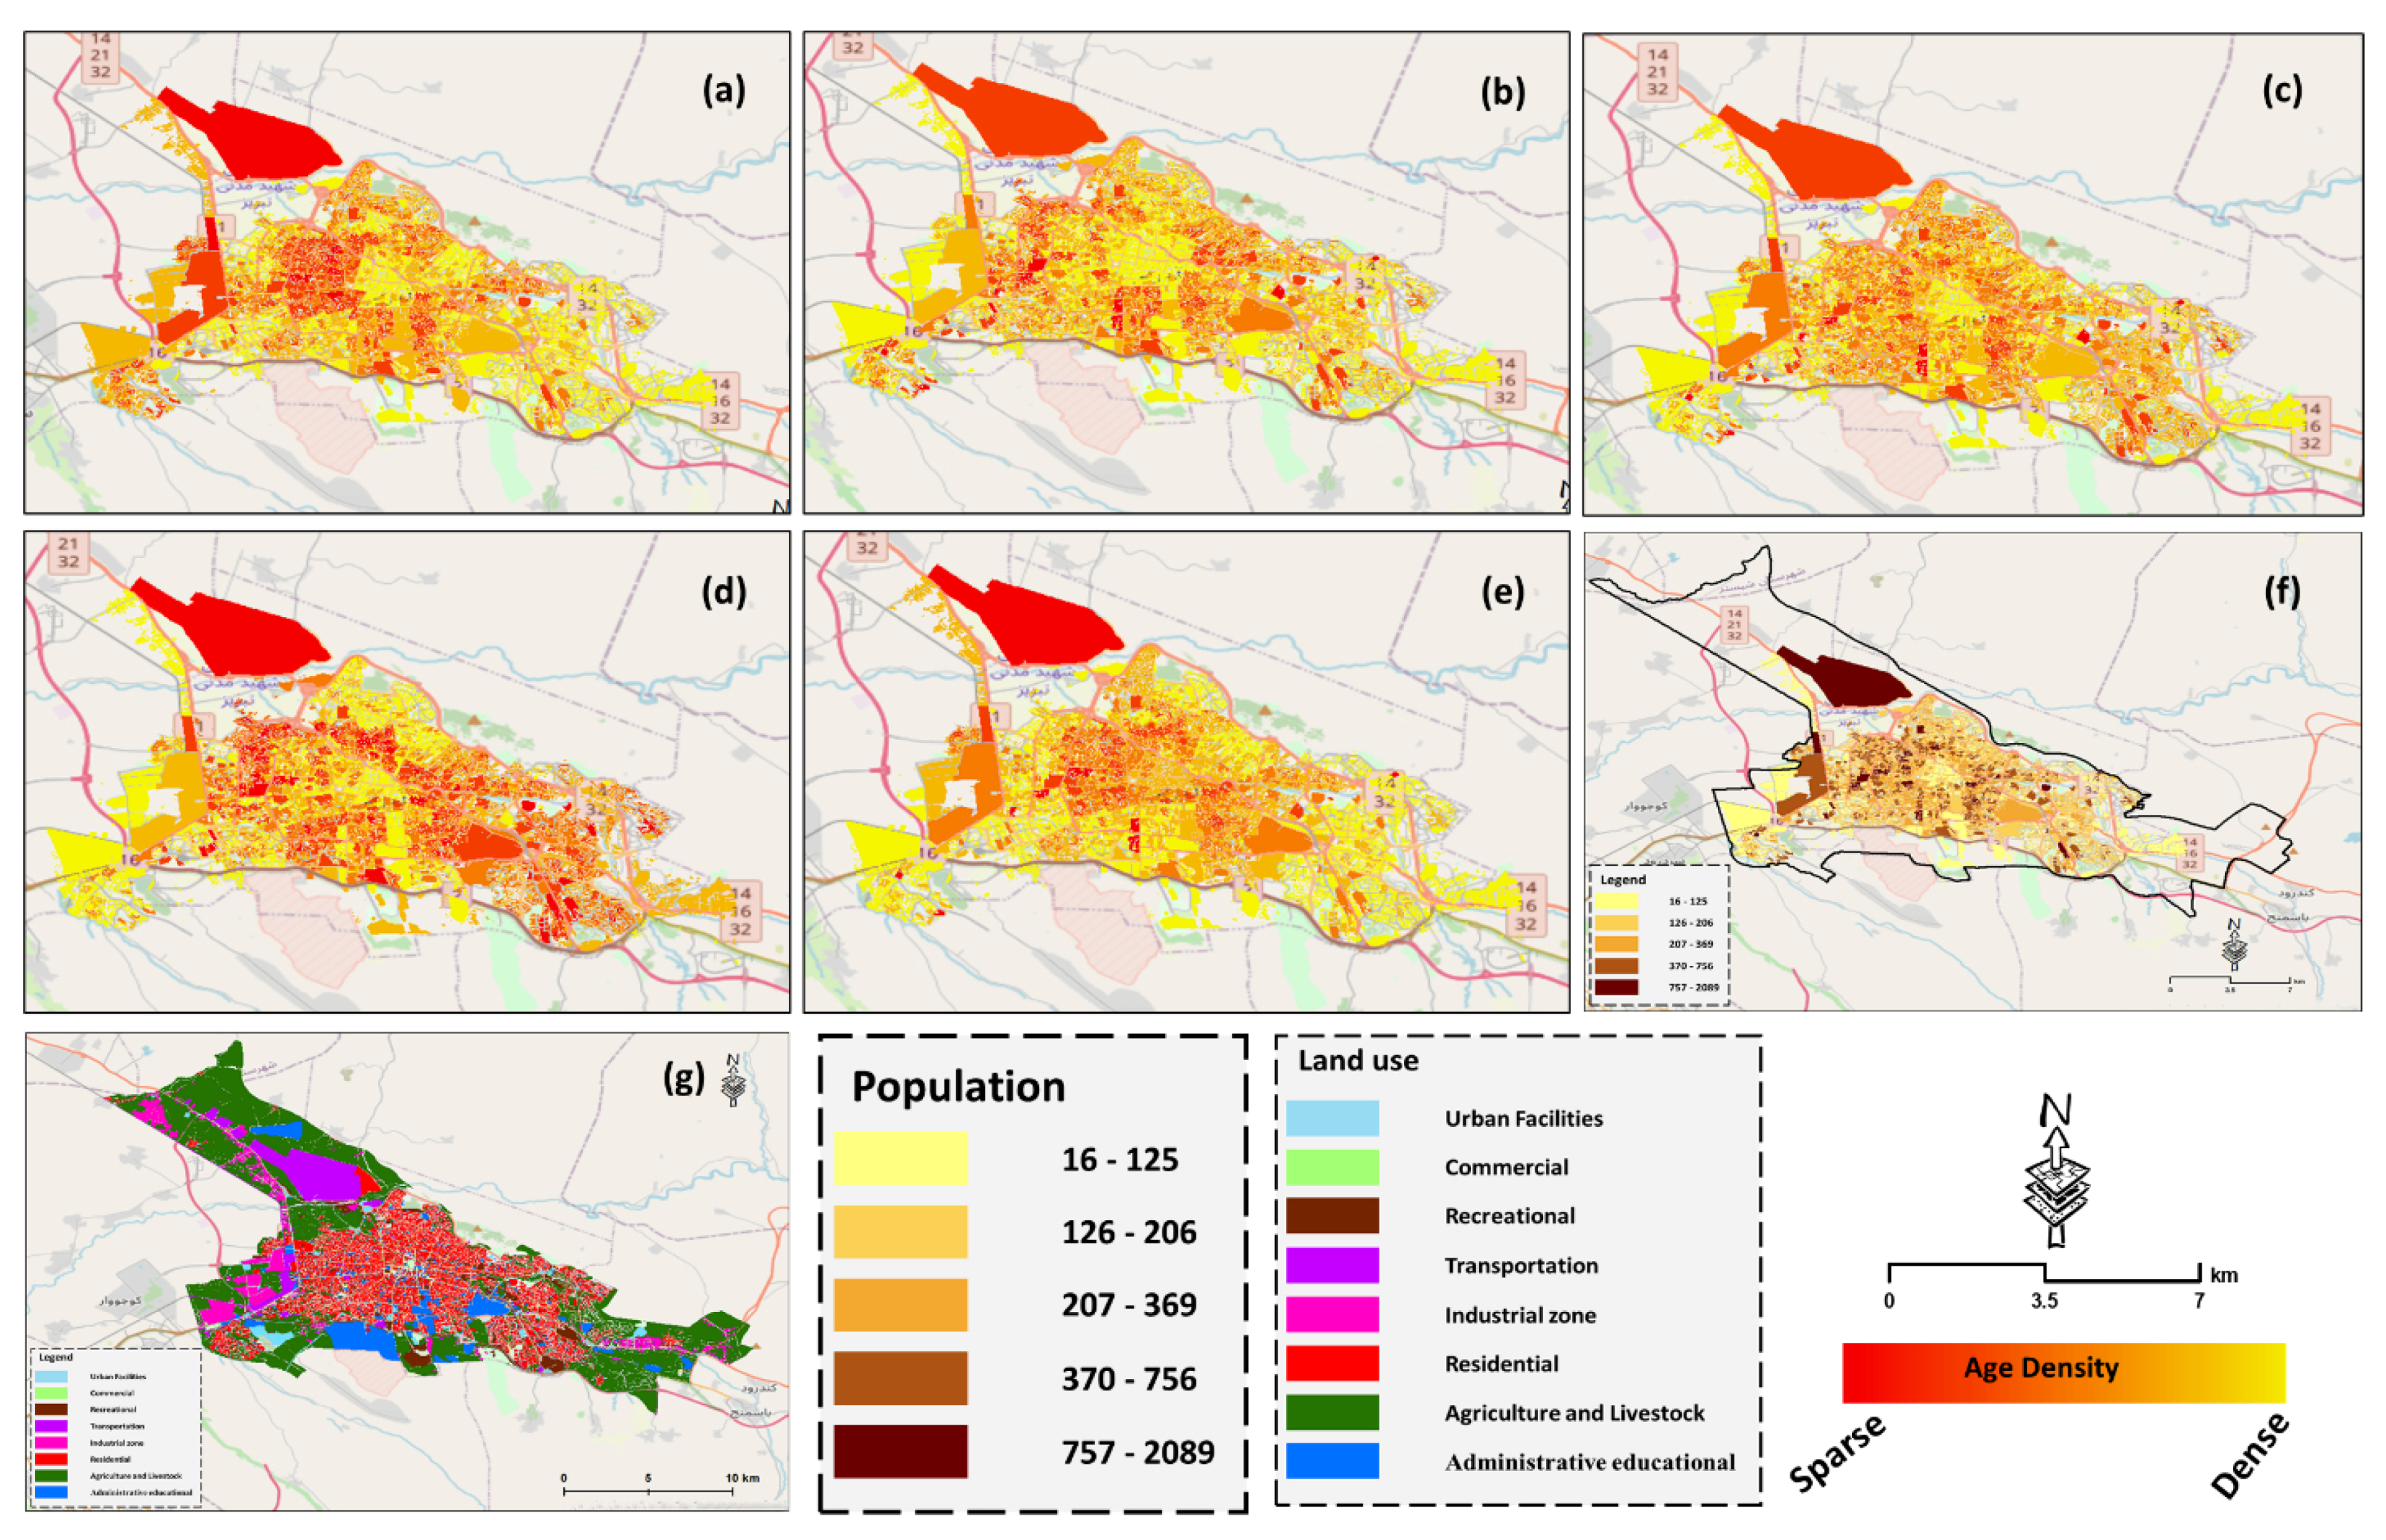
| Demographics | Population Density (inhabitants/km2?) | 16–125 126–206 207–369 370–756 757–2089 |
| Age | 0–10 (232,431) 11–20 (320,243) 21–35 (394,948) 35–45 (302,204) >45 (234,310) |
Publisher’s Note: MDPI stays neutral with regard to jurisdictional claims in published maps and institutional affiliations. |
© 2022 by the authors. Licensee MDPI, Basel, Switzerland. This article is an open access article distributed under the terms and conditions of the Creative Commons Attribution (CC BY) license (https://creativecommons.org/licenses/by/4.0/).
Share and Cite
Feizizadeh, B.; Omarzadeh, D.; Sharifi, A.; Rahmani, A.; Lakes, T.; Blaschke, T. A GIS-Based Spatiotemporal Modelling of Urban Traffic Accidents in Tabriz City during the COVID-19 Pandemic. Sustainability 2022, 14, 7468. https://doi.org/10.3390/su14127468
Feizizadeh B, Omarzadeh D, Sharifi A, Rahmani A, Lakes T, Blaschke T. A GIS-Based Spatiotemporal Modelling of Urban Traffic Accidents in Tabriz City during the COVID-19 Pandemic. Sustainability. 2022; 14(12):7468. https://doi.org/10.3390/su14127468
Chicago/Turabian StyleFeizizadeh, Bakhtiar, Davoud Omarzadeh, Ayyoob Sharifi, Abolfazl Rahmani, Tobia Lakes, and Thomas Blaschke. 2022. "A GIS-Based Spatiotemporal Modelling of Urban Traffic Accidents in Tabriz City during the COVID-19 Pandemic" Sustainability 14, no. 12: 7468. https://doi.org/10.3390/su14127468