1. Introduction
Greenhouse gas (GHG) and ammonia (NH
3) emissions from the agricultural sector are an increasing concern for environmental issues, because of their contribution to climate change and acid deposition [
1].
Carbon dioxide (CO
2) has a great role in the biosphere with an increasing atmospheric concentration due to human activities; hence, it is the most researched GHG during recent decades [
1]. Nitrous oxide (N
2O) is part of the nitrogen cycle influenced by anthropogenic modifications in nutrient supply. Its concentration in the atmosphere has also increased since the industrial revolution. Besides its greenhouse effect, N
2O contributes to stratospheric ozone depletion, thus, understanding the background processes is required [
2,
3] to develop reducing strategies. CO
2 and N
2O emissions of agriculture can originate from land-use changes, different tillage methods, or fertilization management. The main sources of NH
3 from the agricultural sector are animal husbandry and volatilization after fertilization events [
4]. Although its atmospheric concentration was not increased during the last century, NH
3 has a role in air pollution and acid deposition. It contributes to eutrophication, soil and water acidification. Moreover, it has direct toxicity to plant surfaces and after deposition it can be a source of secondary N
2O emission. Therefore, the development of reducing techniques is desirable [
5,
6].
There are several techniques used to examine soil-derived GHG and NH
3 emissions, which are currently not standardized. One of the most commonly used methods for such investigations is the incubation chamber technique, e.g., using a static or dynamic chamber [
7,
8,
9,
10]. In these closed system chambers, gas concentrations change during a gas-specific incubation time and air samples can be collected with airtight syringes and quantified later using gas chromatography, or immediate analysis can be performed using in situ gas-specific or multigas analyzers [
11,
12,
13]. Gas emission values can be calculated using linear or quadratic equations based on the initial and final GHG concentrations [
14,
15].
There are several techniques used to enrich soils with nutrients providing better plant growth and higher crop yields. Mineral (calcium ammonium nitrate, urea, etc.) and organic (pig slurry, cattle slurry, manure, etc.) fertilizers are applied all over the world depending on soil types and cultivated crops. With the increasing food demand and more intensive animal husbandry occurring worldwide, the increasing amounts of secondary products such as manure must be resolved. An apparent solution is to use animal manure as a fertilizer in crop production. Organic and mineral fertilizers have different C:N ratios that can affect soil GHG emissions [
16]. The organic matter of different manures, compost, and slurry has a main role in CO
2 and N
2O emissions, since higher SOC might causes higher emissions [
17]. Lower C:N ratios might result in higher NH
3 emissions, while aeration is also an important factor for NH
3 and N
2O emissions [
18].
Pig slurry is commonly used as an organic liquid fertilizer. The quantification of the proportion of different fertilizers in global nutrient supplies can be difficult, thus, often only estimates are available. For example, in Hungary, around 2.1–4.6% of the total nitrogen input comes from pig slurry [
19]. Worldwide, pig manure is not the most common source of nitrogen; it contributes around 10% to total manure production, compared to cattle slurry which is around 44% [
20]. Pig slurry enriches soils with nutrients (nitrogen and carbon supply) and promotes microbiological processes [
21,
22,
23,
24], consequently influencing CO
2, N
2O, and NH
3 emissions [
25,
26]. The nitrogen content of pig slurry not only ensures balanced crop production and yields but also is a danger for nitrogen losses such as NH
3 emissions and nitrate (NO
3−) leaching to the surface and groundwater reservoirs [
27,
28]. Nitrogen forms, such as ammonium (NH
4+), nitrite (NO
2−), and nitrate (NO
3−) leached from soils are pollutants of the environment causing eutrophication of surface waters [
29,
30,
31] and acidification of soils [
32,
33].
Pig slurry application techniques may result in changes in the chemical properties of soil and soil water and soil GHG and NH
3 emissions [
34,
35,
36], therefore, the appropriate choice of these techniques could be a form of CO
2 emission and reactive nitrogen (N
2O and NH
3) loss mitigation policy. The most common techniques of pig slurry application are surface spray/spread, trailing shoes and trailing hose, incorporation, and row injection (shallow, deep, open slot, etc.) [
34,
37]. Some studies report higher GHG and NH
3 emissions of soils under surface spray than injection techniques [
36,
37,
38]. However, others found that utilizing slurry applications may result in mitigation of NH
3 but can cause elevated GHG emissions [
39], or injection can result in elevated N
2O emissions rather than surface techniques [
40]. Surface spray techniques of pig slurry can promote soil GHG and NH
3 emissions due to higher evaporation rates and higher exposure to environmental conditions, while injections may cause elevated emissions, especially N
2O because of their positive effect on the anaerobic soil environment and denitrification processes [
41,
42]. Environmental drivers such as air temperature (T
a) and precipitation are coupled with soil water content (SWC) and soil temperature (T
s) that alter CO
2 emissions and reactive nitrogen loss of soils [
43]. In most ecosystems, higher SWC and T
s are considered as facilitating factors of GHG and NH
3 emissions, but decreases in NH
3 emissions are also reported after heavy rainfalls, especially in the case of surface applications [
39].
The proposed usage (especially field applications), the different pre-treatments (e.g., acidification, digestion), and storage methods (outdoor and deep-pit storage) of pig slurry can be considered as environmental hot-spots [
44]. According to numerous pig slurry treatment scenarios, these factors have negative effects on global warming potential with great variability in the simulated results [
44], and these techniques used by farmers can significantly affect GHG emissions [
45]. Timing of slurry application regarding ideal weather conditions is a key question to minimize nitrogen losses. For example, in EU countries legislation requires the development of future emission limits, especially for NH
3 emissions (Directive (EU) 2016/2284).
There are a number of publications on the effect of slurry application techniques on GHG and NH3 emissions but there are still uncertainties and unknown processes yet to be understood; thus, further laboratory and field studies are required. The objective of this experiment was to investigate the short-term effect of two different pig slurry applications of surface spreading and soil injection on (i) CO2 and N2O emissions; (ii) NH3 emissions; and (iii) soil chemical properties and nitrogen leaching of a sandy soil. To better understand the effect of the application techniques on soil GHG and NH3 emissions, we also used three irrigation strategies, one of which was the non-irrigated control during the experiment. We hypothesized that GHG and NH3 emissions can be minimized based on the pig slurry application technique.
2. Materials and Methods
2.1. Experimental Setup and Pig Slurry Application Techniques
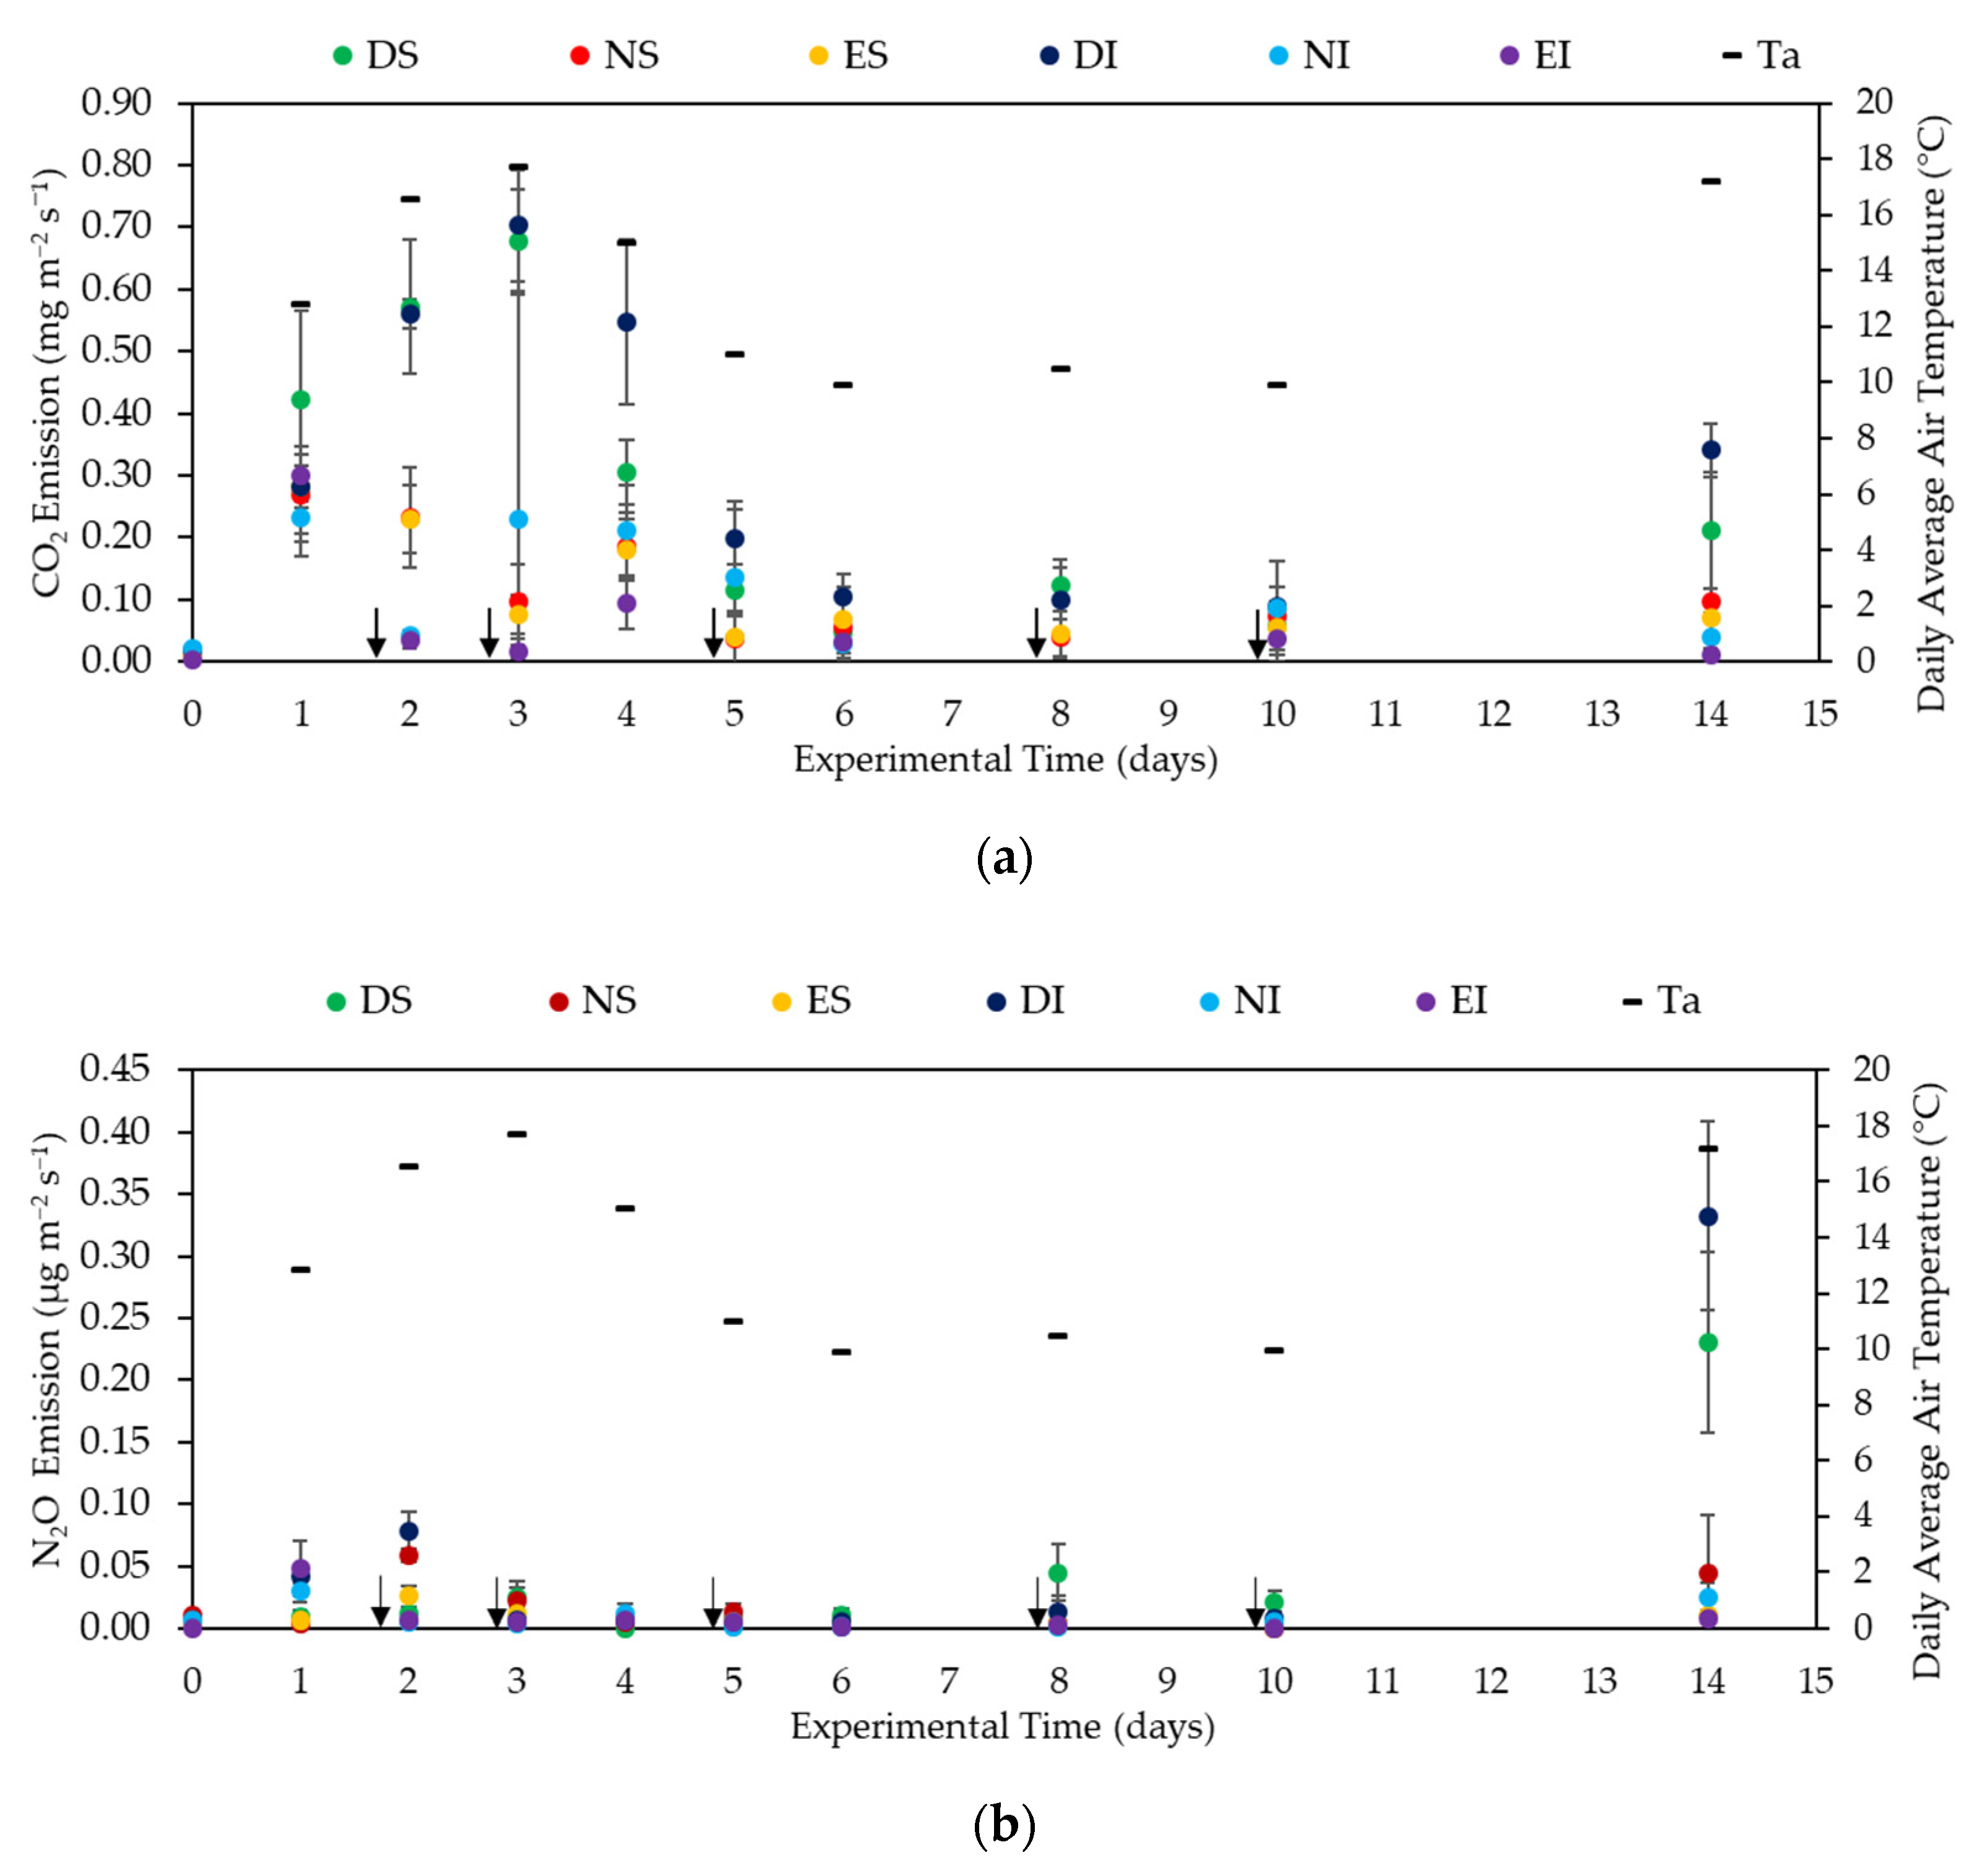
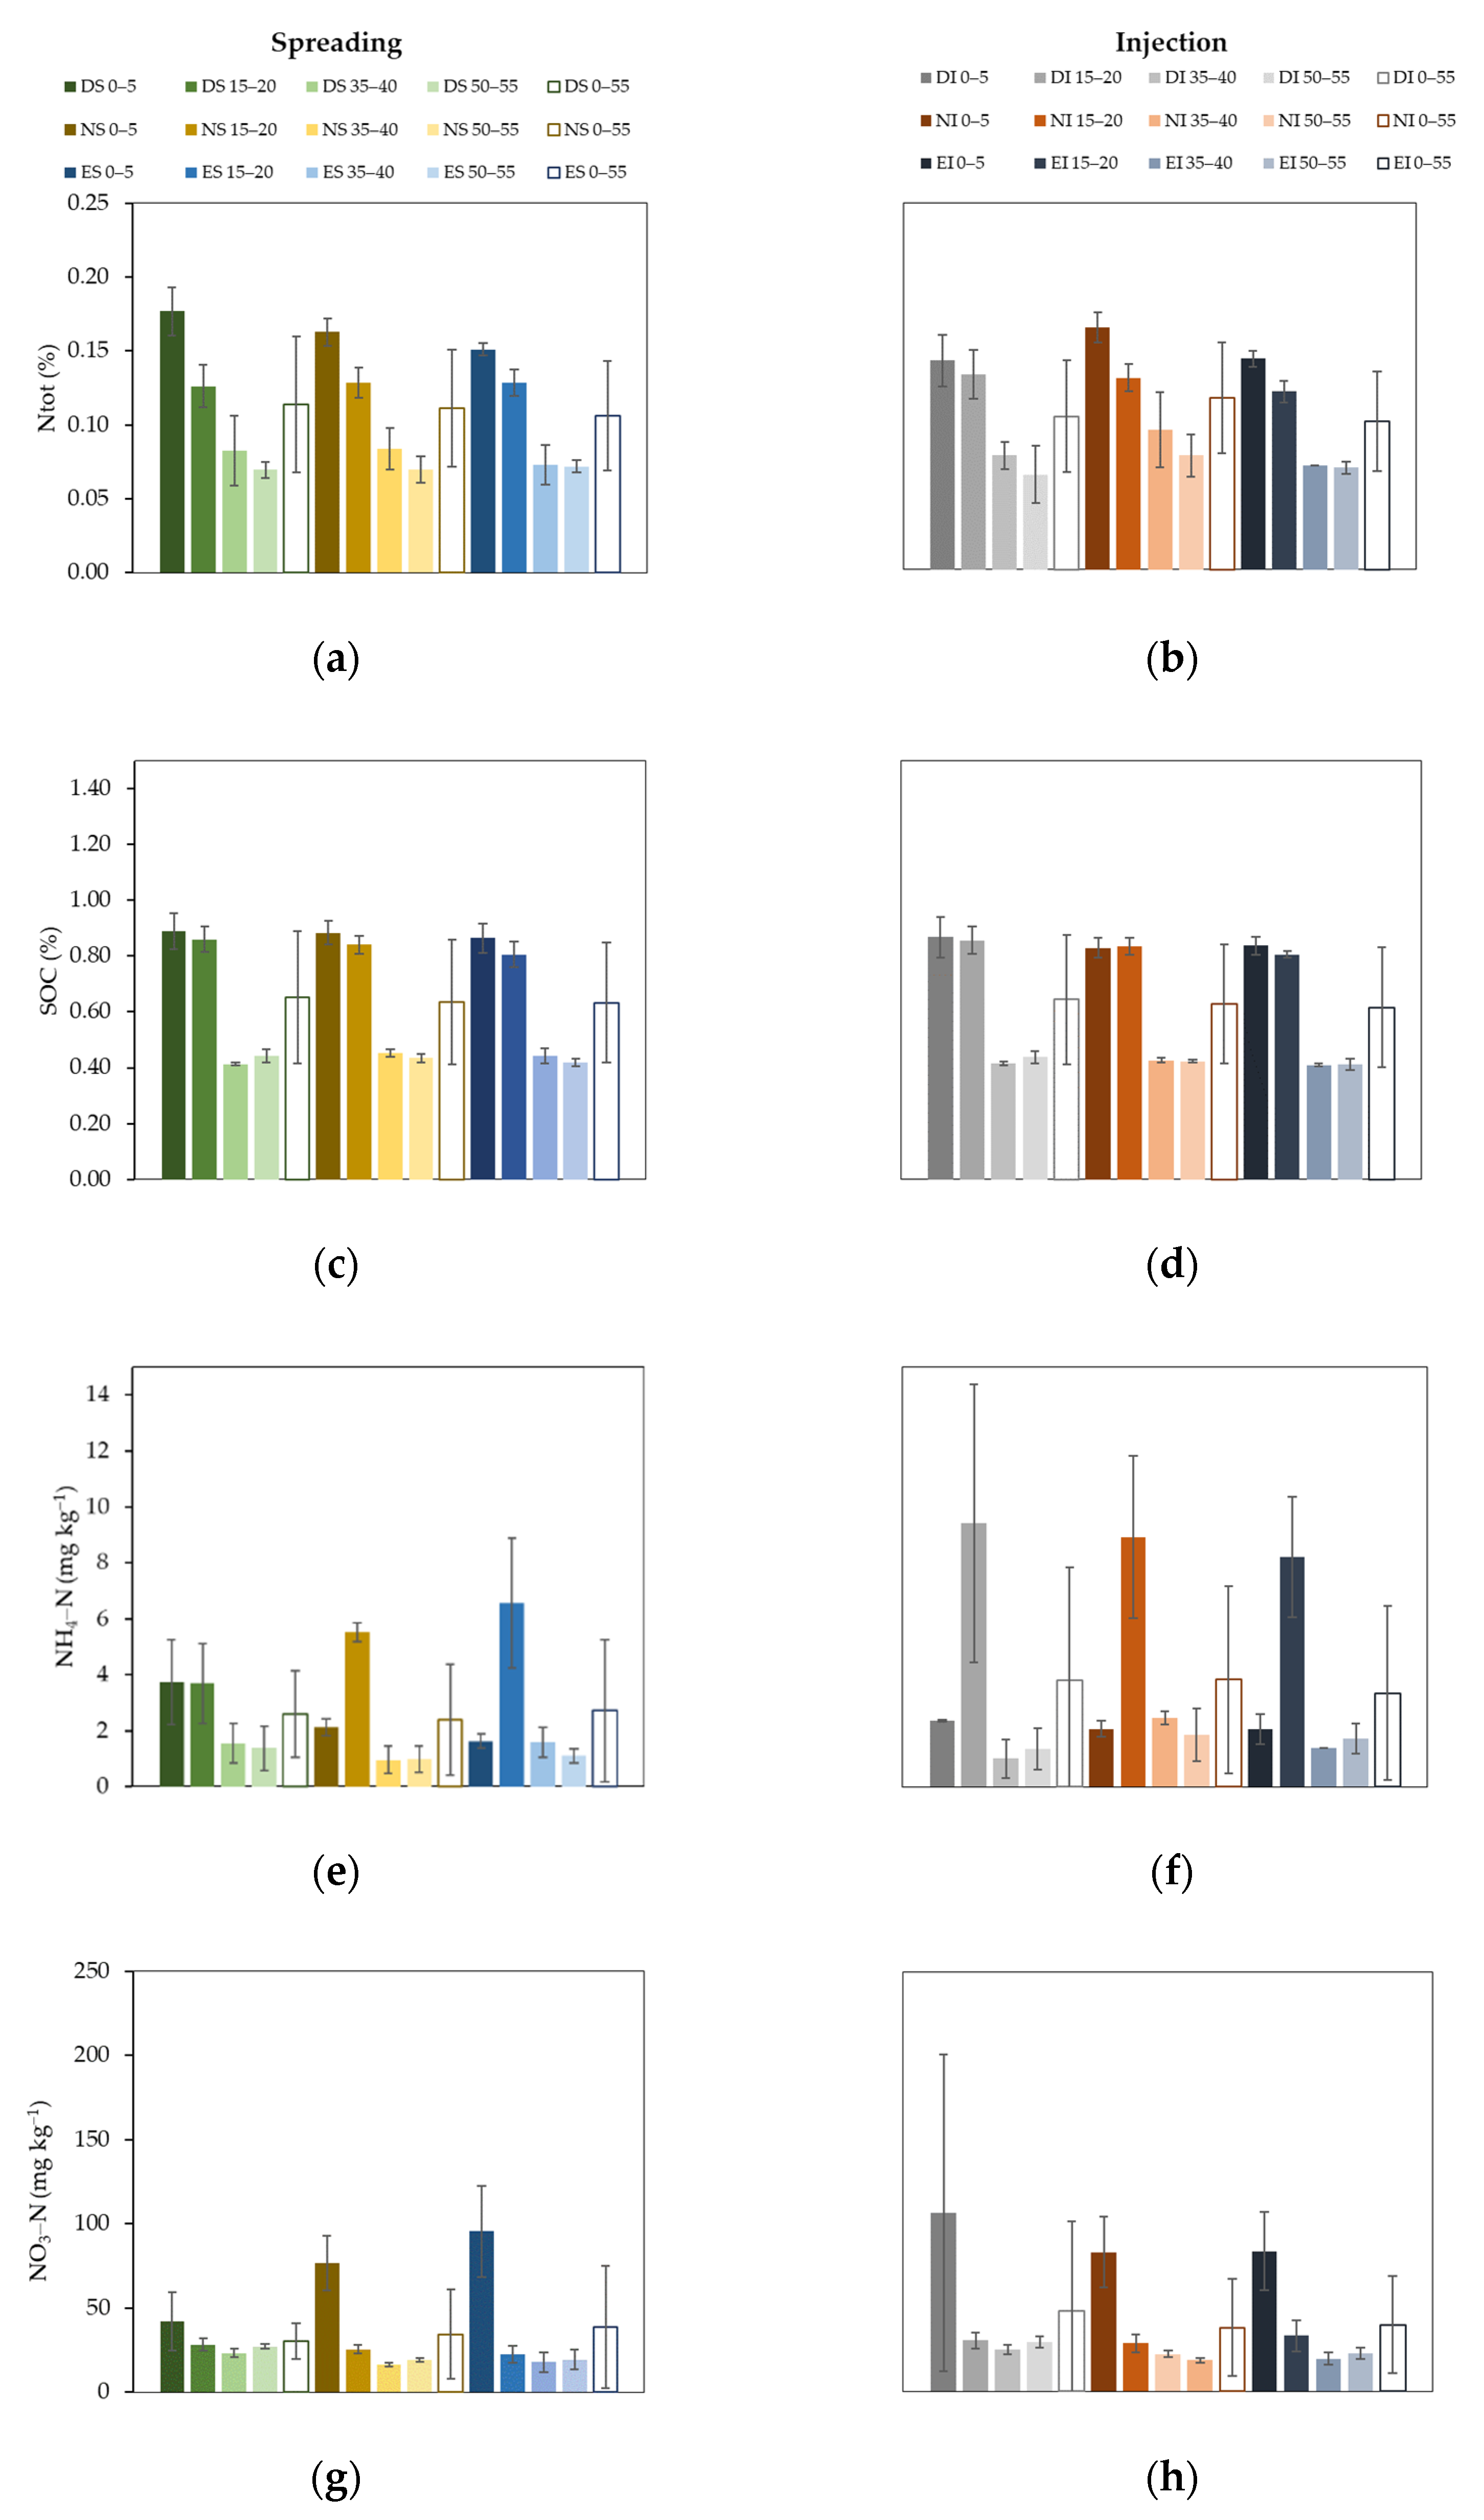
We investigated two application techniques of pig slurry of (i) the surface spread (S) and (ii) row injection (I) for a 14-day-long period after fertilization. Because the highest NH3 emission occurs in the first week after application of pig slurry, we opted to measure the soil GHG and NH3 emissions frequently during the first two weeks of the experiment. With this experiment, our aim was to determine the short-term response of bare sandy soil to different fertilization techniques.
For pre-conditioning, packed soil columns were set up four days before the measurements started. We used 18 pieces of plastic columns with a height of 60 cm and a diameter of 20 cm. The bottoms of the columns were closed using airtight cups with a lockable water sampling orifice (d = 22 mm). The cups were filled with small-sized (d = 5–10 mm) gravel (2500 g in each cup) as a filter layer to prevent charge leakage. Under the gravel, dense woven mesh was placed to prevent the gravel from leaving the cup. The columns were filled with less than 2 mm grain-sized and homogenized sandy soil. To simulate original soil conditions, we applied sand with higher carbon and nitrogen content for the upper 25 cm and a leaner sandy soil below 25 cm of the columns. The soil chemical parameters of organic carbon content (SOC) and the main nitrogen forms of total nitrogen (N
tot), ammonium (NH
4-N), and nitrate-nitrogen (NO
3-N) of the two sand layers are provided in
Table 1.
Basic soil physical parameters such as soil texture, bulk density, and porosity of undisturbed soils are provided in
Table 2. These measurements are based on former investigations of the exact experimental location that the soil in this study was collected from [
46].
We installed these assembled soil columns under a foil tent with open sidewalls preventing natural precipitation. A meteorological station was available under the foil tent, which provided us with air temperature data.
At the beginning of the experiment, we irrigated each column until gravitational water drainage occurred, then we sealed the sampling orifices. This soil moisture condition was considered to be close to the field capacity (~16.0–18.0%) for the used soil type. The following day we applied the pig slurry using the two application techniques (i.e., spreading (S) and injection (I)) to the columns. The same amount of pig slurry as in the spreading technique was injected at the depth of 10 cm below the soil column surface. Regarding the S treatment, we poured the slurry onto the soil column surface, and waited for the liquid to infiltrate. All column setups were prepared in three replicates. The slurry dose was 150 kgN ha−1 active ingredient uniformly, which was chosen as an average quantity allowed under field conditions on sandy soils. Dry matter, Ntot and total ammonium-nitrogen (NTAN) content, organic matter, raw ash content, and pH of the purchased slurry were 35.4 g kg−1, 3.5 g kg−1, 2.2 g kg−1, 26.2 g kg−1, 9.2 g kg−1, and 6.45, respectively. We took initial measurements of GHG and NH3 emissions one day before fertilization application (Day 0); right after the fertilization (Day 1); and daily measurements were performed during the first week, then three times during the second week. Daily measurements lasted for 6 h and 10 measurement days were initiated in total for the two-week-long investigation time.
2.2. Irrigation Strategies
To simulate different initial soil moisture conditions, we used three irrigation strategies on S and I slurry application techniques. We regularly irrigated with normal (N) and extreme (E) levels of tap water beside a non-irrigated treatment (D). The D strategy simulated a two-week-long dry period (0 mm water added), the N strategy of 500 mL tap water simulated a wet spring period (15.9 mm during 3 h on a day), which can be regularly the case in springs, and the E strategy of 1000 mL tap water represented heavy rainfall events (31.8 mm during 3 h on a day). We irrigated the columns on Days 2, 3, 5, 8, and 10 during the experiment.
Table 3 summarizes the total of six treatments with the two slurry application techniques and three different irrigation strategies.
2.3. CO2, N2O, and NH3 Emission Measurements
We determined the CO
2 emissions of the soil columns using the EGM-5 (PPSYSTEMS, Amesbury, MA, USA) infrared analyzer [
47]. The gas incubation time was 2 min per measurement, where the CO
2 emissions of soil columns were estimated using a linear equation. The measurement range of the device was 0–5000 ppm and the accuracy was <1% of the reference gas. Auto-calibrations to the 0 ppm base concentration were initiated between measurements randomly by the instrument.
We measured the N
2O and NH
3 emissions of each soil column with a PICARRO G2508 (PICARRO, Santa Clara, CA, USA) multigas analyzer [
48] based on the dynamic chamber method [
49]. The gas incubation time was set at 13 min and emissions were estimated using linear equations. The measurement range of the instrument was 0.300–200 ppm for N
2O and 0–300 ppb for NH
3; measurement accuracy was <25 ppb for N
2O and <5 ppb for NH
3 measurements.
We measured soil GHG and NH3 emissions 10 times in every column during the duration of the experiment.
2.4. Soil Chemical Property Measurements
Besides the determination of initial soil chemical properties of the arable field (representing 0–25 and 25–55 cm depths), we collected individual samples from each column at the end of the experiment. We chose sampling depths of 0–5, 15–20, 35–40, and 50–55 cm to investigate the soil carbon and nitrogen profile along soil depths. SOC, N
tot, NH
4-N, and NO
2+/NO
3-N contents of soil samples were analyzed using wet chemical methods. Before analysis, samples were sieved below 2 mm. The amount of N
tot was determined using the modified Kjeldahl method (ISO 11261:1995) and the SOC was measured using wet digestion using the Tyurin method [
50,
51]. Briefly, during the measurement process, the total nitrogen content (N
tot) of the samples is converted first into (NH
4)
2SO
4 and then into NH
3. After steam distillation, the soil N
tot-content was determined using titration. The NH
4-N and NO
3-N contents were determined using steam distillation and titration using compound-specific chemicals. The Tyurin method is a wet combustion method. The SOC was oxidized using potassium dichromate solution with sulphuric acid. After oxidation, excess dichromate was calculated using titration with Mohr’s salt solution.
2.5. Nitrogen Leaching Measurements
We collected leachates via water sampling orifices on Days 3, 5, 7, and 9 concurrently with irrigation events to investigate nitrogen leaching of the irrigated treatments. All water samples were immediately frozen, then analyzed for NH4+, NO2−, and NO3− content using a UV-1800 UV/Visible scanning spectrophotometer (Shimadzu, Japan) based on standardized methods (ISO 7150-1, ISO 13395:1996). We used standard solutions for calibrations of each determinant. In the case of NH4+, NO3−, and NO2− measurements, the spectrophotometer was set to 655, 410, and 540 nm, respectively.
2.6. Statistical Analysis
We used GraphPad Prism for Windows, version 9.0.2 (161) February 2021, (GraphPad Software, San Diego, CA, USA) to perform the statistical analyses. We used raw data to build GHG and NH3 emission datasets and the negative emission values were filtered. We determined dataset distributions using the D’Agostino and Pearsons test. According to the dataset distributions we utilized the Kruskall–Wallis method with Dunn’s multiple comparisons to compare gas emission or leachate data. Analysis of GHG and NH3 emission dependency on air temperature were investigated using Pearson’s or Spearman’s correlation depending on the normality of the data distribution.
5. Conclusions
The effects of pig slurry application on soil GHG and NH3 emissions was established under different slurry application techniques and irrigation strategies in sandy soils. The pig slurry injection was proven to be more adequate compared to spreading in regard to NH3 emissions from the investigated sandy soil under dryer soil conditions. However, under the irrigated conditions the differences were no longer significant. The pig slurry application techniques did not affect the GHG emissions of the experimental sandy soil in the short-term during our experiment.
The slurry application caused elevated NH4-N and NO3-N contents in the soils, and an increase in NO3− leaching was observed under lower than extreme irrigation conditions. Nitrogen leaching of soils was more dependent on precipitation amounts in the spreading application technique compared to the injection.
In our soil column experiment, we tried to simulate field conditions and we found that the pig slurry injection may be preferable under dry conditions regarding NH3 emissions. However, we also found that under irrigation or higher precipitation occasions the time of slurry application should not be limited in terms of CO2 and N2O emissions.
This study was a microcosm type of investigation simulating field conditions with three replicates under a controlled environment. Therefore, this setup is a good way to better understand the field processes; however, field conditions can be more heterogenic and further studies with higher number of replications should be implemented to draw more conclusive deductions. Overall, our study showed that a controlled column experiment can be a great tool to be used prior to slurry applications. Although the current study involved sandy soil only, this type of experiment enables us to further study different soil environmental parameters, such as different soil types more relevant to a specific location.


