Article

Evaluating and Prioritizing the Enablers of Supply Chain Performance Management System (SCPMS) for Sustainability

by
Mohamed Rafik Noor Mohamed Qureshi
Department of Industrial Engineering, King Khalid University, Abha 62529, Saudi Arabia
Sustainability 2022, 14(18), 11296; https://doi.org/10.3390/su141811296
Submission received: 26 August 2022 / Revised: 6 September 2022 / Accepted: 6 September 2022 / Published: 8 September 2022

Abstract

:
A business organization needs a supply chain performance management system (SCPMS) to build an effective and efficient supply chain (SC) that will provide much-needed sustainability. The performance evaluation of supply chain management (SCM) is difficult and needs consideration of several important enablers. In such situations, the development of an SCPMS can facilitate understanding and integration among the SC partners. The SCPMS is influenced by many enablers that play a positive role; hence, the study of these enablers becomes significant. Therefore, the purpose of this study was to identify and rank the key SCPMS enablers. The identified SCPMS enablers were modeled using interpretive structural modeling (ISM) and ranked through an interpretative ranking process (IRP). The SCPMS enablers were further categorized using MICMAC. The results show that “SCPMS awareness”, “top management commitment”, and “financial commitment towards SCPMS” must be controlled for sustainability as they are independent enablers. “Benchmarking”, “appropriate performance matrix”, and “employee commitment” were the three top enablers.

1. Introduction

Increasing organizational effectiveness, competitiveness, customer service, and profitability all depend on supply chain management (SCM). Evaluation of supply chain (SC) performance is the procedure that leads to the organization’s efficacy and efficiency in utilizing its SC [1]. Key performance indicators (KPIs) must be managed as part of a continuous SCM process to meet management objectives. SCM has therefore become crucial for businesses to manage the effectiveness and efficiency of their SC to have sustainability. In the digital age, business organizations must adopt a supply chain performance management system (SCPMS) that can provide important and factual information by combining performance measures from different angles so that legitimate inferences can be drawn from the SCPMS [2]. Numerous companies have been shown to continue using traditional, cost-related metrics such as cash flow, profit margin, and return on investment that offer little information, hence requiring changes [3]. Hence, there is a need to modify them by mapping the SC processes and their scope through SCM metrics in such a way that it covers all the functional areas of the SC and meets the overall business strategy. Business organizations need to take a new approach that uses digital technology and big data to be proactive instead of reactive [4].
One of the most important concerns for organizations is to address SC performance. Further, incorporating sustainability into the SC is becoming a key priority for many companies [5]. The sustainability of an SC can be accomplished through systematic system evaluation and its accomplishments by evaluating the system, identifying the issues and their root cause, and solving them [6]. A good and effective SCPMS may be able to reduce cost and increase competitiveness for enhanced sustainability [7]. Due to the complexity of the systems, selecting relevant SC performance measures can be challenging [8]. When a dynamic SC is involved in business, it is more challenging and complex for SC partners, such as suppliers, producers, distributors, and merchants, to become and remain competitive. Toyota, Dell, Wal-Mart, Samsung, Lenovo, Gome, and other SC-based businesses have used SCPMSs in practice to coordinate their SC initiatives [9]. The choice of factors becomes crucial since there may be multiple elements in an SCPMS that have a substantial impact on SC performance. Additionally, it is suggested that a variety of performance indicators could provide a greater knowledge of the crucial connections in the SC, enabling model creation for operating features and SC configurations [8]. A conceptual model was formulated to investigate the connections between SC performance and lean and green practices [10].
The SC performance matrix may include various enablers that may provide fulfillment of specific objectives: visibility, leagility, personalization, information governance, SC warning, green, innovation, and learning will help the green initiatives of an organization. The environmental impact may be measured by including resource utilization, environmental contamination, and recyclable materials in the performance metrics [11]. Similarly, process visibility in an SC improves the effectiveness of monitoring SC status, allowing for a more efficient SCM [12]. The leagility indicator provides a good measurement for lean, flexibility, and agility in the SC. Thus, an SCPMS may provide a good measurement of various intended objectives by facilitating information sharing, coordination, and trust for the success of the SC [13]. Furthermore, it makes it easier for management to understand the effectiveness of strategies and seek future potential opportunities. SCM managers benefit while making important decisions in many areas, such as changing business goals, taking strategic actions, or re-engineering processes.
Even though many SC performance indicators and matrices have been developed, more research to raise awareness is urgently needed for the SCPMS, and the research of its enablers is crucial. Furthermore, the study of enablers will aid in the realization of a balanced SCPMS for a given organization that will fulfill its strategic objectives by achieving SC performance. It will also help in building an efficient SCPMS that provides useful information based on which management can spot inefficient activities and implement the appropriate corrective measures for continuous improvement. It is crucial to explore relationship modeling to fill this gap in the SCPMS literature. Thus, based on the above premises, the current study aims to respond to the following questions: (a) What are the various enablers that influence the SCPMS? (b) How should their contextual relationship be modeled through ISM and classified using MICMAC? (c) How can the SCPMS enablers be ranked using the interpretive ranking process (IRP)?
The paper is structured as follows: In Section 2, a review of the literature is given that identifies the SCPMS enablers. The ISM, MICMAC, and IRP research methodologies are presented in Section 3. Section 4 provides results obtained through the systematic application of methodologies. A discussion of the current studies is provided in Section 5. Lastly, Section 6 provides a conclusion.

2. Literature Review

A successful SCM initiative must include a performance management system. This is also a crucial strategic element for enhancing operational effectiveness and makes it easier for the organization to achieve its objectives [14]. Studying SCM practices is also crucial [15]. For a business to manage its financial performance, an SCPMS is essential. The outcome of a successful SCPMS depends upon good information collection and further processing for correct decision making. Since SC efficiency is a complex phenomenon that must be characterized using multiple criteria, a multi-factor performance measurement approach could be used to gauge the effectiveness of the SC [16]. To measure SC efficiency, various modeling approaches have been found in the literature. Using data envelopment analysis (DEA) [17], a decision-making model was made to figure out how efficient the SC was in its internal efficiency. In the recent past, several researchers have studied the SCPMS adopted by various organizations. They have been successful in trying to understand the various SCPMSs through a careful review of the literature [15,16,17,18,19,20,21,22]. SC performance-based literature was reviewed considering machine learning applications for its sustainability [19]. Quantitative-based models for the evaluation of the SC were also reviewed [20].
A quantitative framework based on a methodical approach for enhancing the SC KPIs was prepared [9]. The created approach was able to pinpoint significant KPI accomplishment expenses and suggest SC management performance improvement options. An analysis of the SC literature reveals the problems with SCPM. The following outlines the main issues [21]: (a) an absence of a strong separation between measures at the strategic, tactical, and operational levels as well as a lack of a clear connection to strategy; (b) a lack of balanced integration of financial and non-financial data; (c) a focus on local optimization and, thus, the absence of a thorough SC context; (d) PM and metrics are inconsistent, incomplete, and lack relational structures; (e) there are several metrics; (f) being internally focused and neglecting to adequately pay attention to exterior factors (customers, suppliers, and competitors) and looking and, as a result, not paying enough attention to exterior factors (customers, suppliers, and competitors); and (g) practicing more on short-term, profit-driven, and static conditions.
Fourteen SCPMS enablers were considered for carrying out its relationship modeling using ISM [13]. The variables considered were “effective information system”, “employee’s commitment”, “dynamic”, “inter-connectable”, “cross-functional and usable SCPMS”, “partnership with dealers”, “distributors and retailers”, “appropriate performance metrics”, “overcoming mistrust”, “funds for PMS implementation”, “commitment by top management”, “awareness about PMS in SC and consistent with strategic goals. Setting objectives”, “evaluating performance and determining the future course of action”, “proactive management”, and “benchmarking and effective and efficient SC”. An ISM-based model of ten selected enablers of the SCPMS in the auto sector was prepared [22]. A conceptual framework for the SCPMS lifecycle that covers various phases of design, execution, use, and review was prepared [23]. They also discussed how to conduct research and how the various SCPMS actors view the system and may act to facilitate effective adoption. Further, to identify the key components of an SCPM system, they concentrated on the design stage. Several authors [11,15,24,25,26,27] tried to use the SCPMS framework for both small and medium enterprises (SMEs) and large enterprises. A comprehensive performance measurement framework using a balanced scorecard (BSC) and supply chain operation reference (SCOR) was employed for SMEs [15,24]. SCPM has also been attempted in various industries such as the construction industry [25], automobile industry [26], apparel industry [27], footwear industry [28], etc. It has also been attempted in Industry 4.0 using intelligent approaches [29]. A comprehensive framework was prepared to accomplish SCPM. The process-focused framework based on human judgment was prepared [14].
A predictive SCPM model that integrated process modeling, performance measurement, data mining methods, and web portal technologies was used [4]. Various SC systems may greatly benefit from the Internet of Things (IoT), for instance, manufacturing, performance management, transportation, and other related areas [30]. Expiry waste at retailers’ end was tracked using IoT, and the waste percentage was reduced to a minimum of 45 and a maximum of 75% at various non-active retailers [31]. Some barriers play a negative role in discouraging SCPM. A significant barrier is the SC’s complexity as well as the measurement method for SCPM [18,23]. A fuzzy-logic-based SCPM model was proposed to predict performance based on causal relationships between SC metrics and the SCOR model [32]. Later on, a fuzzy- and scenario-based model to stimulate and quantify the possible effect of external factors on the SC’s performance was developed to accomplish a real target [33].
Table 1 provides the list of various enablers used in the SCPM studies. The number of enablers used in the studies varies from ten to twenty. Further, interpretive structural modeling (ISM) has been largely used for contextual relationship modeling along with other methods such as the AHP, DEMATEL, DEA, BSC, and SEM. On reviewing the literature, fourteen SCPM enablers were identified which are discussed further: Loyalty to the SC is the degree of commitment of SC actors to the SC operations covered in the SCPMS. Loyalty to the SC helps in building a serene environment in SCM [34]. Financial commitment toward the SCPMS and the top management’s commitment to the financial requirement for the SCPM system. A lack of financial commitment derails supply chain initiatives [18]. Trust is an essential intangible asset prevailing among SC actors [35]. Trust enables information sharing in SC players [36]. Satisfaction among the SC actors is the outcome of a sound SCPMS. Internal communication among SC partners enhances trust and satisfaction among SC partners [37]. An effective information system for systematic use is a result of a sound SCPMS. An organization believing in a sound information system can take quick actions through quick decision making. Awareness of the SCPMS is very important know-how for the SC stakeholders. Awareness of the SCPMS helps an organization to take initiatives for the SCPMS [15]. Top management commitment is the willingness of top managers to effectively participate in the SCPMS and lead by example [13]. Employee commitment is the contributory role of each employee toward the SCPMS. There is a positive influence of employee commitment and supply chain integration on organization performance [38]. An appropriate performance matrix is the basic need of the SCPMS to define, measure, and control SC activities with defined performance [39]. Benchmarking is the process of setting the SCPMS comparable to leaders in the business [40]. Sustainable SCM is the result of effective coordination, planning, and performance in the SCPMS [15]. The SCPMS enablers play a vital role in maintaining sustainability through effective SCM. The SCPMS enablers may help maintain the effective system for SC performance measurement.
The literature review mentioned above leads to the conclusion that the SCPMS is essential to the business community. They can obtain maximum benefits from it, but it depends upon the effectiveness and efficacy of the SCPMS. The ways and means of measuring SC performance offer an avenue of research for the benefit of stakeholders. It is further found that the contextual relationship between the SCPM enablers and the IRP ranking approach is missing in the literature. Hence, there is a need to bridge this gap. The contextual relationship will help practicing managers understand the nature and behavior of the enablers for designing the SCPMS [48]. The IRP is an efficient methodology that will help in understating the hierarchical importance [49]. The findings of this study will help organizations focus on certain significant enablers to improve their SC performance [50]. The combinatorial approach of ISM, MICMAC, and the IRP is well-proven for contextual relationships, categorization, and ranking of enablers [51].

3. Research Methodology

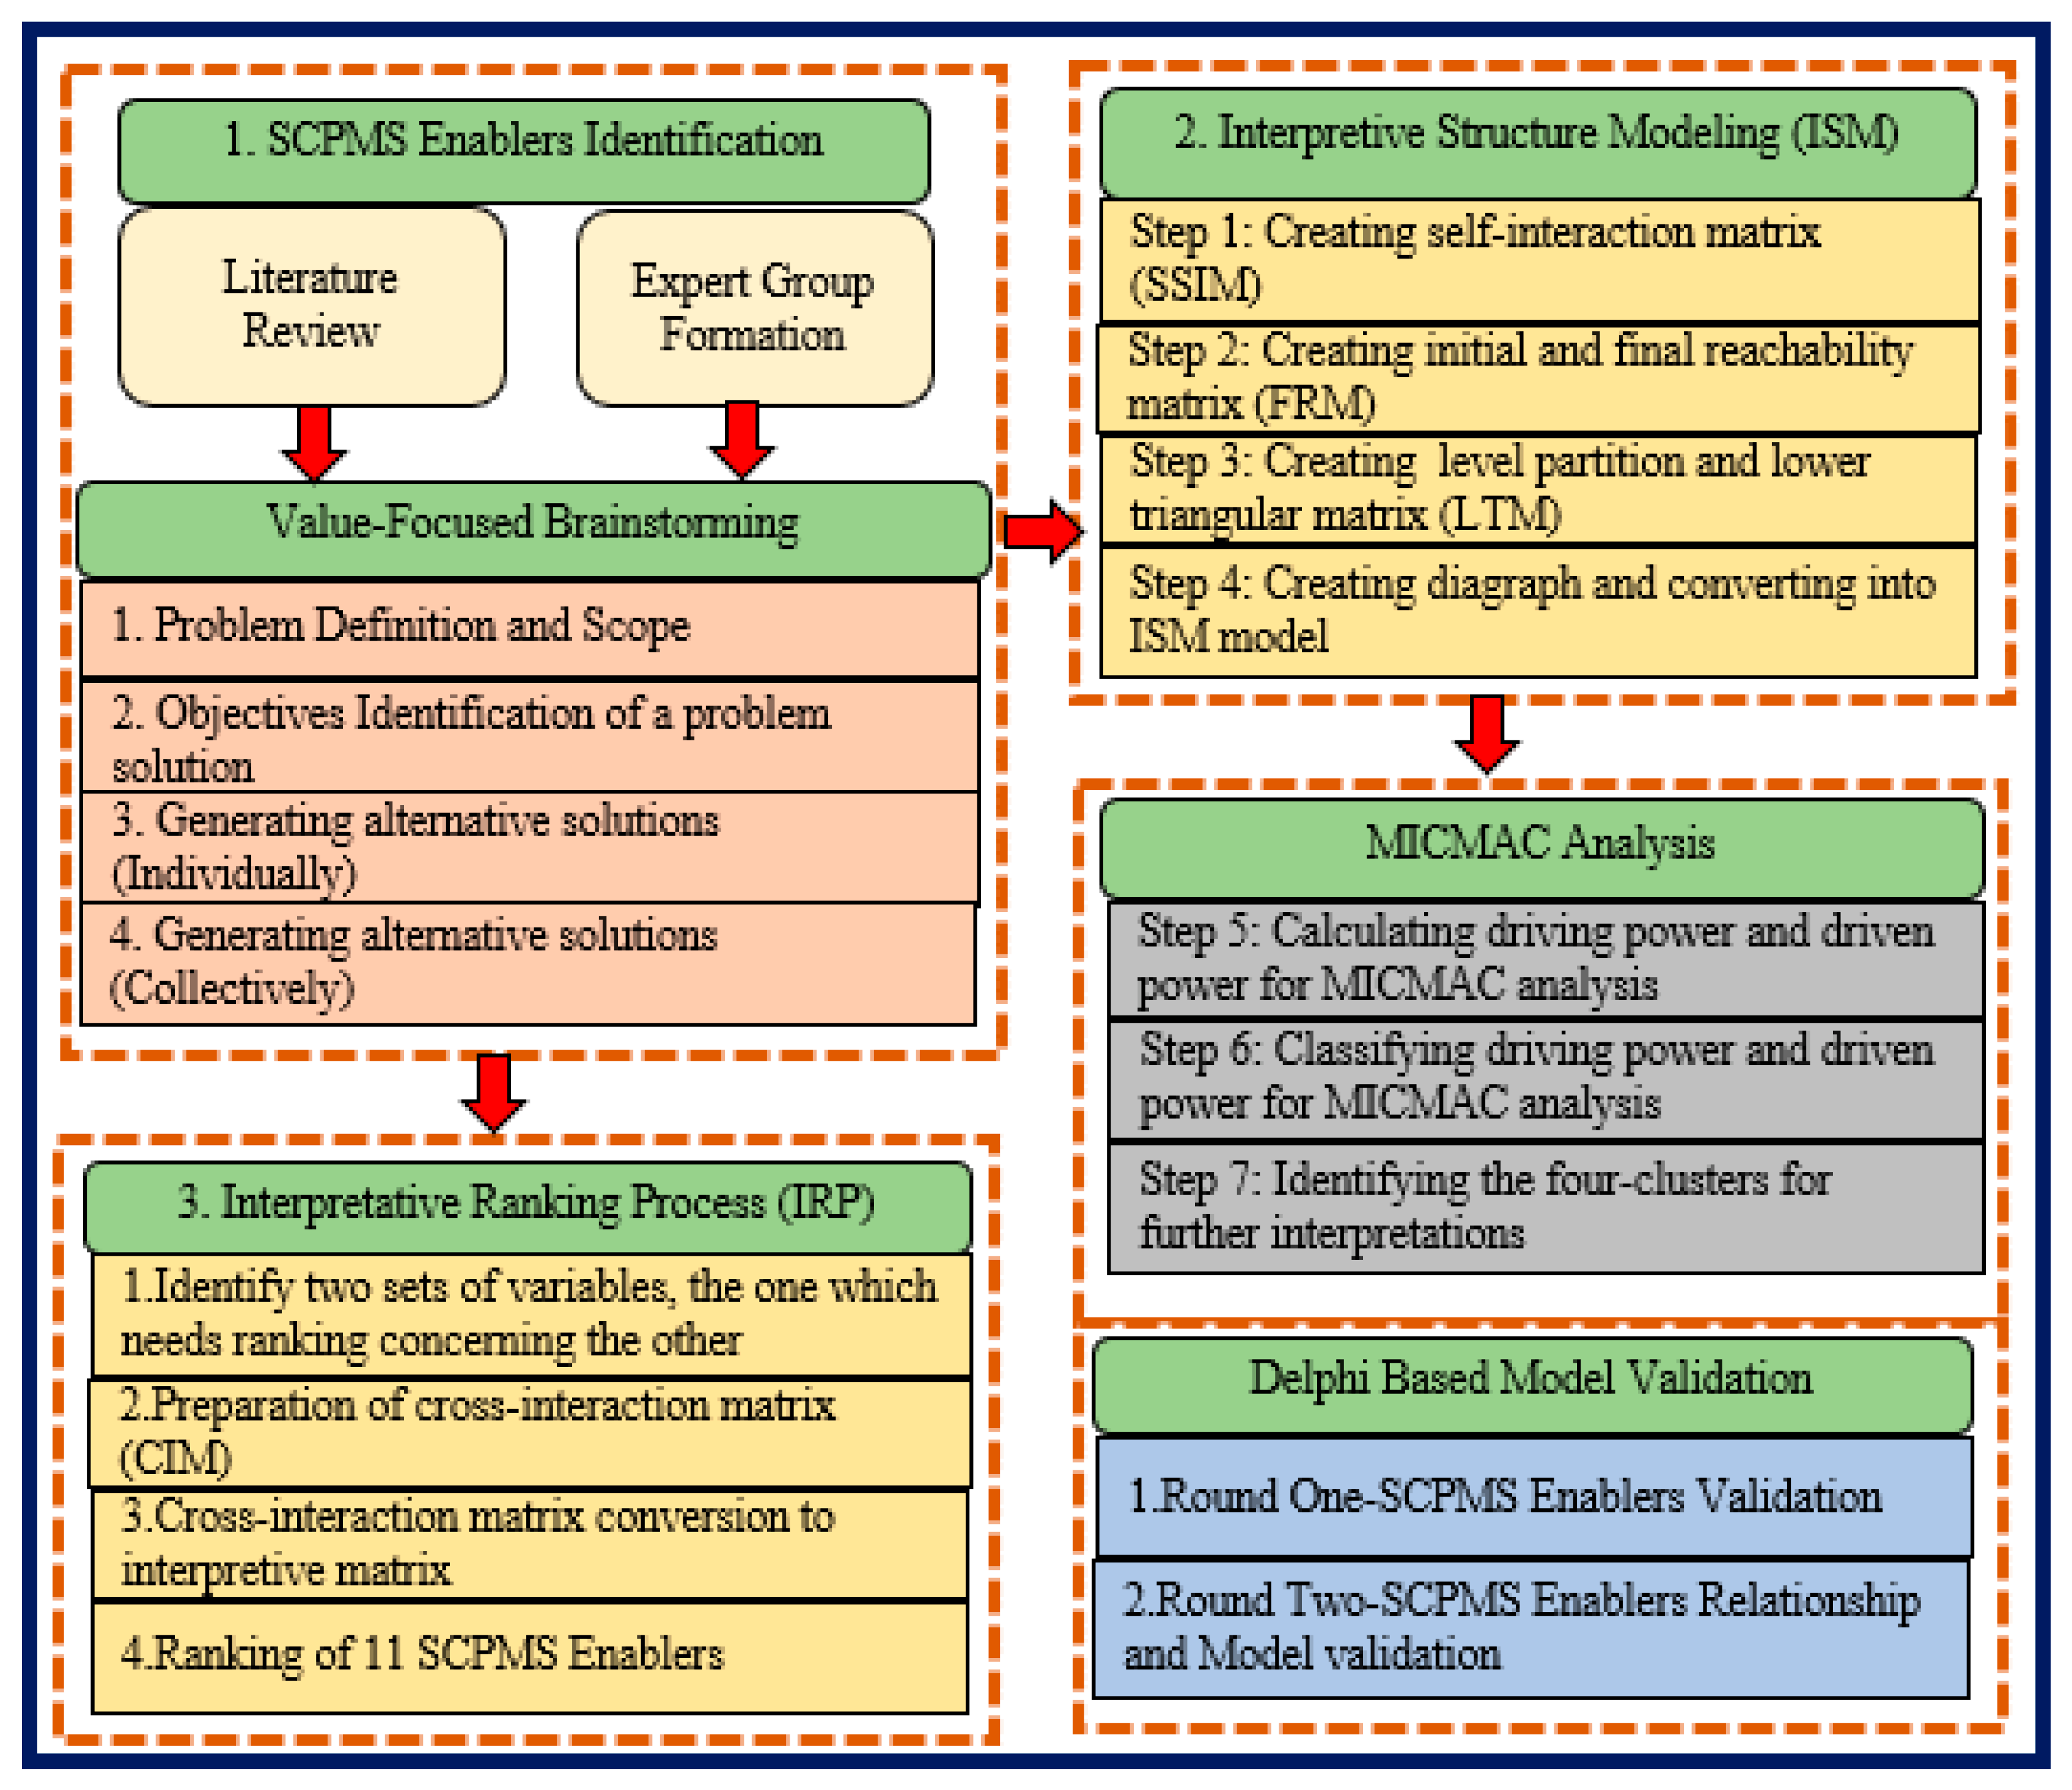
The present research methodology is covered in three phases, which are depicted in Figure 1. Further, each phase is described in detail as follows:
Phase 1 deals with the SCPMS enabler identification. The process of SCPMS enabler identification may follow a systematic review of the literature. The comprehensive review of the literature with specific keywords helps in identifying the most relevant SCPMS enablers from the academic research databases. Collected enablers through such a process may further need segregation, categorization, or shortlisting. They may be shortlisted according to their importance, degree of relevance to the case problem, influence over another enabler, etc. The appropriate enabler may be obtained by evaluating through the brainstorming or value-focused brainstorming methods by engaging an expert group. The 4-step value-focused brainstorming may be employed [52]. The 4-step value-focused brainstorming deals with (a) identifying a problem; (b) objective identification of a problem solution; (c) generating alternative solutions (individually); and (d) generating alternative solutions (collectively).
Phase 2 provides the ISM and MICMAC modeling approaches adopted in evaluating SCPMS enablers. ISM reveals contextual relationships and provides a model to prepare the self-structural self-interaction (SSIM) matrix. It further helps in formulating a reachability and conical matrix which ultimately provides a digraph and an ISM model. The ISM and MICMAC approach is broken down into the following steps: Step 1: Creating an SSIM; Step 2: Creating an initial and final reachability matrix; Step 3: Creating a level partition and lower triangular matrix; Step 4: Creating a digraph and converting it into an ISM model; Step 5: Determining driver-driven power for a MICMAC analysis; Step 6: Classifying driving-driven dependence for MICMAC analysis; and finally, Step 7: Identifying the four clusters for further interpretations. In creating an SSIM, the contractual relationship is used to understand the relationship between enablers. Let “a” and “b” be considered SCPMS enablers. The relationships among these two enablers “a” and “b” may follow the following rules: if enabler “a” drives or influences enabler “b”, the relationship will be denoted by “V”; “A” will be used when “b” drives or influences enabler “a”; “X” will be used when enablers “a” and “b” influence each other, and if enablers “a” and “b” do not influence each other, “O” will be used. Following the ISM methodological steps, a contextual relationship among enablers yields an SSIM. The SSIM has a contextual relationship among enablers identified by the expert group. The initial reachability matrix (IRM) may be obtained by transforming the SSIM using binary digits “1” and “0”. The following conditions decide to replace “V”, “A”, “X”, and “O” with “1” and “0”. (a) If the SSIM’s (a, b) entry is “V”, the reachability matrix’s (a, b) entry becomes 1, and the (b, a) entry becomes 0; (b) if the SSIM’s (a, b) entry is “A”, the reachability matrix’s (a, b) entry becomes 0, and the (b, a) entry becomes 1; (c) if the SSIM’s (a, b) entry is “X”, the reachability matrix’s (a, b) entry becomes 1, and the (b, a) entry similarly becomes 1; and (d) if the SSIM’s (a, b) entry is “O”, the reachability matrix’s (a, b) entry becomes 0, and the (b, a) entry similarly becomes 0.
The formation of a reachability matrix is carried out using an SSIM so that the transitivity is incorporated. The SSIM is transformed into a reachability matrix using binary digits “0” and “1”. Transitivity may be explained as: if a > b and b > c, then a > c wherein “>” provides a degree of interaction. The reachability element and antecedent element for each enabler is accomplished through the final reachability matrix (FRM). It includes the enabler itself and another enabler that helps. The antecedent elements have their elements as well as another enabler that influence them. The various elements of the iterative process are derived using the intersection among them. When the intersection satisfies these requirements, then the identified enabler is placed at the top, and the enabler is excluded from the further process of revealing interaction. With this method, the categorization will be determined from the highest level to the lowest level. Thus, using the FRM, the structural model may be derived. Subsequently, a digraph is prepared by the removal of the transitivity. To obtain the digraph, a lower triangular matrix (LTM) is used to obtain the relationship modeling. The digraph shows a directed graph that provides a detailed understanding of each enabler. The digraph is used to create an ISM model of SCPMS enablers, which is shown in Figure 2.
SCPMS enablers may be represented graphically using the MICMAC methodology. It presents an opportunity to research and analyze the relative significance of each SCPMS enabler. MICMAC analysis categorizes the SCPMS enablers into 4 categories—autonomous, dependent, linkage, and independent—using the driving-dependence power of each enabler. It is also possible to refer to the categories produced by the MICMAC analysis as clusters.
Phase 3 uses the interpretive ranking process (IRP) to rank the SCPMS enablers [53]. The IRP employs an interpretative matrix with a paired-comparison matrix. When an expert judgmental bias is present or it is occasionally difficult to make a clear decision in cases of complicated hierarchies, the IRP can eliminate such deficiency present in the AHP. Further, the IRP uses the interpretive logic that provides dominance among the enablers for its comparison. The advantageous part of the IRP is that it is not necessary to have the dominant information while performing such a comparison. Thus, the IRP offers a methodical ranking of the SCPMS enablers based on their merits. The general IRP steps are documented in the literature [53,54]. These steps are: (a) Identifying two sets of variables, the one which needs ranking concerning the other. Here, SCPMS enablers are ranked. (b) Preparation of a cross-interaction matrix between an SCPMS enabler and SCPM indicators. (c) Cross-interaction matrix conversion to an interpretive matrix. (d) Formation of pairwise comparison depending upon the interpretive matrix to obtain a dominating-interaction matrix. (e) Ranking of SCPMS enablers and subsequent exploration of dominance and its rank.

4. Results

The results of each phase are derived and documented as follows:

4.1. Phase 1

Phase 1 helped in SCPMS enabler identification. A systematic review employing the keywords of “Supply chain performance measurement variable”, “Supply chain performance measurement system”, “SCP measurement system factors”, and “SC performance measurement system enabler” was carried out. Various databases such as Scopus, Web of Science, ScienceDirect, etc., were reviewed. Collected enablers were further segregated. Fourteen of the most relevant variables as per their significant importance, degree of relevance to the case problem, and its influence over another enabler were identified. Eight experts from different industries were identified from the industrial development corporation along with three academicians. All experts had more than five years of experience in their respective fields. All industry experts and academicians had a minimum graduation degree in either engineering or management disciplines. A short meeting session was arranged to brief the objectives of the present research. After a brief meeting, six SC practitioners and three academicians readily accepted the invitations. Two SC practitioners were dropped from the group because of their pre-occupancy. Thus, a nine-member expert team was formed. All the consulted SC practitioners and academicians agreed voluntarily to participate in the present study with the liberty and flexibility to leave the study at short notice. This expert group formation was in line with previous similar studies [55,56]. Relevant literature on SCPMS enablers, the scope of the study, and the research methodology to be used were shared. The appropriate enabler may be obtained by evaluating through the brainstorming or value-focused brainstorming methods by engaging an expert group.
A brainstorming technique was used to identify factors of world-class manufacturing practices [55]. In the present study, value-focused brainstorming [52] was adopted. The four-step process of value-focused brainstorming was conducted in two sessions. During the first session, the expert group was informed about the brainstorming rules for the session. Three rules were adopted: (a) idea generation without criticism; (b) freedom to idea generation; and (c) new idea generation. It was observed that brainstorming rules helped in systematic proceedings. Fourteen SCPMS enablers were reduced to eleven at the end of the sessions.
The fourteen SCPMS enablers were discussed for their appropriateness in the present study. The three SCPMS enablers “higher degree of integration across the supply chain”, “the supply chain system alignments”, and “adoption of a market orientation” were found to be less significant in the present study by the expert group. Thus, the remaining eleven SCPMS enablers “loyalty to SC”, “financial commitment towards SCPMS”, “trust”, “satisfaction”, “effective information system”, “awareness to SCPMS”, “top management commitment”, “employee commitment”, “appropriate performance matrix”, “benchmarking”, and “sustainable SCM” were shortlisted. The identified eleven SCPMS enablers were further subjected to the ISM, MICMAC, and IRP methodologies.

4.2. Phase 2

Methodologies such as MICMAC and ISM were used to form various matrices. An SSIM was developed based on the contextual relationship obtained from the expert group. The contextual relationships between several SCPMS enablers were used to derive the SSIM which is shown in Table 2. The previously described guidelines formed the basis of the derived SSIM. For example, enabler 1 “loyalty to SC” is compared with enabler 11 “sustainable SC” for their contextual relationship. Since enabler 1 influences enabler 11, the contextual relationship of “V” is considered.
Similarly, “A”, “X”, and “O” may be used to represent the contextual relationship as discussed in the previous section. Similarly, other relationships were completed. Later on, “V”, “A”, “X”, and “O” were replaced with “1” and “0” following the rules discussed in the methodology section to obtain the initial reachability matrix (IRM). Table 3 provides the IRM.
The IRM was turned into the final reachability matrix following the transitivity principles (FRM). In addition to displaying the FRM, Table 4 also displays the driving and driven power created by combining the sums (total of vertical and horizontal) for each SCPMS enabler.
Table 5 describes the reachability set and antecedent set. Furthermore, the intersection among the various enablers was carried out to reach the level partition. The enabler “sustainable SCM (11)” was found to take place at level I. In the ISM, it occupies the top spot. Similar to this, repeated iteration resulted in different levels. The iteration results ii–vii are displayed in Table 6.
The FRM helps in formulating a lower triangular matrix (LTM) by rearranging it as per the level partition. The structural model was generated using an LTM. Based on the level partition, all the enablers were arranged. This gives the lower triangulation matrix (LTM). Table 7 shows the LTM based on the level partitions.
All the SCPMS enablers were arranged as per the level partition matrix to obtain the digraph. Figure 2 depicts the ISM for SCPMS enablers.
SCPMS enablers possess driving power and their dependence, using which each enabler can be plotted. Figure 3 shows the driving power and dependence of each SCPMS enabler. The clusters I to IV may be obtained as a result of MICMAC analysis. The enablers “awareness to SCPMS (6)”, “top management commitment (7)”, and “financial commitment towards SCPMS (8)” were found to possess high driving power and weak dependence thus falling into the group of independent SCPMS enablers. The enablers “employee commitment (8)”, “appropriate performance matrix (9)”, “benchmarking (10)”, and “sustainable SCM (11)” have strong dependence and weak driving power thus forming a dependence group. SCPMS enablers “loyalty to SC (1)”, “trust (3)”, “customer satisfaction (4)”, and “effective information system (5)” were found in the linkage group.
The identified enablers and the interpretive structure modeling (ISM) model and MICMAC analysis classification for SCPMS enablers were validated through the Delphi method. Three experts in the area of SC practices were consulted, and, on their willingness, they were nominated to constitute the Delphi panel [57]. The Delphi panel was identified from various SCs of fast-moving consumer goods (FMCG), electrical cables, and centrifugal pumps. Each Delphi had commendable working experience in the SC. The Delphi panel was different from the expert group selected for SCPMS enabler identification. All the Delphi were provided relevant information on SCPMS enablers. The ISM model was presented for validation. Each Delphi agreed on the contextual relationship provided by the expert group for SCPMS enablers. Thus, after the first round, the identified SCPMS enablers were validated. The driving and dependence power of each enabler were checked to confirm the contextual relationship. At the end of the second round, the ISM model was validated. The Delphi panel also agreed to the MICMAC analysis diagram, and therefore, a total consensus was reached.

4.3. Phase 3

Six performance criteria [42] were chosen by examining the SC performance measuring literature to complete the interpretive ranking process (IRP) of the SCPM enabler. The performance criteria P1 to P6 selected were Quality management (P1), Production volume linked productivity (P2), Manufacturing lead-time (P3), Product-related design and development process (P4), Profitability (P5), and Brand value in the market (P6). A binary value of “1” or “0” was utilized to indicate if a relationship existed or not between SCPMS enablers and SC performance criteria. Table 8 shows the cross-interaction matrix (CIM).
Using the contextual relationship from the cross-interpretive matrix, the SCPMS enablers and SC performance requirements are compared. The interpretive matrix illustrating the connection between the SC performance requirements and the SCPMS enablers is shown in Table 9. The construction of dominant and non-dominating SCPMS enablers is facilitated by the SCPMS knowledge base matrix.
The interpretive matrix is utilized in comparing the SCPMS enablers for the reference variables (SC performance areas) considering each enabler. Enabler “1” may be compared with enabler “3” for various performances P1 to P6, and the interpretive logic of dominating interaction between “1” and “3” for different SC performances is noted in the SC knowledge base using interpretive logic. Table 10 shows the SC knowledge base using interpretive logic.
The matrix of dominant interactions is displayed in Table 11. All the dominating SCPMS enablers are summarized in the dominating interaction matrix.
The dominance matrix is displayed in Table 12. The diagram can be used to understand the influence of the enablers in the SCPMS. An interpretive ranking model is displayed in Figure 4.

5. Discussion

The main motivation for this research was to investigate the effectiveness of the SCPMS enabler that supports the SCPMS. Eleven enablers that play a significant role were identified through a literature review and feedback from the expert group. They identified eleven enablers that are essential to having sound SCPM.
The SC partners may possess the SCPMS necessary to evaluate the effectiveness of the entire SC to meet the requirements of the end customer. To achieve complete knowledge of each enabler, a contextual relationship model using ISM was formulated. The dependency of each enabler among other SCPMS enablers may be realized and studied for their fulfillment. The interpretive structural modeling (ISM) model provides a hierarchy of courses of action that management can imbibe in their strategies to achieve sustainable SCM through an SCPMS. Once the context relationships are known, management will be able to take steps to fix the problem. The management may further modify their SCM alignment strategies to accomplish the most needed sustainability in their SC. Resource management is another area that management finds difficult to manage.
The MICMAC analysis provides the driver and dependence diagram for SCPM enablers. It further classifies all the SCPMS enablers into four categories, or clusters, thus providing total visibility to each enabler. The transparency of the contextual relationship of each enabler and its position in the hierarchy is revealed. That helps management to revisit their strategies and modify the course of action toward SCM. Eleven SCPMS enablers are classified into four groups: autonomous enablers, dependent enablers, linkage enablers, and independent enablers. Based on their driving power and dependence, the four enablers “employee commitment (8)”, “appropriate performance matrix (9)”, “benchmarking (10)”, and “Sustainable SCM (11)” are classified as dependent enablers. The dependent enablers of “awareness to SCPMS (6),” “top management commitment (7)”, and “financial commitment towards SCPMS (2)” may be controlled by the independent enablers. Management must control the independent enablers to accomplish the SCPM objectives. The analysis further provides the four enablers “loyalty to SC (1)”, “trust (3)”, “customer satisfaction (4)”, and “effective information system (5)” as linkage enablers.
The IRP found that the SCPMS should be based on customer satisfaction. Customer satisfaction decides the further quantity of flow up- and downstream of the SC. The SCPMS should be such that it takes account of feedback from customers about the products so that they may be subjected to various departments for product and service improvement. Awareness of the SCPMS is essential as it will decide the amount of information required for assessing SC performance. SCPMSs have evolved around the effective information system. In the present digital age, a large amount of information can be found from the sales of a product that can be useful for SC efficiency. Loyalty to the SC is very important as it can maximize revenue in a given time by minimizing cost and customer acquisition. Financial commitment toward the SC takes care of the cost of managing the SCPMS. The fund allocation by top management will help them to design and enact an efficient SCPMS. “Top management commitment” toward the SCPMS increases as the funds flow. The development of an SCPMS will be fast once the funds are available. Trust plays a significant role in the decision making in the performance measurement system. SCPM must imbibe sustainability in SCM to have a long-lasting SC. “Employee commitment” plays a vital role in the SCPMS. It is also known that “employee commitment” makes the SCPMS possible. An effective SCPMS should have an appropriate matrix to measure with accuracy the desired performance. “Benchmarking (10)”, “appropriate performance matrix (9)”, and “employee commitment (8)” are the first three ranks obtained by the IRP. “Benchmarking (10)” is very important to the SCPMS to make it compatible with other SCPMSs of leading organizations. It also provides the data for comparison so that more strategies are formulated to compete with the rivals in local and global markets. SCPMSs should be able to measure a variety of metrics to help the strategy makers make short-term and long-term SC-related decisions. It further reveals that employee commitment to the SCPMS plays a significant role.

6. Conclusions

The best of both worlds can be accomplished if managers who are in the field use effective SCPMSs to deploy their resources effectively and efficiently. The SCPMS may deliver useful information toward cost minimization with efficiency maximization using the right tools for decision making. The present research examined the SCPM enablers using ISM, MICMAC, and the IRP. ISM makes it easier to quantify the influence of each SCPM enabler with other SCPM enablers using contextual relationships, whereas MICMAC aids in cluster classification.
The paper provides modeling based on ISM, MICMAC, and the IRP for contextual relationship modeling and ranking the SCPMS enablers which will be helpful to academicians and practitioners in the field. The academician can use the applied methodologies in exploring the SCPM domain to develop a typical performance-based system suiting a specific sector or a type of industry. The academician may also be able to explore the applied methodologies in evaluating the various barriers to the SCPMS for enhancing sustainability. Practicing managers can use the relationship modeling to ensure effective and sustainable SCM. Practitioners of management can utilize the results of both techniques to comprehend the SCPM enablers. The relation modeling also reveals a substantial correlation among the SCPM enablers. This aids in developing strategies and making decisions. The IRP approach used in this study has two key advantages, i.e., (a) information about dominance levels is optional, and (b) it provides simplicity in measuring and comparing interactivity’s impact. Ranking of the SCPM enablers provides liberty to practicing managers to prioritize strategies and decision making.
A logical extension to this work could involve mathematical modeling in the crisp and fuzzy environment to assess and rank the SCPMS enablers. The results from the exploratory analysis and structural equation modeling could be intriguing. Future research may also investigate the role of various enablers related to the environment, organizational soft practices [58,59], and smart technologies in the SCPMS to enhance sustainability [29].

Funding

This research was funded by the Deanship of Scientific Research, King Khalid University, Kingdom of Saudi Arabia, and the grant number is RGP.1/373/43.

Institutional Review Board Statement

Not applicable.

Informed Consent Statement

Not applicable.

Data Availability Statement

Not applicable.

Acknowledgments

We would like to express our gratitude to the Deanship of Scientific Research, King Khalid University, Kingdom of Saudi Arabia, for funding this work, as well as family, friends, and colleagues for their constant inspiration and encouragement.

Conflicts of Interest

The author declares no conflict of interest.

References

  1. Sillanpää, I. Empirical study of measuring supply chain performance. Benchmarking Int. J. 2015, 22, 290–308. [Google Scholar] [CrossRef]
  2. Piotrowicz, W.; Cuthbertson, R. Performance measurement and metrics in supply chains: An exploratory study. Int. J. Prod. Perform. Manag. 2015, 64, 1068–1091. [Google Scholar] [CrossRef]
  3. Zuriekat, M.; Salameh, R.; Alrawashdeh, S. Participation in performance measurement systems and level of satisfaction. Int. J. Bus. Soc. Sci. 2011, 2, 159–169. [Google Scholar]
  4. Stefanovic, N. Proactive supply chain performance management with predictive analytics. Sci. World J. 2014, 2014, 528917. [Google Scholar] [CrossRef]
  5. Shen, B.; Li, Q.; Dong, C.; Perry, P. Sustainability issues in textile and apparel supply chains. Sustainability 2017, 9, 1592. [Google Scholar] [CrossRef]
  6. Dumitrascu, O.; Dumitrascu, M.; Dobrotǎ, D. Performance evaluation for a sustainable supply chain management system in the automotive industry using artificial intelligence. Processes 2020, 8, 1384. [Google Scholar] [CrossRef]
  7. Cantini, A.; Peron, M.; De Carlo, F.; Sgarbossa, F. A decision support system for configuring spare parts supply chains considering different manufacturing technologies. Int. J. Prod. Res. 2022, 1–21. [Google Scholar] [CrossRef]
  8. Beamon, B.M.; Chen, V.C.P. Performance analysis of conjoined supply chains. Int. J. Prod. Res. 2001, 39, 3195–3218. [Google Scholar] [CrossRef]
  9. Cai, J.; Liu, X.; Xiao, Z.; Liu, J. Improving supply chain performance management: A systematic approach to analyzing iterative KPI accomplishment. Decis. Support Syst. 2009, 46, 512–521. [Google Scholar] [CrossRef]
  10. Carvalho, H.; Azevedo, S.G.; Cruz-Machado, V. Supply chain performance management: Lean and green paradigms. Int. J. Bus. Perform. Supply Chain Model. 2010, 2, 304–333. [Google Scholar] [CrossRef]
  11. Lin, Y.; Zhang, W. An incentive model between a contractor and multiple subcontractors in a green supply chain based on robust optimization. J. Manag. Anal. 2020, 7, 481–509. [Google Scholar] [CrossRef]
  12. Xie, Y.; Yin, Y.; Xue, W.; Shi, H.; Chong, D. Intelligent supply chain performance measurement in industry 4.0. Syst. Res. Behav. Sci. 2020, 37, 711–718. [Google Scholar] [CrossRef]
  13. Charan, P.; Shankar, R.; Baisya, R.K. Analysis of interactions among the variables of supply chain performance measurement system implementation. Bus. Process Manag. J. 2008, 14, 512–529. [Google Scholar] [CrossRef]
  14. Abu-Suleiman, A.; Boardman, B.; Priest, J.W. A framework for an integrated supply chain performance management system. In IIE Annual Conference. Proceedings; Institute of Industrial and Systems Engineers (IISE): Peachtree Corners, GA, USA, 2004; p. 1. [Google Scholar]
  15. Kurien, G.P.; Qureshi, M.N. Study of performance measurement practices in supply chain management. Int. J. Bus. Manag. Soc. Sci. 2011, 2, 19–34. [Google Scholar]
  16. Zhu, J. Multi-factor performance measure model with an application to fortune 500 companies. Eur. J. Oper. Res. 2000, 123, 105–124. [Google Scholar] [CrossRef]
  17. Wong, W.P.; Wong, K.Y. Supply chain performance measurement system using DEA modeling. Ind. Manag. Data Syst. 2007, 107, 361–381. [Google Scholar] [CrossRef]
  18. Gunasekaran, A.; Patel, C.; McGaughey, R.E. A framework for supply chain performance measurement. Int. J. Prod. Econ. 2004, 87, 333–347. [Google Scholar] [CrossRef]
  19. Sharma, R.; Kamble, S.S.; Gunasekaran, A.; Kumar, V.; Kumar, A. A systematic literature review on machine learning applications for sustainable agriculture supply chain performance. Comput. Oper. Res. 2020, 119, 104926. [Google Scholar] [CrossRef]
  20. Lima-Junior, F.R.; Carpinetti, L.C.R. Quantitative models for supply chain performance evaluation: A literature review. Comput. Ind. Eng. 2017, 113, 333–346. [Google Scholar] [CrossRef]
  21. Gunasekaran, A.; Kobu, B. Performance measures and metrics in logistics and supply chain management: A review of recent literature (1995–2004) for research and applications. Int. J. Prod. Res. 2007, 45, 2819–2840. [Google Scholar] [CrossRef]
  22. Katiyar, R.; Barua, M.K. Analysis of interactions among the key enablers of supply chain performance measurement in Indian automotive industry. Ind. Eng. J. 2013, 6, 28–33. [Google Scholar]
  23. Maestrini, V.; Luzzini, D.; Maccarrone, P.; Caniato, F. Supply chain performance measurement systems: A systematic review and research agenda. Int. J. Prod. Econ. 2017, 183, 299–315. [Google Scholar] [CrossRef]
  24. Thakkar, J.; Kanda, A.; Deshmukh, S.G. Supply chain performance measurement framework for small and medium scale enterprises. Benchmarking 2009, 16, 702–723. [Google Scholar] [CrossRef]
  25. Wibowo, M.A.; Sholeh, M.N. The analysis of supply chain performance measurement at construction project. Procedia Eng. 2015, 125, 25–31. [Google Scholar] [CrossRef]
  26. Saad, M.; Patel, B. An investigation of supply chain performance measurement in the Indian automotive sector. Benchmarking Int. J. 2006, 13, 36–53. [Google Scholar] [CrossRef]
  27. Caridi, M.; Perego, A.; Tumino, A. Measuring supply chain visibility in the apparel industry. Benchmarking Int. J. 2013, 20, 25–44. [Google Scholar] [CrossRef]
  28. Sellitto, M.A.; Pereira, G.M.; Borchardt, M.; da Silva, R.I.; Viegas, C.V. A SCOR-based model for supply chain performance measurement: Application in the footwear industry. Int. J. Prod. Res. 2015, 53, 4917–4926. [Google Scholar] [CrossRef]
  29. Kumar, S.; Raut, R.D.; Narwane, V.S.; Narkhede, B.E.; Muduli, K. Implementation barriers of smart technology in Indian sustainable warehouse by using a Delphi-ISM-ANP approach. Int. J. Product. Perform. Manag. 2022, 71, 696–721. [Google Scholar] [CrossRef]
  30. Xu, L.D.; He, W.; Li, S. Internet of things in industries: A survey. IEEE Trans. Ind. Inform. 2014, 10, 2233–2243. [Google Scholar] [CrossRef]
  31. Dweekat, A.J.; Hwang, G.; Park, J. A supply chain performance measurement approach using the internet of things. Ind. Manag. Data Syst. 2017, 117, 267–286. [Google Scholar] [CrossRef]
  32. Ganga, G.M.D.; Carpinetti, L.C.R. A fuzzy logic approach to supply chain performance management. Int. J. Prod. Econ. 2011, 134, 177–187. [Google Scholar] [CrossRef]
  33. Agami, N.; Saleh, M.; Rasmy, M. Supply chain performance measurement approaches: Review and classification. J. Organ. Manag. Stud. 2012, 2012, 872753. [Google Scholar] [CrossRef]
  34. Kurien, G.P.; Qureshi, M.N. Measurement of flexibility and its benchmarking using data envelopment analysis in supply chains. In Organisational Flexibility and Competitiveness; Springer India: New Delhi, India, 2014; pp. 259–272. [Google Scholar] [CrossRef]
  35. Tejpal, G.; Garg, R.K.; Sachdeva, A. Trust among supply chain partners: A review. Meas. Bus. Excel. 2013, 17, 51–71. [Google Scholar] [CrossRef]
  36. Kurien, G.P.; Qureshi, M.N. Performance measurement systems for green supply chains using modified balanced score card and analytical hierarchical process. Sci. Res. Essays 2012, 7, 3149–3161. [Google Scholar] [CrossRef]
  37. Jacobs, M.A.; Yu, W.; Chavez, R. The effect of internal communication and employee satisfaction on supply chain integration. Int. J. Prod. Econ. 2016, 171, 60–70. [Google Scholar] [CrossRef]
  38. Alfalla-Luque, R.; Marin-Garcia, J.A.; Medina-Lopez, C. An analysis of the direct and mediated effects of employee commitment and supply chain integration on organisational performance. Int. J. Prod. Econ. 2015, 162, 242–257. [Google Scholar] [CrossRef]
  39. Soni, G.; Kodali, R. Internal benchmarking for assessment of supply chain performance. Benchmarking Int. J. 2010, 17, 44–76. [Google Scholar] [CrossRef]
  40. Shah, J.; Singh, N. Benchmarking internal supply chain performance: Development of a framework. J. Supply Chain Manag. 2001, 37, 37–47. [Google Scholar] [CrossRef]
  41. Bhagwat, R.; Sharma, M.K. Performance measurement of supply chain management using the analytical hierarchy process. Prod. Plan. Control 2007, 18, 666–680. [Google Scholar] [CrossRef]
  42. Faisal, M.N. Sustainable supply chains: A study of interaction among the enablers. Bus. Process Manag. J. 2010, 16, 508–529. [Google Scholar] [CrossRef]
  43. Diabat, A.; Kannan, D.; Mathiyazhagan, K. Analysis of enablers for implementation of sustainable supply chain management—A textile case. J. Clean. Prod. 2014, 83, 391–403. [Google Scholar] [CrossRef]
  44. Jakhar, S.K.; Barua, M.K. An integrated model of supply chain performance evaluation and decision-making using structural equation modelling and fuzzy AHP. Prod. Plan. Control 2014, 25, 938–957. [Google Scholar] [CrossRef]
  45. Tyagi, M.; Kumar, P.; Kumar, D. Assessment of critical enablers for flexible supply chain performance measurement system using fuzzy DEMATEL approach. Glob. J. Flex. Syst. Manag. 2015, 16, 115–132. [Google Scholar] [CrossRef]
  46. Kurien, G.P.; Qureshi, M.N. Analysis and measurement of supply chain flexibility. Int. J. Logist. Syst. Manag. 2015, 21, 70. [Google Scholar] [CrossRef]
  47. Mangla, S.K.; Luthra, S.; Rich, N.; Kumar, D.; Rana, N.P.; Dwivedi, Y.K. Enablers to implement sustainable initiatives in agri-food supply chains. Int. J. Prod. Econ. 2018, 203, 379–393. [Google Scholar] [CrossRef]
  48. Qureshi, M.N.; Kumar, D.; Kumar, P. Modeling the logistics outsourcing relationship variables to enhance shippers’ productivity and competitiveness in logistical supply chain. Int. J. Prod. Perform. Manag. 2007, 56, 689–714. [Google Scholar] [CrossRef]
  49. Qureshi, K.M.; Mewada, B.; Alghamdi, S.Y.; Almakayeel, N.; Qureshi, M.R.N.; Mansour, M. Accomplishing sustainability in manufacturing system for small and medium-sized enterprises (SMEs) through lean implementation. Sustainability 2022, 14, 9732. [Google Scholar] [CrossRef]
  50. Gupta, H.; Kumar, S.; Kusi-Sarpong, S.; Jabbour, C.J.C.; Agyemang, M. Enablers to supply chain performance on the basis of digitization technologies. Ind. Manag. Data Syst. 2021, 121, 1915–1938. [Google Scholar] [CrossRef]
  51. Qureshi, K.M.; Mewada, B.G.; Alghamdi, S.Y.; Almakayeel, N.; Mansour, M.; Qureshi, M.R.N. Exploring the lean implementation barriers in small and medium-sized enterprises using interpretive structure modeling and interpretive ranking process. Appl. Syst. Innov. 2022, 5, 84. [Google Scholar] [CrossRef]
  52. Keeney, R.L. Value-focused brainstorming. Decis. Anal. 2012, 9, 303–313. [Google Scholar] [CrossRef]
  53. Sushil. Interpretive ranking process. Glob. J. Flex. Syst. Manag. 2009, 10, 1–10. [Google Scholar] [CrossRef]
  54. Luthra, S.; Garg, D.; Haleem, A. An analysis of interactions among critical success factors to implement green supply chain management towards sustainability: An Indian perspective. Resour. Policy 2015, 46, 37–50. [Google Scholar] [CrossRef]
  55. Haleem, A.; Sushil; Qadri, M.A.; Kumar, S. Analysis of critical success factors of world-class manufacturing practices: An application of interpretative structural modelling and interpretative ranking process. Prod. Plan. Control 2012, 23, 722–734. [Google Scholar] [CrossRef]
  56. Tripathy, S.; Sahu, S.; Ray, P.K. Interpretive structural modelling for critical success factors of R&D performance in Indian manufacturing firms. J. Model. Manag. 2013, 8, 212–240. [Google Scholar] [CrossRef]
  57. Thangaratinam, S.; Redman, C.W. The Delphi technique. Obstet. Gynaecol. 2005, 7, 120–125. [Google Scholar] [CrossRef]
  58. Muduli, K.k.; Luthra, S.; Kumar Mangla, S.; Jabbour, C.J.C.; Aich, S.; Guimarães, J.C.F. Environmental management and the “soft side” of organisations: Discovering the most relevant behavioural factors in green supply chains. Bus. Strat. Environ. 2020, 29, 1647–1665. [Google Scholar] [CrossRef]
  59. Muduli, K.; Kusi-Sarpong, S.; Yadav, D.K.; Gupta, H.; Jabbour, C.J.C. An original assessment of the influence of soft dimensions on implementation of sustainability practices: Implications for the thermal energy sector in fast growing economies. Oper. Manag. Res. 2021, 14, 337–358. [Google Scholar] [CrossRef]
Figure 1. Research methodology.
Sustainability 14 11296 g001
Figure 2. ISM for SCPMS enablers.
Sustainability 14 11296 g002
Figure 3. Driving power and dependence diagram of SCPMS enablers using MICMAC (Legend: SCPMS enabler classification: I, Autonomous; II, Dependent; III, Linkage; IV, Independent.).
Sustainability 14 11296 g003
Figure 4. An interpretive ranking process model for SCPMS enablers.
Sustainability 14 11296 g004
Table 1. The SCPMS enablers used in various studies.
Sr. No.Enablers Used in StudiesEnablers MethodologyReference
1The order entry method, Order lead-time, The customer order path, Flexibility, The customer query time, Post transaction measures of customer service, Range of products and services, Capacity utilization, Effectiveness of scheduling techniques, Performance evaluation of delivery link, Measures for delivery performance evaluation11BSC[41]
2Effective information system, Employee commitment, Dynamic, inter-connectable, cross-functional, and usable SCPMS, Partnership with dealers, distributors, and retailers, Appropriate performance metrics, Overcoming mistrust, Funds for PMS implementation, Commitment by top management, Awareness about PMS in SC, Consistent with strategic goals, Setting objectives, evaluating performance and determining the future course of action, Proactive management, Benchmarking, Effective and efficient supply chain14Interpretive Structural Modelling (ISM)[13]
3Information sharing, Strategic planning to implement sustainable practices in SC, Consumer concern towards sustainable practices, Collaborative relationships, Metrics to quantify sustainability benefits in an SC, Regulatory framework, Support to partners in the SC, Top management commitment, Awareness about sustainable practices in SC, Availability of funds10ISM[42]
4Energy Efficiency Saving, Carbon Trading Penalties, Carbon Trading Allowances, Environment Policy, ISO Accreditation, FTSE Good Index, Environmental management system, Carbon Emission Ratio, EMS Certification, Benchmarking, Cleaner SC, Renewable Energy, Environmental Team, Environment Index, Social Index, Economic Index16BSC and AHP[36]
5Order entry method, Order lead time, Supplier selection, Buyer-supplier relationship, Effectiveness of master production schedule, Quality, Delivery lead time, Flexibility of delivery systems to meet particular customer needs, Flexibility to meet particular customer needs, Customer query time, Flexibility to meet particular customer needs10ISM[22]
6Employment stability, Health and safety issues, Community economic welfare, Adoption of safety standards, Adoption of green purchasing, Adoption of green practices, Eco-design, Government regulation, Hazard management, Customer satisfaction, Environmental cost, Economic input to infrastructural development, Improvement of product characteristics13ISM[43]
7Total order cycle time, Rate of return on investment, Rate of return on investment, Cash to cash cycle time, Truthfulness of demand predictability/forecasting method, Level of energy utilization, Level and quality of information sharing, Extent of buyer-vendor cost-saving initiative, Extent of cooperation leading to improved quality, The entity and stage at which supplier is involved, Extent of mutual assistance in problem-solving efforts, Level of capacity and resource utilization, Value added productivity, Extent of production flexibility, Perfect order fulfillment, Total distribution cost, Order fill rate, Level of flexibility to meet particular customer needs, Customer query time, Level of customer perceived value of product and service20Structural equation modeling (SEM) and fuzzy analytic hierarchy process (FAHP)[44]
8Capital, Distribution costs, Manufacturing cost, Inventory, Volume flexibility, Delivery flexibility, Mix flexibility, New product flexibility8BSC and DEA[34]
9Higher customer satisfaction, Proper capacity utilization, Making proper performance measurement, Information sharing, Effective integration of suppliers, Higher degree of integration across the supply chain, Information availability and customer responsiveness, Alignment of systems throughout the supply chain, Open and transparent communication, Reduction of new product development cycle time, Adoption of modern manufacturing practices, Effectiveness of scheduling techniques, Long-term, strategic relationships, Quality of the supply chain relationships, Adoption of a market orientation15Fuzzy DEMATEL[45]
10Market research and forecasting ability, Product research and development, Flexibility practice and feedback, Relationship with vendors, Cost of changing supplier, Cost of changing inventory, Material flexibility, Supply logistics, Multiple production facilities, Outsourcing, Postponement of final assembly, Machine flexibility, Process flexibility, Ability to shift mode of transportation, volume & mix transported, Change in response time when order changes, Cost for order changes and Responsiveness to urgent orders18BSC and AHP[46]
11Pressure by various governmental, regulating agencies, and non-government bodies, Incentives and support of various agencies to undertake
sustainable initiatives, Understanding customer and other stakeholder requirements, Understanding the sustainability initiative importance and benefits, Management involvement, support, and commitment, Resources allocation and information sharing within and across the hierarchy, Joint efforts, planning and capacity building for delivering sustainability-focused products, Monitoring and auditing the ongoing supply chain activities, Competitive advantages, Cost-effectiveness and improvements in overall performance
10ISM and Fuzzy DEMATEL[47]
Table 2. Self-structural self-interaction (SSIM).
Enabler CodeSCPMS Enablers111098765432
1Loyalty to SCVVVVAAAXVA
2Financial Commitment towards SCPMSVVVVAAVVV
3TrustVVVVAAXV
4Customer SatisfactionVVVVAAV
5Effective Information SystemVVVVAA
6Awareness to SCPMSVVVVV
7Top Management CommitmentVVVV
8Employee CommitmentVVV
9Appropriate Performance MatrixVV
10BenchmarkingV
11Sustainable SCM
Table 3. Initial reachability matrix.
Enabler CodeSCPMS Enablers1234567891011
1Loyalty to SC10110001111
2Financial Commitment towards SCPMS11111001111
3Trust00111001111
4Customer Satisfaction10011001111
5Effective Information System10101001111
6Awareness to SCPMS11111111111
7Top Management Commitment11111011111
8Employee Commitment00000001111
9Appropriate Performance Matrix00000000111
10Benchmarking00000000011
11Sustainable SCM00000000001
Table 4. Final reachability matrix.
Enabler CodeSCPMS Enablers1234567891011Driving Power
1Loyalty to SC10111 *0011118
2Financial Commitment towards SCPMS111110011119
3Trust1 *01110011118
4Customer Satisfaction101 *110011118
5Effective Information System1011 *10011118
6Awareness to SCPMS111111111111
7Top Management Commitment1111101111110
8Employee Commitment000000011114
9Appropriate Performance Matrix000000001113
10Benchmarking000000000112
11Sustainable SCM000000000011
Total (Dependence)37377712891011
*: Enabler has transitivity.
Table 5. First iteration of SCPMS enablers level iteration i.
Enabler CodeReachability SetAntecedent SetIntersection SetLevel
11, 3, 4, 5, 8, 9, 10, 111, 2, 3, 4, 5, 6, 71, 3, 4, 5-
21, 2, 3, 4, 5, 8, 9, 10, 112, 6, 72-
31, 3, 4, 5, 8, 9, 10, 111, 2, 3, 4, 5, 6, 71, 3, 4, 5-
41, 3, 4, 5, 8, 9, 10, 111, 2, 3, 4, 5, 6, 71, 3, 4, 5-
51, 3, 4, 5, 8, 9, 10, 111, 2, 3, 4, 5, 6, 71, 3, 4, 5-
61, 2, 3, 4, 5, 6, 7, 8, 9, 10, 1166-
71, 2, 3, 4, 5, 6, 7, 8, 9, 10, 116, 77-
88, 9, 10, 111, 2, 3, 4, 5, 6, 7, 88-
99, 10, 111, 2, 3, 4, 5, 6, 7, 8, 99-
1010, 111, 2, 3, 4, 5, 6, 7, 8, 9, 1010-
11111, 2, 3, 4, 5, 6, 7, 8, 9, 10, 1111I
Table 6. Iteration results (ii–ix).
IterationEnabler CodeReachability SetAntecedent SetIntersection SetLevel
111, 3, 4, 51, 2, 3, 4, 5, 6, 71, 3, 4, 5V
2222, 6, 72VI
331, 3, 4, 51, 2, 3, 4, 5, 6, 71, 3, 4, 5V
441, 3, 4, 51, 2, 3, 4, 5, 6, 71, 3, 4, 5V
551, 3, 4, 51, 2, 3, 4, 5, 6, 71, 3, 4, 5V
66666VIII
7776, 77VII
8881, 2, 3, 4, 5, 6, 7, 88IV
9991, 2, 3, 4, 5, 6, 7, 8, 99III
1010101, 2, 3, 4, 5, 6, 7, 8, 9, 1010II
1111111, 2, 3, 4, 5, 6, 7, 8, 9, 10, 1111I
Table 7. Lower triangulation matrix (LTM).
Enabler CodeSCPMS Enablers1110981345276DP
11Sustainable SCM100000000001
10Benchmarking110000000002
9Appropriate Performance Matrix111000000003
8Employee Commitment111100000004
1Loyalty to SC11111111 *0008
3Trust11111 *1110008
4Customer Satisfaction111111 *110008
5Effective Information System1111111 *10008
2Financial Commitment towards SCPMS111111111009
7Top Management Commitment1111111111010
6Awareness to SCPMS1111111111111
Total dependence1110987777321
*: Enabler has transitivity.
Table 8. Cross-interaction matrix (CIM) of SCPMS enablers and SC performance criteria.
Enabler Code P1P2P3P4P5P6
1111101
2110000
3011011
4110001
5100101
6100001
7111000
8100101
9101001
10101001
11110000
Table 9. Interpretive matrix.
SCPMS Enablers/Performance CriteriaQuality ManagementProduction Volume Linked to ProductivityManufacturing Lead-TimeProduct-Related Design and Development ProcessProfitabilityBrand Value in the Market
P1P2P3P4P5P6
1. Awareness to SCPMSIts awareness of quality control to produce finer productsIts awareness helps to optimize productivity and reduce the overall costIts awareness leads to planned and cost-effective SC increasing its profitabilityIts awareness leads to customer satisfaction due to good products and service quality, thus increasing the market position Its awareness gives customer satisfaction due to good service quality
2. Top management commitmentIts role is to manage and maintain the whole system, schedule, and program that gives direction to all the employees The management provides all the necessary resources to perform all tasks, thus increasing the productivity
3. Financial commitment It increases the financial productivity Financial independence helps increase the profitability It helps to capitalize all the processes at a lower cost reducing the manufacturing costsIt helps in establishing the brand value in the market
4. Loyalty to SCIt indirectly affects the customer’s faithfulnessSC execution that meets delivery promises in a cost-effective manner It leads to good-quality services leading to happy and satisfied customers
5. Customer satisfactionGood-quality products make customers satisfied Good product and good service quality makes customer propagate and spread the company name Good-quality services make customers happy
6. TrustBuyers trust the suppliers for their good-quality products Buyers’ supplier commitment to providing the good services
7. Effective information systemIt helps in keeping track of all product information and manufacturing good productsTransparency and flow of information at all levels increase productivitySets the foundation to perform all the transactions and decisions as per the need
8. Employee commitmentCommitted employees assist in making good-quality products Committed employees bring an innovative and improved design to the table as per current trends and demands, therefore increasing the market position of the company Committed employee provides good services to the customers leading to content customers
9. Appropriate performance matrixQualitative measures, such as lead time, flexibility, and response time, increase the quality of the product All the measures ensure the profits of the company All the measures help study customers’ needs fulfilling the demands
10. BenchmarkingTo study customer needs to make good-quality products It helps in financial analysis of the market Studying the customers’ demands and needs leads to less risk of returns and product failures, thus pleasing the customers
11. Sustainable SCMIt helps improve the quality and protect the company’s nameIt helps to enhance productivity and cost at the same time
Table 10. SC knowledge base using interpretive logic.
Dominance Comparison of Enablers Performance Indicator (s) InfluencedDominance Comparison of EnablersPerformance Indicator (s) Influenced
1 Dominating 3P2, P37 Dominating 5P1
1 Dominating 5P1, P57 Dominating 6P1
1 Dominating 6P1, P67 Dominating 8P1
2 Dominating 1P1, P27 Dominating 9P1, P3
2 Dominating 3P26 Dominating 11P1, P3, P6
2 Dominating 4P19 Dominating 1P3, P6
2 Dominating 5P19 Dominating 3P1
2 Dominating 6P19 Dominating 4P1, P3, P6
2 Dominating 9P19 Dominating 5P1, P6
2 Dominating 10P19 Dominating 6P1, P6
2 Dominating 11P1, P29 Dominating 8P1, P6
3 Dominating 4P210 Dominating 1P1, P3, P6
3 Dominating 5P610 Dominating 3P1, P6
3 Dominating 6P610 Dominating 4P1, P3, P6
4 Dominating 1P1, P2, P610 Dominating 5P1, P6
4 Dominating 6P1, P610 Dominating 8P1, P6
4 Dominating 8 P1, P610 Dominating 9P1, P3, P6
5 Dominating 4P1, P610 Dominating 11P1
6 Dominating 5P1, P611 Dominating 1P1, P2
6 Dominating 10P1, P611 Dominating 3P2
7 Dominating 1P1, P2, P311 Dominating 4P1, P2
7 Dominating 2P1, P211 Dominating 5P1
7 Dominating 3P2, P311 Dominating 8P1
7 Dominating 4P1, P211 Dominating 9P1
Table 11. Dominating interaction matrix.
Enabler
Code
1234567891011
1 P3, P4, P6P1, P4, P5P3, P4P2, P3P2, P3, P4P4, P6P2, P3P2, P4P2, P4P3, P4, P6
2P1, P2 P1P1, P2P1, P2P1, P2P1, P2P1, P2P1, P2P1, P2P1, P2
3P2, P3, P6P2, P3, P5, P6 P3, P5P2, P3, P5P2, P3, P5P5, P6P2, P3, P5P2, P5P2, P5P3, P5, P6
4P1, P2, P6P6P1, P2, P6 P2P2P6P2P2P2P6
5P1, P4, P6P4, P6P1, P4, P6P1, P4, P6 P4P4, P6P4, P6P4P4P4, P6
6P1, P6P6P1, P6P1, P6P1, P6 P6P6P6P6P6
7P1, P2, P3P3P1, P2, P3P1, P2, P3P1, P2, P3P1, P2, P3 P2, P3P2P2P3
8P1, P4, P6P4, P6P1, P4, P6P1, P4, P6P1, P4, P6P1, P4P1, P4, P6 P4P4P3, P6
9P1, P3, P6P3, P6P1, P3, P6P1, P3, P6P1, P3, P6P1, P3P1, P3, P6P1, P3, P6 P6P3, P6
10P1, P3, P6P3, P6P1, P3, P6P1, P3, P6P1, P3, P6P1, P3P1, P3, P6P1, P3, P6P1, P3 P3, P6
11P1, P2P1, P2P1, P2P1, P2P1, P2P2P1, P2P1, P2P1, P2P1, P2
Table 12. Dominance matrix.
Enabler Code1234567891011(D) *(D–B) **Rank
1 332232222324−38
22 12222222219−17
334 233232232714
4313 111111114−1111
53233 12211220−49
621222 1111114−710
7313333 21112106
83233323 1122323
932333233 1225102
10323332332 226121
112222222222 2014
(B) ***2720262524212121151419
* Number of cases dominating, ** Net dominance, *** Number of cases being dominated.
Publisher’s Note: MDPI stays neutral with regard to jurisdictional claims in published maps and institutional affiliations.

