Article

Analysis of Traffic Operation Characteristics and Calculation Model of the Length of the Connecting Section between Ramp and Intersection

1
School of Civil Engineering and Architecture, Wuhan Institute of Technology, Wuhan 430074, China
2
Nottingham Transportation Engineering Centre, School of Civil Engineering, University of Nottingham, University Park, Nottingham NG7 2RD, UK
*
Author to whom correspondence should be addressed.
Sustainability 2022, 14(2), 629; https://doi.org/10.3390/su14020629
Submission received: 22 November 2021 / Revised: 31 December 2021 / Accepted: 5 January 2022 / Published: 6 January 2022

Abstract

:
Many cities have built expressways to alleviate traffic congestion, among which elevated expressways are the most common form. However, traffic congestion still occurs frequently in the connecting section between the ramp of expressway and the ground intersection. Based on the field traffic survey data, the traffic operation characteristics of vehicles in the connecting section and the main factors affecting the length of the connecting section are analyzed. A combined model for calculating the length of the connecting section between ramp of urban expressway and intersection is proposed. VISSIM is used to simulate the traffic flow under the current and calculated length of the connecting section. The comparison results show that under the calculation length, the travel time, average delay, parking time and queue length are reduced to varying degrees, which verifies the rationality of the calculation model.

1. Introduction

The rapid development of the economy, urban population and car ownership results in serious traffic congestion in many cities [1]. In order to improve the current situation of urban traffic and improve the transport efficiency of the urban road network, an increasing amount of attention has been paid to the construction of the urban expressway, among which the most widely constructed form is the elevated expressway [2]. Expressways share a large amount of the traffic in the city, relieve the traffic pressure of the urban road network and shorten the travel time of residents. It can be seen that expressways play a highly important role in improving the traffic operation of the whole urban road network [3]. However, as the elevated expressway mainly connects the ground traffic through the on-ramp and off-ramp, there are a large number of vehicles queuing up to enter and leave the ramp during the peak hours, resulting in serious congestion at the connecting section between the ramp and grade intersection, which has a great impact on the traffic of the ground and the expressway and reduces the transportation efficiency of the road network.
Previous studies have shown that controlling the signal timing scheme at intersections is an easy and effective way to improve traffic efficiency. Chandle [4] investigated the influences of ramp traffic flow on the lane utilization for signalized intersection approaches which are adjacent to an off-ramp-street junction. A statistical test showed a correlation between lane utilization and the ramp traffic flow. As the ramp traffic flow increases, the left lanes are less utilized and the right lanes are more utilized. Lim [5] proposed a method to reduce the delay time at the intersection by adjusting the signal timing scheme. Through this method, the traffic efficiency of the connecting section can be improved, the vehicles queuing on the ramp and backtracking to the main line of the expressway can be effectively avoided and the delay time of vehicles at each entrance of the intersection can be reduced. Wen [6] focused on the optimization problem of the signalized intersection connected to freeway on-ramps. According to the simulation results, adding a new diverge lane for the right-turn vehicles performed the best, resulting in the least vehicle delay time. Liu [7] provided a dual-phase signal timing optimization model for an intersection connected to the off-ramp of an urban expressway that has special Chinese characteristics, which is solved by an improved genetic algorithm.
Researchers worldwide have conducted a large amount of work on traffic flow characteristics, influencing factors and traffic models of the connecting section near on-ramps and off-ramps. For example, in terms of the traffic flow characteristics and influencing factors of the entrance and exit connecting section, Yun [8] studied the influence of vehicle navigation information on the lane-changing behavior of the urban expressway’s bifurcation section and compared this with traditional road signs. The results show that the influence of in-vehicle navigation information on lane-changing behavior varies with the traffic flow density and the time point when navigation information is first provided. Chen [9] highlighted that the use of double right turn lanes can improve the weaving environment of right turn vehicles from the off-ramp and reduce the forced confluence of the required right turn lanes at the intersection downstream of the off-ramp of the expressway, and the safety benefit increases exponentially with the decrease in the weaving distance. In regard to the vehicle traffic model of the entrance and exit connecting sections, Papageorgiou and Hadj-Salem [10,11] first proposed the ALINEA (asservissement linéaire d’entrée autoroutière) ramp control method. The TRB (Transportation Research Board) access management manual lists strategies and technical guidance for the management of the ramp connecting section [12], but it does not provide a calculation model of the length and the specific value standard. Zhao [13] proposed a comprehensive design model, which uses the concepts of the pre-signal area and sorting area to eliminate traffic interweaving and maximize road capacity. However, this model has an attractive application prospect only when the queue space is sufficiently long and the number of exit lanes is sufficient to receive traffic flow in the sorting area. Bogenberger [14] proposed an algorithm to effectively alleviate the impact of ramp queue length on the main road traffic operation by using the fuzzy neural network algorithm, and the rule setter can select and adjust the fuzzy control rules of the algorithm automatically. Zhaowei [15] considered the influence of the main line flow, critical gap and distance from the nose to junction point in order to establish the empirical capacity model of the expressway entrance weaving area. Ma [16] proposed a coordinated control method based on variable speed limit and coordinated ramp control, which considered the congestion index and realized coordinated control based on queue length, so as to alleviate traffic congestion caused by the combined regional congestion of traditional intersection areas. Mingzheng [17] pointed out that the current traffic congestion problem of the connecting section is caused by the short distance of the connecting section, carried out relevant research on this section and gave specific solutions to solve the serious vehicle interweaving in this section. Yang [18] compared the queue length of two different on-ramp configurations of the main road to the expressway ramp and the connecting line to the expressway. Based on the input–output method, a meso-queue length simulation model was established. The simulation results show that the arrival mode of traffic flow has a significant impact on the queue length of the ramp, and the vehicles released at the upstream signalized intersection easily increase the queue length. However, it was not proposed to reduce the queue length by increasing the distance between the ramp and the intersection. Greguri [19] proposed the latest approach of coordination between controlling on-ramp flows with ramp metering (RM) and Dynamic Route Guidance Information Systems (DRGIS), which reroute vehicles from congested parts of the motorway.
Some researchers have studied the weaving section between the on-ramps and off-ramps of expressways. Sun [20] established a new cellular automaton model that fits in an on-ramp and off-ramp pair area, in which three types of lane change behaviors and eight types of lane-changing management schemes are considered. Wang [21] employed a microscopic traffic software of Vissim to construct a simulation model of weaving areas and evaluate the impact of road and traffic design parameters in the short weaving on traffic efficiency and risks, the weaving length is identified as the most important factor affecting traffic efficiency and risks in the short weaving area. Liao [22] studied the location of internal risk in the weaving areas of complex municipal interchanges under different weaving lengths. Vissim simulation was applied to collect the identification indicator value of 21 typical lane sections.
Some scholars consider ramps and intersections in combination. Su [23] proposed a novel signal control strategy for the feeding intersection and a coordination strategy for integrating it with the corresponding freeway on-ramp metering. UP ALINEA with queue-overwrite is used for the ramp metering. A signal optimization, which takes into account the available ramp space and traffic demand, is developed for intersection signal control. EI-Tantawy [24] presented the problem formulation and the framework for addressing traffic control problems using an integrated solution combining Adaptive Traffic Signal Control (ATSC) and Ramp Metering (RM), using a multi-agent reinforcement learning (MARL) approach. Targeting to evacuate traffic congestion of the off-ramps in freeways, a collaborative control model combining off-ramp intersections and downstream intersections under congestion conditions was proposed by Xu Jianmin [25].The proposed model was divided into two parts: The first was the maximum capacity optimization model in targeted intersections, and the second was the maximum vehicle evacuation optimization model in downstream intersection.
Most of the above research focuses on ramp setting, ramp traffic flow characteristics analysis, ramp coordinated control, traffic capacity research of expressway weaving areas, risk distribution characteristics and the optimization of expressway short weaving areas; some researchers consider the length of the connecting section between ramp and ground intersection as an important factor affecting traffic operation in the weaving area but do not give a quantitative calculation model of the connecting section length. This research will select two connecting sections between the ramp and ground intersection to carry out a survey of the traffic volume, the design parameters of the length of the connecting section between the ramp and ground intersection and the traffic operation characteristics of the vehicles in the connecting section. Since the ground intersection is controlled by signal lights, the traffic operation in the weaving area of the connecting section between ramp and ground intersection is affected by the interrupted traffic flow queued at the intersection. Its traffic operation characteristics are quite different from the uninterrupted traffic flow in the weaving area between the on-ramp and off-ramp of the expressway; especially, the impact on the speed is the most significant. Therefore, this research will focus on surveying the average speed of the weaving area of the connecting section of the ramp and ground intersection. Based on the existing traffic flow theory of the expressway weaving area, considering the queuing caused by intersection signal lights, the queuing theory model will be introduced, the combined calculation model of the length of connecting section between the ramp and ground intersection will be established and the recommended value of the ramp and intersection connection section length will be calculated. VISSIM will be used to simulate the traffic flow under the current length and the calculated length of two trial connecting sections between the ramp and ground intersection, respectively, and the simulation results of travel time, average delay time, stopping time and queue length under the current length and the calculated length will be compared and analyzed, which quantitatively evaluates the improvement of the capacity and service level of the connecting section between ramp and ground intersection and verifies the practicability of the combined model and calculation results.

2. Experimental Method

2.1. Traffic Survey

2.1.1. Methods and Contents

Traffic survey is a powerful way to collect basic traffic data and obtain vehicle operation characteristics. At present, the main method of traffic survey is to collect relevant data through field survey by the manual survey method. In this survey, more than 30 investigators used a traffic volume survey instrument, roller ranging ruler and other tools to collect data on site, and then sort it out uniformly. The traffic survey of the connecting section between the ramp of the urban expressway and intersection mainly includes three parts: the survey of basic data of road facilities, the survey of traffic management and control and the survey of traffic flow data.

2.1.2. Location and Time of the Traffic Survey

The research object of this paper was the distance of the connecting section between the ramp and intersection. Combined with the traffic congestion status of the Wuhan urban expressway, this survey selected the connecting section near the intersection of Xiongchu Avenue viaduct and Guanggu Avenue and that near the intersection of Xiongchu Avenue viaduct and Minzu Avenue. External factors such as weather will have a great impact on the traffic flow, so we chose sunny days for the traffic survey. The survey was conducted on 4 September 2019 (Wednesday) and 5 September 2019 (Thursday). The survey was conducted during 7:00–9:00 and 17:00–19:00. According to the survey, it is found that the traffic volume in the morning rush hour is greater than that in the evening rush hour in the connecting section, so the data of the morning rush hour are used in the paper.
Figure 1 shows the satellite photos of the survey site and the functional area division of the ramp.

2.2. Existing Design Parameters of the Connecting Section between the Ramp and Intersection

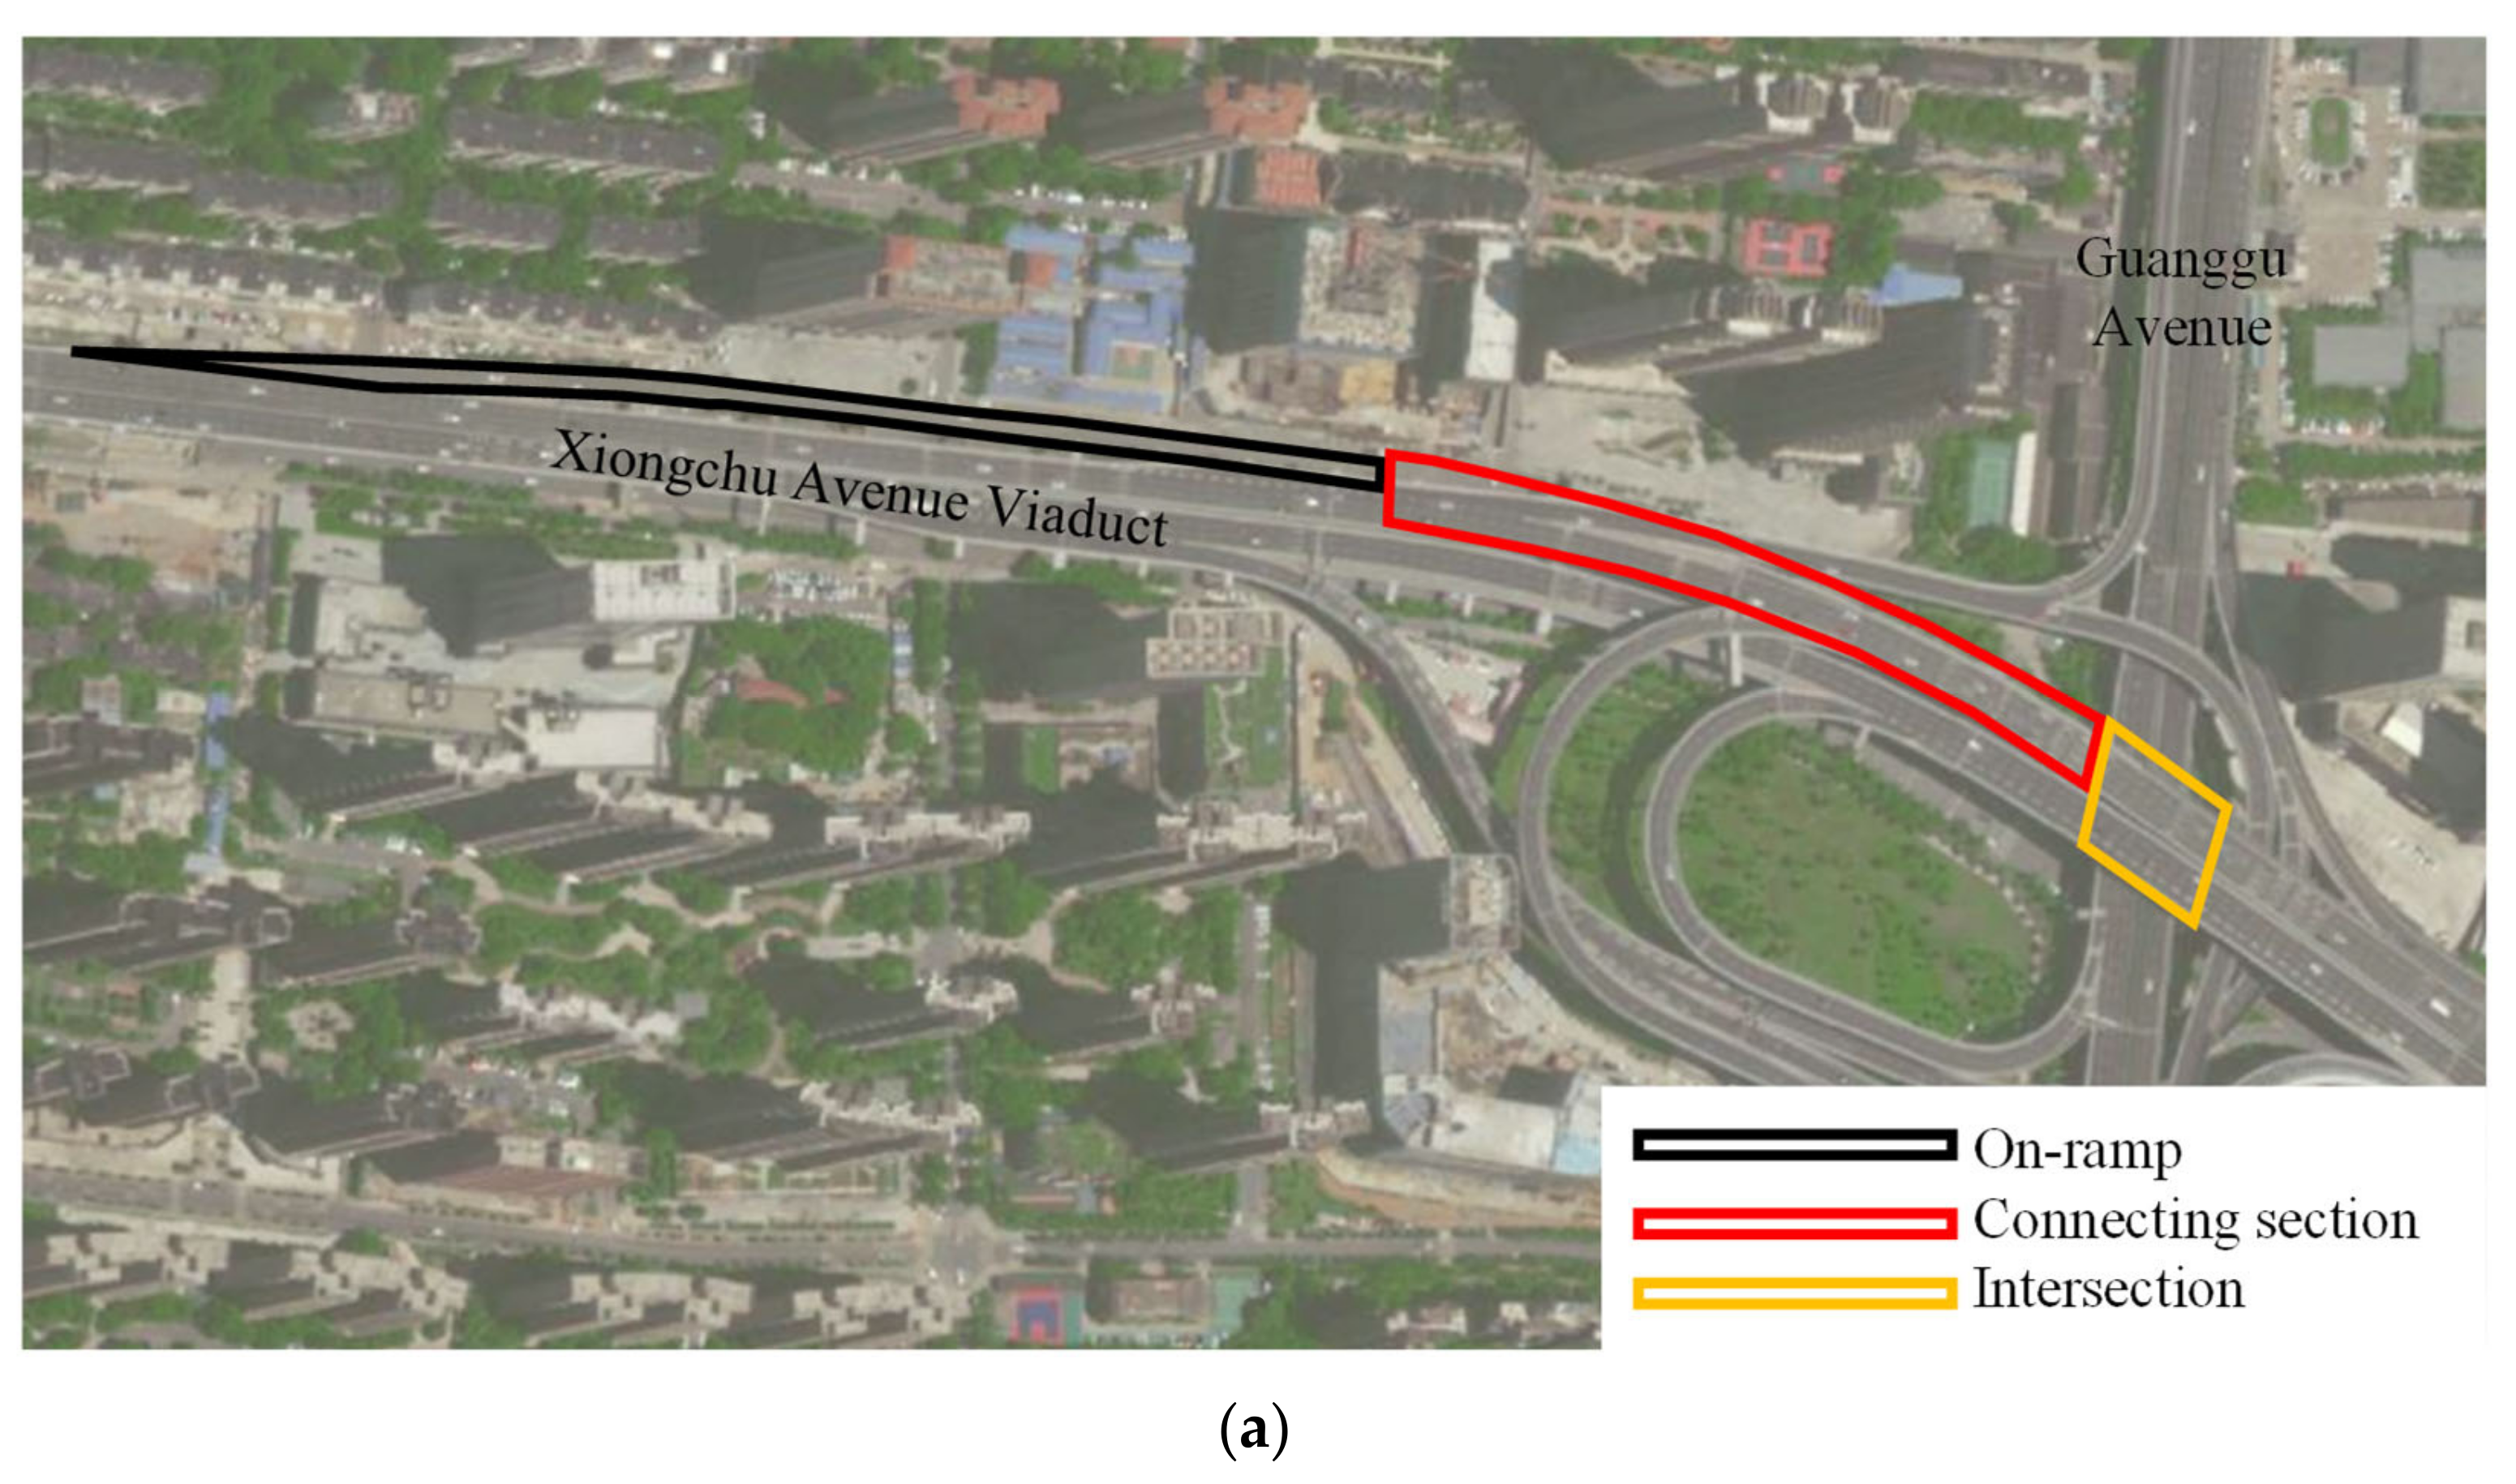
2.2.1. The Trial Connecting Section between On-Ramp and Intersection

The connecting section between the on-ramp of the urban expressway and the intersection is defined as the distance between the foot of the ramp and the stop line of the intersection. The connecting section near the intersection of Xiongchu Avenue Viaduct and Guanggu Avenue was selected as the trial section. As shown in the Figure 2, it is composed of the merging section, the weaving section and the queuing section.
There are three layout types of on-ramp grounding points: The on-ramp is connected to the outermost lane of the ground road, the on-ramp is connected with the middle lane of the ground road and the on-ramp is connected with the innermost lane of the ground road. The arrangement type of the ramp-grounding point in the trail section is the on-ramp connecting with the outermost lane on the ground. After the vehicles enter the connecting section through the intersection, if the vehicles in the lane with the non-grounding point need to enter the ramp, they need to change to the lane where the grounding point is located, while vehicles in the lane where the grounding point is located do not need to enter the ramp, they need to change to other lanes. The interweaving situation of vehicles under the three layout types is shown in the Figure 3.
The on-ramp of the trial section is a single-lane road, and the current length of the connecting section between the on-ramp and the intersection is 196 m. The intersection is a crossroad controlled by signal lights, and there are 4 inlet roads. The signal phases are shown in the Table 1.

2.2.2. The Trial Connecting Section between Off-Ramp and Intersection

The connecting section between the off-ramp of urban expressway and the intersection is defined as the distance between the foot of the off-ramp and the stop line of the intersection. The connecting section near the intersection of Xiongchu Avenue Viaduct and Minzu Avenue was selected as the trial section. It is composed of the merging section, the weaving section and the queuing section, as shown in the Figure 4.
The grounding point layout of the off-ramp is similar to that of the on-ramp. After the vehicles on the ramp and ground road enter the connecting section, they change lanes according to their own turning needs at the intersection, resulting in vehicle interweaving. The off-ramp in the trial connects with the outermost lane on the ground, and the interweaving situation of vehicles is shown in Figure 5.
The off-ramp of the trial section is a single-lane road, and the current length of the connecting section between the off-ramp and the intersection is 124 m. The intersection is a crossroad controlled by signal lights, and there are 4 inlet roads. The signal phases are shown in the Table 2.

3. Experimental Results and Discussion

3.1. Traffic Operation Characteristics of the Connecting Section between Ramp and Intersection

3.1.1. Traffic Operation Characteristics of the Connecting Section between the On-Ramp and Intersection

The merging section of the on-ramp connecting section refers to the distance that the vehicles drive before changing lanes after entering the entrance lane where the on-ramp is located. This distance is mainly related to the vehicle speed and the acceleration of the vehicle in the merging section. According to the actual survey, the vehicle in the case of traffic congestion after entering the merging section basically decelerates, and the approximate acceleration value is 1 m/s2. As can be seen from Table 3, the driving speed of the vehicle is 38.62 km/h when it first enters the merging section, and it is 22.21 km/h when it leaves the merging section.
The weaving section of the on-ramp connecting section mainly refers to the distance from the preparation of lane-changing to the completion of lane-changing. When drivers change lanes in the weaving section, they will show certain lane-changing characteristics and car-following characteristics [26]. In the weaving section, most of the vehicles follow the front vehicle, and the speed swings within the speed range of the front vehicle. The speed of the adjacent vehicles in the continuous traffic flow is basically the same. In addition, the lane-changing must be completed within a limited length, which causes some vehicles to slow down and stay in the weaving section in order to wait for the right opportunity to change lines, causing congestion in the weaving section. It can be seen from Table 4 that the average speed of the vehicle in the weaving section is 37.73 km/h.
The queuing section of the on-ramp connecting section refers to the distance of vehicles queuing before entering the ramp due to traffic congestion. The queuing length is mainly related to traffic flow and the number of on-ramp lanes. When there are too many vehicles that need to enter the ramp, the ramp entrance will be blocked, resulting in the phenomenon of queuing, and there is only one channel waiting for service, so it can be considered as a single channel queuing service (M/M/1) system.
As can be seen from Table 4, during the survey period, the traffic volume of the left turn and straight through at the east entrance of the intersection was large, both of which were more than 2 times of the right-turn flux. The traffic volume of the straight vehicles at south entrance road was large, almost twice that of the left turn and right turn. The traffic volume of the straight vehicles of the west entrance was almost three times that of the left-turn traffic volume and seven times that of the right-turn traffic. At the north entrance, the straight traffic volume was large, 4–5 times larger than that of the left and right turn fluxes. However, at present, the phase and green time of each signal at the intersection is the same, which cannot fully meet the traffic demand, especially in the peak period, which is very likely to cause traffic congestion and affect the operation efficiency of the urban road network.

3.1.2. Traffic Operation Characteristics of the Connecting Section between the Off-Ramp and Intersection

The merging section of the connecting section between the off-ramp and intersection mainly refers to the distance of vehicles from leaving the ramp to safely merging into the ground lane before lane-changing. This distance is not only related to the ground marking but also to the vehicle speed and the acceleration of the vehicle in the merging section. According to the actual survey, the vehicle in the case of traffic congestion basically decelerates after entering the merging section, and the approximate acceleration value is 1 m/s2. As can be seen from Table 5, the driving speed of the vehicles is 25.25 km/h when they first enter the merging section, and it is 22.08 km/h when they leave the merging section.
The weaving section of the off-ramp connecting section mainly refers to the distance that the vehicles travel in the process from preparing to completing a lane-changing action. The traffic characteristics of vehicles in the weaving section of the off-ramp connecting section are similar to those of vehicles in the weaving section of the on-ramp connecting section. It can be seen from Table 6 that the average speed of the vehicle in the weaving section is 24.07 km/h.
The queuing section of the off-ramp connecting section mainly refers to the distance of vehicles queuing due to the influence of intersection signal lights or traffic congestion. According to the survey, the queue length at intersections is related to the signal cycle, road capacity, traffic flow and other factors. At the beginning of the green light, the total number of vehicles queuing is the largest. Therefore, the queue length of the connecting section of the off-ramp is mainly related to the delay and the wave in traffic flow.
As can be seen from Table 6, the straight traffic volume at the east entrance of the intersection is large, which is about two and four times that of the left-turn and right-turn fluxes, respectively. The traffic volume of the south entrance is smaller than that of other entrances, and the direct traffic volume is the largest. The traffic volume of the west entrance is larger than that of other entrances, and the traffic volumes of the left turn, straight through and right turn are similar. The traffic volume of the straight through at the north entrance is the largest, which is about two times that of the left-turn and right-turn fluxes.
It can be seen from Table 3, Table 4, Table 5 and Table 6 that during the survey period, the east, south and north entrances of the intersection have a large straight ahead traffic volume, while the west entrance has large traffic volume in all directions. Although the signal timing and road design capacity of the intersection can meet the usual traffic demand, traffic congestion is still unavoidable in the peak period due to the excessive concentration of vehicles and some vehicles violating the traffic order.
In summary, through the analysis of the traffic operation characteristics of the connecting section, it can be concluded that the main factors affecting the length of the connecting section include the following:
  • Traffic flow density: The traffic flow density mainly affects the length of the queuing section in the connecting section. When there is a traffic jam on the road, the traffic flow will form a wave in the opposite direction, which is the same as the sound wave, into the congested section. This wave will lead to traffic chaos on the road before the bottleneck section [26].
  • Vehicle speed: The speed of vehicles directly affects the length of the connecting section, and the lane-changing behavior of vehicles in the current stage is compulsory [27], and only when the vehicle gap is sufficiently large will the driver change lanes [28]. The speed of vehicles in the current stage is an important factor affecting the critical gap, there is a positive correlation between them.
  • Signal cycle and phase: Signal cycle and phase will affect the vehicle delay. The longer the vehicle delay, the longer the queue length. In addition, the service level of the road is not the same under different signal cycles, so the signal cycle and phase of the intersection will have a great impact on the queue length of the connecting section.
  • Road capacity and service level: The road capacity and service level will affect drivers’ driving speed and lane-changing behavior, so it affects the length of the connecting section to a certain extent.
The length of the connection section between the ramp and intersection is also influenced by other factors, such as the available storage of ground intersection, the elevation of the urban expressway, the length of the ramp, and so on. The calculation model in this paper only considers the above main factors and does not take all the influencing factors into account.

3.2. Calculation Model of the Length of Connecting Section between the Ramp and Intersection

3.2.1. Calculation Model of the Length of Connecting Section between the On-Ramp and Intersection

(1)
Length of the Merging Section: L1
After the vehicle enters the merging section, it can be considered that it is moving in a straight line with uniform deceleration. The law of uniform speed of linear motion in physics is shown in formula (1):
2 a x = v 2 2 v 1 2
where x = the distance the object has moved (m);
a = the acceleration of an object in motion (m/s2);
v2 = the final velocity of object motion (m/s);
v1 = the initial velocity of object motion.
After unit conversion and deformation of the above formula, the following is obtained:
L 1 = v 1 3.6 2 v 2 3.6 2 2 a
where L1 = the length of the merging section (m);
v 1 = the speed at which the vehicle first enters the merging section (km/h);
v 2 = the speed at which the vehicle leaves the merging section (km/h);
a = according to the analysis of the previous traffic survey data, the acceleration of vehicles at the confluence section is fixed at 1 m/s2.
Substituting data: L 1 = 38.51   m .
(2)
Length of the Weaving Section: L2
The length of weaving section can be divided into three sections: L21—the distance that a vehicle needs to travel when looking for a gap to enter; L22—the distance that a vehicle will move forward when it changes lanes; L23—the distance for the driver to resume driving after the vehicle completes the lane-changing:
L 2 = L 21 + L 22 + L 23
  • The distance that a vehicle needs to travel when looking for a gap to insert: L21
The vehicle flow in the urban road network generally satisfies Poisson distribution, and the headway follows negative exponential distribution; the headway distribution can be simulated by shifting the negative exponential distribution curve. The specific distribution function is as follows:
P ( h t ) = e λ ( t τ ) ,   t τ
P ( h < t ) = 1 e λ ( t τ ) ,   t τ
where P (ht) = the probability of headway greater than or equal to t;
P (h < t) = the probability of headway less than t;
λ = the number of vehicles arriving (pcu/s);
τ = the minimum headway, 1.0–1.5 s.
According to Formulas (4) and (5), we can consider that the average waiting time for a vehicle to find an insertable gap can be expressed by the following formula:
t w = λ 1 + 1 e λ 1 t c τ λ 1 t c 1 λ 1 e λ 1 t c τ × 1 e λ 1 t c τ
where t w = the average waiting time (s);
t c = the critical clearance time, 5.0 s;
λ 1 = the average number of vehicles reached, equal to Q/3600, veh/s; Q is the maximum service traffic volume;
τ = the minimum headway of the target lane, value: 1.2 s.
Therefore, according to the headway distribution model, it can be deduced that the distance for the vehicle to find the insertable gap is as follows:
L 21 = v 3 3.6 t w
where L21 = the distance for the vehicle to find the insertable gap (m);
v 3 = the average speed of vehicles in weaving section (km/h);
t w = the average waiting time for a vehicle to find an insertable gap (s).
Substituting data: L21 = 17.37 m.
  • According to the law of linear motion with uniform speed change, the distance that a vehicle moves forward when changing lanes: L22
L 22 = v 3 3.6 t 2
where L22 = the distance that a vehicle moves forward when changing lanes (m);
v 3 = the average speed of vehicles in weaving section (km/h);
t 2 = the traverse time (s), generally equal to 4.0 s.
Substituting data: L 22 = 40.81   m .
  • According to the law of linear motion with uniform speed change, the distance for the driver to resume driving after the vehicle completes the lane-changing: L23
L 23 = v 3 3.6 t 3
where L23 = the distance for the driver to resume driving after the vehicle completes the lane-changing (m);
v 3 = the average speed of vehicles in weaving section (km/h);
t 3 = the driver’s response time (s); according to AASHTO (American Association of State Highway and Transportation Officials), the response time of safe stopping sight distance is 2.5 s.
Substituting data: L 23 = 25.51   m
(3)
Length of the Queuing Section: L3
The queuing in the connecting section of on-ramp can be considered as a single channel queuing service (M/M/1) system.
Therefore, the queue length L3 is:
L 3 = N × l + d = ρ 2 1 ρ l + d = λ μ 2 1 λ μ l + d  
where L3 = the length of queuing section (m);
λ = the average arrival rate of vehicles (pcu/h);
μ = the service rate of vehicles entering expressway ramp (pcu/h);
l = the average length of each vehicle (m);
d = the reasonable clearance between vehicles (m).
Substituting data: L 3 = 102.61   m .
(4)
Length of on Ramp Connecting Section: L
L = L 1 + L 21 + L 22 + L 23 + L 3 = v 1 3.6 2 v 2 3.6 2 2 a + v 3 3.6 t w + v 3 3.6 t 2 + v 3 3.6 t 3 + λ μ 2 1 λ μ l + d  
where v 1 = the speed at which the vehicle first enters the merging section (km/h);
v 2 = the speed at which the vehicle leaves the merging section (km/h);
v 3 = the average speed of vehicles in weaving section (km/h);
a = according to the analysis of the previous traffic survey data, the acceleration of vehicles at the confluence section is fixed at 1 m/s2;
t w = the average waiting time for a vehicle to find an insertable gap (s);
t 2 = the traverse time (s), generally equal to 4.0 s;
t 3 = the driver’s response time (s); according to AASHTO, the response time of safe stopping sight distance is 2.5 s;
λ = the average arrival rate of vehicles (pcu/h);
μ = the service rate of vehicles entering expressway ramp (pcu/h);
l = the average length of each vehicle (m);
d = the reasonable clearance between vehicles (m).
Then, the model calculation length of the connecting section is   L = 225   m .

3.2.2. Calculation Model of the Length of Connecting Section between the Off-Ramp and Intersection

(1)
Length of the Merging Section: L1
The movement law of the vehicle at the connecting section of the off-ramp is similar to that of the on-ramp, so the following is obtained:
L 1 = v 1 3.6 2 v 2 3.6 2 2 a
where L1 = the length of the merging section (m);
v 1 = the speed at which the vehicle first enters the merging section (km/h);
v 2 = the speed at which the vehicle leaves the merging section (km/h);
a = according to the analysis of the previous traffic survey data, the acceleration of vehicles at the confluence section is fixed at 1 m/s2.
Substituting data: L 1 = 5.79   m .
(2)
Length of the Weaving Section: L2
L 2 = L 21 + L 22 + L 23 = v 3 3.6 t w + v 3 3.6 t 2 + v 3 3.6 t 3
where L2 = the length of the weaving section (m);
L21 = the distance for the vehicle to find the insertable gap (m);
L22 = the distance that a vehicle moves forward when changing lanes (m);
L23 = the distance for the driver to resume driving after the vehicle completes the lane-changing (m);
v 3 = the average speed of vehicles in weaving section (km/h);
t w = the average waiting time for a vehicle to find an insertable gap (s);
t 2 = the traverse time (s), generally equal to 4.0 s;
t 3 = the driver’s response time (s); according to AASHTO, the response time of safe stopping sight distance is 2.5 s.
Substituting data: L 2 = 54.56   m .
(3)
Length of the Queuing Section: L3
In this paper, the waiting length in the queuing section of the connecting section of the off-ramp was caused by the control of the intersection signal lights, so the wave in the traffic flow considered was to the wave generated by the stoppingAs shown in Figure 6, on the left side of the vertical limit S, the traffic density of vehicles on the road was η 1 , so we obtained the wave velocity of the wave generated by stopping:
v w = v f η 1
where v w = the wave velocity (km/h);
v f = the average speed when the vehicle density tends to zero and the vehicle can travel freely (km/h);
η1 = the normalized density to the left of limit S.
The above Equation (14) shows that the wave generated by stopping propagates backward at a speed of v f η 1 . If the signal light turns red at x = x0, then after t seconds, a train of vehicles with a length of v f η 1 will stop after x0.
The vehicle delay was calculated by the Webster model. In the early stage, Webster used the combination of numerical simulation and theoretical research to establish a calculation model that can calculate the vehicle delay time at each entrance of fixed signal timing cycle intersection [29].
The average delay calculation formula of each vehicle in each lane is as follows:
t 4 = C 1 λ 2 2 1 λ x + x 2 2 q 1 x   0.65 C q 2 1 / 3 x 2 + 5 λ  
where t 4 = the delay time (s);
C = the total signal cycle time (s);
λ = the green signal ratio of this phase;
x = the saturation;
q = the traffic flow rate (pcu/s).
Therefore, the queuing length of the connecting section of off-ramp was obtained as follows:
L 3 = v w t 4 = v f η 1 3.6 t 4
where L3 = the length of queue segment (m);
v f = the average speed when the vehicle density tends to zero and the vehicle can travel freely (km/h);
η 1 = the normalized density to the left of limit S;
t 4 = the average delay per vehicle (s).
Substituting data: L 3 = 168.68   m .
(4)
Length of connecting section of off-ramp: L
L = L 1 + L 21 + L 22 + L 23 + L 3 = v 1 3.6 2 v 2 3.6 2 2 a + v 3 3.6 t w + v 3 3.6 t 2 + v 3 3.6 t 3 + v f η 1 3.6 t 4
where v 1 = the speed at which the vehicle first enters the merging section (km/h);
v 2 = the speed at which the vehicle leaves the merging section (km/h);
v 3 = the average speed of vehicles in the weaving section (km/h);
a = according to the analysis of the previous traffic survey data, the acceleration of vehicles at the confluence section is fixed at 1 m/s2.
v f = the average speed when the vehicle density tends to zero and the vehicle can travel freely (km/h);
t w = the average waiting time for a vehicle to find an insertable gap (s);
t 2 = the traverse time (s), generally equal to 4.0 s;
t 3 = the driver’s response time (s); according to AASHTO, the response time of safe stopping sight distance is 2.5 s;
t 4 = the average delay per vehicle (s);
η 1 = the normalized density to the left of limit S.
Then, the calculated length of the connecting section model of the off ramp is L = 230   m .

3.3. Traffic Simulation Based on VISSIM

3.3.1. Traffic Simulation under the Calculated Length of On-Ramp Connecting Section

We selected the connecting section near the intersection of Xiongchu Avenue viaduct and Guanggu Avenue, set the data according to the above survey results, established a simulation model and carried out a VISSIM simulation for the connecting section of on-ramp according to the current 196 m length and the calculated 225 m length, with the simulation step of 600 s.
The output indices of VISSIM mainly include travel time, delay time and queue length. The distance of travel time reference is 350 m. The comparison data of the simulation results are shown in Figure 7.
From the simulation results, it can be seen that the total travel time of 350 m distance of the west entrance where the on-ramp is located is reduced by 142.9 s/simulation step; the average delay is reduced by 123.2 s/simulation step; the average number of stops per vehicle is reduced by 1.3 times/simulation step; and the queue length of the west entrance is reduced by 34.3 m/simulation step. Generally speaking, the traffic condition under the calculation length is much smoother than the current situation, and the queue length is significantly shortened.

3.3.2. Traffic Simulation under Calculated Length of Off-Ramp Connecting Section

We selected the connecting section near the intersection of Xiongchu Avenue viaduct and Minzu Avenue, set the data according to the above survey results, established a simulation model and conducted a VISSIM simulation for the connecting section of off-ramp according to the model of current length and calculated length, with the simulation step of 600 s.
The output indices of VISSIM mainly include travel time, delay time and queue length. The distance of travel time reference is 350 m. The comparison data of the simulation results are shown in Figure 8.
From the comparison of the model simulation results of the current length and the calculated length of the off-ramp connecting section, it can be seen that the total travel time of the west entrance where the off-ramp is located is reduced by 126.54 s/simulation step; the average delay is reduced by 128.77 s/simulation step; the average number of stops per vehicle is reduced by 3.3 times/simulation step; and the queue length of the west entrance is reduced by 89.73 m/simulation step. Generally speaking, the traffic conditions under the calculation length is much smoother than the current situation, and the queue length is significantly shortened.

4. Conclusions

In view of the disadvantages of the current design of the length of the connecting section between the ramp of the expressway and the grade intersection, which causes serious traffic congestion, this paper studied the distance between the ramp of the expressway and the grade intersection by combining the field traffic survey and the existing theoretical knowledge; the conclusions are as follows:
  • The connecting section is divided into the merging section, the weaving section and the queuing section, and the traffic operation characteristics of each section were analyzed. The traffic operation characteristics of the merging section are the same as that of the basic section. The vehicles in the merging section are basically decelerating in the case of traffic congestion, and the approximate acceleration value is 1 m/s2 according to the actual investigation. The traffic operation characteristics of the weaving section mainly include the car-following characteristics and lane-changing characteristics, and the lane-changing behavior of the weaving section is mostly mandatory. The queuing of the on-ramp connecting section is caused by too many vehicles entering the ramp, which can be considered as a single channel queuing service (M/M/1) system. The queuing section of the off-ramp connecting section refers to the vehicle queuing caused by the influence of intersection signal lights or traffic congestion.
  • Based on the traffic survey results of the connecting section near the intersection of the Xiongchu Avenue viaduct and Guanggu Avenue and that near the intersection of the Xiongchu Avenue viaduct and Minzu Avenue, it can be seen that under the current length of the connecting section, the traffic flow is large in the morning rush hours, which cannot pass smoothly under the control of the signal lights, resulting in queuing and congestion.
  • The calculation model of the length of connecting section between the ramp and grade intersection is established. Based on lane-changing theory, acceptable gap theory and queuing theory, the length calculation model of the connecting section between the on-ramp and grade intersection was established; based on lane-changing theory, acceptable gap theory, wave in traffic and the Webster vehicle delay model, the length calculation model of connecting section between the off-ramp and grade intersection was established.
  • Combined with the practical cases, VISSIM was used to simulate the traffic flow in the connecting section. The simulation results show that the travel time, delay time and queue length of vehicles in the connecting section are significantly reduced under the calculation length of the model, and the overall traffic operation state is greatly improved, which verifies the rationality of the calculation model of the connecting section length.

Author Contributions

Conceptualization, F.W.; methodology, F.W., D.G. and A.C.; software, D.G.; data curation, F.W. and D.G.; writing—original draft preparation, F.W. and D.G.; writing—review and editing, F.W. and A.C.; visualization, D.G.; supervision, F.W. All authors have read and agreed to the published version of the manuscript.

Funding

This research was funded by the Hebei Provincial Department of Transportation, China (No. (2018) 409# 201816).

Data Availability Statement

If necessary, the data covered in this article are available from the corresponding author.

Conflicts of Interest

The authors declare no conflict of interest.

References

  1. Wang, X. A view of Beijing’s traffic policy: Evaluation on the policies released in 2010 to ease traffic congestion. Macrosc. Manag. Public Policy 2021, 3, 8. [Google Scholar] [CrossRef]
  2. Qiu, Y.; Zhang, Y.; Cai, L.; Zhu, W. Traffic Analysis and Improvement Measures of On-Ramp Joints of Elevated Expressways. In Proceedings of the 2014 International Conference of Logistics Engineering and Management, Shenyang, China, 24–26 May 2014. [Google Scholar]
  3. Hao, Y.; Sun, L.; Xu, T.; Du, Y. Analysis of traffic congestion on urban expressway and congestion threshold identification. J. Tongji Univ. Nat. Sci. 2008, 5, 36. [Google Scholar]
  4. Chandle, C.; Dongwoo, J.; Youngho, K. Estimation of Lane Utilization Adjustment Factors for Signalized Intersections Adjacent to an Off-ramp-Street Junction. J. Korean Soc. Transp. 2013, 31, 71–78. [Google Scholar]
  5. Lim, K.; Kim, J.H.; Shin, E.; Kim, D.G. A signal control model integrating arterial intersections and freeway off-ramps. KSCE J. Civ. Eng. 2011, 15, 385–394. [Google Scholar] [CrossRef]
  6. Wen, X. An Agent-Based Simulation Model for Optimization of the Signalized Intersection Connected to Freeway On-Ramp. arXiv 2018, arXiv:1801.07583. [Google Scholar]
  7. Liu, S.; Li, Y.; Qiu, Y.; Zhang, B.; Liu, X. Signal Timing Optimization Algorithm for an Intersection Connected with an Urban Expressway. Arab. J. Sci. Eng. 2020, 45, 8667–8684. [Google Scholar] [CrossRef]
  8. Yun, M.; Zhao, J.; Zhao, J.; Weng, X.; Yang, X. Impact of in-vehicle navigation information on lane-change behavior in urban expressway diverge segments. Accid. Anal. Prev. 2017, 106, 53–66. [Google Scholar] [CrossRef]
  9. Chen, X.; Qi, Y.; Li, D.; Wang, Y. Dual right-turn lanes in mitigating weaving conflicts at frontage road intersections in proximity to off-ramps. Transp. Plan. Technol. 2014, 37, 307–319. [Google Scholar]
  10. Papageorgiou, M.; Hadj-Salem, H.; Middelham, F. Alinea Local Ramp Metering: Summary of Field Results. Transp. Res. Rec. 1997, 1603, 90–98. [Google Scholar] [CrossRef]
  11. Hadj-Salem, H.; Blosseville, J.M.; Papageorgiou, M. ALINEA: A local feedback control law for on-ramp metering; a real-life study. In Proceedings of the Third International Conference on Road Traffic Control, London, UK, 22–24 March 1994. [Google Scholar]
  12. Williams, K.M.J.T.N. Access Management Manual: TRB Committee Documents the State of the Art. 2003, pp. 39–40. Available online: https://onlinepubs.trb.org/onlinepubs/trnews/trnews228_p39-40.pdf (accessed on 4 January 2022).
  13. Zhao, J.; Ma, W.; Xu, H. Increasing the Capacity of the Intersection Downstream of the Freeway Off-Ramp Using Presignals. Comput.-Aided Civ. Infrastruct. Eng. 2017, 32, 674–690. [Google Scholar] [CrossRef]
  14. Bogenberger, K.; Keller, H.; Vukanovic, S. A neuro-fuzzy algorithm for coordinated traffic responsive ramp metering. In Proceedings of the Intelligent Transportation Systems, Singapore, 6 September 2002. [Google Scholar]
  15. Qu, Z.W.; Cao, N.B.; Chen, Y.H.; Bai, Q. Capacity model of on-ramp merging section of urban expressway. J. Southeast Univ. 2016, 32, 226–232. [Google Scholar] [CrossRef]
  16. Ma, M.; Yang, Q.; Liang, S.; Wang, Y.; Cordero, A. A New Coordinated Control Method on the Intersection of Traffic Region. Discret. Dyn. Nat. Soc. 2016, 2016, 5985840. [Google Scholar] [CrossRef] [Green Version]
  17. Mingzheng, S.; Xiaoguang, Y.; Zhang, Y. The Traffic Design of Urban Intersection Connected with the Ramp. J. Highw. Transp. Res. Dev. 2003, 20, 95–99. [Google Scholar]
  18. Yang, G.; Tian, Z.; Xu, H.; Wang, Z.; Wang, D. Impacts of traffic flow arrival pattern on the necessary queue storage space at metered on-ramps. Transp. A: Transp. Sci. 2018, 14, 543–561. [Google Scholar] [CrossRef]
  19. Greguri, M.; Manduka, S.; Vidovi, K. Advanced Applications for Urban Motorway Traffic Control. In International Conference “New Technologies, Development and Applications”; Springer: Cham, Switzerland, 2019; pp. 395–400. [Google Scholar]
  20. Sun, S.; An, X.; Zhao, J.; Li, P.; Shao, H. Modeling and Simulation of Lane-Changing Management Strategies at On-Ramp and Off-Ramp Pair Areas Based on Cellular Automaton. IEEE Access 2021, 9, 35034–35044. [Google Scholar] [CrossRef]
  21. Wang, X.; Ding, Z.; Guo, K.; Lin, Y. A Simulation-Based Comprehensive Analysis for Traffic Efficiency and Spatial Distribution of Risks in Short Weaving Area of Municipal Interchange. J. Adv. Transp. 2021, 2021, 9968426. [Google Scholar] [CrossRef]
  22. Liao, Y.; Yang, Y.; Ding, Z.; Tong, K.; Zeng, Y. Risk Distribution Characteristics and Optimization of Short Weaving Area for Complex Municipal Interchanges. J. Adv. Transp. 2021, 2021, 5573335. [Google Scholar] [CrossRef]
  23. Su, D.; Lu, X.Y.; Horowitz, R.; Wang, Z. Coordinated Ramp Metering and Intersection Signal Control. Int. J. Transp. Sci. Technol. 2014, 3, 179. [Google Scholar] [CrossRef] [Green Version]
  24. El-Tantawy, S.; Rezaee, K.; Abdulhai, B. Closed Loop Optimal Adaptive Traffic Signal and Ramp Control: A Case Study on Downtown Toronto. In Proceedings of the IEEE International Conference on Intelligent Transportation Systems, Washington, DC, USA, 15–18 September 2015. [Google Scholar]
  25. Jianmin, X.U.; Zou, X.; Yingying, M.A. Cooperative Control Method of Freeway Off-Ramp Intersection and Downstream Intersection under Congestion Conditions. J. Chongqing Jiaotong Univ. Nat. Sci. 2019, 38, 4. [Google Scholar]
  26. Dhivyabharathi, B.; Fulari, S.; Amrutsamanvar, R.; Vanajakshi, L.; Panda, M. Performance Comparison of Filtering Techniques for Real Time Traffic Density Estimation under Indian Urban Traffic Scenario. In Proceedings of the IEEE International Conference on Intelligent Transportation Systems, Las Palmas de Gran Canaria, Spain, 15–18 September 2015. [Google Scholar]
  27. Zheng, B. Recent developments and research needs in modeling lane changing. Transp. Res. Part B Methodol. 2014, 60, 16–32. [Google Scholar] [CrossRef] [Green Version]
  28. Verhaegh, J.; Ploeg, J.; Nunen, E.V.; Teerhuis, A. Integrated trajectory control and collision avoidance for automated driving. In Proceedings of the IEEE International Conference on Models & Technologies for Intelligent Transportation Systems, Naples, Italy, 26–28 June 2017. [Google Scholar]
  29. Hu, X.; Sun, J. Trajectory optimization of connected and autonomous vehicles at a multilane freeway merging area. Transp. Res. Part C Emerg. Technol. 2019, 101, 111–125. [Google Scholar] [CrossRef]
Figure 1. Satellite photos and functional area division of ramp: (a) The connecting section near the intersection of Xiongchu Avenue viaduct and Guanggu Avenue; (b) The connecting section near the intersection of Xiongchu Avenue viaduct and Minzu Avenue.
Sustainability 14 00629 g001aSustainability 14 00629 g001b
Figure 2. Composition diagram of connecting section between the on-ramp and intersection.
Sustainability 14 00629 g002
Figure 3. Layout types and vehicle weaving of on-ramp grounding points.
Sustainability 14 00629 g003
Figure 4. Composition diagram of connecting section between off-ramp and intersection.
Sustainability 14 00629 g004
Figure 5. Layout types and vehicle weaving of off-ramp grounding points.
Sustainability 14 00629 g005
Figure 6. Waves generated by stopping.
Sustainability 14 00629 g006
Figure 7. The simulation results: (a) Travel time comparison; (b) Delay time comparison; (c) Queue length comparison.
Sustainability 14 00629 g007aSustainability 14 00629 g007b
Figure 8. The simulation results: (a) Travel time comparison; (b) Delay time comparison; (c) Queue length comparison.
Sustainability 14 00629 g008aSustainability 14 00629 g008b
Table 1. Traffic management and control at the intersection of Xiongchu Avenue and Guanggu Avenue.
Phase NumberPhase ConditionGreen Time(s) Yellow Time(s)
The first phase Sustainability 14 00629 i001353
The second phase Sustainability 14 00629 i002303
The third phase Sustainability 14 00629 i003303
The fourth phase Sustainability 14 00629 i004303
Table 2. Traffic management and control at the intersection of Xiongchu Avenue and Minzu Avenue.
Phase NumberPhase ConditionGreen Time(s) Yellow Time(s)
The first phase Sustainability 14 00629 i005483
The second phase Sustainability 14 00629 i006383
The third phase Sustainability 14 00629 i007353
The fourth phase Sustainability 14 00629 i008483
Table 3. Average speed of vehicles at different points of the connecting section.
PointThe Speed at Which the Vehicle First Enters the Merging Section v 1 The Speed at Which the Vehicle Leaves the Merging Section v 2 The Average Speed of Vehicles in Weaving Section v 3
Speed (km/h)38.6222.2136.73
Table 4. Traffic flow data.
TimeEast Entrance
(pcu)
South Entrance
(pcu)
West Entrance
(pcu)
North Entrance
(pcu)
On Ramp
(pcu)
LSRLSRLSRLSR
7:00~7:15588415779255101326692215452190
7:15~7:3015681245610143118390523517243185
7:30~7:4512713619619946140315635817850197
7:45~8:00135127365512362158360833916364191
8:00~8:15132129187611055119356476523859189
8:15~8:301791312564906182373366125062164
8:30~8:4513215223597447111396373720343170
8:45~9:0010499258111442101322467223339166
Summary1023939405529803411930283843338915914121452
where L = Left; S = Straight; R = right; pcu = passenger car unit.
Table 5. Average speed of vehicles at different points of the connecting section.
PointThe Speed at Which the Vehicle First Enters the Merging Section v 1 The Speed at Which the Vehicle Leaves the Merging Section v 2 The Average Speed of Vehicles in Weaving Section v 3
Speed (km/h)25.2522.0824.07
Table 6. Traffic flow data.
TimeEast Entrance
(pcu)
South Entrance
(pcu)
West Entrance
(pcu)
North Entrance
(pcu)
LSRLSRLSRLSR
7:00~7:1576123397514369110140753217562
7:15~7:308815854638634138155966216479
7:30~7:457618447102140489312816596157107
7:45~8:0075227649315375801441535712078
8:00~8:1564162386091431201211239817281
8:15~8:3075184499611987701311467716866
8:30~8:4566133301211358310018012454141102
8:45~9:0073138326413043941121276011767
Summary5931309353674997482805111110095361214642
where L = Left; S = Straight; R = right; pcu = passenger car unit.
Publisher’s Note: MDPI stays neutral with regard to jurisdictional claims in published maps and institutional affiliations.

