Article

Enhanced CO Gas Sensing with DFT Optimized PbS Loading on ZnO and CrZnO Nanocomposites

by
Nur Sadrina Brahim
1,
Roshan Thotagamuge
1,2,*,
Muhammad Raziq Rahimi Kooh
1,
Chee Ming Lim
1,
Mohammad Ammar Syaahiran
1,
Anwar Usman
3,
Nurulizzatul Ningsheh M. Shahri
3,
Yuan-Fong Chou Chau
1,
Chung-Ting Chou Chao
4,
Hai-Pang Chiang
4 and
Abdul Hanif Mahadi
1,*
1
Centre for Advanced Material and Energy Sciences, Universiti Brunei Darussalam, Jalan Tungku Link, Gadong BE1410, Brunei
2
Department of Nano Science Technology, Faculty of Technology, Wayamba University of Sri Lanka, Kuliyapitiya 60200, Sri Lanka
3
Faculty of Science, Universiti Brunei Darussalam, Jalan Tungku Link, Gadong BE1410, Brunei
4
Department of Optoelectronics and Materials Technology, National Taiwan Ocean University, Keelung 20224, Taiwan
*
Authors to whom correspondence should be addressed.
Sustainability 2022, 14(21), 13978; https://doi.org/10.3390/su142113978
Submission received: 24 September 2022 / Revised: 18 October 2022 / Accepted: 22 October 2022 / Published: 27 October 2022
(This article belongs to the Section Air, Climate Change and Sustainability)

Abstract

:

Highlights

What are the main findings?
  • A DFT theoretical approach was performed prior to experimental work.
  • Nanofilm gas sensors were fabricated using synthesized nanocomposites and calcined at 400 °C.
What is the implication of the main finding?
  • ZnO, CrZnO, PbS-loaded ZnO, and CrZnO were synthesized using a sol–gel method.
  • Theoretical DFT band gap data supports the obtained experimental values.
  • Sensitivity and response-recovery times of fabricated gas sensors were analyzed for use with CO gas.

Abstract

Carbon monoxide (CO) is a poisonous gas that is harmful at a certain dose, and monitoring of this gas is essential in some industries. ZnO, CrZnO, and their PbS-loaded nanocomposites were synthesized using a sol–gel method and were used for the fabrication of CO gas sensors. The synthesized materials were characterized using DFT, XRD, SEM, UV–Vis, and BET analyses. DFT calculation was carried out to obtain useful insights into the nanocomposites’ properties such as energy band gap, chemical hardness, total adsorption energy, etc., which were then compared with experimental data. PbS-loaded ZnO and CrZnO nanocomposites at 1.5 wt% were tested for CO gas sensitivity at 300 °C for gas concentrations of 100, 200, and 300 ppmv. The gas sensing analyses showed that PbS-CrZnO had better sensitivity at 300 ppmv when compared to the pure nanocomposite. Response-recovery times for the gas sensors were also calculated and showed no significant differences. Both the theoretical and experimental data are in agreement that nanocomposites with lower band gap values exhibit an increase in electrical conductivity, indicating a better CO sensing performance. The mechanism may be due to the heterojunction effect, which improves electron transportation and prevents energy loss by suppressing charge-carrier recombination.

1. Introduction

Industrial workers constantly face health risks at work, one of which is exposure to toxic and harmful gases such as nitrogen dioxide, ammonia (NH3), hydrogen sulfide (H2S), methane (CH4), and carbon monoxide (CO) [1,2,3]. CO is an odorless and colorless gas that can lead to poisoning and explosions; it is a product of the incomplete combustion of organic materials and can be emitted from automobile exhausts and industrial sources [4,5]. When exposed to CO gas, hemoglobin in the body’s red blood cells binds with CO gas molecules, which prevents oxygen molecules from being transported to the body’s cells leading to oxygen deprivation [6,7]. The NIOSH recommended exposure limit for CO gas is 35 ppm or 40 mg/m3 for an 8-h time-weighted average and 1200 ppm for the immediately dangerous to life or health value [8]. Therefore, early detection of CO gas in trace amounts is crucial in preventing adverse effects [2].
One of the methods for detecting toxic and harmful gases is utilizing a gas sensor, which is preferred over other methods due to its fast response-recovery time, sensitivity, and repeatability [9]. An ideal gas sensor should have the best sensitivity to its target gas, which depends on the surface-to-volume ratio and the depletion layer width. A high specific surface area provides a large number of areas and channels that enhance interaction between the nanostructure and the test gas hence increasing sensitivity [10,11]. Meanwhile, the depletion layer width depends on the band gaps of the sensor material and the intrinsic nature of specific gases.
ZnO is an n-type semiconductor material, and this feature makes it suitable for detecting oxidizing and reducing gases [12,13]. ZnO gas sensors use different mechanisms to sense different types of gases. When ZnO is exposed to oxidizing gases, gas molecules interact directly with the chemisorbed oxygen species on its surface, which causes the adsorbates to become reduced. On the other hand, reducing gases interact with the adsorbed oxygen species on ZnO’s surface and cause a decrease in the sensor’s electrical resistance, as well as decreasing the width of the depletion layer width due to the transfer of free electrons from the oxygen species on the sensor to the conduction band [13,14,15]. Although the ZnO sensor has its apparent advantages, there are still existing limitations in terms of its high working temperature of 200–400 °C and wide band gap of 3.37 eV [16,17].
Compared to ZnO, lead sulfide (PbS) is not commonly used as a gas sensor material. The PbS nanoparticle is commonly used in IR detectors, Pb2+ ion-selective sensors, and phosphor materials for luminescent display devices [18,19,20]. Although PbS colloidal quantum dots showed a promising response as gas sensor material, PbS nanoparticles on their own showed a low response to test gases such as NH3, NO2, SO2, H2S, and NO [21,22]. There are also existing studies in which PbS sensors decorated with other materials, such as Ag, exhibited improved sensing performance compared to pure PbS nanoparticle sensors [23].
Changes in particle morphology affect surface reactivity and electrical properties [24,25]. For the detection of CO gas, it has been proven that Cr-doped ZnO sensors show a lower band gap than pure ZnO due to the increase of electrons in the conduction band, which leads to an increase in the conductivity of the sensor. Copper and cobalt doping has been shown to improve the sensitivity of ZnO sensors to hydrogen disulfide gas and ammonia gas, respectively [13,25].
In order to study and optimize the chemical structure and reactivity of the research materials, density-functional theory (DFT) computations were performed to obtain the theoretical calculation data for the study. DFT is a type of electronic structure calculation that is implemented to calculate the electronic structure of atoms, molecules, and solids with an intention to understand the material properties of the fundamental laws of quantum mechanics [26,27,28]. The DFT simulation method is widely applied in materials science, and consequently for semiconducting materials, as it is frequently used to calculate the electronic structure of atoms, molecules, and solids which makes it possible to calculate the band gap difference of the starting materials after loading to fabricate the nanocomposites [28]. It utilizes theoretical and computational approaches to predict experimental results precisely. Therefore, the DFT simulation results can be corroborated or refuted with experimental data in this study.
This study aims to improve the sensitivity of ZnO and PbS nanocomposites for sensing CO gas. DFT calculations were performed to gain valuable insights, such as the band gap energies of the synthesized nanocomposites. The PbS-ZnO composite was synthesized by mixing it with varying amounts of ZnO and doping it with Cr. The nanocomposites were characterized using X-ray diffractometer (XRD), scanning electron microscopy (SEM), UV–Vis spectroscopy, and Brunauer–Emmett–Teller (BET) analyses. Sensor data such as sensitivity and response-recovery times were calculated. The experimental data were then compared with theoretical data obtained by DFT calculations.

2. Materials and Methods

2.1. Chemical Reagents

All chemical reagents used for the nanofilm synthesis were obtained from Merck. Zinc acetate dihydrate nanopowders (Zn(CH3COO)2∙2H2O), cetyltrimethylammonium bromide powder (CTAB), methanol solution, chromium nitrate nonahydrate (Cr(NO3)3∙9H2O), lead (II) nitrate (Pb(NO3)2), 3-mercaptopropionic acid (3-MPA), sodium sulfide nonahydrate (Na2S∙9H2O), and α-terpineol (C10H18O) were analytical grade and were used without any modifications prior to the synthesis process. The Au-IDE substrates (DRP-G-IDEAU10) were obtained from the Metrohm. Hydrogen peroxide (30%) and ammonia (25%) were used as cleaning agents for the Au-IDE substrate.

2.2. DFT Computational Methods

The geometry optimization and electronic structure calculations of this study were performed using the DFT framework. All DFT calculations were performed using the Gaussian 16 software package, and GaussView 06 was used for the molecular visualization [29,30]. Becke’s three-parameter of Lee-Yang-Parr (B3LYP) hybrid functional was considered for the exchange-correlation effects at the ground-state energy level [31,32]. It includes a net neutral charge and single spin multiplicity for structural optimization. All the atoms were assigned with LANL2DZ (Los Alamos National Laboratory 2 Double-Zeta) basis sets [33,34,
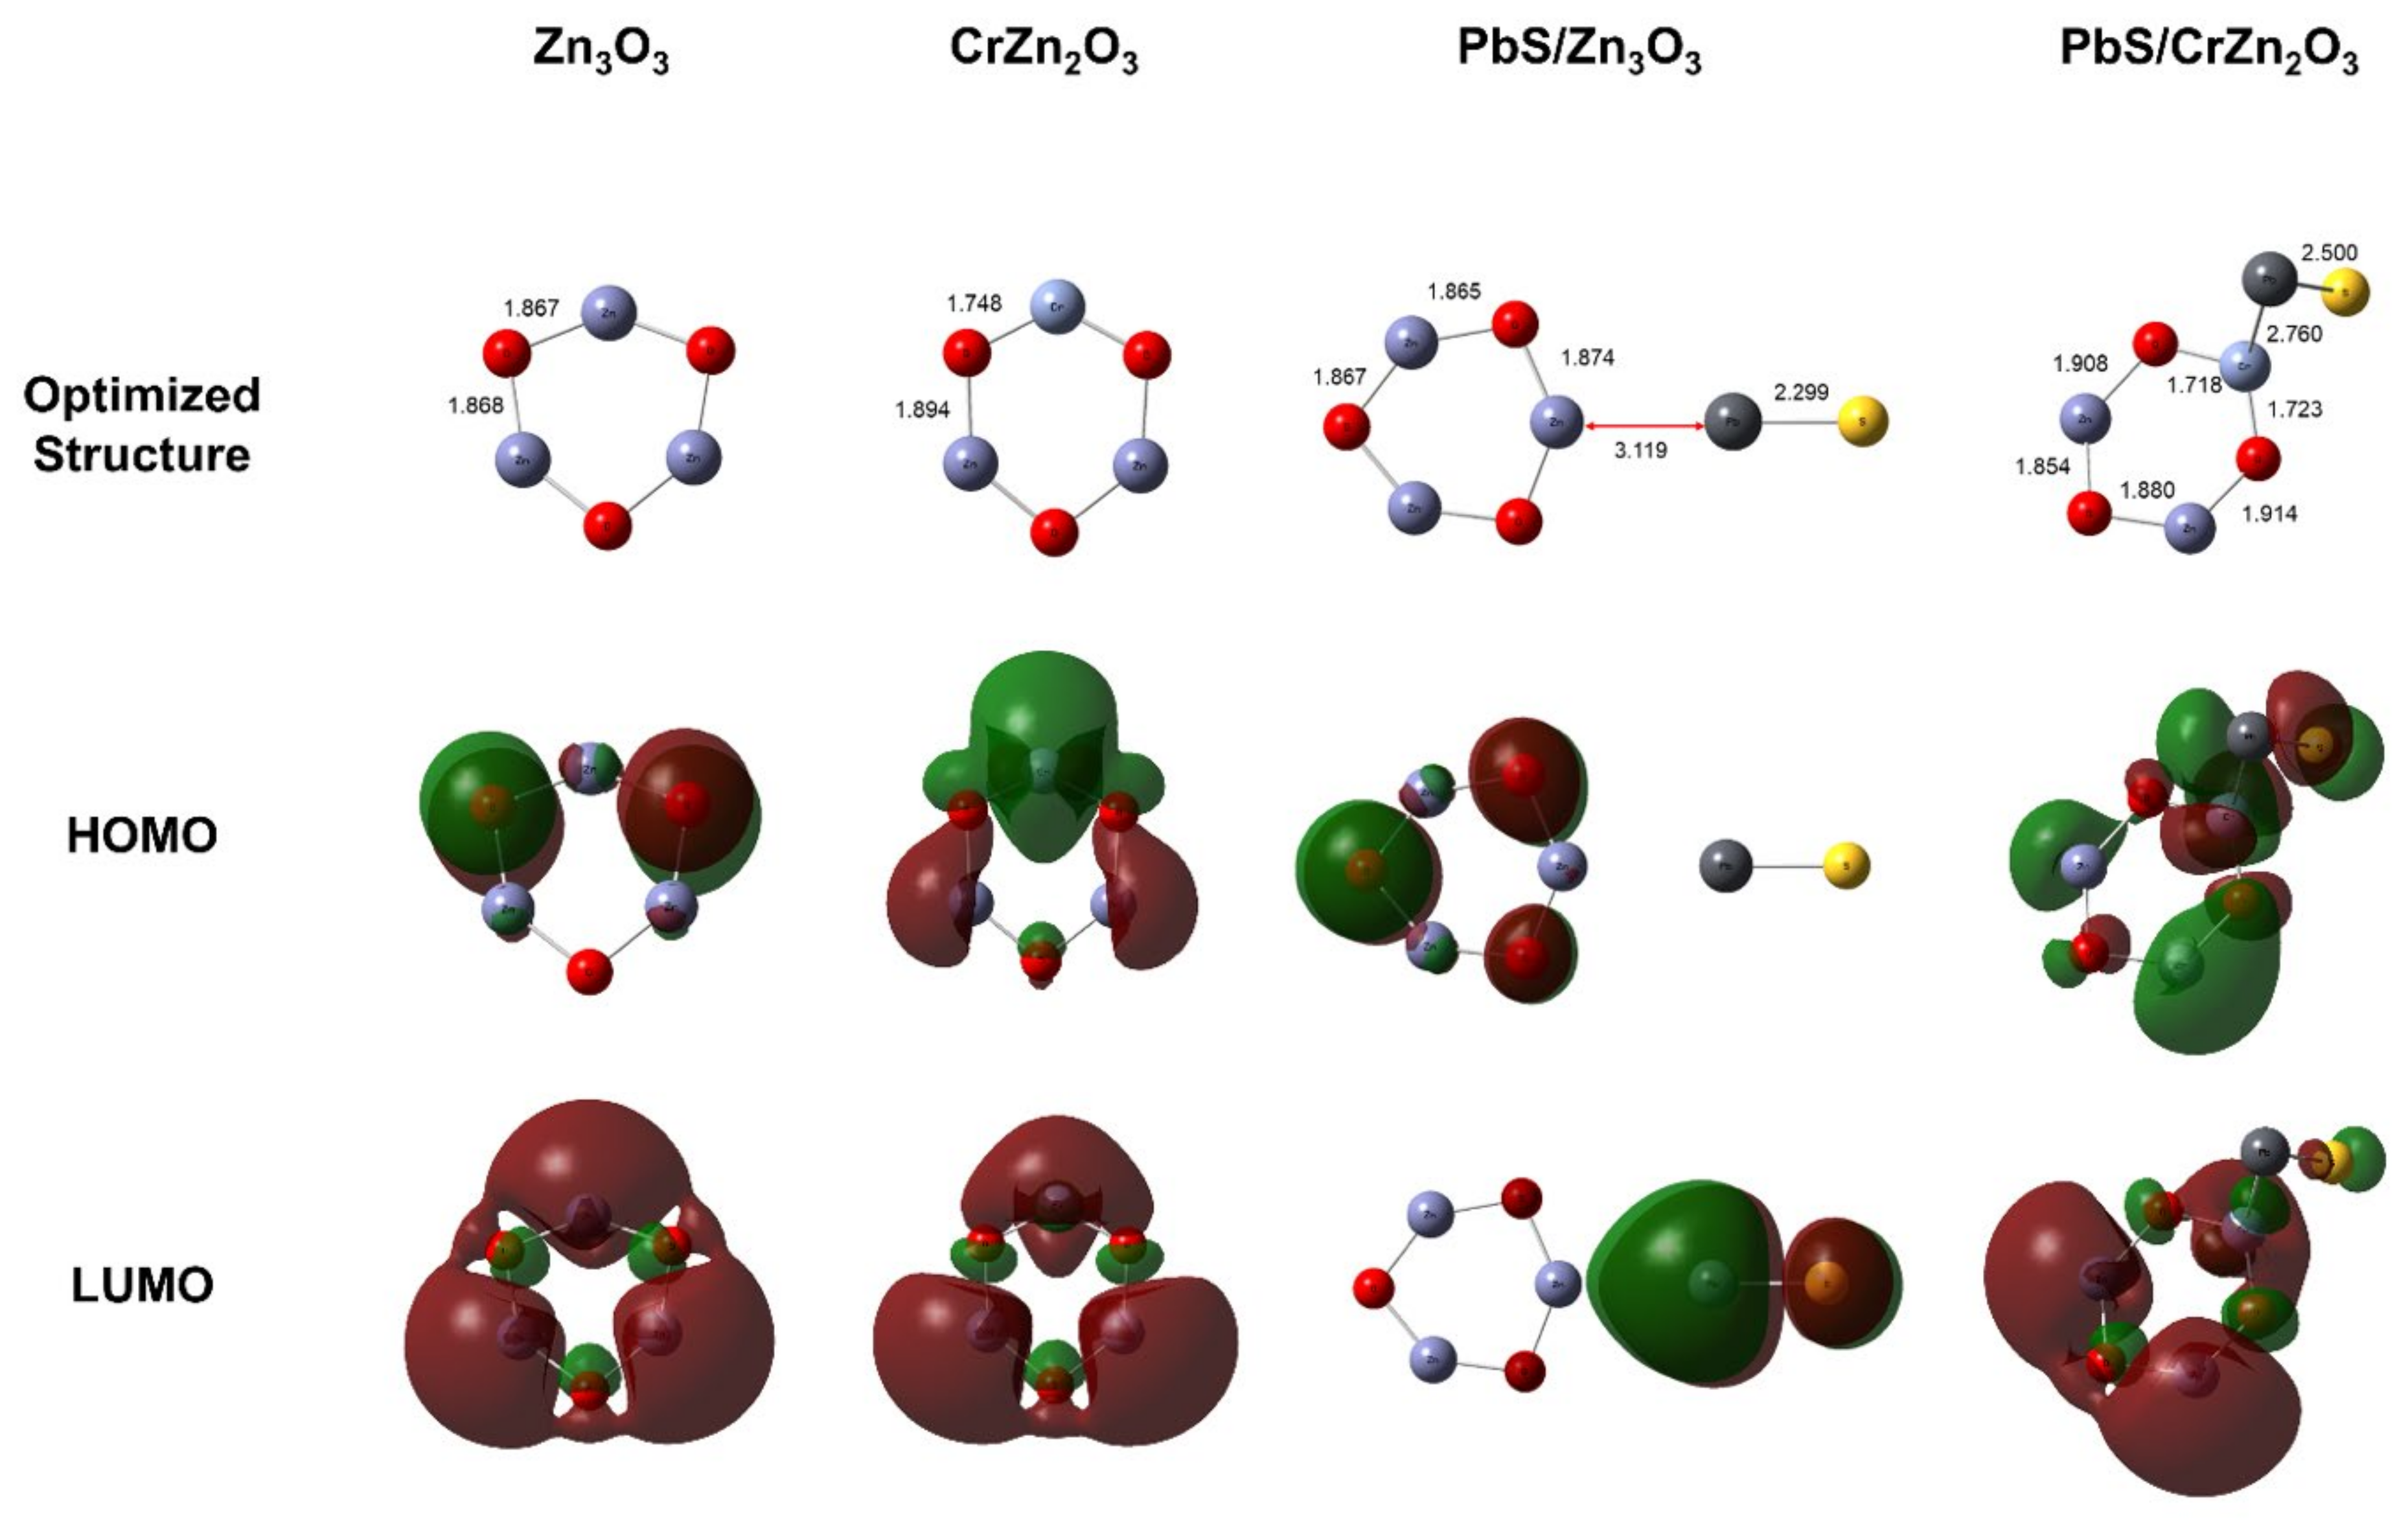
35]. The band gap with respect to the vacuum level was calculated through the difference between the highest occupied molecular orbital (HOMO) and the lower unoccupied molecular orbital (LUMO) represented as follows [36,37]:
E g = E LUMO E HOMO
where Eg, EHOMO, and ELUMO are the band gap, HOMO energy, and LUMO energy, respectively.
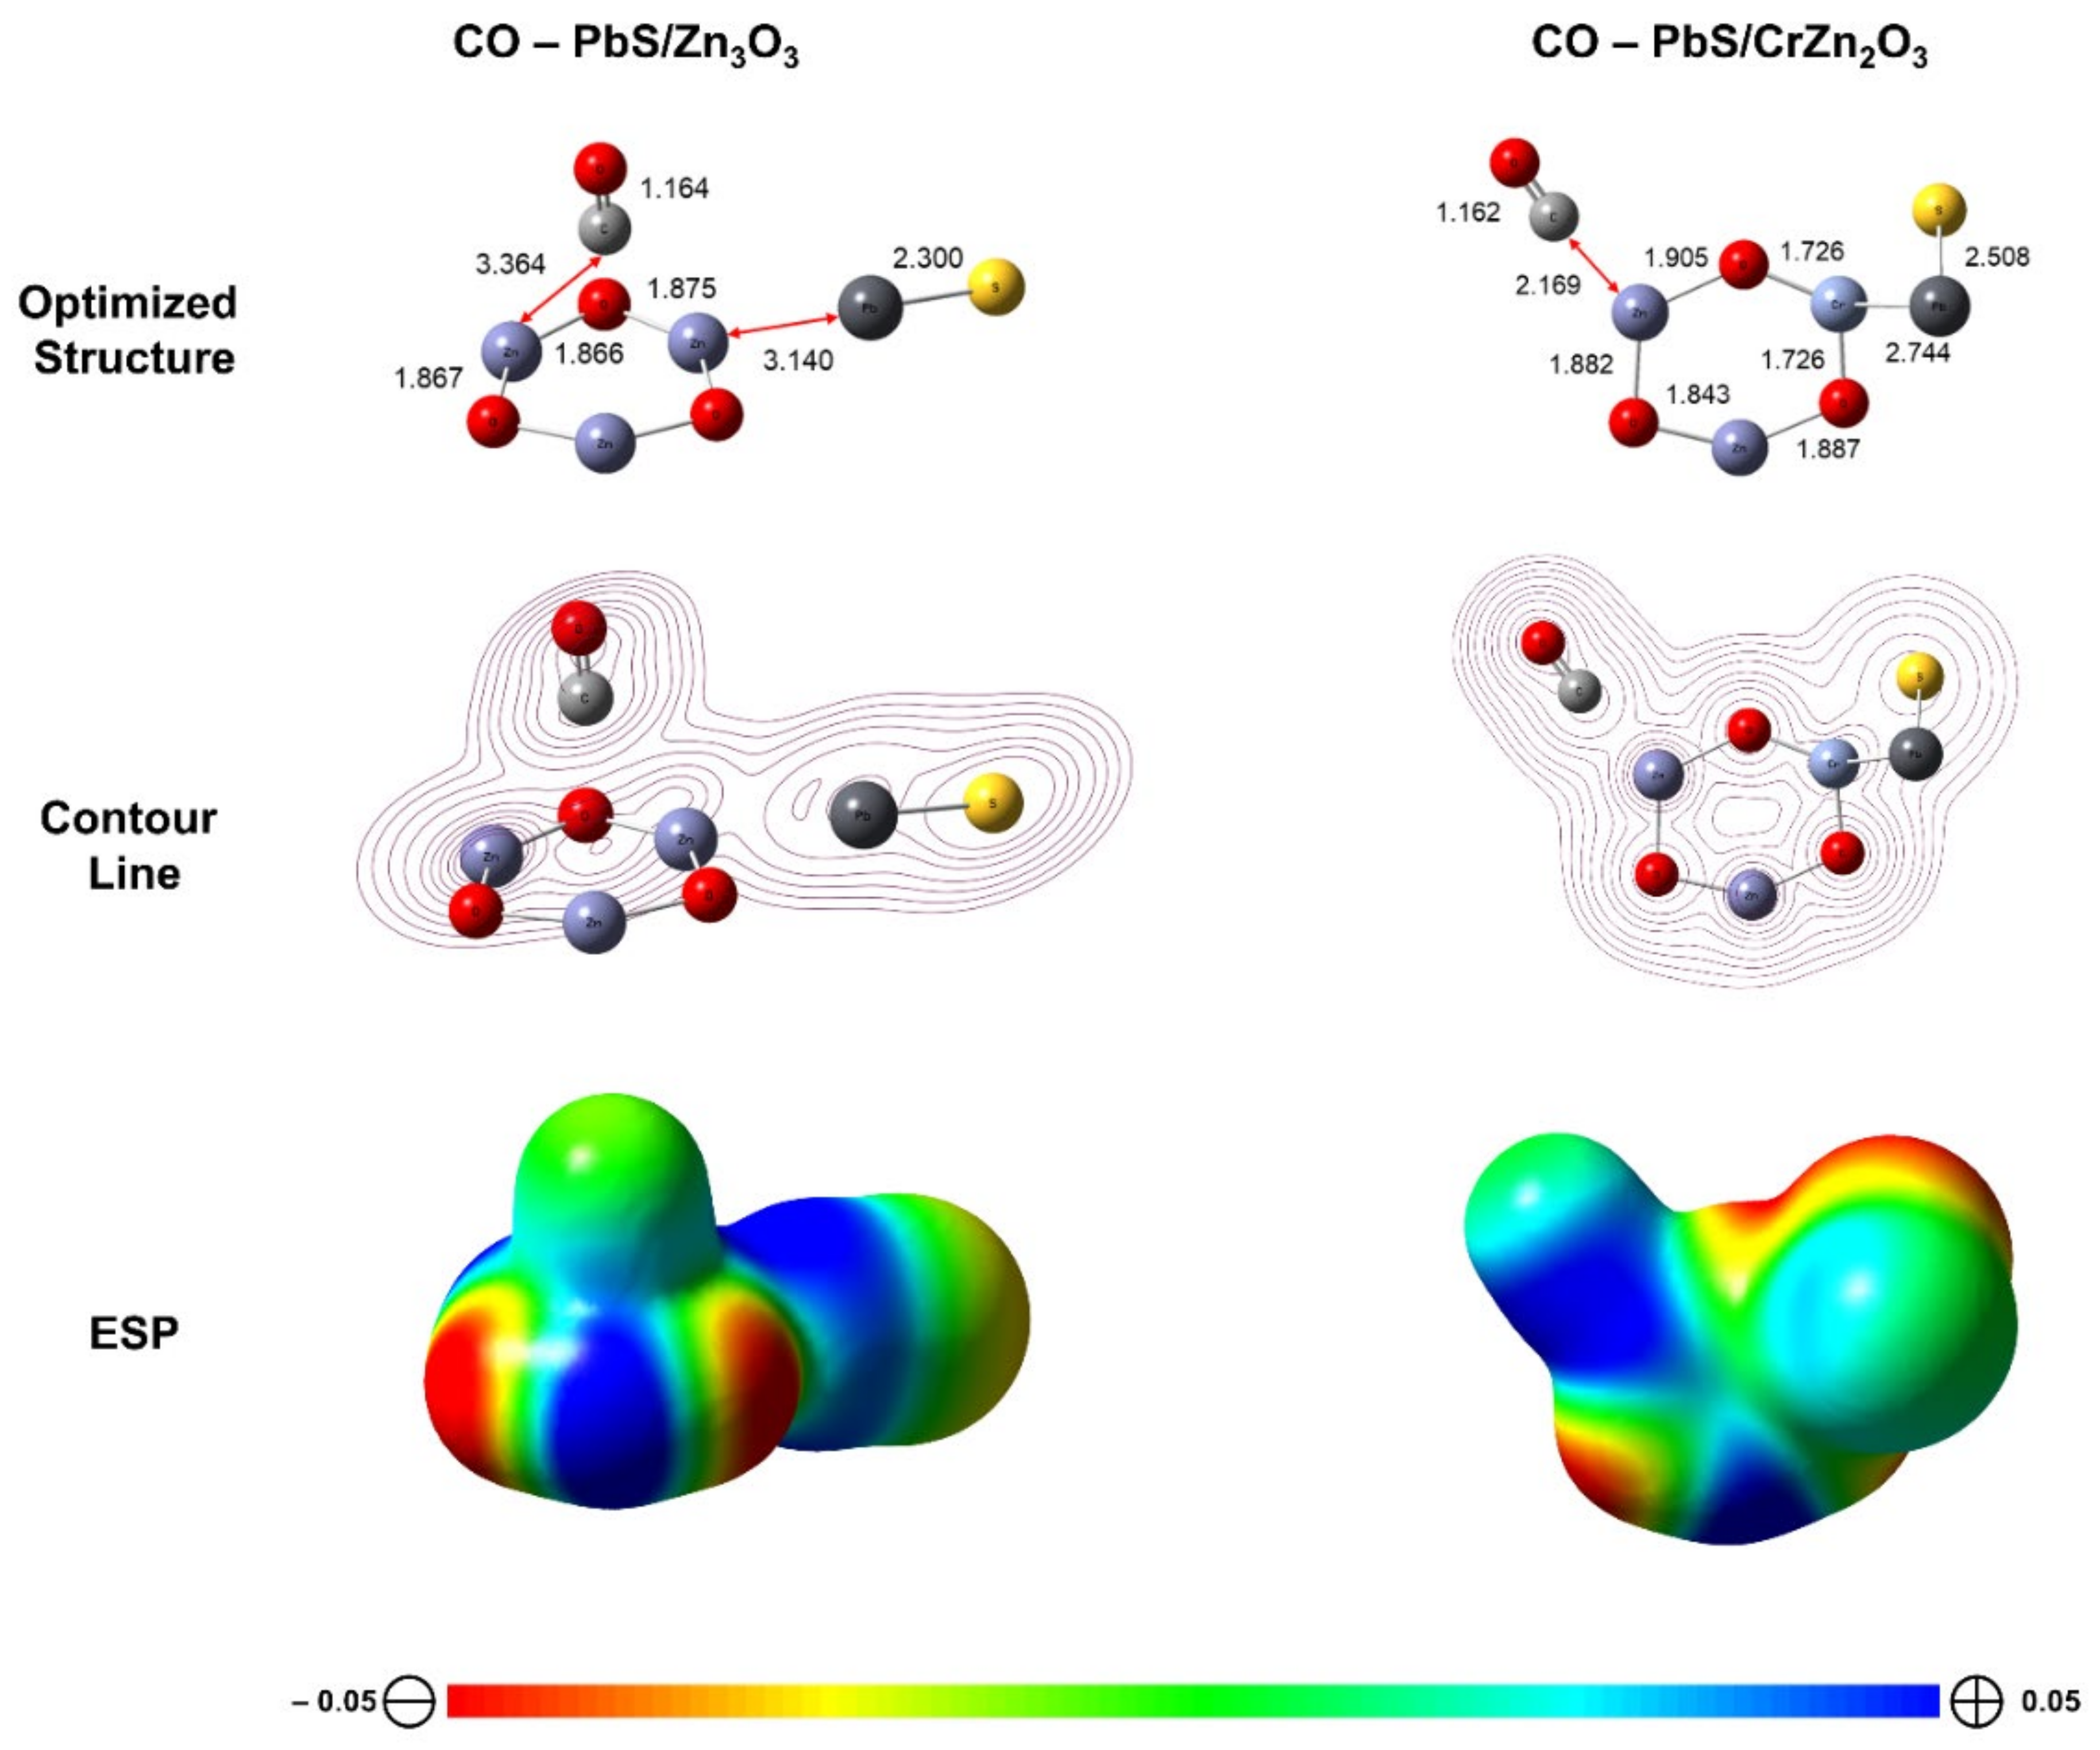
The adsorption energy (Eads) of CO molecules on the surface was calculated as follows [38]:
E ads = E CO surface E surface E CO
where Etotal (surface/gas), Etotal (surface), and Etotal (gas) are respect to the total energy of the surface with CO gas, isolated surface, and isolated gas. The reaction indicates exothermic as the Eads is negative.
The contour line and electrostatic potential (ESP) surfaces of CO adsorption upon the surfaces were conducted using the Cubegen utility within the Gaussian 16 package [29].

2.3. Synthesis of Pure ZnO and CrZnO Nanoparticles

Sol–gel synthesis was performed for the synthesis of pure and Cr-doped ZnO nanoparticles. Zinc acetate dihydrate (1.54 g) was dissolved in 1 mL 0.5 M CTAB solution and 14 mL methanol solution. The mixture was stirred at 60 °C for 2 h to obtain a clear alcosol. The pH of the solution was maintained at pH 6. The resulting alcosol was aged at room temperature for 48 h and then dried at 70 °C overnight to obtain a white powder. The white powder was centrifuged with a mixture of n-hexane (6 mL) and absolute ethanol (14 mL) solutions five times at 4000 rpm for 10 min to remove the impurities. The residual white powder was then dried in the oven at 100 °C for 24 h to obtain ZnO, which is also white in appearance. For Cr-doped ZnO, 0.5 wt% Cr(NO3)3∙9H2O was added to the zinc precursor and methanol mixture solution for the alcosol formation. For this study, only 0.5 wt% CrZnO was considered as it was found that specific weight percentage doping resulted in enhanced CO sensing performance in a previous study [39].

2.4. Synthesis of PbS Nanoparticles

The PbS nanoparticle was synthesized at room temperature. In a three-neck round-bottom flask, 100 mL of 0.1 M Pb(NO3)2 and 1.74 mL 3-MPA were mixed and subjected to constant stirring at room temperature under a nitrogen atmosphere. This was followed by dropwise addition of 100 mL of 0.1 M Na2S∙9H2O to the mixture with constant stirring for 6 h under a nitrogen atmosphere until the mixture turned black. The mixture was washed with a mixture of absolute ethanol (20 mL) and ultrapure water (30 mL) (Milli-Q® Ultrapure Water Systems, Milford, CT, USA) by centrifuging at 4000 rpm for 10 min. The resulting black powder was obtained after drying the reaction product overnight in the oven at 60 °C.

2.5. Synthesis of PbS-Loaded Pure ZnO and CrZnO Nanocomposite

Ex-situ synthesis of PbS-ZnO and PbS-CrZnO was performed using a suspension mixing method. Varying wt% of PbS were weighed to get 0.25, 0.5, 1.0, 1.5, 2.0, and 5 wt% ZnO and CrZnO nanocomposites. In this study, only the 1.5 wt% result is reported for each PbS-ZnO and PbS-CrZnO. These materials were then mixed in excess absolute ethanol solution at room temperature for 7–8 h under constant, vigorous stirring. The resulting suspension was precipitated by centrifuging at 4000 rpm for 10 min and then dried in the oven at 90 °C for 2 h.

2.6. Materials Characterization

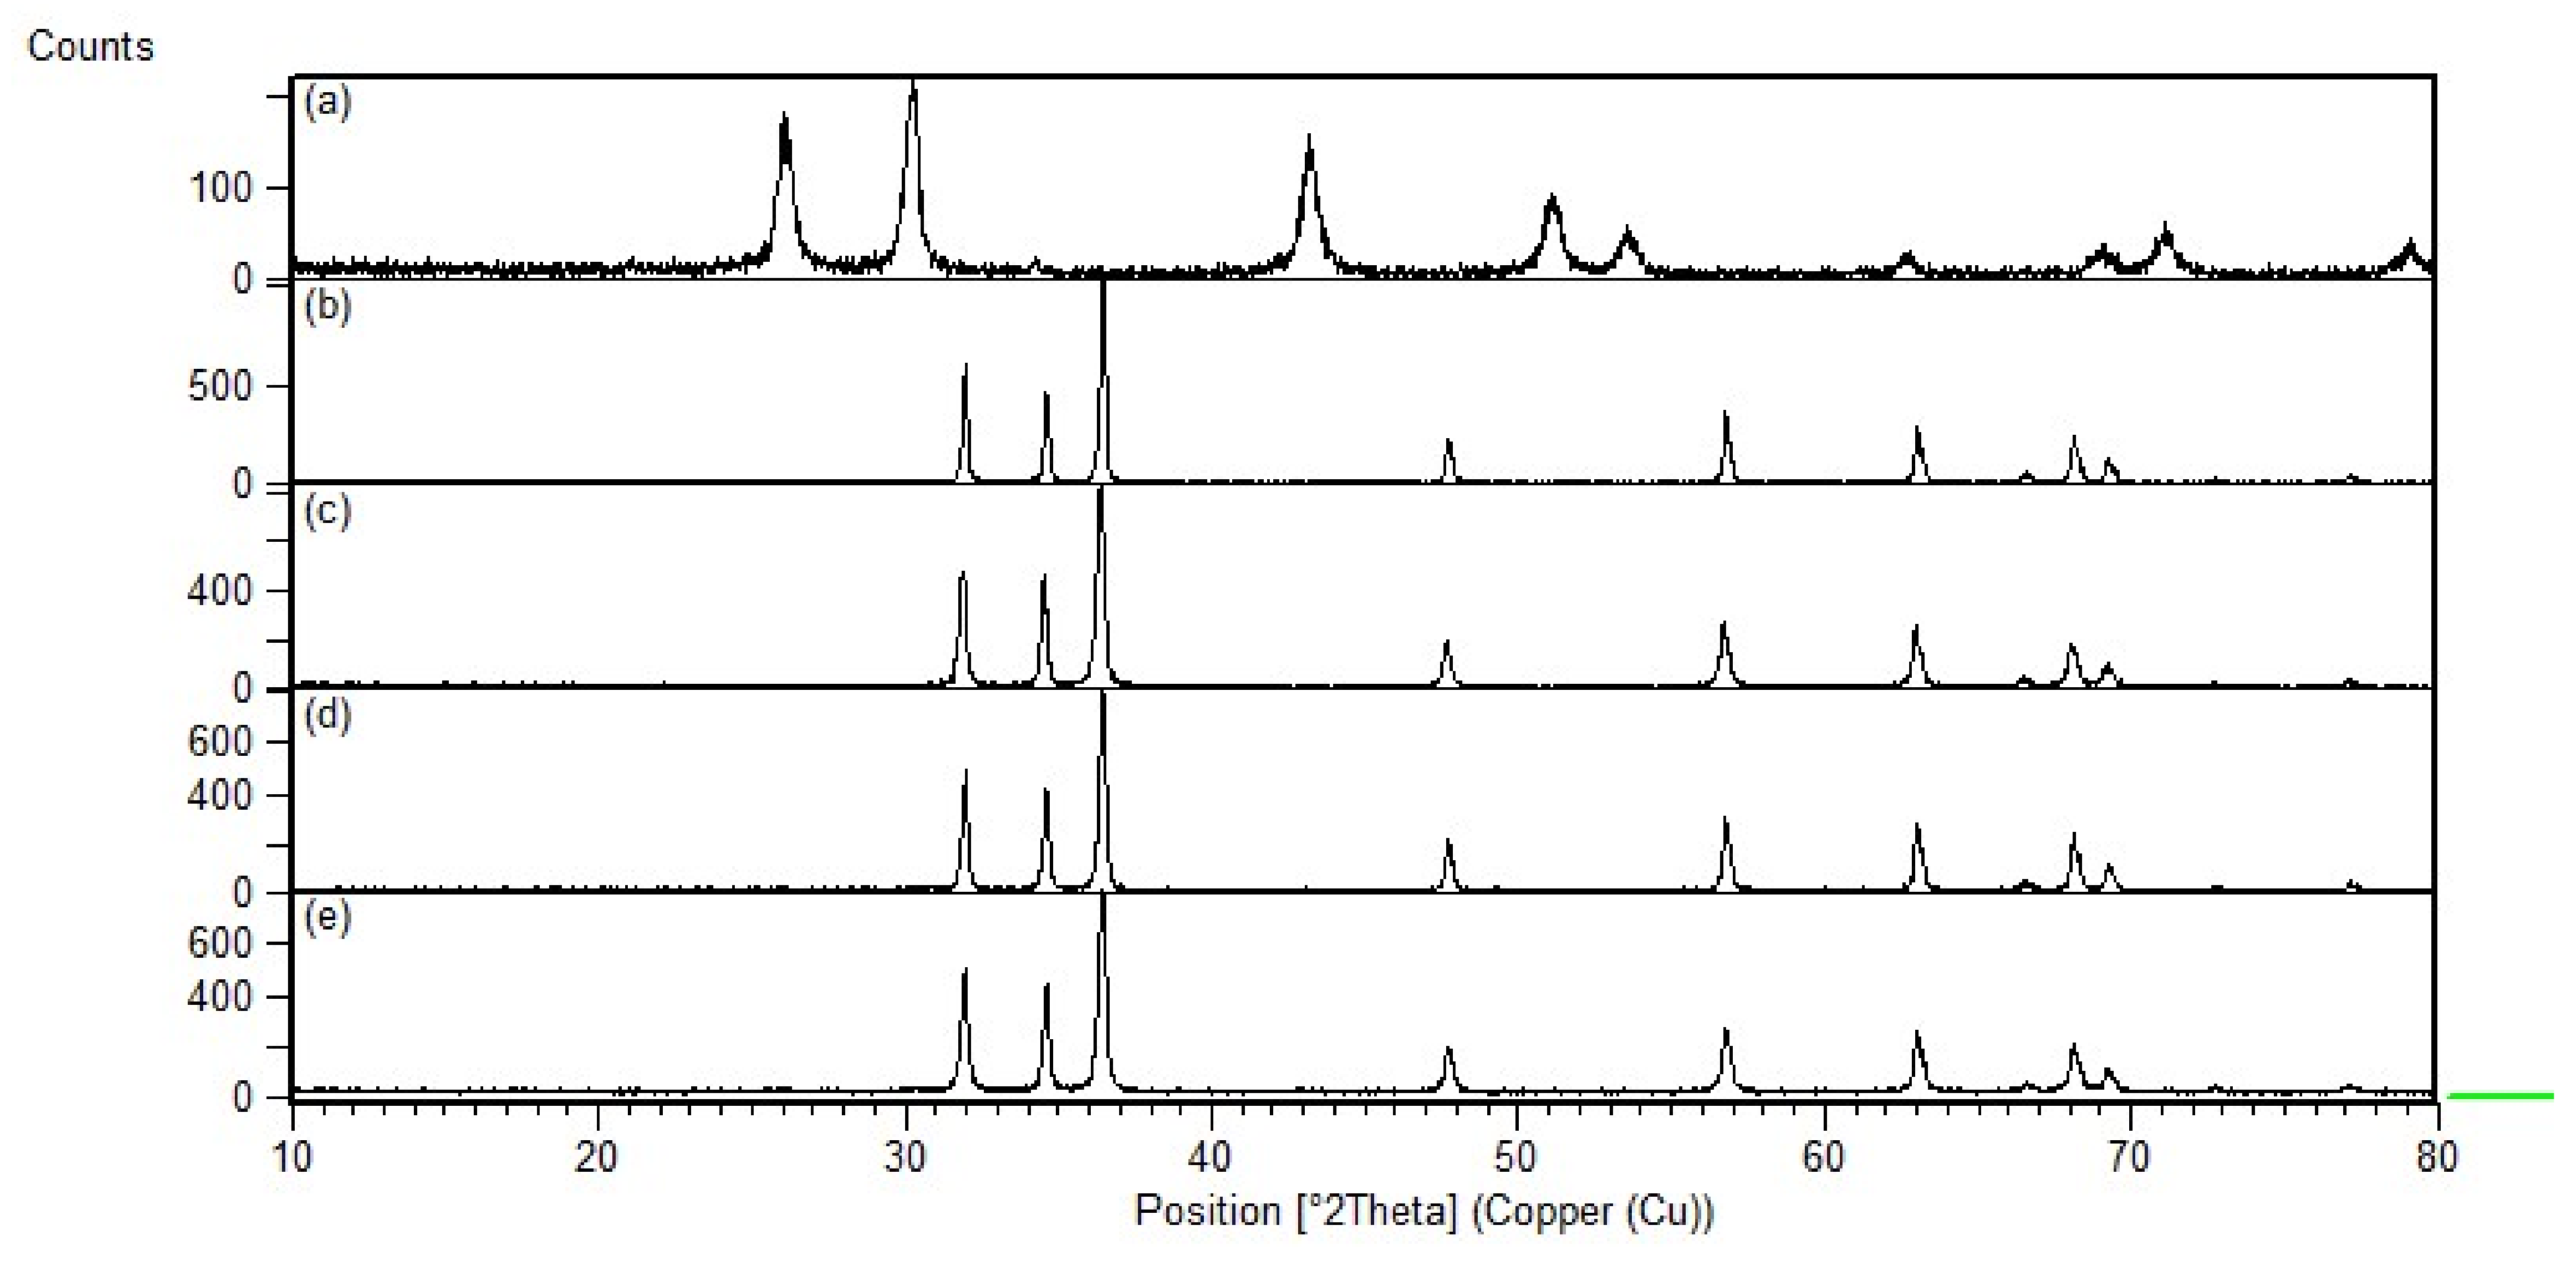
The synthesized nanocomposites’ crystallinity was confirmed using XRD (Shimadzu XRD-7000) at 10–80° at a rate of 2°/min. Crystallite sizes were also analyzed from the XRD data using the Scherrer equation:
D = K λ   β cos θ
where D is the crystallite size (nm), K is the shape factor, which is equal to 0.94 for spherical nanoparticles, λ is the wavelength of X-ray radiation of CuKα1 (λ is 0.154056 nm), β is the full width half maximum intensity (FWHM), and θ is the Bragg angle.
The surface morphology and elemental analyses of the gas sensing composites were obtained using an FE-SEM (JEOL JSM-7600F) spectrometer. An accelerating voltage of 10 kV with a working distance of 9–16 mm was maintained during the analysis. UV–Vis diffuse reflectance spectra (DRS) were also obtained using an Agilent Cary 5000 UV–Vis-NIR spectrophotometer, and the band gaps were calculated from the DRS data using the Tauc plot method [40]. The Tauc plot method is obtained using the Kubelka–Munk function (Equation (4)) where a graph of (F(r)hv)2 against photon energy (eV) is plotted, and the x-axis extrapolated value is the material band gap based on the following calculations:
F r = k s
k = 1 R 2
s = 2 R
where k is the molar absorption coefficient, R is the reflectance data from the UV–Vis data, and s is the scattering factor.
The material surface area and pore sizes were determined using a BET analyzer (Micromeritics ASAP 2020 BET analyzer, Norcross, GA, USA) at 300 °C under a nitrogen gas environment.

2.7. Gas Sensor Fabrication

Initial cleaning was performed for the gold interdigitated (Au-IDE) substrates prior to the deposition of the gas-sensing nanocomposites. Briefly, 100 mL of distilled water was mixed with 10 mL hydrogen peroxide in a 250 mL beaker. The substrates were placed inside the mixture with the gold side facing up. The beaker was then heated on a hot plate at 80 °C for 15 min or until bubbles formed on the gold electrode’s surface. Ammonia solution (2 mL) was added to the beaker and heated up for another 30 min until effervescence was observed. The heat was turned off so the substrates could be removed from the cleaning solution with a tweezer. The substrates were rinsed with distilled water then carefully dried with a paper towel followed by drying in an oven preheated to 60 °C for 30 min.
The nanofilm pastes were prepared by grinding 0.2 g of the nanopowder with α-terpineol solution using an agate mortar until it formed a paste. The paste was then deposited onto the Au-IDE via the doctor blading method and then dried in a preheated oven at 60 °C for an hour. The nanofilm was then calcined at 400 °C for 2 h at the ramping rate of 2 °C/min. The synthesized nanofilms were stored in an oven at 100 °C overnight before performing the gas sensing analyses.

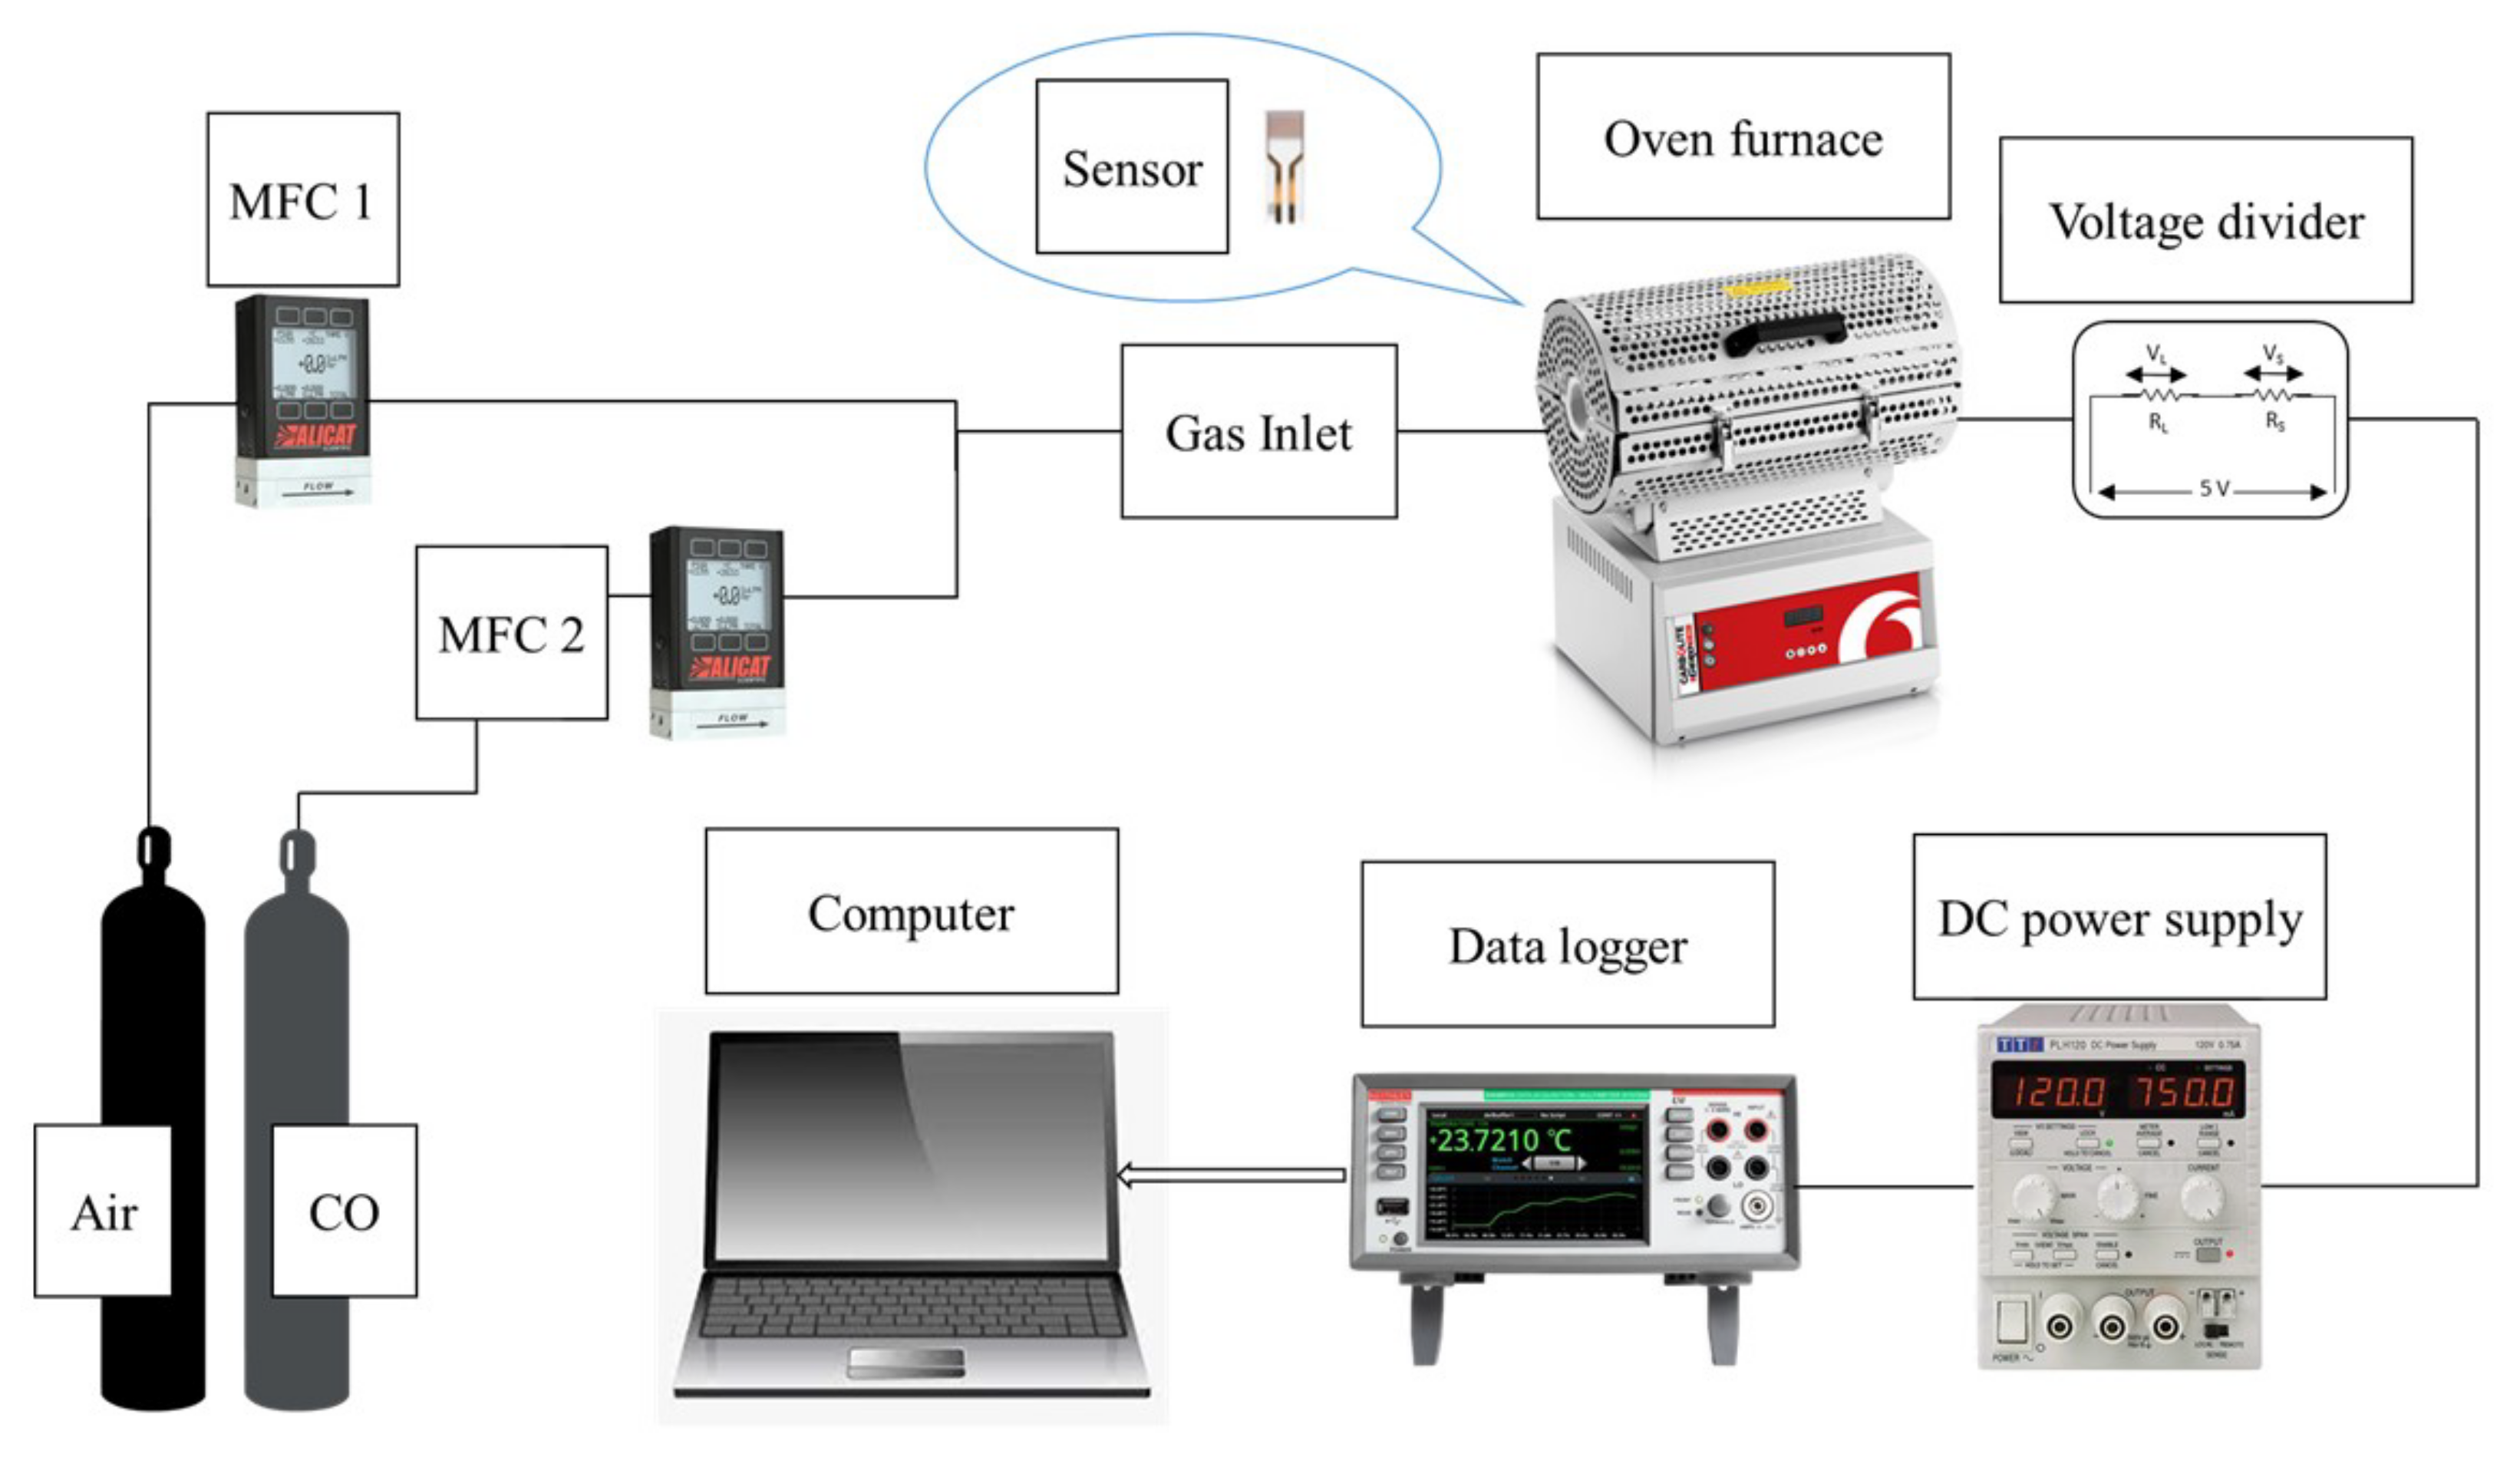
2.8. Gas Sensor Setup

The gas sensing setup is a modified system consisting of a Carbolite Gero tube furnace (30–3000 °C), Alicat Scientific and Horiba mass flow controllers (MFC), a Keithley Data Acquisition and Logging Multimeter System (DAQ6510), and a power supply (TTi PLH120) connected with platinum wires (ϕ 0.3 mm). The test and reference gas were 1000 ppmv CO and compressed air, respectively. A customized quartz tube and ceramic substrate holder were used. The gas sensor setup is shown in Figure 1.

2.9. Gas Sensing Procedure

The nanofilm-deposited substrate was inserted into customized holders connected with platinum wires (ϕ 0.3 mm), which were secured in a quartz tube. They were then inserted into an oven furnace, which was heated to 300 °C for 90 min until the temperature stabilized. Compressed air was first allowed into the tube to set the reference environment before test gas was inserted for the gas sensing procedure. The gas flow was controlled to obtain CO gas concentrations of 100, 200, and 300 ppmv. The sensing data was recorded using the Keithley data acquisition system, which was then used to calculate gas sensing sensitivity as well as response-recovery time. The sensitivity of the sensor was calculated using the following:
Sensitivity = R g R a R a × 100
where Rg is the resistance while exposed to the test gas and Ra is the resistance when exposed to air [39,41]. Response time is the time taken by the sensor to reach 90% of its maximum response value when subjected to the test gas, and recovery time is the time taken by the sensor to obtain 10% of the maximum response value [42].

3. Results and Discussion

3.1. DFT Calculation Results

3.1.1. Global Molecular Reactivity of the Surface

In the DFT simulation, pristine zinc oxide was initially optimized and modeled through a Zn3O3 cluster, as in previous studies [43,44]. The model was chosen due to the ring structure of the Zn2O2 and Zn3O3 cluster, which may be envisioned as the building block for its three-dimensional structure [45,46,47,48]. The Cr-doped optimized structure was obtained by replacing one of the Zn atoms in Zn3O3 with Cr. Consequently, PbS was loaded onto the surface by attaching both Zn2O2 and CrZn2O3 to the PbS molecule. The ground-state optimized structures and molecular orbital consisting of HOMO and LUMO are shown in Figure 2.
From Figure 2 it can be seen that as the PbS molecule is exposed to the surfaces there is a formation of a physical bond upon molecular interaction with the zinc oxide surface of 3.119 Å. However, a chemical bond of 2.760 Å is formed upon interaction with the Cr-doped surface. To understand the interaction and activity between the molecule and the surface, it is best described through the global reactivity descriptor within HOMO and LUMO energy levels. The global reactivity descriptor of the surface includes chemical hardness, chemical potential, and electrophilicity index, and was described and calculated based on Koopman’s theorem given as follows [49,50,51]:
η = E LUMO E HOMO
μ = 1 2 E HOMO + E LUMO
ω = μ 2 2 η
where η, μ, and ω indicate chemical hardness, chemical potential, and electrophilicity index, respectively. The calculated values of the η, μ, and ω within the HOMO and LUMO energies are tabulated in Table 1.
The η value describes the structural stability and reactivity that is directly associated with the HOMO-LUMO band gap. Decreasing η leads to an increase in structural stability while decreasing its reactivity. The decreasing trend of η is as follows: Zn3O3 > PbS/Zn3O3 > CrZn2O3 > PbS/CrZn2O3. This shows the most stability and least reactivity corresponds to Zn3O3, while the highest reactivity is exhibited by PbS/CrZn2O3 with less stability. The tendency of the electrons to escape from the equilibrium system is described by the chemical potential (μ). The μ increases as the PbS molecule binds with the surface structure. The highest μ was observed for PbS/CrZn2O3 indicating that more electrons are readily donated upon interacting with upcoming CO molecules. The capacity to accept electrons from the environment is measured through the electrophilicity index (ω) to build a stable energy state system. The order of the ω is as follows: PbS/CrZn2O3 > CrZn2O3 > PbS/Zn3O3 > Zn3O3. Thus, it indicates that the PbS/CrZn2O3 surface has the highest capacity to accept electrons from the upcoming molecule. Based on the results stated above, it is concluded that the decreased band gap, Eg, is due to the loading of PbS molecule onto Cr-doped zinc oxide, which enhances surface activity by improving its reactivity and allowing more electrons to be donated and accepted by its stabilized structure.

3.1.2. Adsorption Property of CO on the Surface

From DFT optimization at B3LYP/LANL2DZ ground-state level theory, it is revealed that the CO molecules undergo physisorption upon interacting on the surface without significantly changing its structural geometry, as presented in Figure 3. The adsorption distance (dCO) is greater in PbS/Zn3O3 (3.364 Å) when compared to those in PbS/CrZn2O3 (2.169 Å) (Figure 3). To elucidate the strength and position of the physisorption interaction, the electrostatic potential (ESP) aided with contour line analysis was performed, which is also shown in Figure 3 [52]. The distribution of ESP exhibits the greater saturation of positively charged molecules within the region of CO adsorption interaction upon the surface of PbS/CrZn2O3. To obtain further insights into the influence of CO adsorption on the surface, the Eads and Eg were calculated and tabulated in Table 2. From Table 2, the Eads of CO is slightly greater in PbS/Zn3O3 when compared to PbS/CrZn2O3, thus preventing the occurrence of the desorption process for the gas [53]. Furthermore, since the value of Eg in PbS/CrZn2O3 is significantly lower than that in PbS/Zn3O3, more electrons from CO are able to be donated and accepted by the PbS/CrZn2O3 surface. Similar pattern was observed with the energy gap obtained experimentally (Table 3).

3.2. XRD

The crystallinity of synthesized materials was performed using XRD. The XRD peaks for the synthesized ZnO nanoparticles (Figure 4) show the presence of a hexagonal wurtzite ZnO structure at (100), (002), (101), (102), (110), (103), (112), and (201) [54]. The sharpness of the peaks also indicated the crystallinity of the synthesized materials. In addition, doping with 0.5 wt% Cr showed no change in diffraction peak positions of the ZnO film, indicating the successful integration of Cr atoms into the crystal lattice. Previous studies also reported the same diffraction pattern [39]. This is possible as the ionic radius of Cr3+ (0.615 Å) is smaller than that of Zn2+ (0.74 Å) while that of Cr2+ (0.73 Å) is very similar to that recorded for Zn2+ ions [55,56].
After PbS loading at 1.5 wt%, small peaks of the PbS were observed along with the ZnO diffraction peaks indicating the presence of the PbS in the nanocomposites. The intensity of the PbS peaks corresponds with the percentage of loading as a higher concentration of PbS results in higher intensity peaks. The crystallite sizes of each of the synthesized materials were analyzed from the XRD data using the Scherrer equation, from which the crystallite sizes were calculated to be within the nanosize range. The crystallite sizes for the starting materials were calculated to be 50.6 nm, 47.4 nm, and 22.0 nm for ZnO, CrZnO and PbS nanoparticles, respectively. The relatively smaller PbS nanoparticles allow the ease of loading onto the ZnO nanofilm. The calculated crystallite size of the 1.5 wt% PbS-ZnO and 1.5 wt% PbS-CrZnO were 57.6 nm and 44.3 nm, respectively. This indicated the successful loading of PbS onto the nanocomposite and resulted in a smaller crystallite size. This is supported by BET data where a higher surface area was obtained as the result of PbS loading (Table 4). A higher surface area may also lead to higher sensitivity as more CO molecules can interact with the surface.

3.3. SEM

The SEM images of the synthesized ZnO, CrZnO, PbS, 1.5 wt% PbS-ZnO and 1.5 wt% PbS-CrZnO are shown in Figure 5. The ZnO and CrZnO nanoparticles are observed in Figure 5a,b to be in rod-like shape and arranged in a random orientation. Similar ZnO morphology was observed by Hasnidawani et al., and the shape of ZnO depends on the zinc precursors while, in this case, zinc acetate was used [57]. The non-uniform shape could also be attributed to the synthesis method as the ZnO morphology is dependent on the solvent and temperature; the higher the annealing temperature, the more controlled and uniform the orientation and shape of the resulting ZnO nanostructure, as seen in other studies [58,59,60,61]. In Figure 5a, pure ZnO exhibits mainly the nanorod structure, which is the ZnO material. After doping with 0.5 wt% Cr, the SEM image of the doped material in Figure 5b shows a mixture of nanorod and spherical nanoparticles. The Cr-doped ZnO also shows more clusters compared to the pure ZnO. As seen in Figure 5c, the PbS nanoparticles appeared to be clusters of nanocubes; a similar observation was reported in other studies [62,63,64]. PbS loading is also confirmed by the SEM images in Figure 5d,e. In Figure 5d, along with the ZnO nanorod structures, the presence of the uniform nanocluster of PbS can also be observed. It is the same in PbS-CrZnO nanocomposites where the presence of CrZnO and PbS nanoclusters can be seen (Figure 5e).

3.4. UV–Vis

The UV–Vis (DRS) of the synthesized materials was also carried out, from which the band gaps were calculated using the Tauc plot method and are summarized in Table 3. The calculated band gap value for pure ZnO was found to be 4.813 eV, which is higher than the value of 3.37 eV found in the literature [65]. It was found that the calculated band gaps showed the same trend as the DFT calculation values where the band gaps decrease as the PbS is loaded onto the ZnO nanoparticles (Table 3). The ZnO band gap decreased from 4.813 eV to 4.795 eV after loading with 1.5 wt% PbS. Similarly, the band gap of CrZnO decreased from 5.068 eV to 3.337 eV after PbS loading. The decrease in band gap energy could be due to the formation of the p-n type heterojunction formed in the PbS-loaded nanocomposite. The narrow band gap in the p-n heterojunction improves electron transportation and suppresses charge-carrier recombination hence preventing energy loss due to recombination [66,67]. This effect was also observed in ZnO loaded with a different p-type semiconductor such as CuO, in which the ZnO/CuO nanocomposite showed a narrower band gap when compared to pure ZnO [65,68].

3.5. BET

BET analyses were performed to calculate the surface area of the synthesized nanocomposites; the data are summarized in Table 4.
Table 4 shows that with PbS loading, there was a slight increase in the surface area from 13.9 nm to 16.4 m²/g for pure ZnO, and 11.7 m2/g to 18.2 m2/g for CrZnO. These increased surface areas could contribute to better sensing sensitivity to CO gas due to the availability of more working sites on the sensor material compared to the pure nanocomposites [69]. The BET analyses also supported the XRD and SEM data in which the Cr-doped ZnO has lower crystallite and particle size, which could be due to the clusters of nanoparticles. It can also be observed that the Cr-doped nanocomposite is more porous, which could contribute to higher sensitivity as there are more available areas for the CO to adsorb onto the nanocomposite. Doping has also been proven to have increased the surface area of ZnO sensing materials in other studies, such as in a study using lanthanum as the dopant, which resulted in an increase of surface area from 14.5 m2/g for pure ZnO nanofibers to 21.25, 20.73, 14.42 and 15.39 m2/g for 1.0, 2.0, 6.0 and 11.0 wt% La-doping, respectively [70].

3.6. Gas Sensor Sensitivity

The sensitivity of ZnO, CrZnO and PbS were studied under the same testing conditions as the PbS-loaded ZnO and CrZnO materials in order to compare the effects of PbS loading at 1.5 wt% (Table 5). It can be seen from Table 5. that pure PbS exhibits the lowest overall sensitivity as a gas sensor material for CO at 300 °C. At 100 ppmv CO, the pure ZnO gas sensor exhibited only 58.8% sensitivity. Although the sensitivity of PbS-ZnO at 100 ppmv CO is lower than that of pure ZnO at the same condition, the sensitivity can be seen to increase with higher CO concentration, which could be due to the presence of more CO test gas causing more reaction to occur on the ZnO working surface area. The gas sensors exhibited better sensitivity after PbS loading compared to using pure starting materials, which could be due to the lower band gap and higher surface area. The best sensor sensitivity could be observed at 200 ppmv CO for the 1.5 wt% PbS-ZnO sensor and at 300 ppmv CO for the PbS-CrZnO sensor. The sensitivity generally increases significantly with increasing gas concentration making for good sensor material. Based on the sensitivity values, the 1.5 wt% PbS-CrZnO material is the better sensor material when compared to the pure nanocomposite at the same PbS-loading weight percentage. In another study, a sensitivity of 85.2% was obtained in ZnO-decorated reduced graphene oxide (rGO) sensors for CO gas at 200 °C at 1000 ppmv, hence the synthesized PbS-loaded ZnO and CrZnO nanocomposites in this study show better sensing response at a lower CO concentration at 300 °C [16].

3.7. Response-Recovery Time

The response-recovery times for gas sensing were also calculated and are presented in Table 6. The response times range from 141.1–155.4 s for 100 ppmv CO, 120.5–146.3 s for 200 ppmv CO, and 117.0–153.1 s for 300 ppmv CO. There are no linear trends in the response times in relation to increasing CO concentrations. However, it can be observed that at 100 ppmv CO, the response time decreases slightly after the formation of the PbS-loaded nanocomposite from 141.1 s to 131.8 s for PbS-ZnO and from 155.4 s to 123.6 s for the PbS-CrZnO. This is supported by the BET analyses, where the PbS-loaded nanocomposites exhibited a higher working surface area and pore size, contributing to faster response times when compared to pure ZnO. The recovery times are longer than the response times, indicating strong adsorption between the gas sensor and CO gas.

4. Conclusions

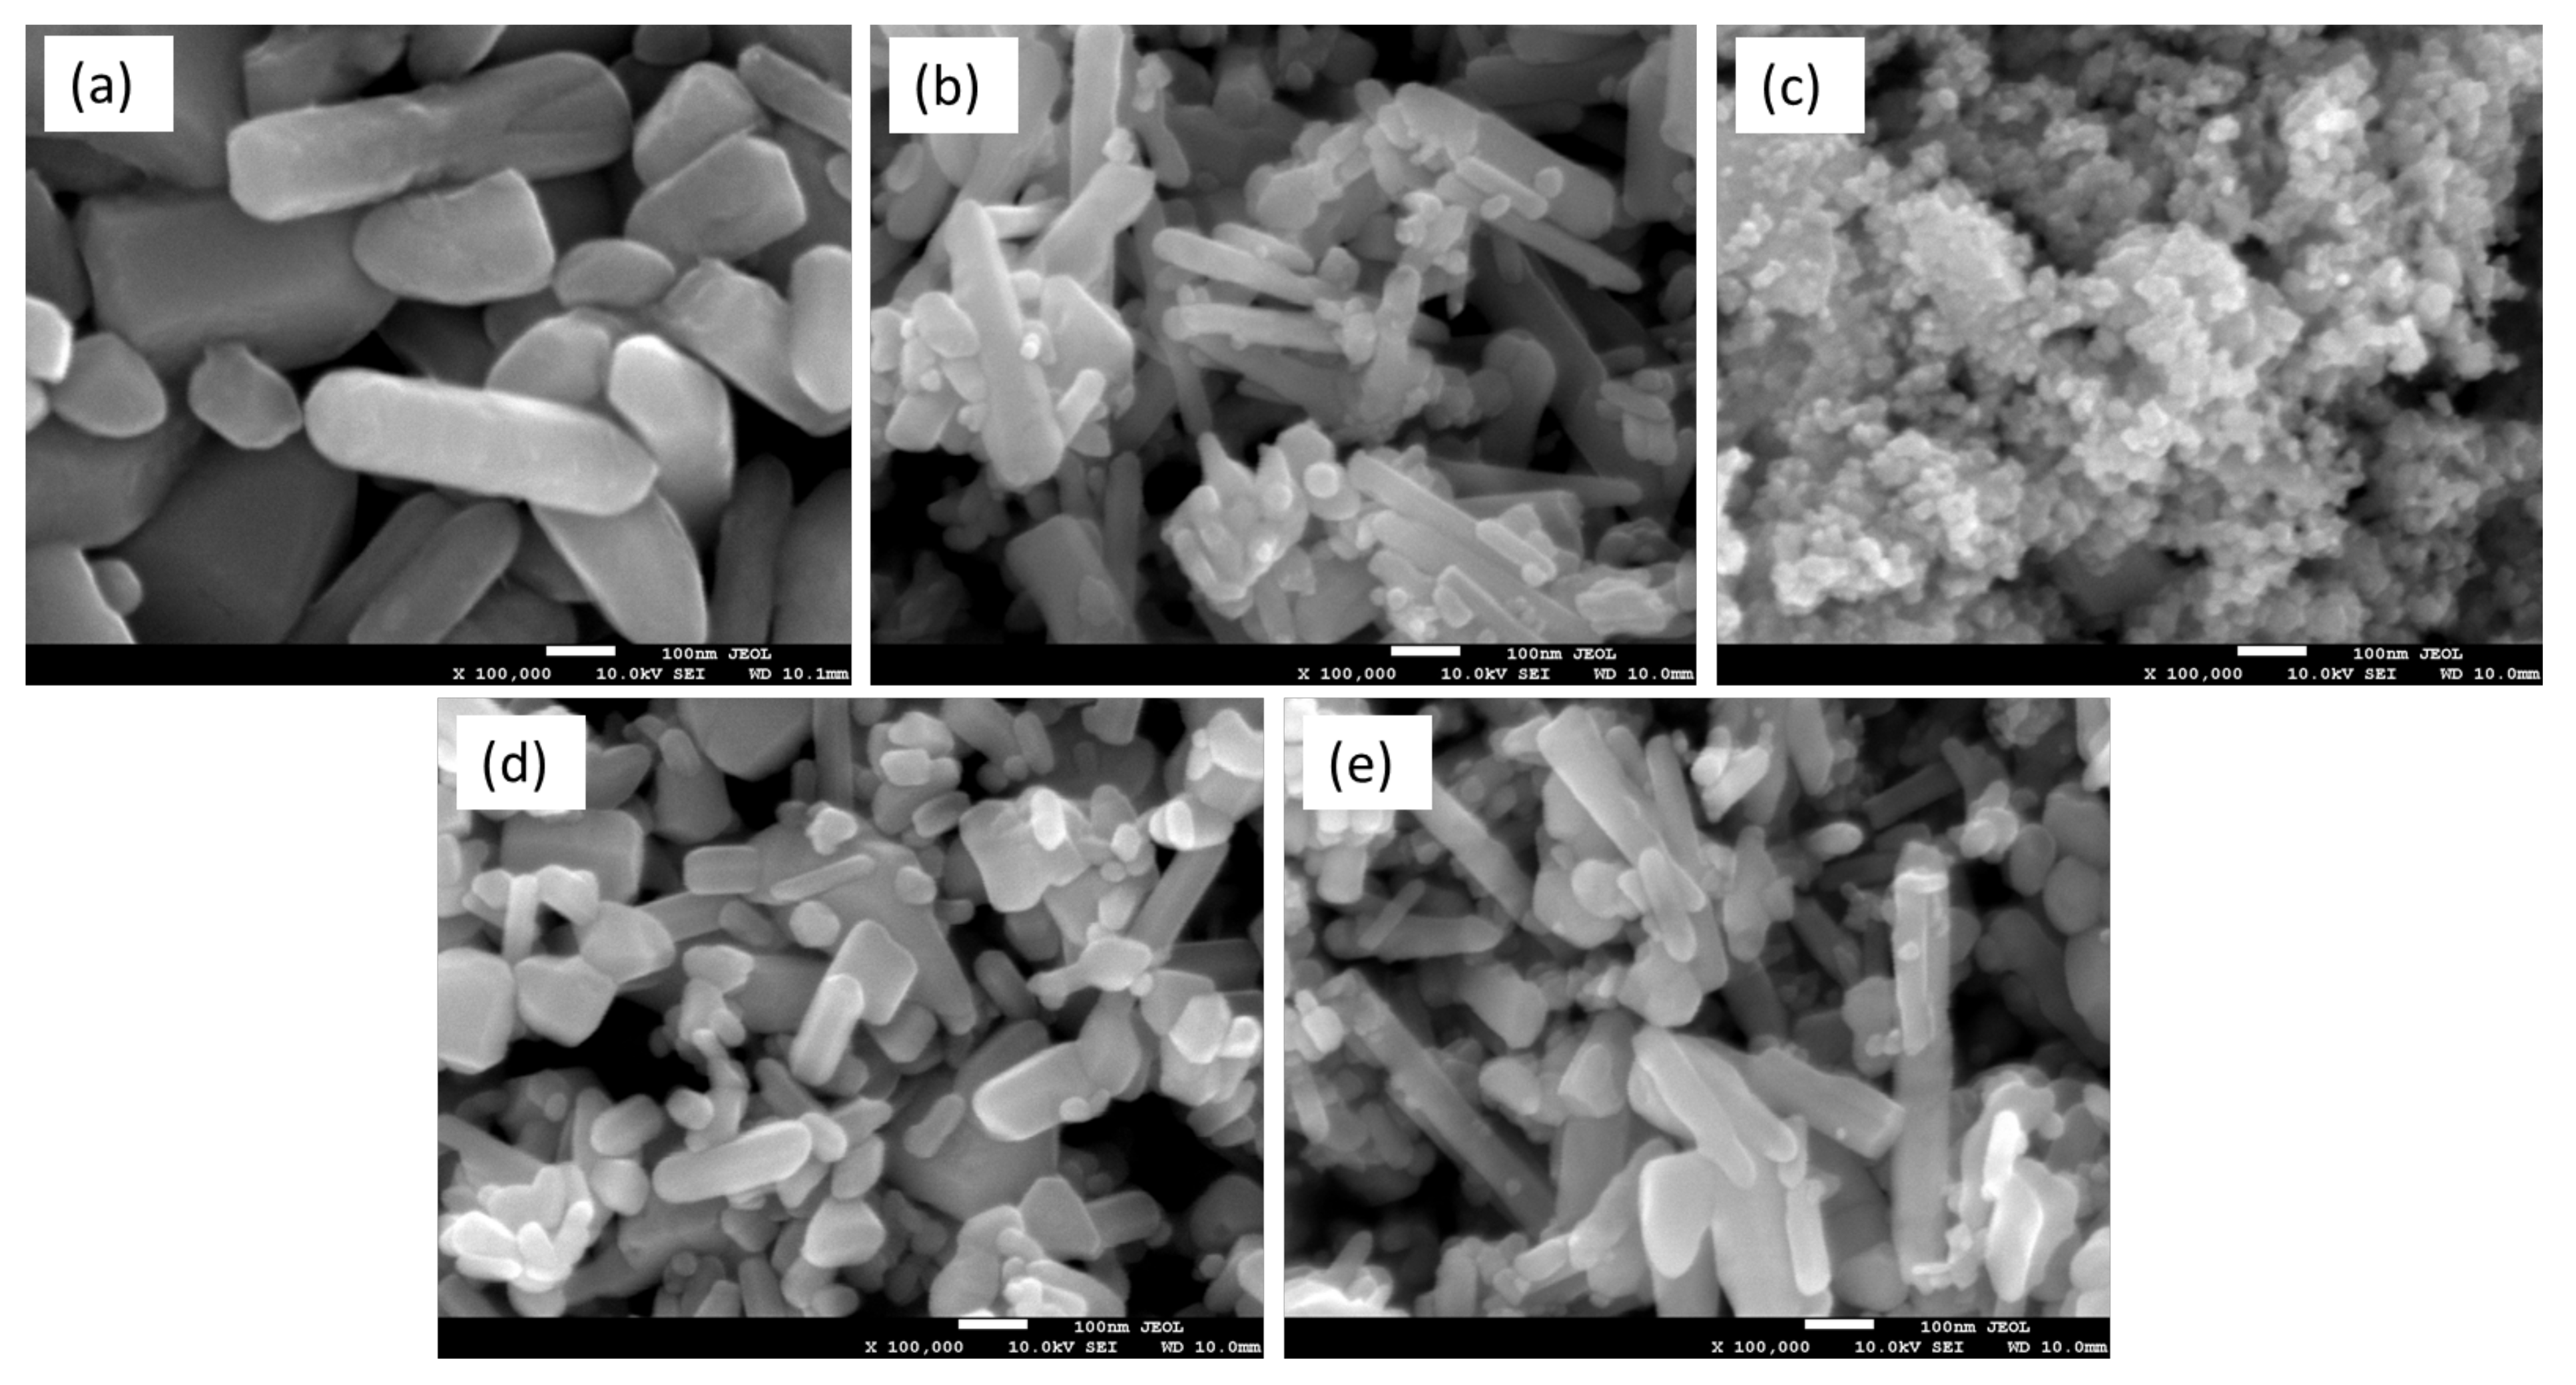
PbS-loaded ZnO and CrZnO nanocomposites were successfully synthesized via a sol–gel method and then blended at 1.5 wt%. XRD confirmed the hexagonal wurtzite peaks of ZnO and CrZnO, as well as the PbS after loading to form the nanocomposites, and the Scherrer-calculated crystallite sizes of the PbS-ZnO and PbS-CrZnO nanocomposites were 57.6 nm and 44.3 nm, respectively. SEM images confirmed the morphologies of ZnO, CrZnO, and PbS nanoparticles, as well as the presence of PbS after loading onto the nanocomposites. The DFT calculated that band gaps decreased the loading of PbS onto the pure ZnO (from 3.753 eV to 3.540 eV) and CrZnO materials (from 1.736 eV to 1.518 eV). This trend was supported by the band gaps calculated from UV–Vis data for PbS-ZnO (4.813 eV to 4.795 eV) and PbS-CrZnO (5.068 eV to 3.337 eV). The decrease in band gaps was due to the formation of p-n heterojunctions, which improved electron charge transport and prevents energy loss by suppressing the charge-carrier recombination. BET analysis results showed that 1.5 wt% PbS-CrZnO had the highest surface area and pore size at 18.2 m2/g and 30.0 nm, respectively. The sensing results of the 1.5 wt% PbS-ZnO and 1.5 wt% PbS-CrZnO nanocomposites showed better sensitivity as gas sensors compared to pure ZnO, with PbS-CrZnO having the best sensitivities ranging from 78.5 to 195.2%. This high sensitivity could be attributed to the smaller crystallite sizes, lower band gap, and higher working surface area of the nanocomposite. PbS-CrZnO showed the best response time in the present study, which decreased with increasing CO concentration.

Author Contributions

N.S.B.: Writing original draft, Investigation, Visualization. R.T.: Conceptualization, Supervision, Methodology, Writing—review & editing, Funding acquisition. M.R.R.K.: Supervision, Writing—review & editing, Funding acquisition. C.M.L.: Methodology, Writing—review & editing. M.A.S.: Formal analysis, Writing original draft. A.U.: Methodology. N.N.M.S.: Methodology. Y.-F.C.C.: Methodology. C.-T.C.C.: Methodology. H.-P.C.: Methodology. A.H.M.: Supervision. All authors have read and agreed to the published version of the manuscript.

Funding

The work described in this paper was supported by Universiti Brunei Darussalam research grants UBD/RSCH/1.9/FICBF/2021/010 & UBD/RSCH/1.9/FICBF(b)/2022/017.

Data Availability Statement

All the data used to support the findings of this study are included in the article.

Acknowledgments

We, the authors, would like to thank the Government of Brunei Darussalam and Universiti Brunei Darussalam for their continuous support.

Conflicts of Interest

The authors declare no conflict of interest.

References

  1. Harale, N.S.; Kamble, A.S.; Tarwal, N.L.; Mulla, I.S.; Rao, V.K.; Kim, J.H.; Patil, P.S. Hydrothermally grown ZnO nanorods arrays for selective NO2 gas sensing: Effect of anion generating agents. Ceram Int. 2016, 42, 12807–12814. [Google Scholar] [CrossRef]
  2. Chandrasekaran, S. Health, Safety, and Environmental Management in Offshore and Petroleum Engineering; Wiley: Hoboken, NJ, USA, 2016. [Google Scholar] [CrossRef]
  3. Chaulya, S.K.; Prasad, G.M. Gas Sensors for Underground Mines and Hazardous Areas. Sens. Monit. Technol. Mines Hazard. Areas 2016, 161–212. [Google Scholar] [CrossRef]
  4. Pineda-Reyes, A.M.; Herrera-Rivera, M.R.; Rojas-Chávez, H.; Cruz-Martínez, H.; Medina, D.I.; Rivera, M.R.H.; Rojas-Chávez, H.; Cruz-Martínez, H.; Medina, P.; Viterbo, J.; et al. Recent Advances in ZnO-Based Carbon Monoxide Sensors: Role of Doping. Sensors 2021, 21, 4425. [Google Scholar] [CrossRef] [PubMed]
  5. Transportation Research Board and National Research Council. The Ongoing Challenge of Managing Carbon Monoxide Pollution in Fairbanks, Alaska: Interim Report; The National Academies Press: Washington, DC, USA, 2002. [Google Scholar] [CrossRef]
  6. Kalay, N. What are the cardiac effects of carbon monoxide poisoning in the acute and chronic periods? Am. J. Emerg. Med. 2016, 34, 1303. [Google Scholar] [CrossRef]
  7. Kampa, M.; Castanas, E. Human health effects of air pollution. Environ. Pollut. 2008, 151, 362–367. [Google Scholar] [CrossRef]
  8. National Institute for Occupational Safety and Health. NIOSH Pocket Guide to Chemical Hazards—Welding Fumes, DHHS (NIOSH) Publication; National Institute for Occupational Safety and Health: Washington, DC, USA, 2007; p. 334. [Google Scholar]
  9. Yamazoe, N.; Shimanoe, K. Overview of gas sensor technology. In Science and Technology of Chemiresistor Gas Sensors; Nova Science Publishers, Inc.: Hauppauge, NY, USA, 2007; pp. 1–31. [Google Scholar]
  10. Isik, E.; Tasyurek, L.B.; Isik, I.; Kilinc, N. Synthesis and analysis of TiO2 nanotubes by electrochemical anodization and machine learning method for hydrogen sensors. Microelectron Eng. 2022, 262, 111834. [Google Scholar] [CrossRef]
  11. Li, Y.; Abedalwafa, M.A.; Tang, L.; Li, D.; Wang, L. Electrospun nanofibers for sensors. In Electrospinning: Nanofabrication and Applications; Elsevier: Amsterdam, The Netherlands, 2018. [Google Scholar] [CrossRef]
  12. Kang, Y.; Yu, F.; Zhang, L.; Wang, W.; Chen, L.; Li, Y. Review of ZnO-based nanomaterials in gas sensors. Solid State Ion 2021, 360, 115544. [Google Scholar] [CrossRef]
  13. Sarkar, A.; Maity, S.; Chakraborty, P.; Chakraborty, S.K. Synthesize of ZnO Nano Structure for Toxic Gas Sensing Application. Procedia Comput. Sci. 2016, 92, 199–206. [Google Scholar] [CrossRef] [Green Version]
  14. Bhati, V.S.; Hojamberdiev, M.; Kumar, M. Enhanced sensing performance of ZnO nanostructures-based gas sensors: A review. Energy Rep. 2020, 6, 46–62. [Google Scholar] [CrossRef]
  15. Wang, C.; Yin, L.; Zhang, L.; Xiang, D.; Gao, R. Metal oxide gas sensors: Sensitivity and influencing factors. Sensors 2010, 10, 2088–2106. [Google Scholar] [CrossRef] [Green Version]
  16. Ha, N.H.; Thinh, D.D.; Huong, N.T.; Phuong, N.H.; Thach, P.D.; Hong, H.S. Fast response of carbon monoxide gas sensors using a highly porous network of ZnO nanoparticles decorated on 3D reduced graphene oxide. Appl. Surf. Sci. 2018, 434, 1048–1054. [Google Scholar] [CrossRef]
  17. Nakarungsee, P.; Srirattanapibul, S.; Issro, C.; Tang, I.M.; Thongmee, S. High performance Cr doped ZnO by UV for NH3 gas sensor. Sens. Actuators A Phys. 2020, 314, 112230. [Google Scholar] [CrossRef]
  18. Kösemen, A.; Kösemen, Z.A.; Öztürk, S.; Kılınç, N.; San, S.E.; Tunç, A.V. Electrochemical Growth of Pd Doped ZnO Nanorods. J. Electrochem. Soc. 2015, 162, D142–D146. [Google Scholar] [CrossRef]
  19. Changqi, X.; Zhicheng, Z.; Hailong, W.; Qiang, Y. A novel way to synthesize lead sulfide QDs via γ-ray irradiation. Mater. Sci. Eng. B Solid State Mater. Adv. Technol. 2003, 104, 5–8. [Google Scholar] [CrossRef]
  20. De Iacovo, A.; Venettacci, C.; Colace, L.; Scopa, L.; Foglia, S. PbS Colloidal Quantum Dot Photodetectors operating in the near infrared. Sci. Rep. 2016, 6, 37913. [Google Scholar] [CrossRef] [Green Version]
  21. De Iacovo, A.; Venettacci, C.; Bruno, S.A.; Colace, L. Lead sulphide colloidal quantum dots for sensing applications. In Proceedings of the PHOTOPTICS 2019—Proceedings of the 7th International Conference on Photonics, Optics and Laser Technology, Prague, Czech Republic, 25–27 February 2019; pp. 235–240. [Google Scholar] [CrossRef]
  22. Liu, H.; Li, M.; Voznyy, O.; Hu, L.; Fu, Q.; Zhou, D.; Xia, Z.; Sargent, E.H.; Tang, J. Physically flexible, rapid-response gas sensor based on colloidal quantum dot solids. Adv. Mater. 2014, 26, 2718–2724. [Google Scholar] [CrossRef]
  23. Mosahebfard, A.; Roshan, H.; Sheikhi, M.H. Enhancement of Methane Gas Sensing Characteristics of Lead Sulfide Colloidal Nanocrystals by Silver Nanoparticles Decoration. IEEE Sens. J. 2017, 17, 3375–3380. [Google Scholar] [CrossRef]
  24. Compagnone, D.; Di Francia, G.; Di Natale, C.; Neri, G.; Seeber, R.; Tajani, A. Chemical sensors and biosensors in Italy: A review of the 2015 literature. Sensors 2017, 17, 868. [Google Scholar] [CrossRef] [Green Version]
  25. Mirzaei, A.; Lee, J.H.; Majhi, S.M.; Weber, M.; Bechelany, M.; Kim, H.W.; Kim, S.S. Resistive gas sensors based on metal-oxide nanowires. J. Appl. Phys. 2019, 126, 241102. [Google Scholar] [CrossRef] [Green Version]
  26. Van Mourik, T.; Bühl, M.; Gaigeot, M.P. Density functional theory across chemistry, physics and biology. Philos. Trans. R. Soc. A Math. Phys. Eng. Sci. 2014, 372, 20120488. [Google Scholar] [CrossRef] [Green Version]
  27. Baseden, K.A.; Tye, J.W. Introduction to density functional theory: Calculations by hand on the helium atom. J. Chem. Educ. 2014, 91, 2116–2123. [Google Scholar] [CrossRef]
  28. Kurth, S.; Marques, M.A.L.; Gross, E.K.U. Density-Functional Theory. Encycl. Condens. Matter Phys. 2005, 395–402. [Google Scholar] [CrossRef]
  29. Frisch, M.J.; Trucks, G.W.; Schlegel, H.B.; Scuseria, G.E.; Robb, M.A.; Cheeseman, J.R.; Scalmani, G.; Barone, V.; Petersson, G.A.; Nakatsuji, H.; et al. Gaussian 16 Revision B.01; Gaussian Inc.: Wallingford, CT, USA, 2016. [Google Scholar]
  30. Dennington, R.; Keith, T.A.; Millam, J.M. GaussView Version 6.0.16; Semichem Inc.: Shawnee Mission, KS, USA, 2019. [Google Scholar]
  31. Lee, C.; Yang, W.; Parr, R. Development of the Colle-Salvetti correlation-energy formula into a functional of the electron density. Phys. Rev. B Condens. Matter 1988, 37, 785–789. [Google Scholar] [CrossRef] [PubMed] [Green Version]
  32. Becke, A. A New Mixing of Hartree-Fock and Local Density Functional Theories. J. Chem. Phys. 1993, 98, 1372. [Google Scholar] [CrossRef]
  33. Wadt, W.; Hay, P. Ab initio effective core potentials for molecular calculations. Potentials for main group elements Na to Bi. J. Chem. Phys. 1985, 82, 284–298. [Google Scholar] [CrossRef]
  34. Hay, P.; Wadt, W. Ab initio Effective core potentials for molecular calculations—Potentials for the transition-metal atoms Sc to Hg. J. Chem. Phys. 1985, 82, 270–283. [Google Scholar] [CrossRef]
  35. Hay, P.; Wadt, W. Ab initio effective core potentials for molecular calculations. Potentials for K to Au including the outermost core orbitals. J. Chem. Phys. 1985, 82, 299–310. [Google Scholar] [CrossRef]
  36. Hajjaji, F.E.L.; Salim, R.; Taleb, M.; Benhiba, F.; Rezki, N.; Chauhan, D.S.; Quraishi, M.A. Pyridinium-based ionic liquids as novel eco-friendly corrosion inhibitors for mild steel in molar hydrochloric acid: Experimental & computational approach. Surf. Interfaces 2021, 22, 100881. [Google Scholar] [CrossRef]
  37. Syaahiran, A.; Lim, C.M.; Kooh, M.R.R.; Mahadi, A.H.; Chau, Y.F.C.; Thotagamuge, R. A Theoretical Insight of Cr Dopant in Tungsten Oxide for Gas Sensor Application. Mater. Today Commun. 2021, 28, 102508. [Google Scholar] [CrossRef]
  38. Yang, T.; Jin, W.; Liu, Y.; Li, H.; Yang, S.; Chen, W. Surface reactions of CH3OH, NH3 and CO on ZnO nanorod arrays film: DFT investigation for gas sensing selectivity mechanism. Appl. Surf. Sci. 2018, 457, 975–980. [Google Scholar] [CrossRef]
  39. Habib, I.Y.; Tajuddin, A.A.; Noor, H.A.; Lim, C.M.; Mahadi, A.H.; Kumara, N.T.R.N. Enhanced Carbon monoxide-sensing properties of Chromium-doped ZnO nanostructures. Sci. Rep. 2019, 9, 9207. [Google Scholar] [CrossRef] [Green Version]
  40. Tauc, T.; Kubelka, P.; Munk, F.; Information, S.; Tauc, T. How To Correctly Determine the Band Gap Energy of Modi fi ed Semiconductor Photocatalysts Based on UV–Vis Spectra. J. Phys. Chem. Lett. 2018, 9, 6814–6817. [Google Scholar] [CrossRef] [Green Version]
  41. Yuan, Z.; Li, R.; Meng, F.; Zhang, J.; Zuo, K.; Han, E. Approaches to enhancing gas sensing properties: A review. Sensors 2019, 19, 1495. [Google Scholar] [CrossRef] [Green Version]
  42. Ganbavle, V.V.; Inamdar, S.I.; Agawane, G.L.; Kim, J.H.; Rajpure, K.Y. Synthesis of fast response, highly sensitive and selective Ni:ZNO based NO2 sensor. Chem. Eng. J. 2016, 286, 36–47. [Google Scholar] [CrossRef]
  43. Tayade, N.; Mane, S.M.; Tirpude, M.P.; Shin, J.C. Perspective of Zn3O3 ring cluster via density functional theory. Mater. Today Commun. 2021, 27, 102343. [Google Scholar] [CrossRef]
  44. Kumar, N.V.S.; Rao, L.S. Theoretical insights into interaction energy, IR intensity and Raman activity enhancements of H2O adsorbed on Mg containing Zn3O3 nanoclusters: A computational study. Comput. Theor. Chem. 2022, 1212, 113708. [Google Scholar] [CrossRef]
  45. Cheng, X.; Li, F.; Zhao, Y. A DFT investigation on ZnO clusters and nanostructures. J. Mol. Struct. Theochem 2009, 894, 121–127. [Google Scholar] [CrossRef]
  46. Perera, D.; Rasaiah, J. Exchange Functionals and Basis Sets for Density Functional Theory Studies of Water Splitting on Selected ZnO Nanocluster Catalysts. ACS Omega 2022, 7, 12556–12669. [Google Scholar] [CrossRef]
  47. Zhu, Y.; Li, B. Study on the Mixed ZnO Clusters and Ring-Like ZnO Ions. J. Clust. Sci. 2018, 29, 897–908. [Google Scholar] [CrossRef]
  48. AlSunaidi, A. Small Nanoclusters of ZnO and ZnS: A Density-Functional Study. AIP Conf. Proc. 2007, 929, 43–47. [Google Scholar] [CrossRef]
  49. Pearson, R. Chemical hardness and density functional theory. J. Chem. Sci. 2005, 117, 369–377. [Google Scholar] [CrossRef]
  50. Pearson, R. The electronic chemical potential and chemical hardness. J. Mol. Struct.-Theochem 1992, 255, 261–270. [Google Scholar] [CrossRef]
  51. Chattaraj, P.; Giri, S. Electrophilicity index within a conceptual DFT framework. Annu. Rep. Prog. Chem. Sect. C Phys. Chem. 2009, 105, 13–39. [Google Scholar] [CrossRef]
  52. Shokri, A.; Salami, N. Gas sensor based on MoS2 monolayer. Sens. Actuators B Chem. 2016, 236, 378–385. [Google Scholar] [CrossRef]
  53. Syaahiran, M.; Mahadi, A.; Chee, M.; Lim, M.; Raziq, R.; Kooh, M.R.R.; Chou, C.; Chiang, H.P.; Thotagamuge, R. Theoretical Study of CO Adsorption Interactions with Cr-Doped Tungsten Oxide/Graphene Composites for Gas Sensor Application. ACS Omega 2022, 7, 528. [Google Scholar] [CrossRef] [PubMed]
  54. Manikandan, B.; Endo, T.; Kaneko, S.; Murali, K.R.; John, R. Properties of sol gel synthesized ZnO nanoparticles. J. Mater. Sci. Mater. Electron. 2018, 29, 9474–9485. [Google Scholar] [CrossRef]
  55. Zhang, Q.P.; Xu, X.N.; Liu, Y.T.; Xu, M.; Deng, S.H.; Chen, Y.; Yuan, H.; Yu, F.; Huang, Y.; Zhao, K.; et al. A feasible strategy to balance the crystallinity and specific surface area of metal oxide nanocrystals. Sci. Rep. 2017, 7, 46424. [Google Scholar] [CrossRef] [Green Version]
  56. Chang, C.-J.; Yang, T.-L.; Weng, Y.-C. Synthesis and characterization of Cr-doped ZnO nanorod-array photocatalysts with improved activity. J. Solid State Chem. 2014, 214, 101–107. [Google Scholar] [CrossRef]
  57. Hasnidawani, J.N.; Azlina, H.N.; Norita, H.; Bonnia, N.N.; Ratim, S.; Ali, E.S. Synthesis of ZnO Nanostructures Using Sol-Gel Method. Procedia Chem. 2016, 19, 211–216. [Google Scholar] [CrossRef] [Green Version]
  58. Musat, V.; Rego, A.M.; Monteiro, R.; Fortunato, E. Microstructure and gas-sensing properties of sol-gel ZnO thin films. Thin Solid Films 2008, 516, 1512–1515. [Google Scholar] [CrossRef]
  59. Zhang, Y. ZnO Nanostructures: Fabrication and Applications; Royal Society of Chemistry: London, UK, 2017; Volume 43. [Google Scholar]
  60. Kolodziejczak-Radzimska, A.; Jesionowski, T. Zinc oxide-from synthesis to application: A review. Materials 2014, 7, 2833–2881. [Google Scholar] [CrossRef] [Green Version]
  61. Perillo, P.M.; Atia, M.N.; Rodríguez, D.F. Studies on the growth control of ZnO nanostructures synthesized by the chemical method. Rev. Mater. 2018, 23. [Google Scholar] [CrossRef] [Green Version]
  62. Bai, R.; Chaudhary, S.; Pandya, D.K. Temperature dependent charge transport mechanisms in highly crystalline p-PbS cubic nanocrystals grown by chemical bath deposition. Mater. Sci. Semicond. Process. 2018, 75, 301–310. [Google Scholar] [CrossRef]
  63. Navaneethan, M.; Archana, J.; Nisha, K.D.; Ponnusamy, S.; Arivanandhan, M.; Hayakawa, Y.; Muthamizhchelvan, C. Organic ligand assisted low temperature synthesis of lead sulfide nanocubes and its optical properties. Mater. Lett. 2012, 71, 44–47. [Google Scholar] [CrossRef]
  64. Emadi, H.; Salavati-Niasari, M. Hydrothermal synthesis and characterization of lead sulfide nanocubes through simple hydrothermal method in the presence of [bis(salicylate)lead(II)] as a new precursor. Superlattices Microstruct. 2013, 54, 118–127. [Google Scholar] [CrossRef]
  65. Davis, K.; Yarbrough, R.; Froeschle, M.; White, J.; Rathnayake, H. Band gap engineered zinc oxide nanostructures via a sol-gel synthesis of solvent driven shape-controlled crystal growth †. RSC Adv. 2019, 9, 14638–14648. [Google Scholar] [CrossRef]
  66. Gopi, C.V.V.M.; Venkata-Haritha, M.; Lee, Y.-S.; Kim, H.-J. ZnO nanorods decorated with metal sulfides as stable and efficient counter-electrode materials for high-efficiency quantum dot-sensitized solar cells. J. Mater. Chem. A Mater. 2016, 4, 8161–8171. [Google Scholar] [CrossRef]
  67. Mano, G.; Harinee, S.; Sridhar, S.; Ashok, M.; Viswanathan, A.; Zno, Z. Microwave assisted synthesis of Zno-pbS heterojuction for degradation of organic pollutants under visible light. Sci. Rep. 2020, 10, 2224. [Google Scholar] [CrossRef] [Green Version]
  68. Thirumoorthi, M.; Dhavud, S.S.; Ganesh, V.; al Abdulaal, T.H.; Yahia, I.S.; Deivatamil, D. High responsivity n-ZnO/p-CuO heterojunction thin film synthesised by low-cost SILAR method for photodiode applications. Opt. Mater. 2022, 128, 112410. [Google Scholar] [CrossRef]
  69. Ahmad, R.; Majhi, S.M.; Zhang, X.; Swager, T.M.; Salama, K.N. Recent progress and perspectives of gas sensors based on vertically oriented ZnO nanomaterials. Adv. Colloid Interface Sci. 2019, 270, 1–27. [Google Scholar] [CrossRef]
  70. Xu, X.L.; Chen, Y.; Ma, S.Y.; Li, W.Q.; Mao, Y.Z. Excellent acetone sensor of La-doped ZnO nanofibers with unique bead-like structures. Sens. Actuators B Chem. 2015, 213, 222–233. [Google Scholar] [CrossRef]
Figure 1. Schematic diagram of the customized gas sensing setup.
Sustainability 14 13978 g001
Figure 2. Ground-state optimized structure, HOMO and LUMO pre- and post-loaded PbS molecule at B3LYP/LANL2DZ level theory.
Sustainability 14 13978 g002
Figure 3. Contour line and electrostatic potential (ESP) mapping distributions of the optimized structure of PbS/Zn3O3 and PbS/CrZn2O3 interacting with CO gas (isovalue at 0.02).
Sustainability 14 13978 g003
Figure 4. XRD pattern of synthesized (a) PbS, (b) ZnO, (c) 0.5 wt% CrZnO, (d) 1.5 wt% PbS-ZnO, and (e) 1.5 wt% PbS-CrZnO.
Sustainability 14 13978 g004
Figure 5. SEM images at 100,000× magnification of (a) ZnO, (b) CrZnO, (c) PbS, (d) 1.5% PbS-ZnO and (e) 1.5% PbS-CrZnO.
Sustainability 14 13978 g005
Table 1. Calculated HOMO energy (EHOMO), LUMO energy (ELUMO), band gap (Eg), total energy (ETotal), chemical hardness (η), chemical potential (μ), and electrophilicity index (ω). All of the energy values are in electron volt (eV).
StructureEHOMOELUMOEgETotalημω
Zn3O3−6.858−3.1053.753−1.15 × 1043.75−4.983.31
CrZn2O3−4.930−3.1941.736−1.21 × 1041.74−4.064.75
PbS−6.754−2.6834.071−3.71 × 1024.07−4.722.73
PbS/Zn3O3−6.868−3.3283.540−1.19 × 1043.54−5.103.67
PbS/CrZn2O3−4.930−3.4131.518−1.24 × 1041.52−4.175.73
Table 2. Calculated HOMO energy (EHOMO), LUMO energy (ELUMO), band gap (Eg), total energy (ETotal) and adsorption energy (Eads) at adsorption distance (dCO). All of the energy values are in electron volt (eV).
StructureEHOMOELUMOEgETotalEadsdCO
CO–PbS/Zn3O3−6.839−3.2773.561−1.50 × 104−0.112−5.10
CO–PbS/CrZn2O3−4.680−3.6351.045−1.55 × 104−0.655−4.17
Table 3. The calculated band gap (eV) of ZnO, CrZnO, PbS, 1.5 wt% PbS-ZnO and 1.5 wt% PbS-CrZnO from UV–Vis DRS spectra compared to the calculated values from DFT simulations.
MaterialCalculated DRS Band Gap (eV)DFT Simulation Band Gap (eV)
ZnO4.8133.753
0.5 wt% CrZnO5.0681.736
PbS4.8364.071
1.5 wt% PbS-ZnO4.7953.540
1.5 wt% PbS-CrZnO3.3371.518
Table 4. Calculated BET surface area and pore size of the synthesized ZnO, CrZnO, PbS, 1.5 wt% PbS-ZnO and 1.5 wt% PbS-CrZnO obtained from BET analyses.
MaterialBET Surface Area (m²/g)Pore Size (nm)
ZnO13.924.9
0.5 wt% CrZnO11.722.2
PbS16.530.7
1.5 wt% PbS-ZnO16.412.9
1.5 wt% PbS-CrZnO18.230.0
Table 5. Calculated gas sensor sensitivity for each of the starting materials and its nanocomposites at 100, 200, and 300 ppmv of CO gas at 300 °C.
MaterialSensitivity (%) at Various CO Concentration
100 ppmv200 ppmv300 ppmv
ZnO58.8109.0127.2
0.5 wt% CrZnO33.078.3122.1
PbS54.191.490.9
1.5 wt% PbS-ZnO26.5131122
1.5 wt% PbS-CrZnO78.5139.4195.2
Table 6. Response-recovery time (seconds) of the starting material and its nanocomposites at 100, 200, and 300 ppmv of CO gas at 300 °C.
CO Concentration
100 ppmv200 ppmv300 ppmv
MaterialResponseRecoveryResponseRecoveryResponse Recovery
ZnO141.1214.4129.3246.7153.1254.6
0.5 wt% CrZnO155.4241.7146.3268.8115.6217.0
PbS141.5276.1135.6275.3141.1284.5
1.5 wt% PbS-ZnO131.8223.7132.9227.5119.6223.8
1.5 wt% PbS-CrZnO123.6231.3120.5232.2117.0237.7
Publisher’s Note: MDPI stays neutral with regard to jurisdictional claims in published maps and institutional affiliations.

