Article

Effects of Altitude, Plant Communities, and Canopies on the Thermal Comfort, Negative Air Ions, and Airborne Particles of Mountain Forests in Summer

1
College of Forestry, Northwest Agriculture and Forestry University, Yangling 712100, China
2
College of Landscape Architecture and Art, Northwest Agriculture and Forestry University, Yangling 712100, China
*
Author to whom correspondence should be addressed.
These authors contributed equally to this work.
Sustainability 2022, 14(7), 3882; https://doi.org/10.3390/su14073882
Submission received: 16 February 2022 / Revised: 21 March 2022 / Accepted: 24 March 2022 / Published: 25 March 2022

Abstract

:
Forest bathing is considered an economical, feasible, and sustainable way to solve human sub-health problems caused by urban environmental degradation and to promote physical and mental health. Mountain forests are ideal for providing forest baths because of their large area and ecological environment. The regulatory mechanism of a mountain forest plant community in a microenvironment conducive to forest bathing is the theoretical basis for promoting physical and mental health through forest bathing in mountain forests. Based on field investigations and measurements, differences in the daily universal thermal climate index (UTCI), negative air ion (NAI), and airborne particulate matter (PM2.5 and PM10) levels in nine elevation gradients, six plant community types, and six plant community canopy parameter gradients were quantitatively analyzed. In addition, the correlations between these variables and various canopy parameters were further established. The results showed the following: (1) Altitude had a significant influence on the daily UTCI, NAI, PM2.5, and PM10 levels in the summer. The daily UTCI, NAI, PM2.5, and PM10 levels gradually decreased with the increase in altitude. For every 100 m increase in altitude, the daily UTCI decreased by 0.62 °C, the daily NAI concentration decreased by 108 ions/cm3, and the daily PM2.5 and PM10 concentrations decreased by 0.60 and 3.45 µg/m3, respectively. (2) There were significant differences in the daily UTCI, NAI, PM2.5, and PM10 levels among different plant communities in the summer. Among the six plant communities, the Quercus variabilis forest (QVF) had the lowest daily UTCI and the best thermal comfort evaluation. The QVF and Pinus tabuliformis forest (PTF) had a higher daily NAI concentration and lower daily PM2.5 and PM10 concentrations. (3) The characteristics of the plant community canopy, canopy density (CD), canopy porosity (CP), leaf area index (LAI), and sky view factor (SVF), had significant effects on the daily UTCI and NAI concentration, but had no significant effects on the daily PM2.5 and PM10 concentrations in the summer. The plant community with higher CD and LAI, but lower CP and SVF, showed a higher daily UTCI and a higher daily NAI concentration. In conclusion, the QVF and PTF plant communities with higher CD and LAI but lower CP and SVF at lower elevations are more suitable for forest bathing in the summer in mountainous forests at lower altitudes. The results of this study provide an economical, feasible, and sustainable guide for the location of forest bathing activities and urban greening planning to promote people’s physical and mental health.

1. Introduction

With the rapid development of urbanization and industrialization, the scope of human activities is constantly expanding, and the impact of human activities is also constantly increasing [1,2]. At the same time, the development of urbanization and industrialization has also caused a large amount of anthropogenic heat and pollutants to be discharged into the atmosphere, which has caused a series of environmental crises [2,3,4]. These environmental crises are mainly manifested in serious air pollution and high temperatures in cities. A large number of studies have reported that the air temperature (Ta) and air pollutant levels in inner cities are significantly higher than those in surrounding areas [5]. These environmental problems are a serious threat to physical and mental health [6,7]. For example, excessive air pollutants can easily cause respiratory diseases, cardiovascular diseases, and psychological diseases [6]. Urban heat islands (UHI) easily cause irritability, heatstroke, mental disorders, and other symptoms [7]. Continuous high temperatures can also lead to a series of diseases, especially heart, cerebrovascular, and respiratory diseases, and a significant increase in mortality [7]. The threat of urban environmental deterioration has increased the urgency of the pursuit of physical health [2]. Many researchers have put forward methods to promote health from aspects such as drug research and development, and improving hospital treatment [8], but these methods are difficult to implement, have a high economic cost, and have weak long-term effects. Therefore, from the perspective of sustainable development, it is important to explore the long-term economic feasibility and effectiveness of solutions to improve physical and mental health.
Forest bathing (FB), also known as Shinrin-Yoku (SK) and Nature Therapy (NT), is one of the most economical and effective ways to deal with physical and mental health problems [9]. FB refers to spending time in a forest to walk, run, practice tai chi, or engage in other deep breathing exercises, such that the forest environment enhances metabolism and helps to achieve relaxation and physical recovery [9,10]. Existing research shows that FB can improve immune system function (increasing natural killer cells and cancer prevention) [10], improve the function of the cardiovascular system (ease hypertension and coronary artery disease) [11], alleviate respiratory diseases (including respiratory allergies) [12], alleviate depression and anxiety [13], creates feelings of relaxation [13], and increase human well-being (strengthen gratitude and selflessness) [14,15]. Compared to expensive medical and surgical treatments, forest bathing, to achieve effective health benefits, only requires that a certain amount of time be spent in the forest [9]. Therefore, forest bathing is considered an economical and sustainable way to promote physical and mental health.
Relevant studies have shown that the forest environment is the key factor in forest bathing for promoting physical and mental health [9,13,16]. The forest environment can reduce fine particles in the air [17], release negative air ions (NAI) [16], reduce hot temperatures in the summer [18], and provide a comfortable thermal environment [14,19,20]. However, around the world, plains are mostly occupied by residential and agricultural areas, and forests are mostly located in the mountains around cities [21]. Therefore, mountain forests mainly comprise the sites that can provide forest bathing facilities. At present, although some studies have shown that forests can affect the microclimate and air environment under their canopy [17,22,23,24], there has been no detailed quantitative study on how mountain forests affect the thermal environment and the NAI and air particulate matter (PM2.5 and PM10) levels under their forest canopy, especially in inland semi-arid regions with a large altitude span. Therefore, for the effective and sustainable use of mountain forests for forest bathing and the improvement of physical and mental health, it is important to identify the effects of mountain forests on the thermal environment and on the NAI and air particulate matter (PM2.5 and PM10) levels and to find the combination of mountain forest characteristics that is most conducive to forest bathing.
To quantitatively investigate the regulating mechanisms and influential factors of plant communities on the thermal environment and on the NAI and air particulate matter (PM2.5 and PM10) levels in mountain forests with a large altitude span and provide theoretical guidance for future forest bathing site selection and utilization, in this paper, we focus on characterizing variations in forest bathing thermal environments and in the NAI and air particulate matter (PM2.5 and PM10) levels with various mountain forest altitudes and in various plant communities, and determining the critical influence of the plant community canopy characteristics on these environments and these levels.

2. Materials and Methods

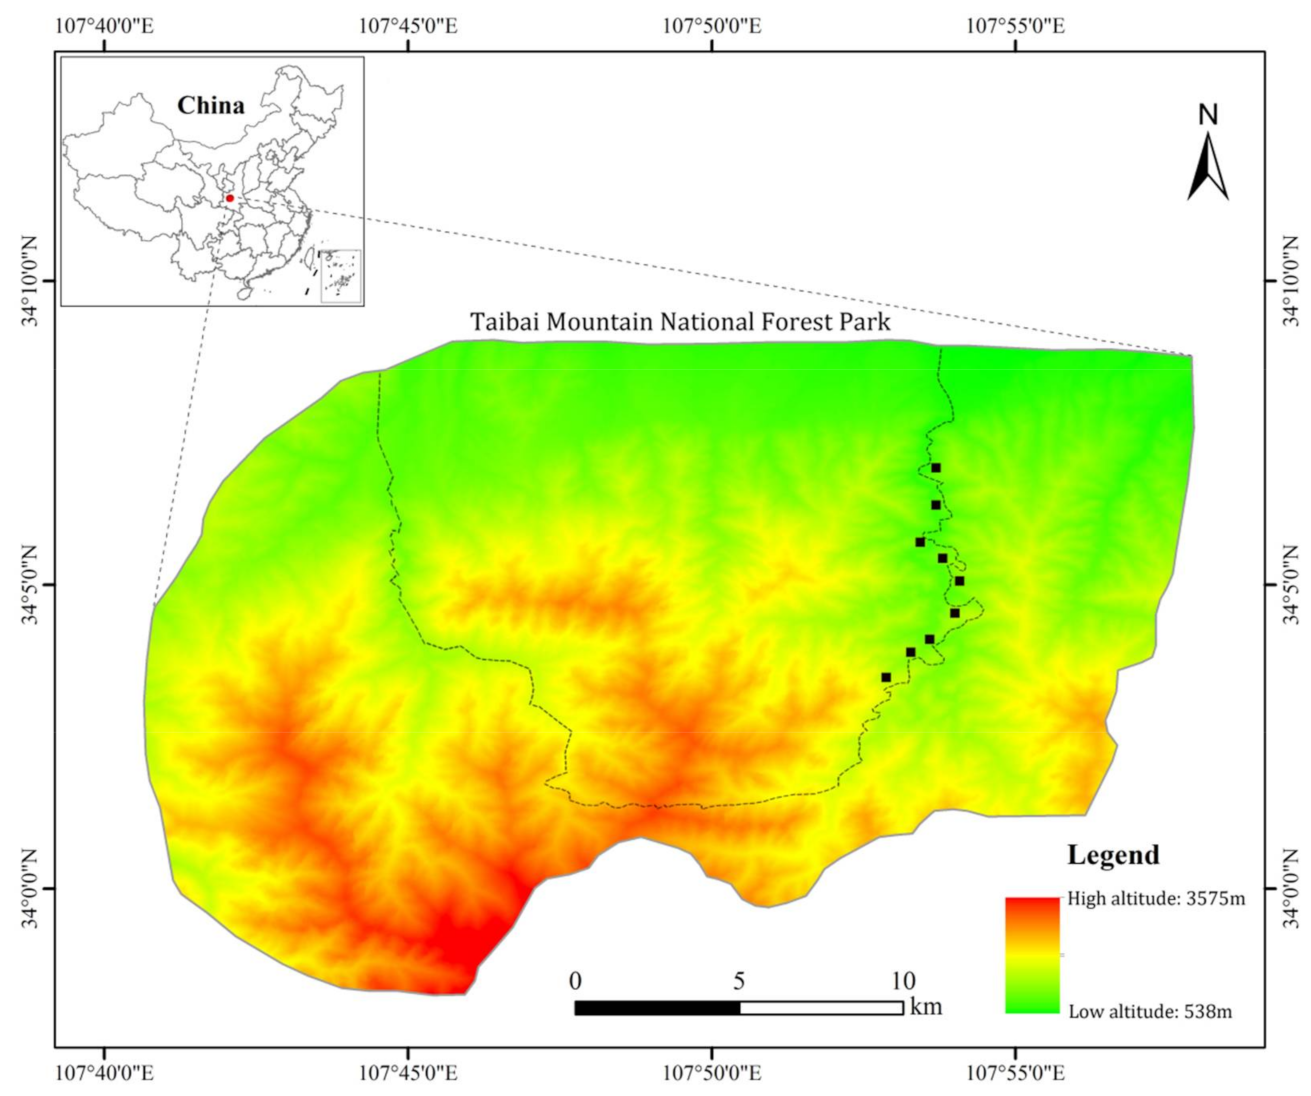
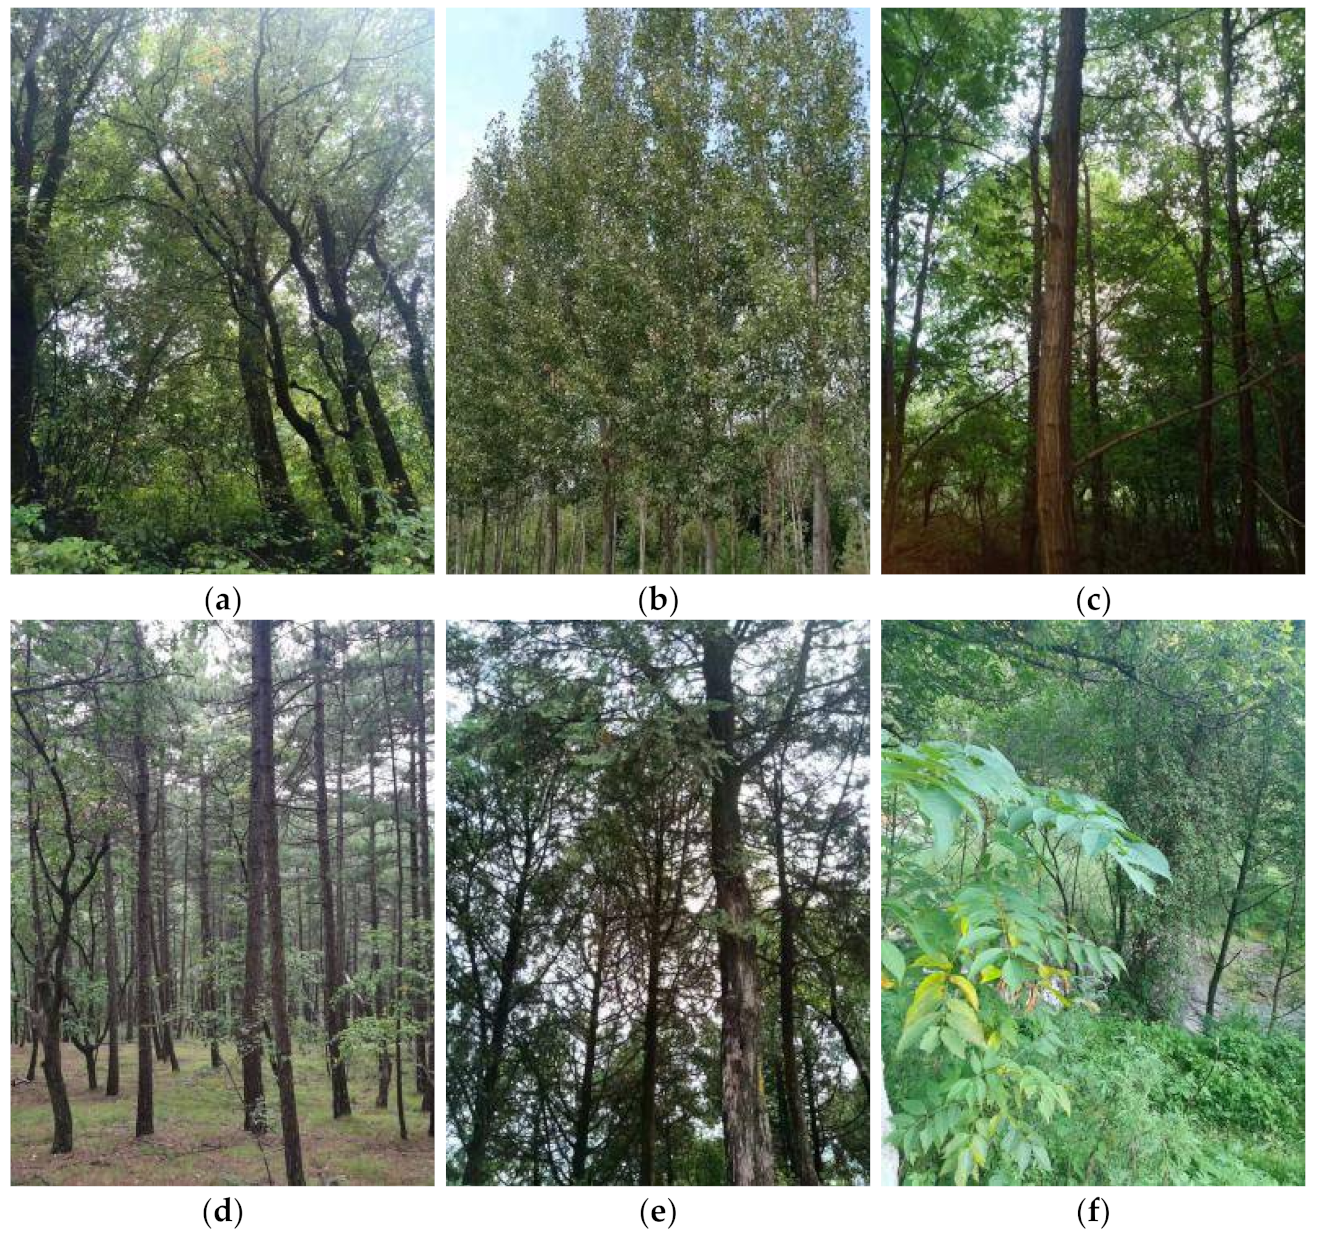
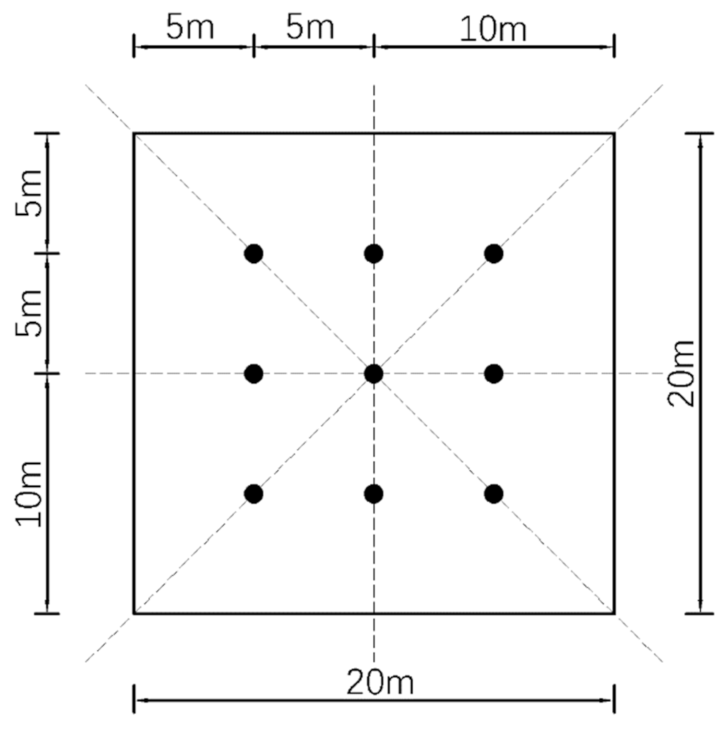
2.1. Study Area and Measurement Sites

The Taibai Mountain National Forest Park (107°41′23′′–107°51′40′′ E, 33°49′31′′–34°08′1′′ N), situated in the southern part of the Guanzhong Plain and the northern part of Qinling Mountain in China, in Meixian County, Baoji City, Shaanxi Province, China, has a monsoon-influenced sub-humid continental climate, with hot and humid summers and generally cold and dry winters. The park covers an area of 2949 hectares, with a forest coverage rate of 94.3%. The Taibai Mountain National Forest Park has a wide elevation distribution range (620~3511 m), abundant plant species (over 1850 species), and a complex community structure. Therefore, the interior of each plant community can be regarded as a miniaturization of the mountain forest environment, which is well suited for studies on forest bathing thermal environments and on the NAI and air particulate matter (PM2.5 and PM10) levels.
Experiment A, aimed at examining the influence of elevation on the plant community micro-environment for forest bathing, was carried out near the main tourist road of the Taibai Mountain National Forest Park. Based on a pre-investigation, nine plant communities at different elevations containing the same constructive species were defined, the elevations of which were 856, 931, 997, 1052, 1231, 1364, 1406, 1463, and 1508 m (Table 1 and Figure 1). In order to control the experimental variables, our experimental design required that the nine communities selected were all of the same constructive species, and the average tree diameter at breast height (DBH), tree height, and canopy density (CD) of the nine communities were kept in as narrow a range as possible. Quercus variabilis is a deciduous broad-leaved tree widely distributed at different elevations on Qinling Mountain and forms the main forest community. Therefore, in Experiment A, we chose a Quercus variabilis forest as the experimental plant community. We selected nine plant community plots with a size of 20 × 20 m. Additionally, all of these communities are common in the Taibai Mountain National Forest Park. Basic information about the above nine plots is detailed in Table 1. The locations of the nine plant community plots are shown in Figure 1.
Experiment B, aimed at examining the influence of plant community types on the micro-environment for forest bathing, was carried out in the Taibai Mountain National Forest Park. Based on a pre-investigation, six plant community types were defined: a Quercus variabilis forest (QVF), a Populus davidiana forest (PDF), a Robinia pseudoacacia forest (RPF), a Pinus tabuliformis forest (PTF), a Platycladus orientalis forest (POF), and a weed-tree forest (WTF). We selected six plant community plots with a size of 20 × 20 m. In order to control the experimental variables, our experimental design required that the six plant communities selected be located in a small elevation range (834–956 m). The six plant communities were the most common community types in the Taibai Mountain National Forest Park. We ensured that the distance between each plot was greater than 1000 m to avoid interference with the measurement results. Basic information about the above six plots is detailed in Table 2 and Figure 2.
Experiment C, aimed at examining the influence of canopy characteristics on the micro-environment for forest bathing, was carried out in the Taibai Mountain National Forest Park. We selected six plant communities with different canopy structures with a size of 20 × 20 m. Each plot featured similar tree species and altitude. We ensured that the distance between each selected community was greater than 1000 m to avoid any interference with the measurement results. Basic information about the above six plots is detailed in Table 3 and Figure 3.

2.2. Universal Thermal Climate Index (UTCI), Negative Air Ion (NAI), and Airborne Particulate Matter (PM2.5 and PM10) Level Measurements

The thermal index is the primary method of evaluating thermal environments and comfort [25]. Based on the multi-node human physiology of the Fiala model, the universal thermal climate index (UTCI) simulates the influence of body temperature adjustments on activities in outdoor environments [26]. It can be applied to all weathers, seasons, and spatial scales [26]. To date, the UTCI has been widely applied in outdoor thermal comfort studies [27,28]. The UTCI values are divided into 10 different levels based on the degree of the thermophysiological response of the human body [26,27] (Table 4). Xu et al. [29] modified the thermal stress category range of the UTCI locally according to the climate of Shaanxi Province, China. In this study, the UTCI was selected as the evaluation index of the thermal environment, and the UTCI range of Xu et al. [29] was cited. Meteorological parameters, i.e., the air temperature (Ta), relative humidity (RH), wind velocity (Va), global radiation (G), and mean radiant temperature (Tmrt), were input into the UTCI computing model (http://www.utci.org/ Accessed date: 5 December 2021) to calculate the individual UTCI. Ta, RH, and Va were measured using a Kestrel 5500 (Nielsen-Kellerman Co., Ltd., Boothwyn, PA, USA), The globe temperature (Tg) was measured using a HD32.2 WBGT Index instrument (Jinzhou Sunshine Meteorological Technology Co., Ltd., Jinzhou, China), and the global radiation (G) was measured using a TBQ-ZW solar radiation recorder (Jinzhou Sunshine Meteorological Technology Co., Ltd., Jinzhou, China). T m r t was calculated according to the ISO 7726 standard [30]:
T m r t = T g + 273 4 + 1.10 × 10 8 × V a 6 ε D 0.4 T g T a 0.25 273
where D is the globe diameter (set to 0.05 m in this study) and Ɛ is the emissivity (set to 0.95 for a black globe).
The NAI concentrations were measured by a KEC900+II negative oxygen ion monitor (Wanyi Technology Co., Ltd., Shenzhen, China) (measuring range: 10~2,000,000 ions/cm3; ion mobility: 0.15 cm2/(V·s)). The PM2.5 and PM10 concentrations were synchronously measured using a 3016IAQ handheld dust particle detector (Lighthouse Instruments Ltd., Charlottesville, VA, USA). The measuring range was 0–1000 µg/m3 and the instrument resolution was 0.1 µg/m3.
In this study, all measurements were performed during periods of sunny skies (pollution rating: good) and minimal wind (wind velocity: less than 2 m/s) in the summer (July–August 2021) to avoid significant differences in meteorological factors, such as cloud cover, precipitation, wind, and heavy pollution. Experiment A was conducted in July 2021, and Experiments B and C were conducted in early and late August 2021, respectively. In order to reduce the potential interference of measurement time variation on the mobile monitoring results, a bidirectional path movement monitoring method was adopted. The movement between measuring points was in a certain order (according to the sequence of plot number) on Day 1 and was reversed on Day 2. Two consecutive days of data monitoring were treated as a replication. In each experiment, data were monitored for six consecutive days, with three replicates. Data were collected from 8:00 a.m. to 18:00 p.m. Data were collected every two hours, a total of six times a day. All instruments were placed in the center of each community sample site and samples were taken at a height of 1.5 m above ground. Nine repeated measurements were taken at each measuring point.

2.3. Measurements of Canopy Characteristics

To measure the canopy density (CD), the canopy porosity (CP), leaf area index (LAI), and sky view factor (SVF) were selected to define the community canopy in the horizontal, vertical, and overall leaf volume dimensions, respectively. Within each plant community, nine measuring points were set at the positions shown in Figure 4. All canopy measurements were conducted on a cloudy day (without strong direct solar radiation) at a 1.5 m height at each measuring point. The mean of these nine measuring points was used to represent the CD, CP, LAI, and SVF values of each community.

2.4. Data Analysis

In this study, for each monitoring point, the mean value of the round-trip mobile data represented its observational value at this time. The averages of the six rounds of data monitoring were used to represent the daily averages of UTCI, NAI, PM2.5, and PM10. One-way ANOVA and Duncan’s method were carried out to examine the significant differences in the UTCI, NAI, PM2.5, and PM10 levels among plant communities. Pearson correlation was used to examine relationships among canopy parameters, UTCI, NAI, PM2.5, and PM10 concentrations. Relationships among these variables were visualized based on non-linear curve fitting. All statistical analyses were performed using SPSS 22.0 software (IBM Corp., Armonk, NY, USA). A p-value of < 0.05 was regarded as being statistically significant. Non-linear fitting was performed using Origin 2019 software (OriginLab Corp., Northampton, MA, USA).

3. Results

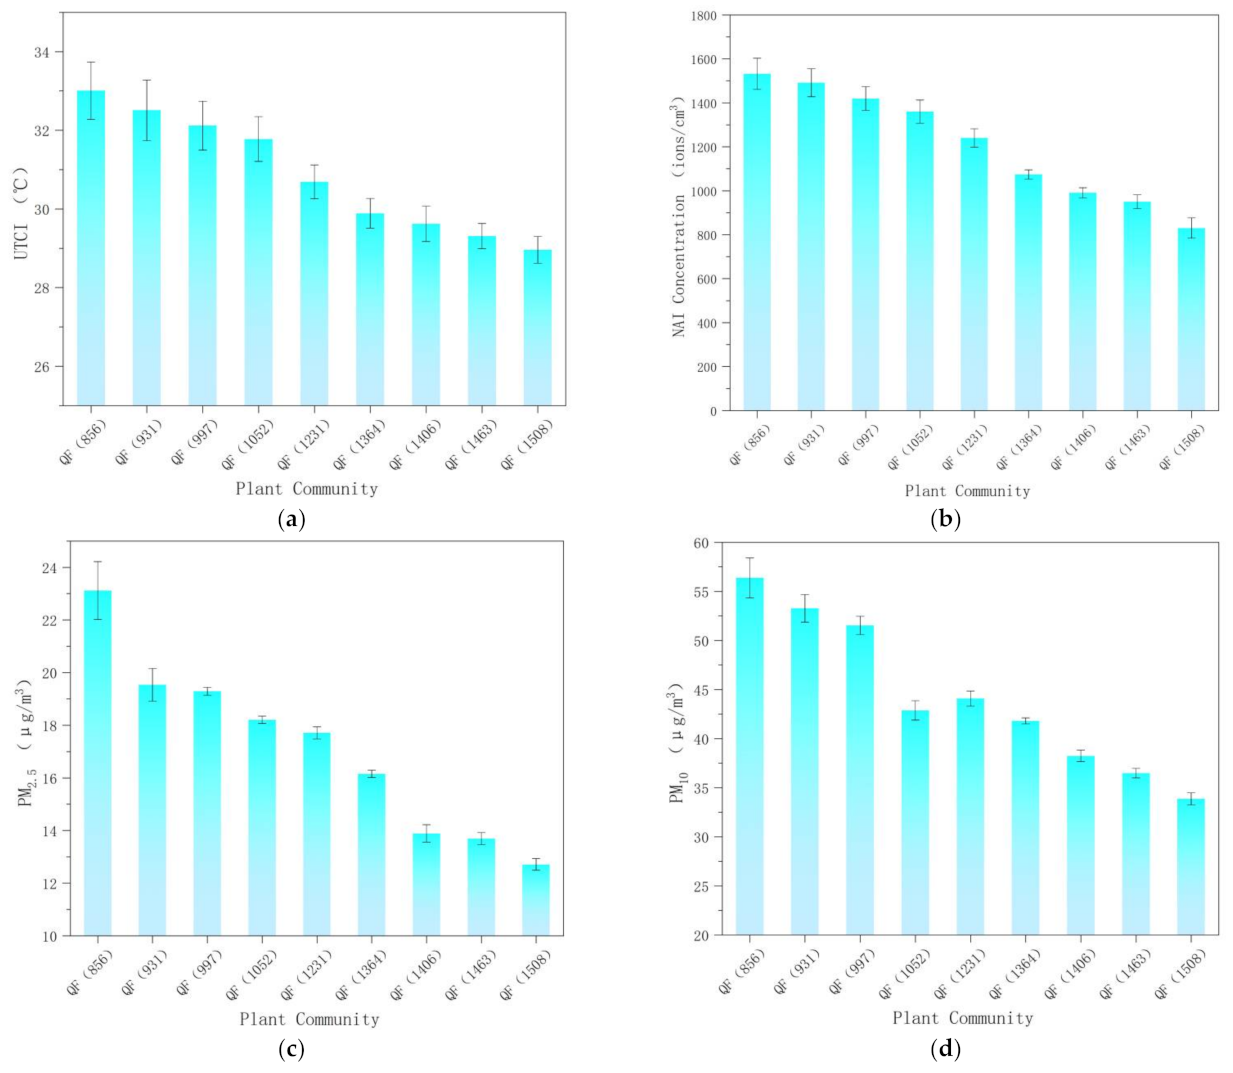
3.1. UTCI, NAI, PM2.5, and PM10 Levels of Quercus Variabilis Communities at Different Altitudes

3.1.1. Universal Thermal Climate Index (UTCI)

The UTCI values were divided into 10 different levels based on the degree of thermophysiological response of the human body [26,27] (Table 4). The daily average UTCI (dUTCI) of nine Quercus variabilis plant communities at different altitudes in the summer are shown in Figure 5a, with the superscript representing the results of multiple comparisons. The QF(1508) plant community had the lowest UTCI (28.96 ± 0.75 °C); the dUTCI gradually increased with the decrease in altitude. The QF(856) plant community reached the highest dUTCI (33.01 ± 0.73 °C), which was dramatically higher than the minimum value of 4.05 °C. ANOVA and Duncan’s analysis revealed significant differences among the nine Q. variabilis plant communities at different altitudes, having a p-value of < 0.01. The thermal stress category of the QF(856) plant community was “No thermal stress”, and that of the other plant communities at other elevations was “Moderate heat stress”. On the whole, the thermal environments of these plant communities in the nine elevations were at a comfortable level.

3.1.2. NAI Concentration

The daily average NAI (dNAI) concentrations of nine Quercus variabilis plant communities at different altitudes in the summer are shown in Figure 5b, with the superscript representing the results of multiple comparisons. The QF(1508) community had the lowest dNAI concentration (830 ± 46 ions/cm3), and the concentration of dNAI gradually increased with the decrease in altitude. The QF(856) community reached the highest dNAI concentration of 1533 ± 71 ions/cm3, which was dramatically higher than the minimum value of 703 ions/cm3. ANOVA and Duncan’s analysis revealed significant differences among the nine Q. variabilis plant communities at different altitudes, having a p-value of < 0.01.

3.1.3. PM2.5 and PM10 Concentrations

The daily average PM2.5 (dPM2.5) concentrations shown in Figure 5c revealed that the QF(1508) community had the lowest dPM2.5 concentration, with a value of merely 12.71 ± 0.22 µg/m3, followed by the QF(1463) community, with 13.69 ± 0.23 µg/m3. The QF(856) community featured the highest concentration (23.12 ± 1.10 µg/m3). The dPM2.5 of these nine plant communities ranked as follows: QF(1508) < QF(1463) < QF(1406) < QF(1364) < QF(1231) < QF(1052) < QF(997) < QF(931) < QF(856), with a range of 10.41 µg/m3 and with significant differences among the different plant communities (p < 0.01).
As for the daily average PM10 (dPM10) levels shown in Figure 5d, the difference among all nine plant communities was also significant (p < 0.01). QF(1508) had the lowest concentration, with a dPM10 of 33.87 ± 0.61 µg/m3, followed by the QF(1463) community, with 36.49 ± 0.48 µg/m3. The QF(856) community featured significantly higher dPM10 concentrations (56.38 ± 2.04 µg/m3) than the others, while the difference in the extreme values was 22.51 µg/m3.

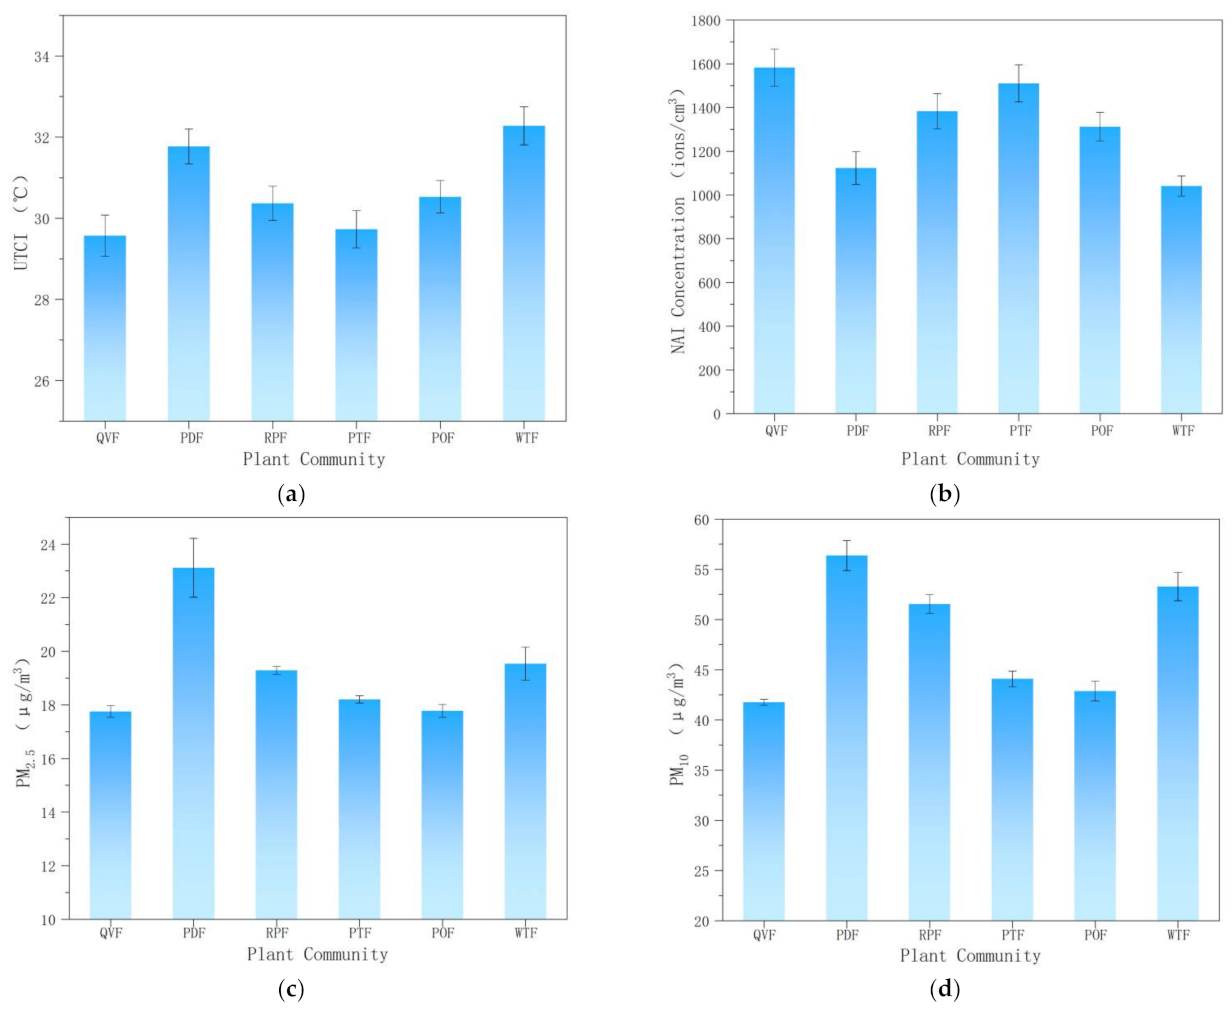
3.2. UTCI, NAI, PM2.5, and PM10 Levels of Different Plant Communities

3.2.1. Universal Thermal Climate Index (UTCI)

As shown in Figure 6a, the maximum dUTCI was recorded in the WTF plant community (32.28 ± 0.47 °C), followed by the PDF (31.77 ± 0.43 °C), POF (30.53 ± 0.40 °C), RPF (30.37 ± 0.42 °C), PTF (29.73 ± 0.46 °C), and QVF (29.57 ± 0.51 °C) plant communities. The minimum dUTCI was recorded in the QVF plant community (29.57 ± 0.51 °C). The difference between the extreme values was 2.71 °C. There were significant differences between the community types (p < 0.01). The thermal stress category of the five different plant communities was “Moderate heat stress”. On the whole, the thermal environments of these plant communities were at a comfortable level.

3.2.2. NAI Concentration

The dNAI concentrations of the six plant communities in the summer are shown in Figure 6b, where the superscript represents the result of multiple comparisons. The QVF plant community had the highest dNAI concentration (1583 ± 85 ions/cm3), followed by the PTF (1511 ± 85 ions/cm3), RPF (1383 ± 81 ions/cm3), POF (1313 ± 65 ions/cm3), PDF (1124 ± 75 ions/cm3), and WTF (1041 ± 47 ions/cm3) plant communities. The WTF plant community reached the lowest dNAI concentration of 1041 ± 47 ions/cm3, which was dramatically lower than the maximum value of 542 ions/cm3. ANOVA and Duncan’s analysis revealed significant differences among the six plant community types, having a p-value of <0.01.

3.2.3. PM2.5 and PM10 Concentrations

The dPM2.5 concentrations shown in Figure 6c revealed that the QVF plant community had the lowest dPM2.5 concentration, with a value of merely 17.76 ± 0.22 µg/m3, followed by the POF plant community (17.78 ± 0.24 µg/m3). The PDF plant community featured the highest dPM2.5 concentration (23.12 ± 1.10 µg/m3). The dPM2.5 of these six plant communities ranked as follows: QVF < POF < PTF < PRF < WTF < PDF, with a range of 5.36 µg/m3 and with significant differences between different plant community types (p < 0.01).
As for the dPM10 levels shown in Figure 6d, the difference among all six plant communities was also significant (p < 0.01). The QVF plant community had the lowest dPM10 concentration (41.76 ± 0.30 µg/m3), followed by POF (42.89 ± 0.99 µg/m3). PDF featured significantly higher dPM10 concentrations (56.38 ± 1.49 µg/m3) than the others, while the difference in extreme values was 14.62 µg/m3.

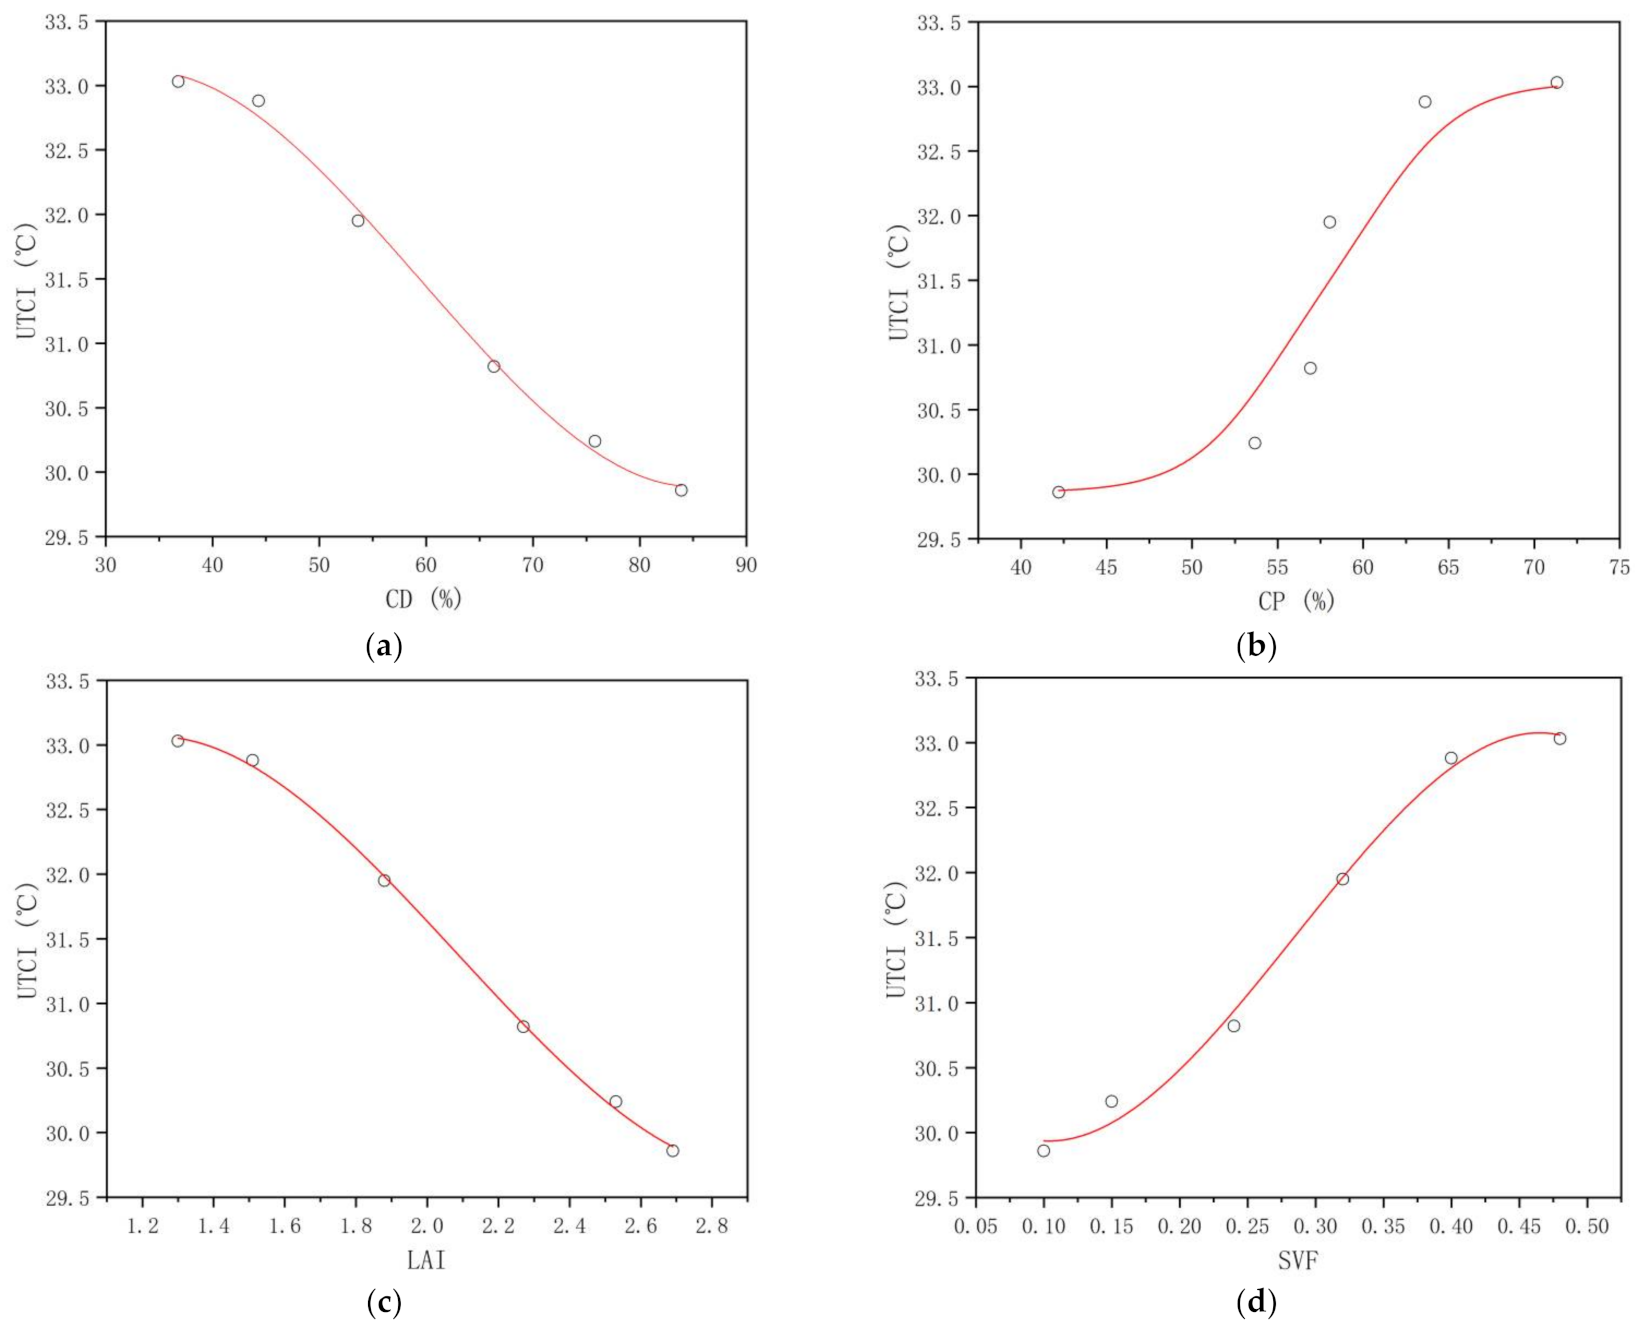
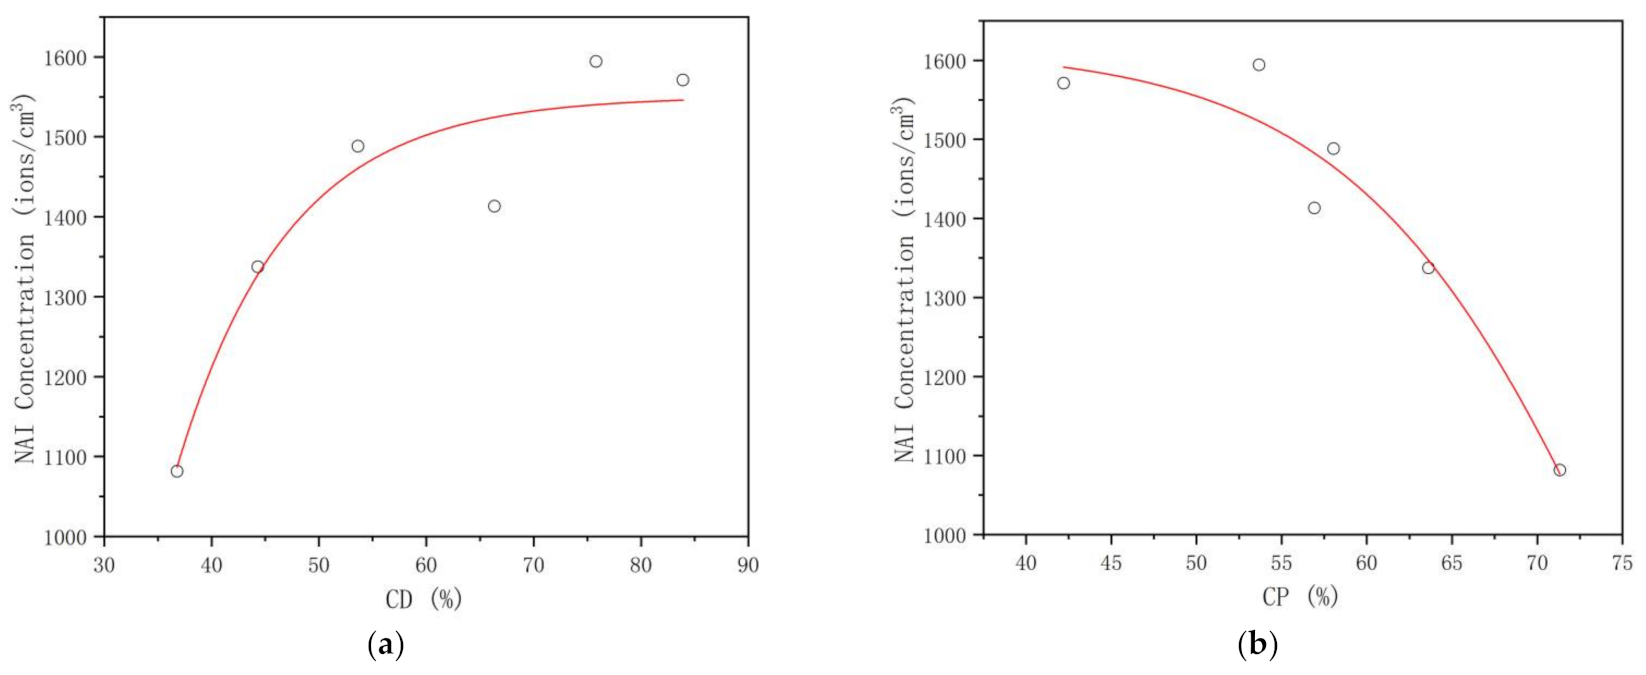
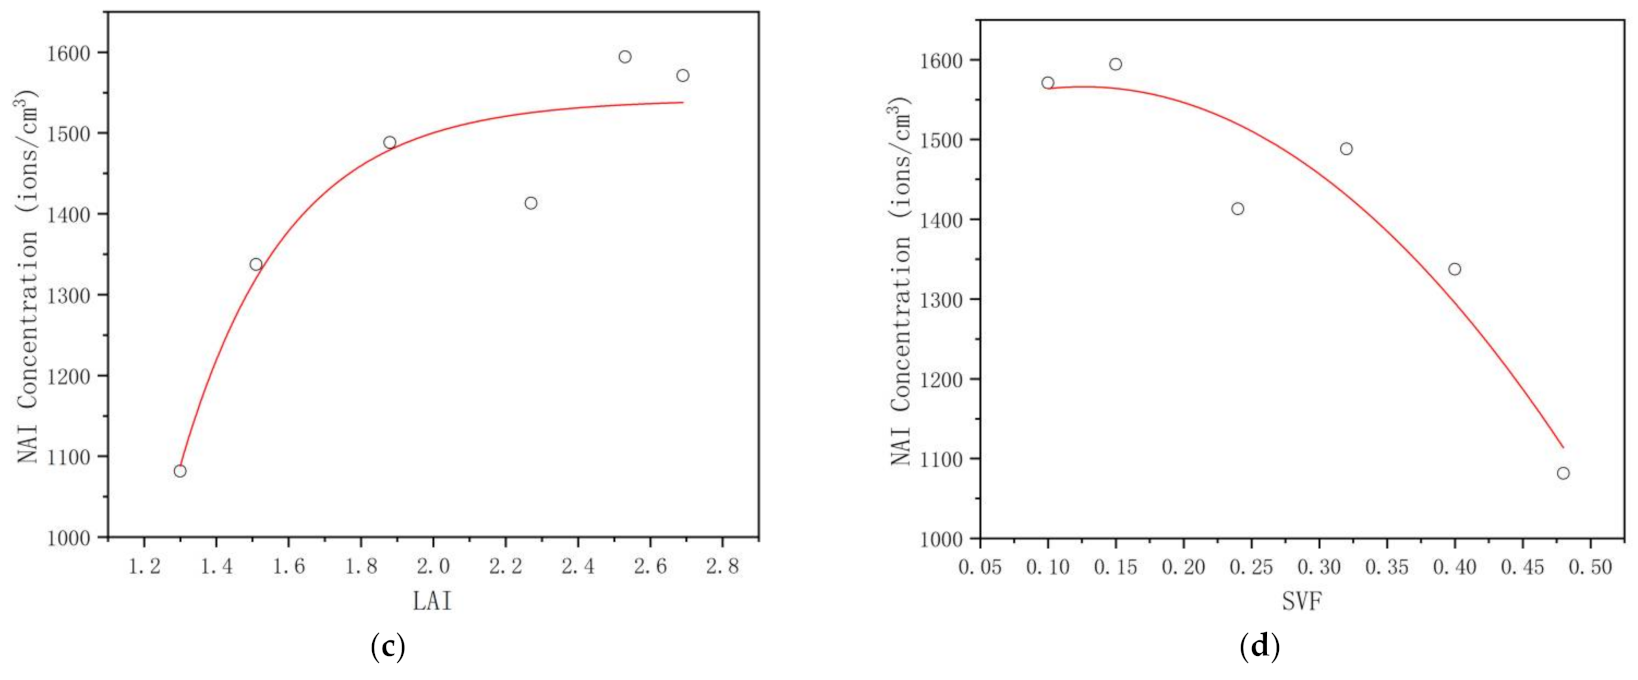
3.3. Response of the UTCI, NAI, PM2.5, and PM10 Levels to Canopy Characteristics of the Plant Communities

The canopy characteristics and the dUTCI, dNAI, dPM2.5, and dPM10 values of the six plant communities in Experiment C are shown in Table 5 and Table 6, respectively. To examine the effects of the canopy characteristics on the UTCI, NAI, and airborne particle levels, we analyzed the relationships between the dUTCI, dNAI, dPM2.5, and dPM10 levels and the canopy parameters by calculating Pearson’s correlation coefficients (cc), as shown in Table 6.

3.3.1. Universal Thermal Climate Index (UTCI)

The response of the dUTCI to the canopy characteristics of the plant communities is shown in Table 7 and Figure 7. The thermal stress category of the C1, C3, C4, and C5 plant communities was “No thermal stress”, and that of the C2 and C6 plant communities was “Moderate heat stress”. On the whole, the thermal environments of the plant communities with different canopy characteristics were at a comfortable level.
The results show that CD had a strong negative correlation with the dUTCI (cc = −0.992), and correlations reached high significance levels (sig. < 0.01). With increasing CD, the dUTCI gradually decreased. As CD increased to about 44.31%, the plant community had a positive effect on the dUTCI, although the dUTCI fell very slightly. Once the CD was over 75.82%, the fall in the dUTCI was obvious (Figure 7a). This indicates that 44.31~75.82% may be the key CD threshold in affecting the ambient dUTCI.
The results show that CP was found to be positively correlated with the dUTCI, where cc value = 0.909 and sig. < 0.05 (Table 7). The dUTCI changed less dramatically when CP fell below 53.68% (Figure 7b), while dramatic dUTCI changes were found between 53.68% and 63.63% CP, suggesting that plant communities with CP in this interval had marked cooling effects. However, when the plant community canopy became too porous in the horizontal direction, with CP larger than 63.63%, the cooling effect was extremely limited.
The dUTCI decreased significantly with increasing LAI, as indicated by the results shown in Table 7 and Figure 7c. Both parameters were correlated at a high level of significance (sig. < 0.01), with a cc value of −0.995. With increasing LAI, the reduction in the dUTCI changed slightly. When the LAI was between 1.88 and 2.27, the dUTCI changed most dramatically. The LAI between 1.88 and 2.27 was the key range affecting the dUTCI.
In contrast, a significant positive relationship between SVF and dUTCI was observed (cc = 0.986, sig. < 0.01). A lower SVF led to a lower dUTCI. This trend suggests that, when the SVF increased within the range of 0.10~0.40, the increment in dUTCI was significantly higher than that when the SVF was over 0.40 (Figure 7d). Therefore, an SVF between 0.1 and 0.4 is the key range for affecting the dUTCI, while 0.40 is the threshold for affecting the dUTCI. The relationship between the SVFs and dUTCI was quasilinear.

3.3.2. NAI Concentration

The response of the dNAI to the canopy characteristics of the plant communities is shown in Table 7 and Figure 8.
The results show that CD had a strong positive correlation with dNAIs (cc = 0.866), and correlations reached significant levels (sig. < 0.05). With increasing CD, dNAIs increased rapidly at first and then slowly (Figure 8a). As CD gradually increased from 36.79%, dNAIs began to rise rapidly. Once the CD was over 75.82%, dNAIs tended to be stable. This indicates that 36.79~75.82% may be a key CD range in affecting ambient dNAIs.
The results show that CP was found to be negatively correlated with dNAIs, with a cc value of −0.877 (sig. < 0.05, Table 6). dNAIs changed less dramatically when CP was below 58.06%, while dramatic dNAI changes were found when CP was between 58.06% and 71.33% (Figure 8b), suggesting that plant communities with CP in this interval markedly promoted NAI release. However, when the community canopy became too porous in the horizontal direction, with CP larger than 63.63%, this promotion effect was extremely limited.
The dNAIs increased significantly with increasing LAI, as indicated by the results shown in Table 6 and Figure 8c. The LAI was found to be positively correlated with dNAIs, with a cc value of 0.877 (sig. < 0.05, Table 7). With increasing LAI, dNAIs increased rapidly at first and then slowly (Figure 8c). As the LAI gradually increased from 1.30, dNAIs began to rise rapidly. Once the LAI was over 1.88, dNAIs tended to be stable. This indicates that 1.30~1.88 may be a key LAI range in affecting the ambient dNAIs.
In contrast, a significant negative relationship between the SVF and dNAIs was observed (cc = −0.899, sig. < 0.05). A lower SVF led to even higher dNAI concentrations. This trend suggests that, when the SVF increased within the range of 0.10~0.32, the decrement in the dNAIs was slightly lower than that when the SVF was over 0.32. However, this threshold was not well defined.

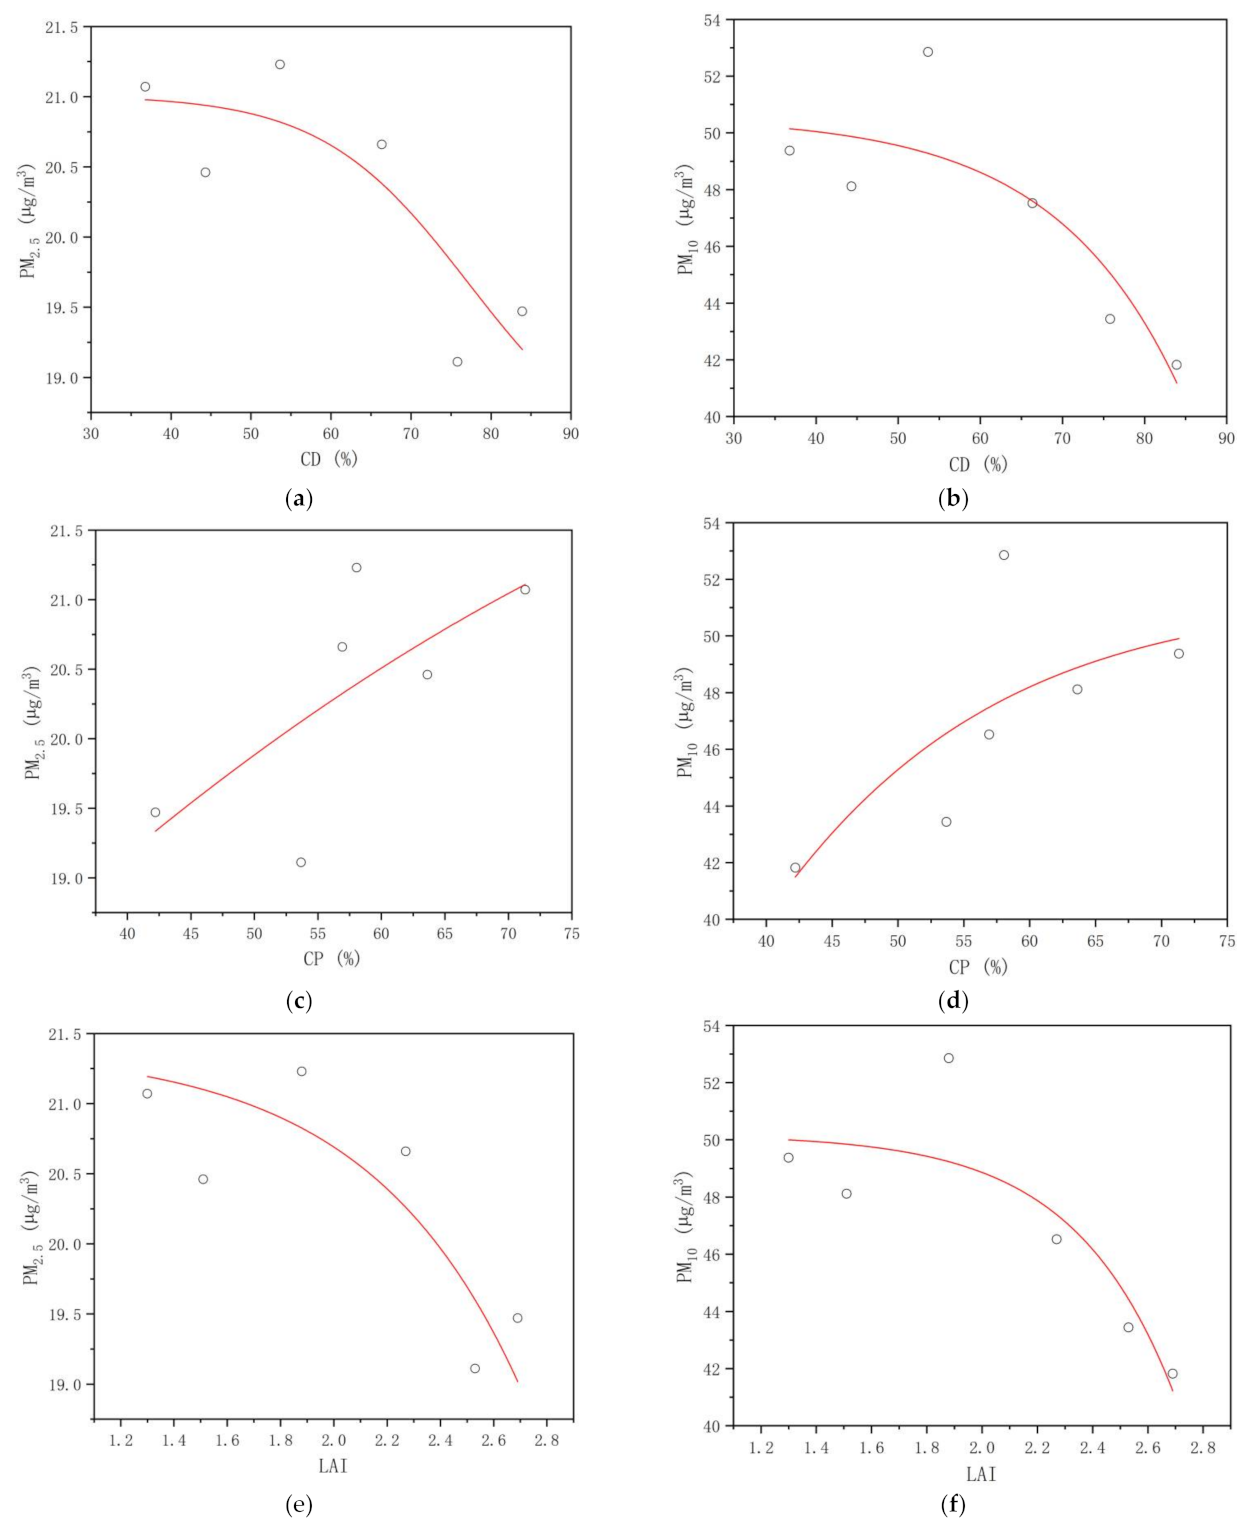
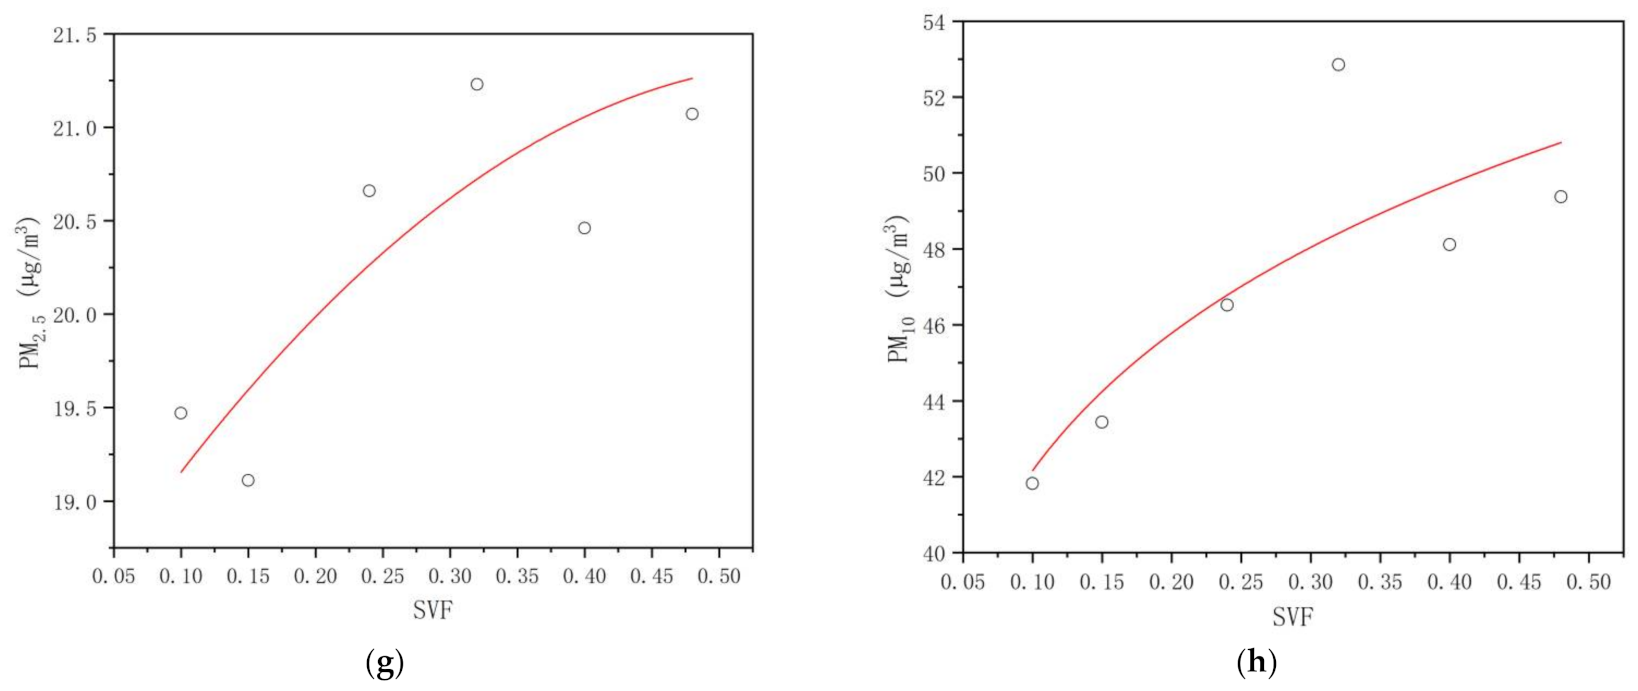
3.3.3. PM2.5 and PM10 Concentrations

The results in Table 6 show that dPM2.5 (cc = 0.792, sig. > 0.05) and dPM10 (cc = 0.692, sig. > 0.05) had no significant correlation with CD. However, Figure 9a,b show that the dPM2.5 and dPM10 concentrations tended to gradually decrease as CD increased. Furthermore, the reduction in dPM2.5 and dPM10 was significantly increased when CD increased to 66.37~83.92%. Of course, there were certain fluctuations in the decrease in dPM2.5 and dPM10 as CD increased. This indicates that an increase in canopy density is conducive to a reduction in the dPM2.5 and dPM10 concentrations, but this reduction has no significant quantitative relationship with the canopy density. From the fitting trend in Figure 9a,b, 66.37% was identified as the key CD threshold for effective PM2.5 and PM10 reduction.
The results show that dPM2.5 and dPM10 increased as CP increased (Figure 9c,d). dPM2.5 and dPM10 were positively correlated with CP (Table 7), but the correlations were not significant (both cc = 0.692, sig. > 0.05). The response of dPM2.5 and dPM10 to CP changes fluctuated significantly. With higher canopy porosity in the horizontal direction, the interception and filtration effects on dPM2.5 and dPM10 became weaker. There was no obvious inflection point to this fitting trend.
The dPM2.5 and dPM10 concentrations were negatively correlated with the LAI (the cc values were −0.763 and −0.755, respectively, and sig. was always greater than 0.05). As the LAI increased, dPM2.5 and dPM10 decreased (Figure 9e,f) with little fluctuation. Once the LAI exceeded 2.27 and continued to increase, the decline in dPM2.5 and dPM10 accelerated. Therefore, an LAI value of 2.27 may be the threshold for the community canopy to effectively reduce PM2.5 and PM10.
The results show that dPM2.5 and dPM10 increased as the SVF increased. A higher SVF led to higher dPM2.5 and dPM10 concentrations, with a quasilinear trend (Figure 9g,h). dPM2.5 and dPM10 were positively correlated with the SVF (Table 7), but the correlations were not significant (cc values were 0.794 and 0.767, respectively, and sig. was always greater than 0.05). With the increase in the SVF, the concentrations of dPM2.5 and dPM10 gradually increased, and there were obvious fluctuations in this process. These results indicate that plant communities with low SVF levels enhance the attenuation of fine particulate matter beneath the canopy, while plant communities with a high SVF have a weak attenuation effect on fine particulate matter beneath the canopy.

4. Discussion

4.1. Effects of Altitude on the UTCI, NAI, PM2.5, and PM10 Levels of Plant Communities in the Mountain Forest

In this study, altitude had a significant effect on the UTCI. With the increase in altitude, the mean dUTCI in the forest gradually decreased. The dUTCI had a significant linear correlation with altitude, and the dUTCI decreased by 0.62 °C on average for every 100 m increase in altitude. This is because temperature decreased linearly with the increase in altitude, and temperature played a major role in dUTCI changes. Previous studies have come to similar conclusions. The UTCI was calculated from four main indicators, namely temperature, radiation temperature, wind speed, and relative humidity, through a human thermal physiological regulation model and a clothing model [26]. Since altitude can affect meteorological indicators, such as temperature and relative humidity [31], the UTCI is also affected by altitude. In addition, altitude also has a certain impact on vegetation species [32] and canopy morphology [33], and the differences in these further affect the solar radiation and the microclimate in the forest [23,34,35], and ultimately have a comprehensive impact on the UTCI [34].
The results show that altitude had a significant effect on NAIs. With the increase in altitude, the mean dNAI value in the forest gradually decreased. dNAIs had a significant linear correlation with altitude, and dNAIs decreased by 108 ions/cm3 for every 100 m increase in the average altitude. With the increase in altitude, the temperature in the nine plant communities gradually decreased, and the NAI concentration in the plant communities also decreased. Previous studies have shown that the NAI concentration is greatly affected by air temperature, air humidity, and air pressure [16,20]. Elevation can significantly alter the meteorological microenvironment within a montane forest [31]. Therefore, altitude may have an indirect effect on the NAI concentration.
In this study, altitude had a significant effect on the concentration of particulate matter in the forest air. With the increase in altitude, the forest average dPM2.5 and dPM10 concentrations gradually decreased. The concentrations of dPM2.5 and dPM10 showed a significant linear correlation with altitude, and the concentrations of dPM2.5 and dPM10 decreased by 0.60 and 3.45 µg/m3, respectively, when the average altitude increased by 100 m. Particulate matter in the air, on the one hand, is indirectly affected by temperature and humidity changes caused by altitude changes [31,36]; on the other hand, the concentration of particulate matter in the air at different heights also has spatial differences [37]. In addition, the influence of human activities gradually decreases with the increase in altitude, which is also an aspect that affects the concentration of particulate matter in the air [6].

4.2. Effects of Plant Community Composition on the UTCI, NAI, PM2.5, and PM10 Levels in the Mountain Forest

The results show that there were significant differences in the UTCI of different plant communities. Compared with other plant communities, the QVF community had the lowest daily UTCI and the highest thermal comfort in the summer. This is because QVF plant communities have higher crowns, more leaves, higher canopy coverage, greater transpiration, and a greater capacity to intercept and absorb solar radiation. The plant community has the effect of cooling and humidifying in the summer [19,22,38]. Previous studies have found differences in temperature and humidity regulation among different tree species [23,34,39]. A community composed of tree species with thick canopy shade has strong cooling and humidification effects [20,23,34]. Coniferous species have strong shading and cooling effects, while broadleaved species have strong humidification effects [20,34]. In addition to species composition, the hierarchical structure, total biomass, and canopy characteristics of a community also affect that community’s cooling and humidification effects [19,22,34]. In addition to cooling and humidifying, the plant community can also change the wind speed and solar radiation in the forest [20,40]. In summary, changes in the temperature, humidity, wind speed, and solar radiation within a plant community can cause changes in thermal comfort.
The results show that there were significant differences in the dNAI concentrations of different plant communities. Compared with the six plant communities studied, the QVF and PTF communities had the highest dNAI concentrations, which is conducive to forest bathing. This is because QVF plant communities have a higher air relative humidity, and PTF plant communities are conifers with sharper plant leaf tips. Studies have shown that the NAI formation pathways in forest environments are mainly stimulated by the water shearing and weak discharge of plant leaf tips [41,42,43,44]. The more water there is in the environment (including flowing water, air water, and soil water), the more conducive it is to NAI release [43,45]; moreover, the more prominent the tips of the plant leaves are, the more conducive they are to NAI release [42,45]. Studies have also shown that the NAI concentrations in forests are influenced by meteorological factors, such as the relative humidity, temperature, and wind speed [16,42,45]. The NAI concentration is positively correlated with the relative humidity and temperature, and negatively correlated with the wind speed.
In this study, we found that the QVF plant community had abundant leaves, high amounts of shade, a thick canopy, and the greatest reduction in PM10. However, the QVF, PTF, and POF plant communities led to a strong reduction in PM2.5. Similarly, for particulate matter in the air, the composition of plant species determines the regulation effect on particulate matter of different sizes [22,40]. Studies have shown that conifers, with their smaller leaves but denser canopy, are effective at intercepting airborne particles [17,22]. In addition, some pine species secrete resin, making it difficult for the attached particles to re-enter the atmosphere [46]. In summary, trees are the main agents for removing air particles from green spaces, as their dense canopy and large total leaf area enhance their ability to absorb dust. In addition, some studies have found that some tree species with hairy leaves and rough leaf surfaces can delay airborne particles in severe air pollution periods, but when air pollutants are not significant, the delayed particles fall and form fine particles, such as PM2.5, in the surrounding air [47,48]. In the PDF plant community, the leaves are covered with hairs, and fine particles fall off when the wind blows, which may be the reason why the PM2.5 and PM10 concentrations in PDF plant communities are significantly higher than those in other plant communities. In addition, the difference in dPM10 between the six plant communities was more obvious than that of dPM2.5, indicating that the plant community composition had a greater impact on coarse particles than fine particles. Therefore, the QVF, PTF, and POF plant communities have sufficient leaf areas and low concentrations of PM2.5 and PM10 in the forest, which are suitable for forest bathing.

4.3. Critical Thresholds of the Plant Community Canopy’s Regulating Effects on the UTCI, NAI, PM2.5, and PM10 Levels in the Mountain Forest

In this study, the UTCI, which represents thermal comfort in the plant community, was significantly negatively correlated with the CD and LAI and significantly positively correlated with the CP and SVF of the plant community. The canopy characteristics affect the thermal regulation of plant communities [23,34,49]. Srivanit and Hokao’s study showed that CD was an important factor influencing the forest cooling effect [49]. Hardin’s study showed that the cooling effect of forests was significantly and positively correlated with the LAI [35]. Peters and McFadden’s study also showed that the thermal environment in plant communities was significantly correlated with the CD and LAI of plant communities [23]. In general, the vertical canopy density (CD and SVF) determines how much solar radiation a community can intercept and absorb, while the horizontal porosity (CP) affects the air exchange between the community and the surrounding environment [22]. When the canopy of a community is too dense horizontally, it blocks the flow of air beneath the canopy and slows down heat loss [34]. The LAI reflects the total amount of leaves in a community, which determines transpiration and shade [50]. All these affect the conversion of heat and humidity within and outside the plant community, and thus the thermal comfort. Therefore, the plant communities with a high CD and LAI, but a low CP and SVF, had greater cooling and humidification effects, and the UTCI within the community was closer to the comfort level, providing a more comfortable thermal environment for forest bathing in the summer.
In recent years, some scholars have attempted to discuss the critical threshold of vegetation canopy attributes that affect thermal comfort [22]. Fan et al. [22] found that plant communities have a slight cooling effect when the CD is between 50% and 60% and a significant cooling effect when the CD exceeds 60%. When the CD exceeds 70%, the cooling effect tends to be stable. In our study, there were some specific inflection points in the nonlinear responses between some canopy traits and the UTCI. When CD was greater than 75.82% or CP was less than 53.68%, the plant community had a significant cooling effect, and the UTCI reflected a greater degree of comfort. The results of the sub-study are similar to those of Fan et al. [22], but the difference lies in the fact that the critical threshold value of the vegetation canopy attributes in our study was relatively high because the background temperature of our study was lower than that of the forest studied by Zhu et al. [22]. In addition, in our study, we only discussed the effects of plant communities composed of the same tree species on thermal comfort, and more complex, mixed forest communities need to be further researched.
In our study, the dNAI concentration in the forest had a significant positive correlation with the CD and LAI (p < 0.05) and had a significant negative correlation with the CP and SVF (p < 0.05). The results of our study indicate that there is a quantitative relationship between the indirect effects of plant community canopy characteristics and the NAI concentration in mountain forests. In montane forests, the NAI concentration increased with the increase in the CD and LAI canopy characteristics, but decreased with the increase in CP and SVF. When CD was greater than 75.82%, the LAI was greater than 1.88, the CP was less than 63.63%, and the SVF was less than 0.32; the increase in the dNAI concentration in the forest tended to be stable, and the corresponding dNAI concentration in the community was the highest, which was more conducive to the promotion of forest bathing for physical and mental health in the summer. The canopy characteristics of plant communities have an indirect effect on NAI concentration in forests [45]. Studies have shown that the NAI concentration is directly proportional to air temperature and relative humidity, and inversely proportional to wind speed [16,45]. Studies have shown that plant communities have a significant influence on the microclimate environment in the forest, the plant canopy can be cooled and humidified in the summer, and the trees can also play a role in wind protection [19,34,51]. Therefore, the plant community can indirectly change the NAI concentration in a forest by changing the forest microclimate. Some studies have shown that there is a certain quantitative relationship between the canopy characteristics of plant communities and the influence of the forest microclimate [34,49,52], so we can guess that the indirect influence of the forest NAI concentration on the canopy characteristics of plant communities may also have a certain quantitative relationship.
PM2.5 and PM10 had a variable relationship with the canopy characteristics CD, CP, LAI, and SVF of plant communities [17,22,40]. Generally, when air carrying particulate matter passes through the canopy of a plant community, particulate matter is easily trapped and deposited on the surface of the branches, leaves, and stems of plants [17,22,47,48]. Therefore, when the canopies of plant communities have higher CD and LAI values and lower CP and SVF values, they can form a canopy structure with more branches and leaves in both the horizontal and vertical directions, and the dense canopy can intercept more air particles. Liu et al. [17] found that the forest canopy structure was the main reason for the difference in the PM2.5 concentration in different forests. Studies have shown that a canopy that is too sparse in a plant community is not conducive to the interception and absorption of PM2.5 and PM10 [17,22]. In our study, the response of dPM2.5 and dPM10 to the community canopy structure was nonlinear, and the correlation was not significant. Although dPM2.5 and dPM10 were not significantly correlated with CD, CP, LAI, and SVF, they also showed a certain trend: dPM2.5 and dPM10 decreased with the increase in CD and LAI and decreased with the decrease in CP and SVF. The reason for this result may be that our study time (summer) did not occur in the period of serious air pollution (winter and spring), and the background concentration of air particulate matter was low, which meant that the interception of air particulate matter by the plant community did not reach a significant level. In addition, compared with dPM10, dPM2.5 has a more complex response to the canopy structure of plant communities [48]. In this study, the average interception rate of plant communities to dPM10 was higher than that of dPM2.5. Studies have shown that a dense canopy can not only hinder the diffusion of PM2.5 into the upper atmosphere along with turbulent airflow, but also weaken the Brownian motion of particles under low-temperature and high-humidity conditions, and even increase the concentration of fine particles due to hygroscopic condensation [47,48,53,54,55]. Janhall’s findings suggest a similar result [56]. Therefore, based on our findings, we suggest that the vegetation barrier should be dense enough to provide a large deposition surface area, but porous enough to allow air infiltration and an upward diffusion of particles. According to the research results, when the canopies of the plant communities had higher CD and LAI values and lower CP and SVF values, the air in the mountain forest was cleaner and more conducive to forest bathing activities. Therefore, it is suggested that plant communities with a higher CD and LAI and a lower CP and SVF should be considered first when selecting forest bathing sites.
This study focused on the effects of altitude, plant community composition, and canopy characteristics on the UTCI, NAIs, and air particulate matter (PM2.5 and PM10) in mountainous forests on Qinling Mountain. This study is of guiding significance to the site selection of forest bathing sites and the promotion of forest bathing research. However, there are some limitations in this study. Firstly, although the study area and selected plant communities were representative of mountain forests, the number of samples and the duration of observation were limited due to the limitations of the monitoring conditions. Secondly, it must be noted that the research results reported in this paper may only be applicable to our study area and cannot be verified as a general conclusion. We urgently need future studies to support and confirm our findings.

5. Conclusions

In terms of the influence of altitude on the forest bathing microenvironment in the mountain forest, the results show that altitude had a significant influence on the UTCI, NAI, and air particulate matter (PM2.5 and PM10) levels in the summer. The dUTCI, dNAI, dPM2.5, and dPM10 levels gradually decreased with the increase in altitude. For every 100 m increase in altitude, the dUTCI decreased by 0.62 °C, the dNAI concentrations decreased by 108 ions/cm3, and the dPM2.5 and dPM10 concentrations decreased by 0.60 and 3.45 µg/m3, respectively. In terms of the effects of plant community species on the forest bath microenvironment, the results show that there were significant differences in dUTCI, dNAI, dPM2.5, and dPM10 levels among different plant communities in the summer. Among the six plant communities, the QVF plant community had the lowest dUTCI and the best thermal comfort evaluation in the summer. The QVF and PTF plant communities had the highest dNAI concentration, and the microenvironments of these two plant communities were most conducive to promoting physical and mental health through forest bathing. The QVF and PTF plant communities had a sufficient leaf area, and the concentrations of dPM2.5 and dPM10 in the microenvironment of these plant communities were low, which makes them suitable for forest bathing. In terms of the influence of plant community canopy characteristics on the forest bathing microenvironment, the results show that the characteristics of the plant community canopy, i.e., the CD, LAI, CP, and SVF, had significant effects on the dUTCI and dNAIs, but had no significant effects on air particulate matter (dPM2.5 and dPM10) in the summer. The plant community with a higher CD and LAI but a lower CP and SVF had a stronger cooling effect, promoted NAI release, and had higher dUTCI levels and a higher dNAI concentration, which indicates a more comfortable thermal environment and a microenvironment for forest bathing in the summer that promotes human physical and mental health.
In conclusion, QVF and PTF plant communities with a higher CD and LAI, but a lower CP and SVF at lower elevations are more suitable for forest bathing in the summer in mountainous forests at lower altitudes. The results of this study provide an economical, feasible, and sustainable guide for the location of forest bathing activities that promote physical and mental health. In addition, the results of this study can also provide guidance for urban and regional planning, and provide technical reference for urban residents to provide a better forest bathing environment.

Author Contributions

R.W., Q.C., and D.W. designed the study and experiment. R.W. and Q.C. collected the data. R.W. and Q.C. conducted the data analysis. R.W., Q.C., and D.W. provided the statistical methods. R.W., Q.C., and D.W. drafted the paper. R.W., Q.C., and D.W. edited the paper. All authors have read and agreed to the published version of the manuscript.

Funding

This research was funded by the National 12th Five-Year Scientific and Technological Support Plan (grant no. 2015BAD07B06).

Institutional Review Board Statement

Not applicable.

Informed Consent Statement

Not applicable.

Data Availability Statement

The data presented in this study are within the article.

Acknowledgments

We wish to express our thanks for the support received from the administration of the Taibai Mountain National Forest Park, China, and for allowing us to collect samples. The authors also sincerely appreciate the helpful and constructive comments provided by the reviewers of the draft manuscript.

Conflicts of Interest

The authors declare that there are no conflict of interest.

References

  1. Kalnay, E.; Cai, M. Impact of urbanization and land-use change on climate. Nature 2003, 423, 528–531. [Google Scholar] [CrossRef] [PubMed]
  2. Dong, H.; Xue, M.; Xiao, Y.; Liu, Y. Do carbon emissions impact the health of residents? Considering China’s industrialization and urbanization. Sci. Total Environ. 2021, 758, 143688. [Google Scholar] [CrossRef] [PubMed]
  3. Meinshausen, M.; Meinshausen, N.; Hare, W.; Raper, S.C.; Frieler, K.; Knutti, R.; Frame, D.J.; Allen, M.R. Greenhouse-gas emission targets for limiting global warming to 2 degrees C. Nature 2009, 458, 1158–1162. [Google Scholar] [CrossRef] [PubMed]
  4. Liang, W.; Yang, M. Urbanization, economic growth and environmental pollution: Evidence from China. Sustain. Comput.-Inf. 2019, 21, 1–9. [Google Scholar] [CrossRef]
  5. Zhao, L.; Lee, X.; Smith, R.B.; Oleson, K. Strong contributions of local background climate to urban heat islands. Nature 2014, 511, 216–219. [Google Scholar] [CrossRef]
  6. Kampa, M.; Castanas, E. Human health effects of air pollution. Environ. Pollut. 2008, 151, 362–367. [Google Scholar] [CrossRef]
  7. Tan, J.; Zheng, Y.; Tang, X.; Guo, C.; Li, L.; Song, G.; Zhen, X.; Yuan, D.; Kalkstein, A.J.; Li, F. The urban heat island and its impact on heat waves and human health in Shanghai. Int. J. Biometeorol. 2010, 54, 75–84. [Google Scholar] [CrossRef]
  8. Dominici, F.; Peng, R.D.; Barr, C.D.; Bell, M.L. Protecting Human Health from Air Pollution. Epidemiology 2010, 21, 187–194. [Google Scholar] [CrossRef] [Green Version]
  9. Hansen, M.M.; Reo, J.; Kirsten, T. Shinrin-Yoku (Forest Bathing) and Nature Therapy: A State-of-the-Art Review. Int. J. Environ. Res. Public Health 2017, 14, 851. [Google Scholar] [CrossRef] [Green Version]
  10. Han, J.; Choi, H.; Jeon, Y.; Yoon, C.; Woo, J.; Kim, W. The Effects of Forest Therapy on Coping with Chronic Widespread Pain: Physiological and Psychological Differences between Participants in a Forest Therapy Program and a Control Group. Int. J. Environ. Res. Public Health 2016, 13, 255. [Google Scholar] [CrossRef] [Green Version]
  11. Lee, J.; Tsunetsugu, Y.; Takayama, N.; Park, B.; Li, Q.; Song, C.; Komatsu, M.; Ikei, H.; Tyrvainen, L.; Kagawa, T. Influence of Forest Therapy on Cardiovascular Relaxation in Young Adults. Evid.-Based Complement. Altern. 2014, 2014, 834360. [Google Scholar] [CrossRef] [PubMed]
  12. Jia, B.B.; Yang, Z.X.; Mao, G.X.; Lyu, Y.D.; Wen, X.L.; Xu, W.H.; Lyu, X.L.; Cao, Y.B.; Wang, G.F. Health Effect of Forest Bathing Trip on Elderly Patients with Chronic Obstructive Pulmonary Disease. Biomed. Environ. Sci. 2016, 29, 212–218. [Google Scholar] [PubMed]
  13. Kim, W.; Lim, S.; Chung, E.; Woo, J. The Effect of Cognitive Behavior Therapy-Based Psychotherapy Applied in a Forest Environment an Physiological Changes and Remission of Major Depressive Disorder. Psychiatry Investig. 2009, 6, 245–254. [Google Scholar] [CrossRef]
  14. Janeczko, E.; Bielinis, E.; Wojcik, R.; Woznicka, M.; Kedziora, W.; Lukowski, A.; Elsadek, M.; Szyc, K.; Janeczko, K. When Urban Environment Is Restorative: The Effect of Walking in Suburbs and Forests on Psychological and Physiological Relaxation of Young Polish Adults. Forests 2020, 11, 591. [Google Scholar] [CrossRef]
  15. Song, C.; Ikei, H.; Igarashi, M.; Takagaki, M.; Miyazaki, Y. Physiological and Psychological Effects of a Walk in Urban Parks in Fall. Int. J. Environ. Res. Public Health 2015, 12, 14216–14228. [Google Scholar] [CrossRef] [PubMed]
  16. Chen, Q.; Wang, R.; Zhang, X.; Liu, J.; Wang, D. Effects of Different Site Conditions on the Concentration of Negative Air Ions in Mountain Forest Based on an Orthogonal Experimental Study. Sustainability 2021, 13, 12012. [Google Scholar] [CrossRef]
  17. Liu, X.; Yu, X.; Zhang, Z. PM2.5 Concentration Differences between Various Forest Types and Its Correlation with Forest Structure. Atmosphere 2015, 6, 1801–1815. [Google Scholar] [CrossRef] [Green Version]
  18. Sahar, S.; Zhang, H.; Chi, X.; Felix, M.; Li, H. The influence of spatial configuration of green areas on microclimate and thermal comfort. Urban For. Urban Green. 2018, 34, S945839190. [Google Scholar]
  19. Salbitano, F. Thermal Comfort and Perceptions of the Ecosystem Services and Disservices of Urban Trees in Florence. Forests 2021, 12, 1387. [Google Scholar]
  20. Zhu, S.; Hu, F.; He, S.; Qiu, Q.; Su, Y.; He, Q.; Li, J. Comprehensive Evaluation of Healthcare Benefits of Different Forest Types: A Case Study in Shimen National Forest Park, China. Forests 2021, 12, 207. [Google Scholar] [CrossRef]
  21. Zhang, Z.; Long, T.; He, G.; Wei, M.; Tang, C.; Wang, W.; Wang, G.; She, W.; Zhang, X. Study on Global Burned Forest Areas Based on Landsat Data. Photogramm. Eng. Remote Sens. 2020, 86, 503–508. [Google Scholar] [CrossRef]
  22. Fan, S.; Zhang, M.; Li, Y.; Li, K.; Dong, L. Impacts of Composition and Canopy Characteristics of Plant Communities on Microclimate and Airborne Particles in Beijing, China. Sustainability 2021, 14, 4791. [Google Scholar] [CrossRef]
  23. Peters, E.B.; Mcfadden, J.P. Influence of seasonality and vegetation type on suburban microclimates. Urban Ecosyst. 2010, 13, 443–460. [Google Scholar] [CrossRef] [Green Version]
  24. Yan, X.; Wang, H.; Hou, Z.; Wang, S.; Zhang, D.; Xu, Q.; Tokola, T. Spatial analysis of the ecological effects of negative air ions in urban vegetated areas: A case study in Maiji, China. Urban For. Urban Green. 2015, 13, 94791. [Google Scholar] [CrossRef]
  25. de Freitas, C.R.; Grigorieva, E.A. A comparison and appraisal of a comprehensive range of human thermal climate indices. Int. J. Biometeorol. 2017, 61, 487–512. [Google Scholar] [CrossRef] [PubMed]
  26. De Jendritzky, G.; Dear, R.; Havenith, G. UTCI-Why another thermal index? Int. J. Biometeorol. 2012, 56, 421–428. [Google Scholar] [CrossRef] [PubMed] [Green Version]
  27. Brode, P.; Fiala, D.; Błażejczyk, A.; Ejczyk, K.; Holmér, I.; Jendritzky, G.; Kampmann, B.; Tinz, B.; Havenith, G. Deriving the operational procedure for the Universal Thermal Climate Index (UTCI). Int. J. Biometeorol. 2012, 56, 481–494. [Google Scholar] [CrossRef] [Green Version]
  28. Potchter, O.; Cohen, P.; Lin, T.P.; Matzarakis, A. Outdoor human thermal perception in various climates: A comprehensive review of approaches, methods and quantification. Sci. Total Environ. 2018, 631, 390–406. [Google Scholar] [CrossRef]
  29. Xu, M.; Hong, B.; Jiang, R.; An, L.; Zhang, T. Outdoor thermal comfort of shaded spaces in an urban park in the cold region of China. Build. Environ. 2019, 155, 408–420. [Google Scholar] [CrossRef]
  30. ISO 7726. Thermal Environment-Instruments and Method for Measuring Physical Quantities. International Organization for Standardization, Case postale 56, 1211 Genève, Switzerland, 1 July 1985. 39p. Illus. Available online: http://www.ilo.org/dyn/cisdoc2/cismain.details?p_lang=es&p_doc_id=44729 (accessed on 15 February 2022).
  31. Chen, Y.; Chang, Z.; Xu, S.; Qi, P.; Tang, X.; Song, Y.; Liu, D. Altitudinal Gradient Characteristics of Spatial and Temporal Variations of Snowpack in the Changbai Mountain and Their Response to Climate Change. Water 2021, 13, 3580. [Google Scholar] [CrossRef]
  32. Jing, Y.; Fang, M.; Ohsawa Tatuo, K. Vertical vegetation zones along 30° N latitude in humid East Asia. Plant Ecol. 1996, 126, 135–149. [Google Scholar]
  33. Rajsnerova, P.; Klem, K.; Holub, P.; Novotna, K.; Vecerova, K.; Kozacikova, M.; Rivas-Ubach, A.; Sardans, J.; Marek, M.V.; Penuelas, J. Morphological, biochemical and physiological traits of upper and lower canopy leaves of European beech tend to converge with increasing altitude. Tree Physiol. 2015, 35, 47–60. [Google Scholar] [CrossRef] [PubMed] [Green Version]
  34. Lin, W.; Zeng, C.; Lam, N.N.; Liu, Z.; Tao, J.; Zhang, X.; Lyu, B.; Li, N.; Li, D.; Chen, Q. Study of the relationship between the spatial structure and thermal comfort of a pure forest with four distinct seasons at the microscale level. Urban For. Urban Green. 2021, 62, 127168. [Google Scholar] [CrossRef]
  35. Hardin, P.J.; Jensen, R.R. The effect of urban leaf area on summertime urban surface kinetic temperatures: A Terre Haute case study. Urban For. Urban Green. 2007, 6, 63–72. [Google Scholar] [CrossRef]
  36. Jones, A.M.; Harrison, R.M. The effects of meteorological factors on atmospheric bioaerosol concentrations—A review. Sci. Total Environ. 2004, 326, 151–180. [Google Scholar] [CrossRef] [PubMed]
  37. Ye, W.; Hao, J.; Fu, L.; Wang, Z.; Tang, U. Vertical and horizontal profiles of airborne particulate matter near major roads in Macao, China. Atmos. Environ. 2002, 36, 4907–4918. [Google Scholar]
  38. Lee, L.; Jim, C.Y. Urban woodland on intensive green roof improved outdoor thermal comfort in subtropical summer. Int. J. Biometeorol. 2019, 63, 895–909. [Google Scholar] [CrossRef]
  39. Zheng, B.; Bedra, K.B.; Zheng, J.; Wang, G. Combination of Tree Configuration with Street Configuration for Thermal Comfort Optimization under Extreme Summer Conditions in the Urban Center of Shantou City, China. Sustainability 2018, 10, 4192. [Google Scholar] [CrossRef] [Green Version]
  40. Rui, L.; Riccardo, B.; Gao, Z.; Ding, W.; Shen, J. The Impact of Green Space Layouts on Microclimate and Air Quality in Residential Districts of Nanjing, China. Forests 2018, 9, 224. [Google Scholar] [CrossRef] [Green Version]
  41. Ling, X.; Jayaratne, R.; Morawska, L. Air ion concentrations in various urban outdoor environments. Atmos. Environ. 2010, 44, 2186–2193. [Google Scholar] [CrossRef] [Green Version]
  42. Li, C.; Xie, Z.; Chen, B.; Kuang, K.; Xu, D.; Liu, J.; He, Z. Different Time Scale Distribution of Negative Air Ions Concentrations in Mount Wuyi National Park. Int. J. Environ. Res. Public Health 2021, 18, 5037. [Google Scholar] [CrossRef] [PubMed]
  43. Iwama, H. Negative air ions created by water shearing improve erythrocyte deformability and aerobic metabolism. Indoor Air 2004, 14, 293–297. [Google Scholar] [CrossRef] [PubMed]
  44. Wang, J.; Li, S. Changes in negative air ions concentration under different light intensities and development of a model to relate light intensity to directional change. J. Environ. Manag. 2009, 90, 2746–2754. [Google Scholar] [CrossRef] [PubMed]
  45. Miao, S.; Zhang, X.; Han, Y.; Sun, W.; Liu, C.; Yin, S. Random Forest Algorithm for the Relationship between Negative Air Ions and Environmental Factors in an Urban Park. Atmosphere 2018, 9, 463. [Google Scholar] [CrossRef] [Green Version]
  46. Kwak, M.J.; Lee, J.; Kim, H.; Park, S.; Lim, Y.; Kim, J.E.; Baek, S.G.; Seo, S.M.; Kim, K.N.; Woo, S.Y. The Removal Efficiencies of Several Temperate Tree Species at Adsorbing Airborne Particulate Matter in Urban Forests and Roadsides. Forests 2019, 10, 960. [Google Scholar] [CrossRef] [Green Version]
  47. Lu, S.; Yang, X.; Li, S.; Chen, B.; Jiang, Y.; Wang, D.; Xu, L. Effects of plant leaf surface and different pollution levels on PM2.5 adsorption capacity. Urban For. Urban Green. 2018, 34, 64–70. [Google Scholar] [CrossRef]
  48. Zhang, W.; Wang, B.; Niu, X. Study on the Adsorption Capacities for Airborne Particulates of Landscape Plants in Different Polluted Regions in Beijing (China). Int. J. Environ. Res. Public Health 2015, 12, 9623–9638. [Google Scholar] [CrossRef] [Green Version]
  49. Srivanit, M.; Hokao, K. Evaluating the cooling effects of greening for improving the outdoor thermal environment at an institutional campus in the summer. Build. Environ. 2013, 66, 158–172. [Google Scholar] [CrossRef]
  50. Wang, X.; Cheng, H.; Xi, J.; Yang, G.; Zhao, Y. Relationship between Park Composition, Vegetation Characteristics and Cool Island Effect. Sustainability 2018, 10, 587. [Google Scholar] [CrossRef] [Green Version]
  51. Massetti, L.; Petralli, M.; Napoli, M.; Brandani, G.; Orlandini, S.; Pearlmutter, D. Effects of deciduous shade trees on surface temperature and pedestrian thermal stress during summer and autumn. Int. J. Biometeorol. 2019, 63, 467–479. [Google Scholar] [CrossRef]
  52. Afshar, N.K.; Karimian, Z.; Doostan, R.; Nokhandan, M.H. Influence of planting designs on winter thermal comfort in an urban park. J. Environ. Eng. Landsc. 2018, 26, 232–240. [Google Scholar] [CrossRef]
  53. Cao, Z.; Wu, X.; Wang, T.; Zhao, Y.; Zhao, Y.; Wang, D.; Chang, Y.; Wei, Y.; Yan, G.; Fan, Y. Characteristics of airborne particles retained on conifer needles across China in winter and preliminary evaluation of the capacity of trees in haze mitigation. Sci. Total Environ. 2022, 806, 150704. [Google Scholar] [CrossRef] [PubMed]
  54. Tong, Z.; Whitlow, T.H.; MacRae, P.F.; Landers, A.J.; Harada, Y. Quantifying the effect of vegetation on near-road air quality using brief campaigns. Environ. Pollut. 2015, 201, 141–149. [Google Scholar] [CrossRef] [PubMed]
  55. Jin, S.; Guo, J.; Wheeler, S.; Kan, L.; Che, S. Evaluation of impacts of trees on PM2.5 dispersion in urban streets. Atmos. Environ. 2014, 99, 277–287. [Google Scholar] [CrossRef]
  56. Janhall, S. Review on urban vegetation and particle air pollution–Deposition and dispersion. Atmos. Environ. 2015, 105, 130–137. [Google Scholar] [CrossRef]
Figure 1. Locations of the nine plant community sites. The black squares in the figure represent the selected plant community sites. The dotted lines in the figure represent mountain roads.
Sustainability 14 03882 g001
Figure 2. Photographs of the six selected plant communities. The six plant communities are as follows: (a) the Quercus variabilis forest (QVF); (b) the Populus davidiana forest (PDF); (c) the Robinia pseudoacacia forest (RPF); (d) the Pinus tabuliformis forest (PTF); (e) the Platycladus orientalis forest (POF); (f) the weed-tree forest (WTF).
Sustainability 14 03882 g002
Figure 3. Fisheye lens photographs of the six selected plant communities. The six plant communities are as follows: (a) C1; (b) C2; (c) C3; (d) C4; (e) C5; (f) C6. The codes (C1 etc.) are described in Table 3.
Sustainability 14 03882 g003
Figure 4. Schematic diagram of the measuring points of canopy density (CD), leaf area index (LAI), and sky view factor (SVF) in the sample community.
Sustainability 14 03882 g004
Figure 5. Daily average levels of UTCI (a), NAI (b), PM2.5 (c), and PM10 (d) of Quercus variabilis communities at different altitudes. The codes (QF(856) etc.) are described in Table 1.
Sustainability 14 03882 g005
Figure 6. Daily average levels of the UTCI (a), NAI (b), PM2.5 (c), and PM10 (d) of different plant communities.
Sustainability 14 03882 g006
Figure 7. Non-linear fitting relationships (a) between the canopy density and daily average UTCI, (b) between the canopy porosity and daily average UTCI, (c) between the leaf area index and daily average UTCI, and (d) between the sky view factor and daily average UTCI.
Sustainability 14 03882 g007
Figure 8. Non-linear fitting relationships (a) between the canopy density and daily average NAIs, (b) between the canopy porosity and daily average NAIs, (c) between the leaf area index and daily average NAIs, and (d) between the sky view factor and daily average NAIs.
Sustainability 14 03882 g008aSustainability 14 03882 g008b
Figure 9. Non-linear fitting relationship (a) between the canopy density and daily average PM2.5, (b) between the canopy density and daily average PM10, (c) between the canopy porosity and daily average PM2.5, (d) between the canopy porosity and daily average PM10, (e) between the leaf area index and daily average PM2.5, (f) between the leaf area index and daily average PM10, (g) between the sky view factor and daily average PM2.5, and (h) between the sky view factor and daily average PM10.
Sustainability 14 03882 g009aSustainability 14 03882 g009b
Table 1. Details of the sampling community for the altitude experiment.
No.Sample CodeAltitude
(m)
Plant CommunityAverage
Height (m)
Canopy
Density
Average
DBH (cm)
A1QF856856Quercus variabilis forest16.810.6819.82
A2QF931931Quercus variabilis forest16.720.7020.45
A3QF997997Quercus variabilis forest18.450.6522.64
A4QF10521052Quercus variabilis forest15.290.7321.26
A5QF12311231Quercus variabilis forest17.930.6224.47
A6QF13641364Quercus variabilis forest16.570.6823.70
A7QF14061406Quercus variabilis forest16.050.7121.95
A8QF14631463Quercus variabilis forest15.700.6922.51
A9QF15081508Quercus variabilis forest15.160.7020.23
Note: DBH, diameter at breast height.
Table 2. Details of the sampling community for the community experiment.
No.Composition
Types
Altitude
(m)
Plant CommunityAverage
Height (m)
Canopy
Density
Average DBH
(cm)
B1QVF956Quercus variabilis forest16.770.7318.84
B2PDF937Populus davidiana forest13.310.5317.43
B3RPF863Robinia pseudoacacia forest9.280.6413.57
B4PTF876Pinus tabuliformis forest12.830.5815.28
B5POF921Platycladus orientalis forest8.140.6512.35
B6WTF834Weed-tree forest7.620.6710.26
Table 3. Details of the sampling community for the community canopy experiment.
No.Altitude (m)Plant CommunityAverage Height (m)Canopy DensityAverage DBH (cm)
C1924Quercus variabilis forest23.8383.9217.03
C2909Quercus variabilis forest21.1875.8219.24
C3896Quercus variabilis forest16.3466.3723.61
C4871Quercus variabilis forest17.6753.6426.77
C5933Quercus variabilis forest16.8644.3124.58
C6859Quercus variabilis forest14.2536.7928.23
Table 4. Universal Thermal Climate Index (UTCI) for different stress categories.
Stress CategoryStandard UTCI (°C) RangeUTCI (°C) Range (Shaanxi Province, China) [29]
Extreme heat stress>46>42.1
Very strong heat stress38 to 4640.6 to 42.1
Strong heat stress32 to 3836.0 to 40.6
Moderate heat stress26 to 3229.1 to 36.0
No thermal stress9 to 2618.0 to 29.1
Slight cold stress9 to 011.3 to 18.0
Moderate cold stress0 to −137.8 to 11.3
Strong cold stress−13 to −274.2 to 7.8
Very strong cold stress−27 to −402.0 to 4.2
Extreme cold stress<−40<2.0
Table 5. Canopy parameters of the sampling community.
No.CD (%)CP (%)LAISVF
C183.9242.212.690.10
C275.8253.682.530.15
C366.3756.922.270.24
C453.6458.061.880.32
C544.3163.631.510.40
C636.7971.331.300.48
Table 6. Daily average levels of UTCI, NAI, PM2.5, and PM10 within the sampling community.
No.dUTCI (°C)dNAI (ions/cm3)dPM2.5 (µg/m3)dPM10 (µg/m3)
C129.861571.0319.4741.82
C230.241594.1719.1143.44
C330.821413.1120.6646.52
C431.951488.3421.2352.85
C532.881337.2620.4648.11
C633.031081.6321.0749.37
Table 7. Correlation between the UTCI, NAI, PM2.5, and PM10 levels and the community canopy parameters.
No.CDCPLAISVF
ccSig.ccSig.ccSig.ccSig.
dUTCI−0.992 **0.0000.909 *0.012−0.995 **0.0000.986 **0.000
dNAI0.866 *0.026−0.877 *0.0220.877 *0.022−0.899 *0.015
dPM2.5−0.7920.0600.6920.127−0.7630.0780.7940.060
dPM10−0.7930.0600.6920.128−0.7550.0750.7670.075
Note: cc refers to the correlation coefficient; sig. refers to significance; * significant at p ≤ 0.05; ** significant at p ≤ 0.01.
Publisher’s Note: MDPI stays neutral with regard to jurisdictional claims in published maps and institutional affiliations.

