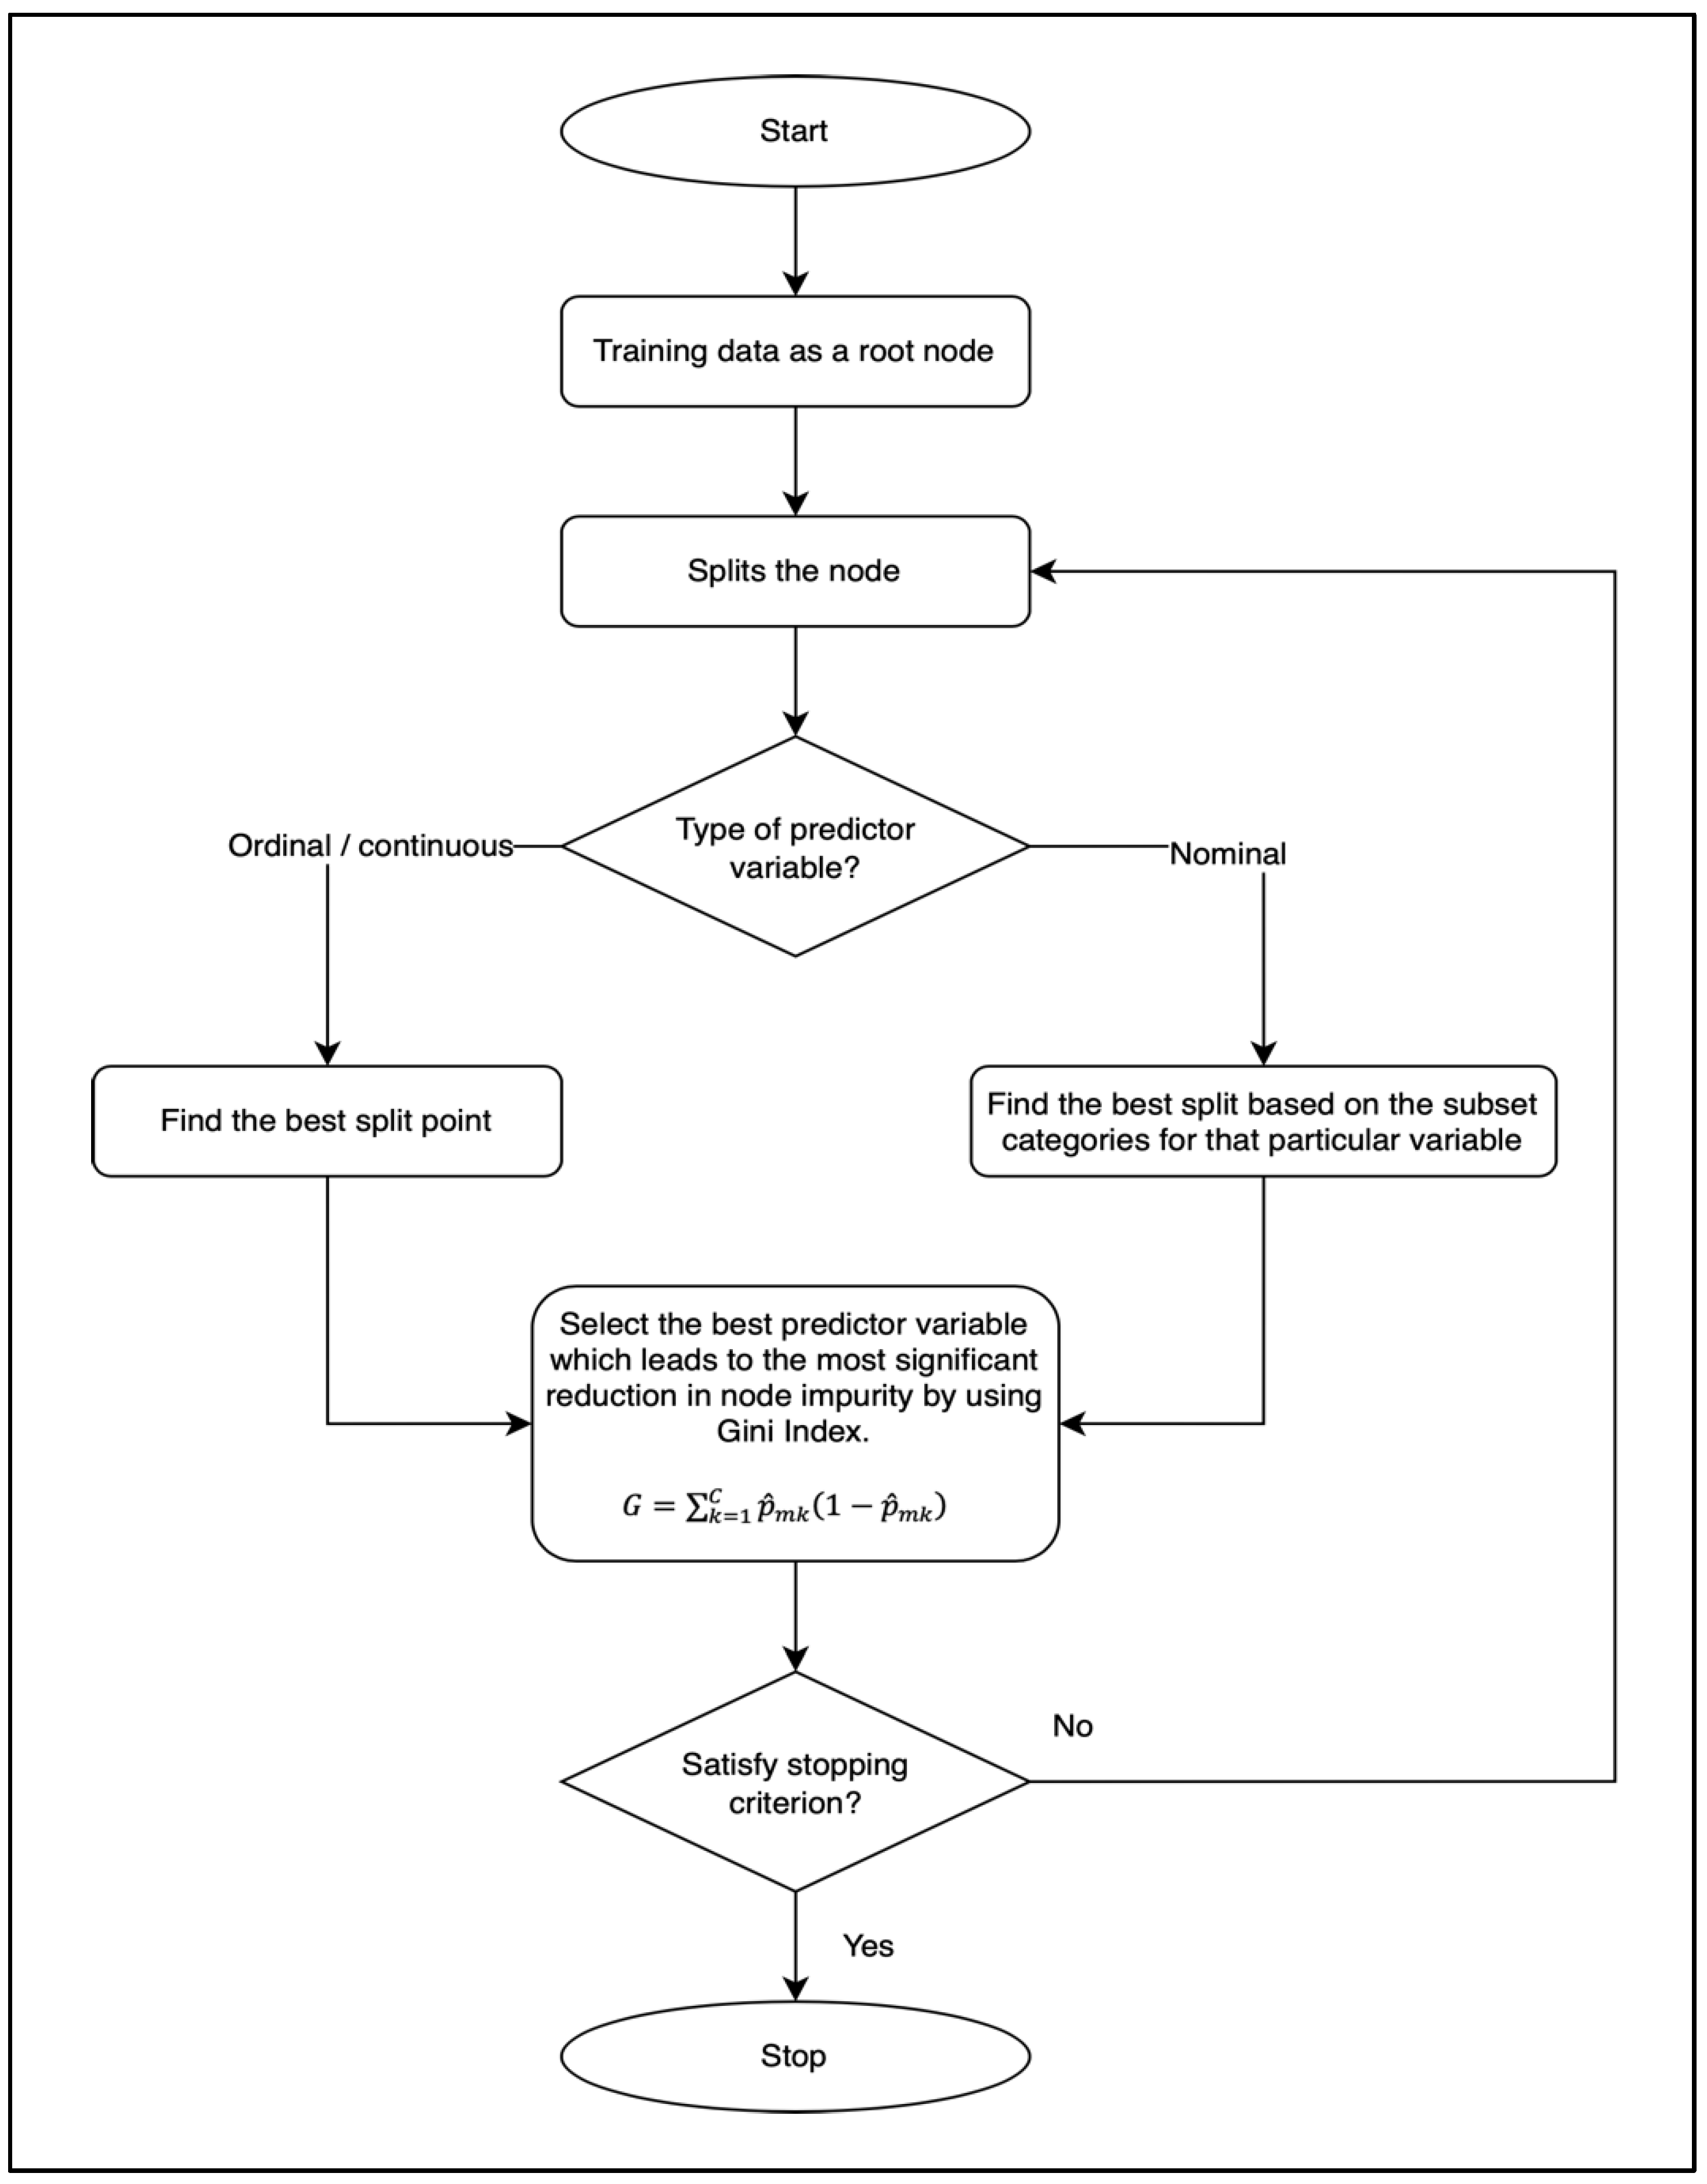
4.1. CART
The dataset was partitioned into 70% of training data and 30% of testing data. There were 18 predictor variables that were used together with drivers’ level of injury to identify the vital patterns and information regarding heavy vehicle crashes. The decision tree was built by using the Gini index splitting criterion, and
Figure 4 represents the classification tree. There are 8 terminal nodes, and it can be seen that the type of the first collision, driver’s error, number of vehicles involved, road surface type, driver’s age, source of light and vehicle type are the main variables used to split the tree. This also indicates that these variables are important in classifying injury severity among heavy vehicle drivers who were involved in a road crash.
For every node in the decision tree, three lines of information are displayed. The first line indicates the level of injury with the highest number of observations, i.e., not injured, slightly injured, severely injured, or fatal. The middle line consists of four values. Each value corresponds to the probability of each level of injury that can be calculated by dividing the number of observations for that injury level by the total observations in that node. For example, the first node in the decision tree shows a middle line displaying (0.80 0.10 0.05 0.05). This implies that the likelihood of heavy vehicle drivers who are involved in a crash to survive with “Not Injured” or being “Slightly”, “Severely” and “Fatally injured” is 80%, 10%, 5% and 5%, respectively. Meanwhile, the percentage in the last line of every node shows the percentage of observations from the whole data set that resides in the node.
The first split is based on the type of the first collision, which implies that this variable is the most crucial in classifying injury due to crashes among heavy vehicle drivers. This decision tree groups nine types of collisions described as angular, forced, head-on, hitting objects off-road and on-road, hitting pedestrian, rear, right angle side and sideswipe into a terminal node which contains 89% of the total observations. As shown by the terminal node on the leftmost branch of the tree, if these collision types occurred during a crash, the tree shows that the drivers will likely experience no injury (85.4%). The other two collision types, which are out of control and overturned, form another node with the remaining 11% of observations. Based on this node, the probability of having injuries is higher if the crash involved out-of-control and overturned vehicles (39% slightly injured, 12% severely injured, and 16% fatally injured). This node is partitioned further based on the driver’s error variable.
By considering the driver’s error, another terminal node has been formed with 3.4% of the total observations. Based on this terminal node, 38.6% and 11.5% of the heavy vehicle drivers who are involved in a crash most likely will suffer from a slight and severe injury respectively if they committed careless driving, other unspecified offences, or speeding. Other types of error will mostly cause no injury to the drivers (40.4%), and respective observations are partitioned again by referring to the number of vehicles involved.
The partitioning concerning the number of vehicles involved in a crash had resulted in the formation of another terminal node which comprised 3.6% of the total observations. This terminal node suggests that in a heavy vehicle crash involving two or more vehicles, the driver had a higher chance of surviving with no injury (59.3%). Meanwhile, drivers who were involved in a single-vehicle crash had a greater chance of being injured (33% slightly injured, 17% severely injured, 27% fatal) compared to two-vehicle and multiple vehicle crashes.
Crashes involving only one vehicle are grouped and split further based on the road surface type. The tree shows that 37.0% of the heavy vehicle drivers who are involved in crashes along roads with bitumen/tar and bricks surface will be slightly injured. This group of drivers is partitioned further by taking the driver’s age into account. Nevertheless, crashes along other road surface types (concrete, gravel, dirt) form another terminal node at the rightmost branch of the tree. Even though less than 1% of total observations are in this node, it is crucial to note that 100% of the drivers who are involved in crashes along the road with concrete, gravel or dirt surface will be fatally injured.
Back to the centre part of the tree, the driver’s age variable has been used to partition the observations further where drivers of 21 to 45, 51 to 55 and 61 to 65 years old are grouped. This group of drivers is then partitioned again based on the light condition during a crash. On the other hand, age groups of 46 to 50, 56 to 60 and 66 to 75 years old are grouped and form a terminal node. This terminal node illustrates that 80% of the heavy vehicle drivers of this age will probably have a slight injury while another 20% will be fatally injured when involved in a crash.
Regarding the variable light condition during crashes, a terminal node is formed at the centre part of the tree where crashes that occurred on a dark road without lights or during dawn/dusk are grouped. Undoubtedly, heavy vehicle drivers who are involved in crashes with these environments had a higher chance to be severely injured (60%). In comparison, the remaining 40% will probably survive without any injury. Dark environments may reduce visibility and increase the risk of a crash. Another partitioning based on vehicle type is conducted to the group of drivers who are involved in crashes on a dark road with lights or during daylight and resulted in the formation of two terminal nodes. The first terminal node indicates that the majority of articulated lorry and express bus drivers who were involved in a crash had a greater chance of surviving with no injury (60%). However, it is also important to point out that another 40% of these drivers will most likely be fatally injured. The second terminal node is formed by grouping other types of heavy vehicles and half of the observations in this node had a chance to be slightly injured.
Figure 5 explains the importance of each variable for data classification by the CART model. Collision type was the main factor used by this model in classifying the data. Apart from that, the top ten most important variables were the driver’s error, age, number of vehicles involved, road surface type, vehicle type and lighting condition.
4.2. Random Forest (RF)
RF for the training data was built with 500 different trees and four predictive variables considered at each split within a tree. A different subset of the data will be involved in building these trees. For each iteration, out-of-bag error will be used to assess the model, where the tree was tested with testing data set which is not involved in the tree building process. The out-of-bag error, also known as the average of errors of all these interactions is 19.3%.
The variable importance plot in
Figure 6 explains the importance of each variable for data classification by RF model. The rank of predictor variables is based on the mean decrease Gini, also known as the mean decrease accuracy, which measures each variable contribution to the purity on each node in a tree. As the decision tree, collision type was the main factor used by the model in classifying the data. Nevertheless, driver’s age, vehicle type, road type, number of vehicles involved, driver’s error and lighting condition were also being identified as the other important variables by this model. Regarding the top ten important variables for both classifiers, CART and RF are comparable in determining factors that contribute to driver injuries in accidents involving heavy vehicles.
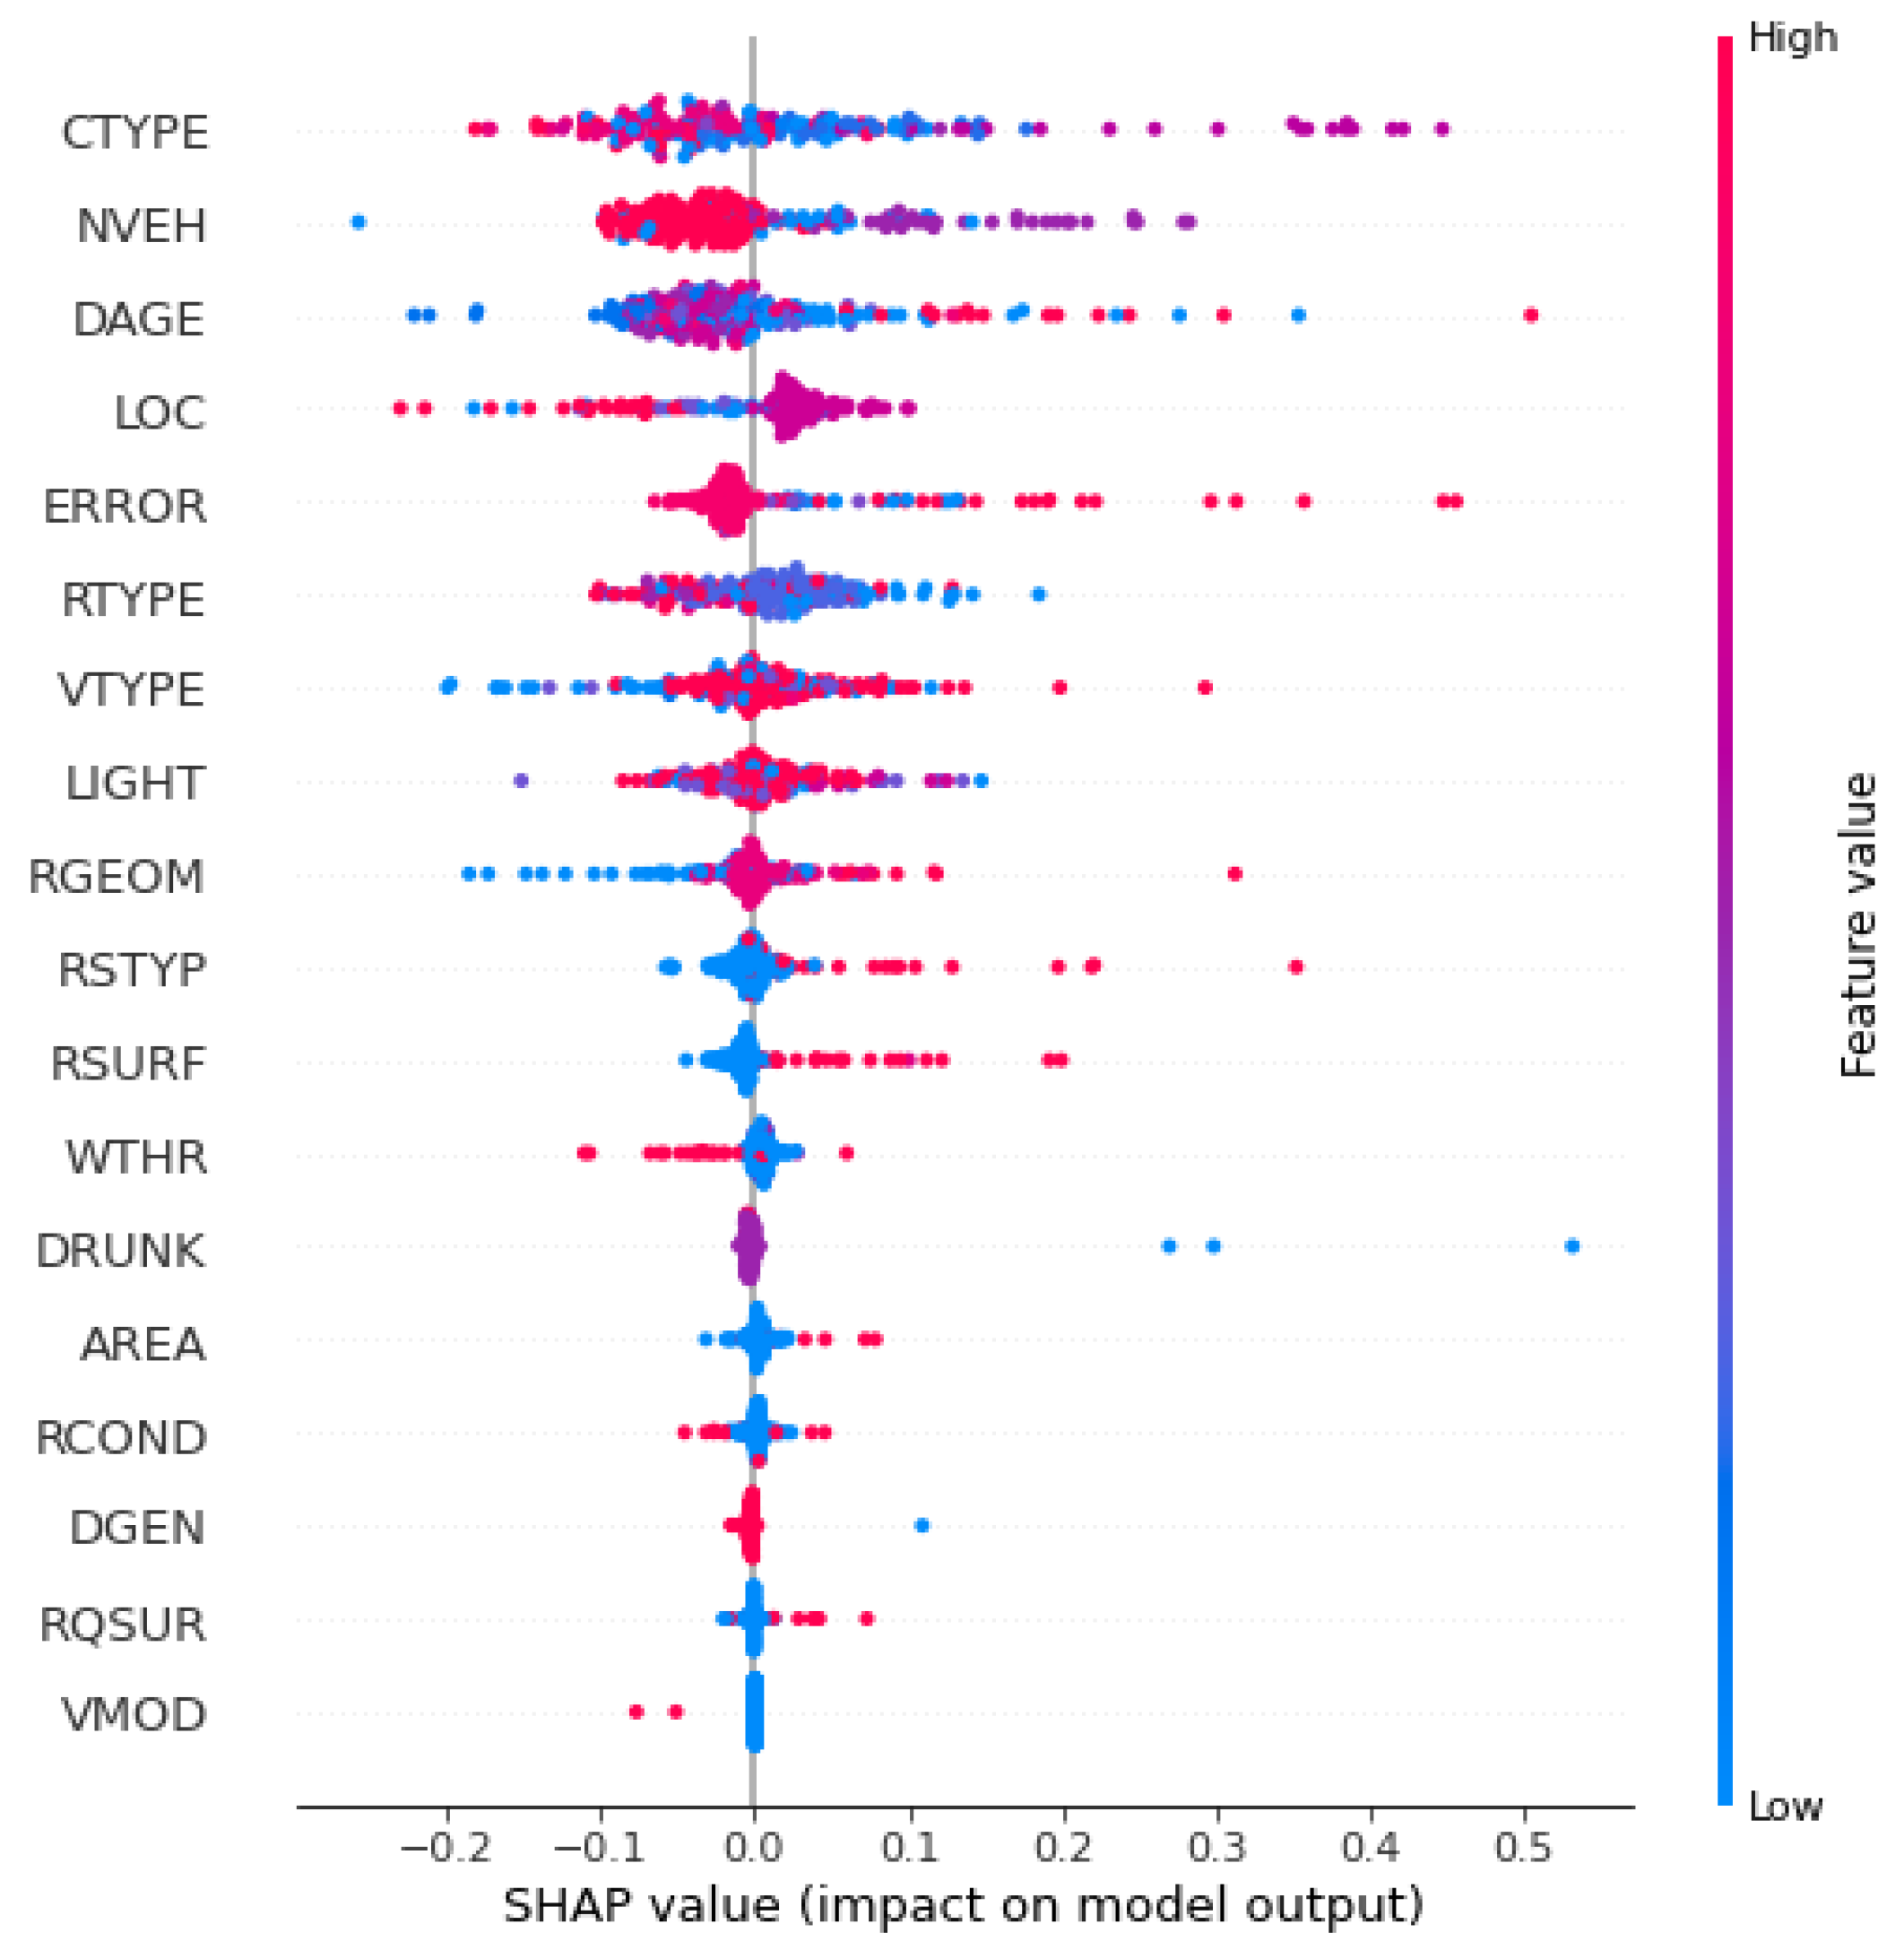
To explain more on the impact of each explanatory variable towards the level of injury severity, SHAP for RF was carried out and the visualisation is presented in
Figure 7. This summary plot combines the feature importance with feature effects. Based on the
y-axis, features on the top are the most important features to the model output while the
x-axis represents the SHAP value for each feature. The red colour represents the higher value of a feature while the blue represents the lower value of a feature. Collision type was the most important feature where the crashes related to a higher value of this feature (sideswipe) are less likely to suffer in a fatal injury. Both ends of factor driver’s age are also worth mentioning where older drivers are more likely to suffer fatal injury compared to the young drivers.


