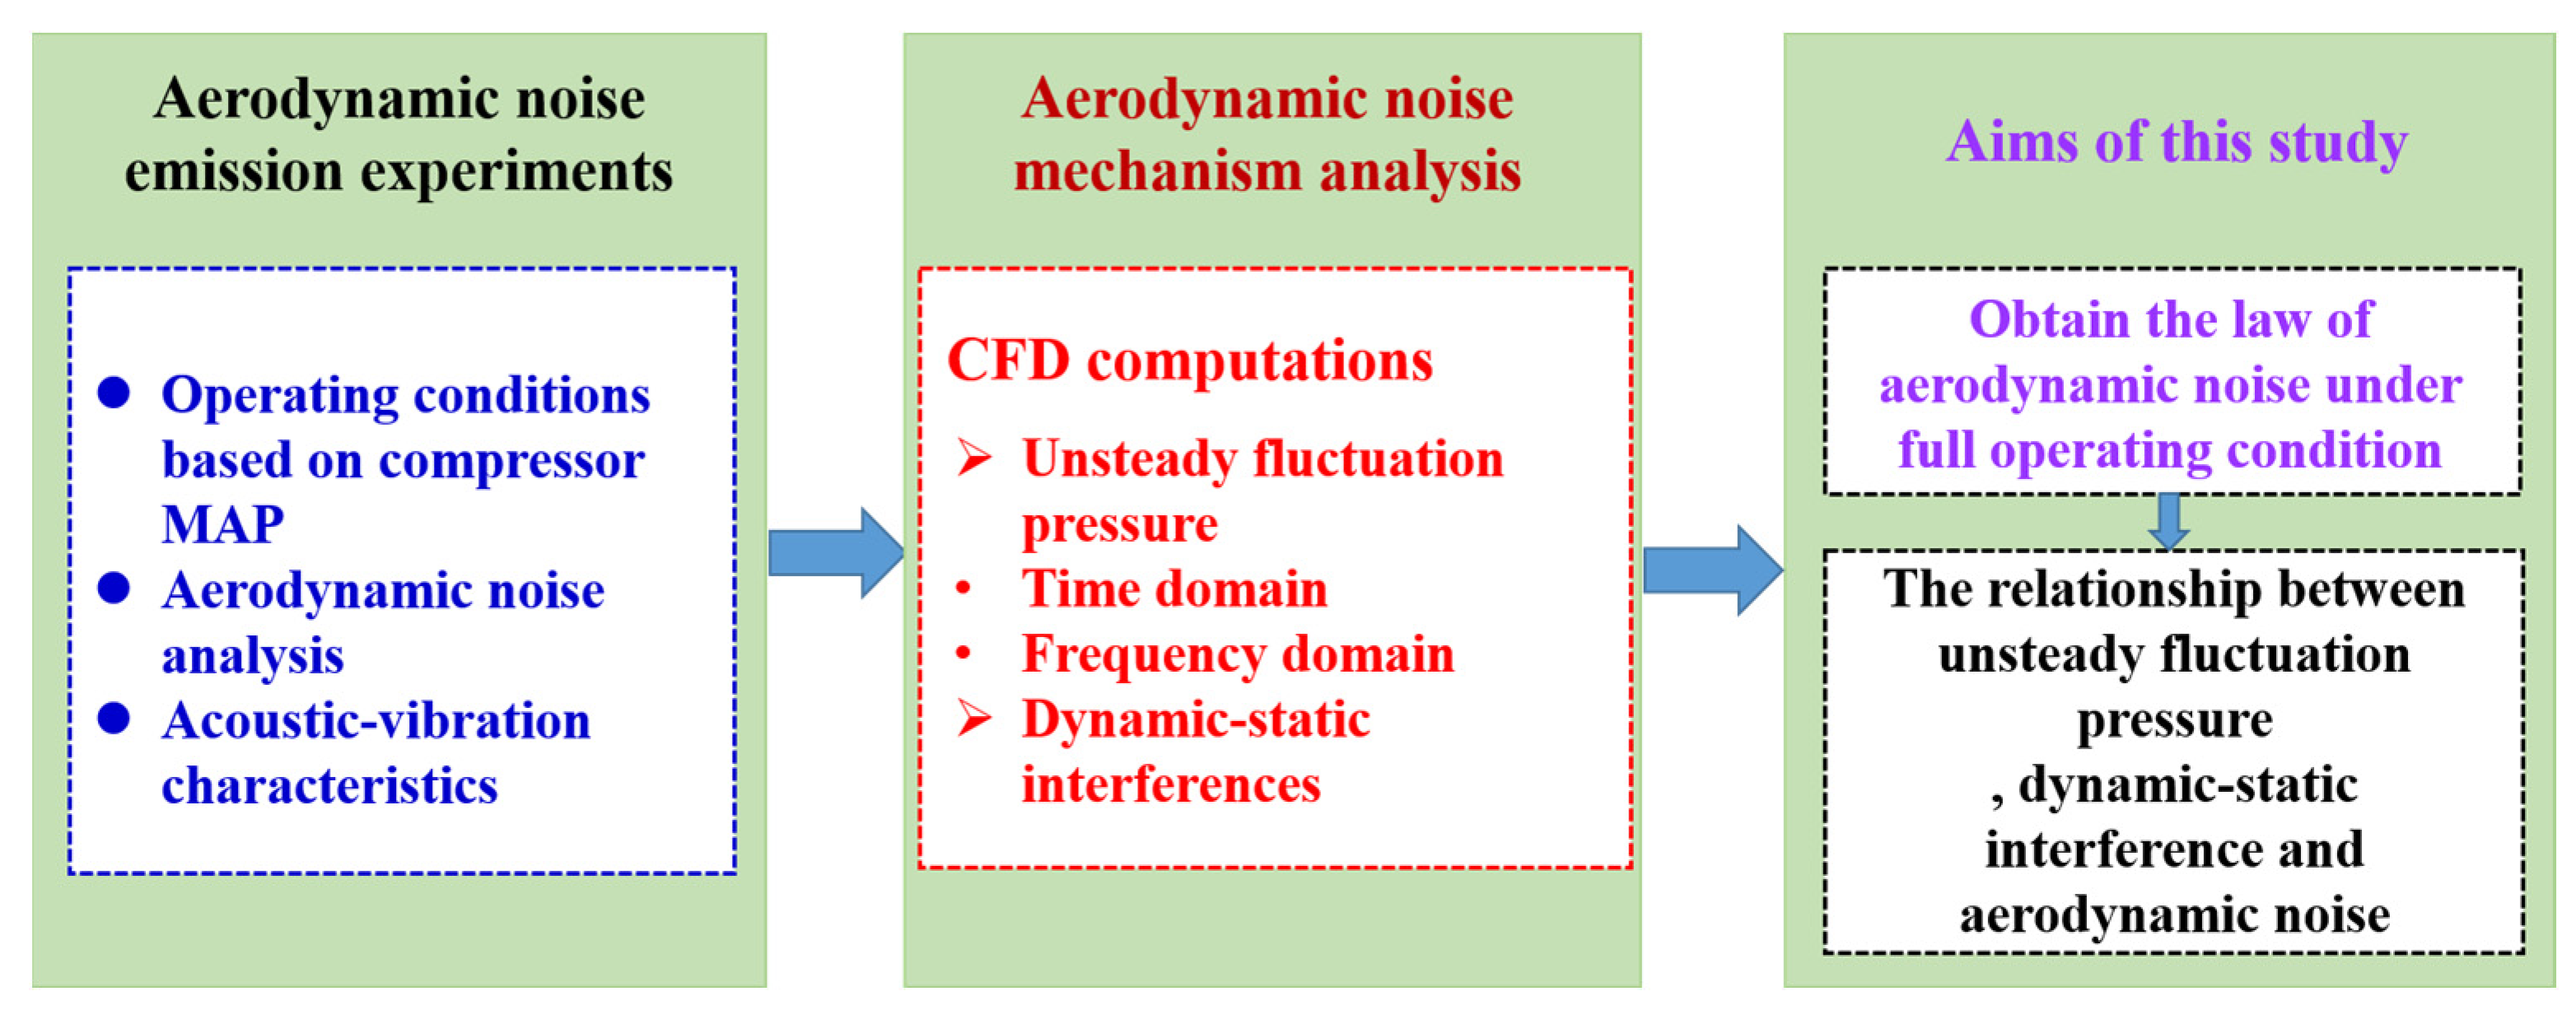
Article

Experimental and Mechanism Study of Aerodynamic Noise Emission Characteristics from a Turbocharger Compressor of Heavy-Duty Diesel Engine Based on Full Operating Range

1
School of Automotive Studies, Tongji University, Shanghai 201804, China
2
SAIC Motor, General Institute of Innovation Research and Development, Shanghai 201804, China
*
Author to whom correspondence should be addressed.
Sustainability 2023, 15(14), 11300; https://doi.org/10.3390/su151411300
Submission received: 26 June 2023 / Revised: 11 July 2023 / Accepted: 18 July 2023 / Published: 20 July 2023

Abstract

:
Heavy-duty diesel engines equipped with turbochargers is an effective way to alleviate energy shortage and reduce gas emissions, but their compressor aerodynamic noise emissions have become an important issue that needs to be addressed urgently. Therefore, to study the aerodynamic noise emission characteristics of a compressor during the full operating range, experimental and numerical simulation methods were used to analyze the aerodynamic noise emissions. The results showed that aerodynamic noise’s total sound pressure level (SPL) increased with increased speed under the test conditions. At low speeds, the total SPL of aerodynamic noise was affected by the mass flow of the compressor more obviously. The maximum difference of aerodynamic noise total SPL was 1.55 dB at 60,000 r/min under different mass flows. At the same speed, the compressor could achieve lower aerodynamic noise emissions by operating in the high-efficiency region (middle mass flows). In the compressor aerodynamic noises, the blade passing frequency (BPF) noise played a dominant role. The transient acoustic-vibration spectral characteristics and fluctuation pressure analysis indicated that BPF and its harmonic frequency noises were mainly caused by the unsteady fluctuation pressure. As the speed increased, the BPF noise contributed more to the total SPL of the aerodynamic noise, and its percentage was up to 75.35%. The novelty of this study was the analysis of the relationship between compressor aerodynamic noise and internal flow characteristics at full operating conditions. It provided a theoretical basis for reducing the heavy-duty diesel engine turbocharger compressor aerodynamic noise emissions.

1. Introduction

Turbochargers can increase the specific power output of internal combustion engines and reduce gas emissions. Therefore, turbochargers are widely used in transportation [1,2,3,4,5]. However, in addition to the combustion and mechanical noise in the engine cylinder, the noise generated by the turbocharger becomes a non-negligible part of the engine noise source [6]. Due to the increase in the output power requirements of diesel engines, the turbocharger pressure ratio increases, leading to a rise in the compressor load and higher aerodynamic noise emissions [7,8]. In the existing literature, aerodynamic noise is considered the main noise source of turbochargers [9,10]. In recent years, excessive compressor aerodynamic noise emissions have become an important issue that needs to be addressed in heavy-duty diesel engine turbochargers.
The experimental method is one of the main technical approaches to studying the aerodynamic noise of a compressor. During the noise experiments, the sound spectrum is obtained by measuring the noise at the operating points of the compressor, thus visualizing the noise characteristics of the compressor [11]. Many fruitful works have been carried out by scholars. Li et al. [12] conducted experimental noise research on a turbocharger bench. Using an acoustic array, they measured the surface radiated noise of a gasoline engine turbocharger. The results showed that the compressor aerodynamic noise was the main source of turbocharger noise. Raitor et al. [13] studied the main noise sources of a centrifugal compressor and found that blade passing frequency (BPF), buzz-saw, and tip clearance noise were the main noise sources. Figurella et al. [14] showed that the discrete noise could be observed in the BPF of a compressor and its harmonic frequencies. Zhang et al. [15] explored the influence of differential tip clearance on the performance and noise of an axial compressor adopting the experiment method. The results indicated that the compressor’s sound pressure level (SPL) was lowest at a relatively small tip clearance rather than zero. In addition, Galindo et al. [16] conducted experiments to explore the effect of inlet geometry on noise emissions of an automotive turbocharger compressor. A convergent-divergent nozzle could significantly improve surge margin and reduce noise emissions. In summary, there is still a lack of experimental research on heavy-duty diesel engine turbocharger compressors, and it is essential to carry out experimental studies on the aerodynamic noise of compressors in the full operating range to reduce the aerodynamic noises of compressors.
A review of the available literature showed that two methods are used for compressor noise measurements, but there are some problems when using these methods. The first method is based on radiated noise, measured using a microphone in an anechoic environment. However, the disadvantage is that it is difficult to distinguish between different noise components. Another method is to use pressure transducers to measure noise in the compressor duct, but this method relies on high-precision measurement equipment and has high test costs [17]. In addition, the experimental method is usually used to improve the acoustic performance of the compressor and cannot explore the relationship between the compressor’s aerodynamic noise and flow characteristics. To remedy these shortcomings, scholars have used reliable numerical computational methods to conduct noise simulation studies on compressors.
Numerical simulation of compressor noise usually couples computational fluid dynamics (CFD) and computational aerodynamic acoustics (CAA) methods [18,19,20]. Dehner et al. [21] studied the noise emissions of a turbocharger centrifugal compressor from a spark-ignition engine using the experiments, CFD and modal decomposition methods. The results showed the whooshing noise primarily propagated along the duct in acoustic azimuthal modes. Galindo et al. [22] investigated the influence of four inlet geometries on compressor performances (noise emissions, compressor surge margin and efficiency). They found that a convergent nozzle could strongly reduce the intake orifice noise. In addition, Galindo et al. [23] explored the impact of tip clearance on noise generation and flow behavior of centrifugal compressors in near-surge conditions. The results showed that there were no significant changes in compressor acoustic signature when varying the tip clearance in near-surge conditions. Sundström et al. [24] predicted the flow field and characterized the acoustic near-field generation and propagation under a centrifugal compressor’s stable and near-surge operating conditions. They found that an amplified broadband feature at two times the frequency of the rotating order of the shaft was captured under the near-surge condition.
Furthermore, Sundström et al. [25] conducted a numerical simulations based on the large eddy simulation method to explore vaneless diffuser rotating stall instability in a centrifugal compressor. Jyothishkumar et al. [26] characterized the flow structures and the associated instabilities near the stall point (before the surge). They found that there existed a flow-acoustics coupling at near-surge operating conditions. Broatch et al. [27] conducted experimental and numerical simulation investigations to analyze fluid phenomena related to whoosh noise under near-surge conditions. The results showed that a broadband noise in 1–3 kHz frequency band was detected in the experimental measurements during the simulated conditions. This whoosh noise was also captured by the numerical model. Guo et al. [28] presented a numerical simulation of the stall flow phenomenon inside a turbocharger centrifugal compressor with a vaneless diffuser. They found a distinct stall frequency at the given compressor speed. In addition, Tomita et al. [29] studied the differences in phenomena of the two compressors with different structures were investigated with experimental and computational methods to reveal internal flow phenomena. However, analysis of the aerodynamic noise and interior flow characteristics of the heavy-duty diesel engine turbocharger compressors based on the full operating range is still lacking. Therefore, a compressor simulation study is needed to analyze the relationship between aerodynamic noise and flow characteristics.
To analyze the aerodynamic noise emission characteristics and mechanism of a heavy-duty diesel turbocharger compressor in the full operating range, the purpose of this study was to obtain the aerodynamic noise emissions law for the full operating range of a compressor for heavy-duty diesel engine using an experimental method and to analyze the relationship between different internal flow characteristics and aerodynamic noise characteristics adopting simulation method. The innovation was to refine the aerodynamic noise mechanism of the compressor for heavy-duty diesel engine turbochargers, propose that blade aerodynamic force and dynamic interference were the main discrete monophonic noise sources, and provide a theoretical basis for reducing the turbocharger compressor aerodynamic noise emissions of the heavy-duty diesel engine. The research framework of this study is shown in Figure 1. The remaining parts were organized as follows: Section 2 was the experimental facility and methods, which introduced the test device, measurement equipment, test conditions and data processing methods. Section 3 was the numerical simulation calculation of the compressor, introducing the model parameters setting and validating the model. Section 4 analyzed the test and simulation results, including the variation law of the aerodynamic noise emissions of the compressor in the full operating range (total SPL, BPF noise, acoustic-vibration characteristics, etc.), and explored the relationship between the aerodynamic noise emissions and unsteady fluctuation pressure, dynamic-static interference effects. In Section 5, the main research results of this study were summarized.

2. Experimental Facility and Methods

2.1. Test System and Measurement Equipment

The compressor aerodynamic noise experiments were conducted on the turbocharger performance test bench, as shown in Figure 2. The compressor noise test system mainly included the turbocharger test bench, PCB-SN152495 type microphone, PCB-HT356B21 type vibration sensor, SIEMENS signal acquisition port and turbocharger test console. Among them, the turbocharger test bench had automatic data acquisition and processing functions, which could realize the precise control of turbocharger speed, compressor and turbine inlet and outlet parameters. The compressor inlet was equipped with pressure and temperature regulators, which could be automatically adjusted in real-time to ensure smooth temperature and pressure at the inlet. The turbine intake system was equipped with oil injection and ignition devices. The measuring range and accuracy of the aerodynamic noise test instruments are shown in Table 1.
The aerodynamic noise test operating conditions consisted of the characteristic working points on the MAP diagram of the compressor, as shown in Figure 3. Among them, case 1 was defined as the near-choke region, case 2 as the high-efficiency region, and Case 3 as the near-surge region.

2.2. Experimental Procedure and Data Processing

To ensure that the compressor inlet aerodynamic noise experiments were not affected by other noise sources, the compressor inlet piping was not installed with an inlet muffler. To avoid the effect of the ground and walls on the compressor aerodynamic noise measurement, the turbocharger axis was about 1.4 m from the ground, and the turbocharger case was greater than 1 m from the wall. Before the experiments, the noise of the turbocharger operating environment was measured and calibrated. In the experiments, the ambient noise in the test chamber was 42.5 dB, and the ambient temperature was 23.5 °C. The data collected during the test were processed by Simcenter Testlab 2021.1.

3. Numerical Simulation

3.1. Research Object

The research object of this study was a turbocharger compressor of a heavy-duty diesel engine. The compressor structure uses the splitter blade, and the diffuser uses a bladeless structure. The specific parameters are shown in Table 2. Chen et al. [30] proposed a novel pseudo-MAP method which was a contour map with the performance of only nine compressor characteristic operating points. Therefore, to make the simulation representative, three speeds of 60,000 r/min, 90,000 r/min and 110,000 r/min were chosen to represent the compressor’s low, medium, and high speeds. In each speed line, three characteristic working points were selected to characterize the near-choke region (case 1), high-efficiency region (case 2) and near-surge region (case 3), and the total number of simulated working cases were 9 points, and the distribution of calculated working cases are shown in Figure 4.

3.2. Model Parameter Setting and Validation

To analyze the unsteady fluctuation pressure phenomenon of the compressor in detail, monitoring points were set in the inlet region, rotor region, diffuser region and volute region, respectively, as shown in Figure 5. In the compressor model setup, the impeller region was set as the rotating domain, and the rest were stationary domains. The intersection between the inlet section and the impeller rotating domain and between the impeller rotating domain and the diffuser domain was adopted as the transient rotor-stator intersection. Considering the complexity of the meshing of each fluid domain, structured meshes were used for the inlet extension, outlet extension and rotor region, and unstructured meshes were used for the rest of the stationary domains. To simulate the surface boundary layer of the blade and hub accurately, the y+ of the first grid layer near the wall was less than 1. The turbulence model adopted the Shear Stress Transport model, and the mathematical model adopted the Reynolds-averaged Navier–Stokes equation system. The model walls were all set as smooth, non-slip adiabatic walls [31]. The fluid was defined as an ideal gas, and the fluid viscosity was set as a function of temperature. The inlet of the compressor was set to the total temperature of 293.15 K and the total pressure of 101.325 kPa, and the outlet was set to the mass flow boundary.
During the numerical simulation, the unsteady flow was calculated based on the steady flow simulation. The high resolution with second-order accuracy was selected as the option of the advection scheme. In addition, the second-order backward Euler with second-order accuracy was chosen as the option for the transient scheme.
Blade passing frequency (BPF) noise is the main component of compressor aerodynamic noise. The equation for calculating the blade passing frequency (BPF) is as follows:
f B = n Z 60
where n is the compressor speed and Z is the number of blade sets.
The BPF corresponds to the harmonic frequency f H is calculated by the following formula:
f H = m f B   ( m = 2 ,   3 ,   4 ,   )
where, m is the number of orders.
In this study, the simulated compressor speeds included 60,000 r/min, 90,000 r/min and 110,000 r/min, and their corresponding BPFs were 7000 Hz, 10,500 Hz and 12,833 Hz, respectively. Focusing on the first fifth-order noise, the corresponding maximum frequencies were 35,000 Hz, 52,500 Hz and 64125 Hz, respectively. According to the Nyquist sampling law [17], the simulation time step is calculated as follows:
Δ t 1 2 f m a x
where, f m a x is the maximum frequency. Therefore, the time steps were known to be 1.42 × 10⁻⁵ s, 9.52 × 10⁻⁶ s and 7.79 × 10⁻⁶ s, respectively. Due to every 4° rotation of the impeller was a time step that satisfied the computational requirements, the time steps calculated according to the impeller rotation per 4° were about 1.11 × 10⁻⁵ s, 7.41 × 10⁻⁶ s and 6.06 × 10⁻⁶ s for the three speeds of 60,000 r/min, 90,000 r/min and 110,000 r/min, respectively.
In addition, in the transient simulations, the normalized root-mean-square residuals were used to determine convergence and control the termination of coefficient iterations. The sum of residuals to the sum of fluxes for a given variable in all cells must be reduced to less than 1 × 10⁻⁶ to ensure convergence of the computations.
Table 3 compares the various numerical parameters critical to modeling compressor aerodynamics and noise generation in this survey with other literature surveys.
To improve the calculation accuracy, the mesh independence analysis was conducted in the study based on the Richardson extrapolation method [34]. The equations used by the extrapolation method are presented in Table 4.
Three meshes were used for the independence mesh study: Mesh1 with N1 = 6,730,132 elements, Mesh2 with N2 = 4,932,456 elements, and Mesh3 with N3 = 3,102,894 elements. The design point was selected as the simulation corresponded to a mass flow of 0.2439 kg/s, a speed of 60,000 r/min, an inlet pressure of 101.325 kPa and an inlet temperature of 293.15 K. The discretization errors are listed in Table 5, which contains all the important parameters obtained from the mesh independence study. As can be seen in Table 5, the refinement factors for all grids were greater than 1.3. The variables used to determine grid convergence were the pressure ratio and efficiency, monitored in each simulation.
Figure 6 shows the Extrapolation results for pressure ratio and efficiency to the number of elements. As can be seen from the figure, there was some error in the calculation results of the N3 mesh, but the N2 mesh and N1 mesh were the same. In addition, the calculation time used in the N2 mesh was reduced by 33.3% compared to the calculation time implemented for the N1 mesh. Therefore, Mesh2 comprised N2 = 4,932,456 elements was selected for the numerical simulation study.
Figure 7 compares the experimental and simulated values of the pressure ratio and efficiency of the compressor. At low speeds, the experimental values matched well with the simulated values. For the pressure ratio and efficiency, the maximum errors were 4.89% and 3.92%, respectively, occurring at the 110,000 r/min speed line. This difference was attributed to the simplification of geometry’s secondary features, the simulation’s heat transfer parameter settings, and manufacturing errors [35,36,37].

4. Result and Discussions

4.1. Experimental Analysis of Aerodynamic Noise Emission Characteristics

The aerodynamic noise components are shown in Figure 8. In this study, the discrete noise components in the aerodynamic noise of the compressor were investigated, including discrete monotone and multi-monotone noise.
Figure 9 shows the aerodynamic noise emissions spectrum of the compressor under different operating conditions. The sound pressure level (SPL) of aerodynamic noise decreased with increasing frequency at the same speed. This was consistent with the findings of Zuo et al. [38].
For the same case, with the compressor speed increased, significant peaks were observed at the BPF and its harmonic frequency (Figure 9b,c). This was because the mutual disturbance frequency between the blade and the airflow increased as the speed increased, increasing the noise at the BPF and its harmonic frequency. In addition, among the noises at the harmonic frequencies corresponding to the BPF, the first-order harmonic noise (1st harmonic) was the largest. As the speed increased, the noise at the harmonic frequency corresponding to the BPF moved toward increasing frequency. Among them, no noise at the harmonic frequency corresponding to BPF was observed in the frequency range of 0 to 25,000 Hz at 110,000 r/min (as shown in Figure 9c). This was because the increase in speed could increase the BPF of the compressor, which led to an increase in its corresponding harmonic frequency.
Figure 10 shows the cloud plot of the aerodynamic noise emissions for the compressor at the full operating range. In the same case, the aerodynamic noise emissions decreased with increased frequency. Among the three cases, the SPL distribution of the aerodynamic noise in the high-efficiency region (case 2) was the smallest overall at the same speed. Specifically, compared with the near-choke region (case 1), the distribution of the SPL for the aerodynamic noise in the range of 10,000 to 20,000 Hz in case 2 was smaller. Compared with the near-surge region (case 3), the distribution of the SPL for the aerodynamic noise in the range of 0 to 5000 Hz in case 2 was also smaller. The main reason was that the airflow deteriorated when the compressor was operated in the near-choke region compared to the high-efficiency region. While the rotational stall phenomenon occurred when the compressor was operated in the near-surge region [39,40], and the airflow turbulence intensity increased, which increased the compressor’s aerodynamic noise emissions. Therefore, at the same speed, the compressor operating in the high-efficiency region could achieve lower aerodynamic noise emissions.
To quantitatively analyze the aerodynamic noise of the compressor, the total SPL of the aerodynamic noise and the BPF noise are calculated as shown in Equations (4) and (5) [41]:
L t o t a l = 10 log ( i = 1 n 10 L i 10 )
L B P F = 10 log ( i = 1 m 10 L m 10 )
where, L t o t a l , L B P F , L i and L m are the total SPL, SPL of BPF, SPL at fixed frequency point and SPL at BPF and its harmonics, respectively. m and n are the number of BPF harmonic and frequency points.
The total SPL of aerodynamic and BPF noise of the compressor at the full operating range is shown in Figure 11. For the same case, the total SPL of aerodynamic and BPF noise increased as the speed increased. Among them, compared with 60,000 r/min, the total SPLs of aerodynamic noise and BPF noises for case 1, case 2 and case 3 at 110,000 r/min increased by 4.32%, 5.18%, 4.77% and 10.62%, 10.27% and 9.81%, respectively. This was mainly due to the increase in compressor speed, the frequency of mutual disturbance between impeller blades and airflow per unit time increased, and the amplitude of fluctuation pressure increased, which increased aerodynamic noise emissions. At the same speed, the total SPL of each case from high to low was near-choke region (case 1) > near-surge region (case 3) > high-efficiency region (case 2). The reasons are shown above.
It is further observed that the maximum difference in the total SPL of aerodynamic noise between the three cases was 1.55 dB at 60,000 r/min, while the maximum difference in the total SPL was 0.61 dB at 110,000 r/min. This was because, at low speeds, the change of air inlet volume brought by the change of compressor mass flow occupied the main position in the compressor aerodynamic noise generation. At the same disturbance frequency, the interference effect between the blade and airflow was enhanced. As the speed increased, the effect of compressor mass flow on aerodynamic noise gradually decreased. Therefore, at low speeds, the total SPL of compressor aerodynamic noise was more obviously influenced by the mass flow.
To further analyze the contribution of BPF noise to the total SPL of aerodynamic noise, the proportion of the compressor BPF noise to the total SPL of aerodynamic noise under the full operating range is shown in Figure 12. From the figure, it can be seen that the percentage of BPF noise exceeded 70% in all test conditions. This indicated that the BPF noise was the main noise component in the aerodynamic noise on the inlet side of the compressor. With the speed increased, the percentage of BPF noise increased. Among them, at the speed of 110,000 r/min, the largest proportion of BPF noise was 75.35% for the above reasons. Therefore, in the aerodynamic noise, the compressor speed had a high contribution to the BPF noise.
The above analysis shows that the compressor operating in the high-efficiency region (case 2) could achieve lower aerodynamic noise emissions. To further analyze the aerodynamic noise emissions law in the high-efficiency region of the compressor, the transient acoustic-vibration spectrum distribution in the high-efficiency region at different speeds is shown in Figure 13. It can be seen that obvious peaks of aerodynamic noise and vibration acceleration were observed at the BPF of the compressor and its harmonic frequency at different speeds, and the peaks were more obvious as the speed increased.
Further observations revealed that more pronounced noise peaks were observed in the 1000 to 5000 Hz range, while no significant peaks were found in the vibration acceleration spectrum corresponding to the frequencies. This was because the noise corresponding to the frequencies below the BPF was caused by the secondary flow through the gap between the compressor blade tip and the clearance of the casing [23]. Therefore, it can be inferred that the noise and vibration at the BPF and its harmonic frequencies were caused by the fluctuating pressure of the compressor.

4.2. Numerical Analysis of Compressor Aerodynamic Noise Emissions Mechanism

4.2.1. Unsteady Fluctuation Pressure

In the aerodynamic noise prediction of the compressor, the source information is the unsteady fluctuation pressure at the source surface. Therefore, it is essential to study the relationship between the unsteady fluctuation pressure and the aerodynamic noise to analyze the aerodynamic noise mechanism of the compressor. The analysis process of this section is shown in Figure 14.
During the change of fluctuation pressure at the monitoring points with a total time length of 0.005 s, the compressor’s rotations were 5, 7.5 and 9.1 revolutions for speeds of 60,000 r/min, 90,000 r/min and 110,000 r/min, respectively. During the fluctuation pressure in the period of one revolution for the compressor, there were seven pressure fluctuation peaks consistent with the number of blade groups of the compressor.
The time domain fluctuation pressure distribution at the inlet region of the compressor in the high-efficiency region (case 2) is shown in Figure 15. The figure shows that for the same monitoring point, the fluctuation pressure became dramatic as the speed increased. This was mainly due to the increased frequency of the impeller blades cutting the airflow mass per unit of time, and the fluctuation pressure was more obvious. At the same speed, the closer to the wall position, the greater the amplitude of fluctuation pressure at the monitoring point (In1 and In3 were the near-wall points, and In5 was the center point). This was mainly due to the interference between the high-speed rotating impeller and the incoming airflow, which created a steady periodic pressure fluctuation. The pulsation was stronger at the tip of the impeller while gradually decreasing outward from the leading edge of the impeller. Therefore, the fluctuation pressure in the near-wall area was more pronounced than at the center of the compressor inlet.
It was further observed that at low compressor speed (60,000 r/min), certain fluctuations between cycles at the same monitoring point for each compressor rotation (as shown in Figure 15a). As the speed increased, the amplitude of fluctuations between cycles at the same monitoring point decreased (Figure 15b,c). This was because, in the high-efficiency region, as the compressor speed increased, the mass flow increased. In addition, during each revolution of the compressor, the collision area between the blades and the airflow increased, and the interference time between each group of blades and the airflow became shorter, which resulted in weaker fluctuations between the cycles.
In the frequency domain analysis of aerodynamic noise, to make the unsteady fluctuation pressure characteristics of the compressor more obvious, the pressure coefficient CP was for characterization, and its calculation formula is as follows:
C P = 2 P P j ρ v 2
V = π n D 60
where P is the pressure at the monitoring point at a certain moment (Pa), P j is the average pressure at the monitoring point in the time range (Pa), ρ is the air density. Its value is 1.29 kg/m3, V is the impeller outer edge exit circumferential velocity (m/s), n is the compressor speed (r/min), and D is the impeller exit diameter (m).
The frequency domain fluctuation pressure distribution in the inlet region obtained by Fast Fourier Transform (FFT) of the fluctuation pressure changes at each monitoring point of the compressor inlet within 0.005 s is shown in Figure 16. It can be seen that for the same monitoring point, the peak of fluctuation pressure at each frequency increased gradually with an increase in the compressor speed, which indicated that the SPL of the aerodynamic noise on the inlet side of the compressor increased with an increase in the speed. In addition, at medium and high speeds, a more obvious peak of fluctuation pressure was observed at the BPF of each monitoring point, indicating that the fluctuation pressure formed by the interference between the impeller blades and the incoming airflow had a certain contribution to the BPF noise on the inlet side of the compressor.
The time domain fluctuation pressure distribution of the rotor region in the high-efficiency region is shown in Figure 17. The figure shows that the fluctuation pressure amplitude at R5 was higher than that of R1 at the same speed, which was caused by the higher airflow pressure at the location of R5. In addition, the fluctuation pressure amplitude increased as the speed increased for the same monitoring point. This was due to the increase in the frequency of blade and inlet airflow disturbances caused by the increase in speed, increasing the fluctuation pressure amplitude.
Figure 18 shows the compressor rotor region’s frequency domain fluctuation pressure distribution in the high-efficiency region. The figure shows that the peak of fluctuation pressure at each monitoring point mainly appeared at the compressor shaft frequency and its harmonic frequency at different speeds. This was because of the high blade tip speed of the compressor and the influence of aerodynamic force, which resulted in the peak of multi-monotone noise being more prominent. At the same speed, compared with the R1, the peak of fluctuation pressure at the harmonic frequency corresponding to the axial frequency of the R5 was increased. This was because the location of R5 was influenced by both the main blades and the splitter blades of the compressor.
Figure 19 shows the pressure distribution of the cross-section where the R1 and R5 were located. It can be seen from the figure that the main blade mainly influenced section F1 and the pressure difference between the pressure surface, and the suction surface of each blade was not obvious, resulting in a small peak of fluctuation pressure at R1. Section F2 was influenced by both the main blade and splitter blade and the pressure difference between the pressure surface and suction surface of each blade increased, which increased the peak of fluctuation pressure for R5.
Figure 20 shows the time domain fluctuation pressure distribution of the compressor diffuser region in the high-efficiency region. The figure shows that for the same monitoring point, the fluctuation pressure amplitude increased with the compressor speed for the reasons shown above. In addition, seven pressure fluctuation peaks were observed during the fluctuation pressure variation of one compressor rotation, which was consistent with the number of compressor blade sets being seven. For the same monitoring point, there were certain fluctuations between each compressor cycle at different speeds.
The frequency domain fluctuation pressure distribution in the diffuser region of the compressor is shown in Figure 21. The figure shows that for the same monitoring point, the main peaks of fluctuation pressure at each monitoring point appeared at the BPF and its first-order harmonic frequency as the speed increased. This was because the fluctuation pressure in the diffuser flow path was mainly caused by the dynamic-static interference between the impeller blades and the diffuser. Therefore, the fluctuation pressure of the compressor diffuser contributed more to the discrete monophonic noises (noise at BPF and its harmonic frequency).
Figure 22 shows the time domain fluctuation pressure distribution in the volute region of the compressor at different speeds. The figure shows that at the same speed, the fluctuation pressure amplitude at each monitoring point was V1 > V4 > V6 > V9 in the order from high to low. This was because the pressure decreased gradually, and the pressure fluctuation decreased during airflow in the worm shell (the airflow direction was V1-V4-V6-V9). Therefore, V1 had the highest fluctuation pressure amplitude, and V9 had the lowest fluctuation pressure amplitude.
The frequency domain fluctuation pressure distribution in the volute region of the compressor is shown in Figure 23. It can be seen from the figure that for V1 and V4, the main peak of fluctuation pressure appeared at the BPF as the compressor speed increased, where the peak of fluctuation pressure at BPF of V1 was higher than that of V4, which was because V1 was located at the worm tongue position (as shown in Figure 5c), and had the highest pressure in the worm casing, making the intensity of pressure fluctuation at this point was highest. Therefore, the BPF noise was dominant in the aerodynamic noise at the exit side of the compressor.

4.2.2. Dynamic-Static Interferences

From the above analysis, it was clear that unsteady fluctuation pressure was the main reason for discrete monophonic noise at the BPF and its harmonic frequencies. Among them, the unsteady fluctuation pressure was mainly caused by the dynamic-static interference effects, including the turbulent interference between the blades and the incoming airflow and the periodic cutting vortex mass of the impeller blades [42].
Figure 24 shows the static entropy and turbulent kinetic energy (TKE) distribution of the impeller and diffuser in the high-efficiency region of the compressor. From the figure, it can be seen that there was obvious static entropy and TKE changes at the blade’s leading edge, mainly caused by the mutual interference between the impeller blade and the incoming airflow. In addition, there were also static entropy and TKE changes at the trailing edge of the blade, which reflected the dynamic-static interference between the impeller and the pressure spreader. Comparing these two areas of dynamic-static interference, it was found that there was no significant difference between them, indicating that the mutual interference between the impeller and the inlet airflow and the dynamic-static interference between the impeller and the diffuser had a high contribution to the noise at the BPF and its harmonic frequency.
Figure 25 shows the distribution of static entropy and TKE for the impeller blade expansion degree of 90% in the high-efficiency region of the compressor. As can be seen from the figure, the large values of static entropy and TKE at the trailing edge of the blade indicated that there was an obvious interference effect between the impeller and the diffuser, and the noise induced by it at the BPF and its harmonic frequency was more prominent.

4.3. Comparative Analysis of the Results and the Existing Studies

To further emphasize the novelty of this study, a detailed comparison was made between this study and other literature, as shown in Table 6.
As seen from Table 6, the existing literature focused on centrifugal compressors for small automotive turbochargers and the research methods used in the studies, including experiment, numerical simulation, and a combination of experiment and numerical simulation. The findings included the analysis of aerodynamic noise component composition, aerodynamic noise characteristics of centrifugal compressors under specific operating conditions, and flow characterization. However, there were fewer studies on the aerodynamic noise characterization of centrifugal compressors for heavy-duty diesel engine turbochargers under the full operating range. In addition, there was a lack of analysis based on the linkage between aerodynamic noise characteristics and internal flow characteristics of centrifugal compressors under specific operating conditions. Therefore, the innovation of the study was to refine the aerodynamic noise mechanism of the compressor for heavy-duty diesel engine turbochargers, propose that blade aerodynamic force and dynamic interference were the main discrete monophonic noise sources, and provide a theoretical basis for reducing the heavy-duty diesel engine turbocharger compressor aerodynamic noise emissions.

5. Conclusions

This study conducted an experimental and simulation investigation of the aerodynamic noise emission of a heavy-duty diesel engine turbocharger compressor in the full operating range. To analyze the aerodynamic noise mechanism, the relationship between the unsteady fluctuation pressure, dynamic-static interference and aerodynamic noise was studied based on numerical simulation methods. The main conclusions were as follows:
  • Under the test conditions, the sound pressure level (SPL) of the aerodynamic noise for the compressor of a heavy-duty diesel engine increased with an increase in speed. At the same speed, the compressor operating in the high-efficiency region (middle mass flows) could achieve lower aerodynamic noise emissions.
  • At low speeds, the total SPL of aerodynamic noise was more obviously affected by the mass flow of the compressor. At 60,000 r/min, the maximum difference in the total SPL of aerodynamic noise was 1.55 dB at different mass flows.
  • Compared with 60,000 r/min, the total SPLs of aerodynamic noise and BPF noises for the near-choke region, high-efficiency region and near-surge region at 110,000 r/min increased by 4.32%, 5.18%, 4.77% and 10.62%, 10.27% and 9.81%, respectively.
  • In the compressor aerodynamic noise, the blade passing frequency (BPF) noise occupies a dominant position. As the engine and compressor speeds increased, the BPF noise contributed more to the total SPL of the aerodynamic noise, and its proportion was up to 75.35%.
  • From the analysis of the transient acoustic-vibration spectrum and fluctuation pressure, it could be seen that BPF and its harmonic frequency noise were mainly caused by the unsteady fluctuation pressure of the compressor.
  • In the compressor, the impeller blades interfere with the incoming airflow, and the dynamic-static interference between the impeller and the diffuser greatly contributes to the BPF and its harmonic frequency noise.

Author Contributions

Methodology, Q.W.; Formal analysis, R.H.; Investigation, R.H. and Q.Y.; Resources, J.N.; Data curation, Q.W.; Writing—original draft, R.H.; Writing—review & editing, R.H., X.S. and Q.Y.; Visualization, X.S.; Project administration, J.N.; Funding acquisition, J.N. and Q.W. All authors have read and agreed to the published version of the manuscript.

Funding

This research was funded by National Natural Science Foundation of China Youth Science Foundation project (grant number 22102116) and the State Key Laboratory of Internal Combustion Engine Reliability Open Subject Foundation of China (grant number skler-202114).

Institutional Review Board Statement

Not applicable.

Informed Consent Statement

Not applicable.

Data Availability Statement

The data presented in this study are available in the main text of the article.

Acknowledgments

The team of authors acknowledges anonymous reviewers for their feedback, which certainly improved the clarity and quality of this paper.

Conflicts of Interest

The authors declare that they have no known competing financial interests or personal relationships that could have appeared to influence the work reported in this paper.

References

  1. Bao, J.; Wang, H.; Wang, R.; Wang, Q.; Di, L.; Shi, C. Comparative experimental study on macroscopic spray characteristics of various oxygenated diesel fuels. Energy Sci. Eng. 2023, 11, 1579–1588. [Google Scholar] [CrossRef]
  2. Huang, R.; Ni, J.; Cheng, Z.; Wang, Q.; Shi, X.; Yao, X. Assessing the effects of ethanol additive and driving behaviors on fuel economy, particle number, and gaseous emissions of a GDI vehicle under real driving conditions. Fuel 2021, 306, 121642. [Google Scholar] [CrossRef]
  3. Mądziel, M. Vehicle Emission Models and Traffic Simulators: A Review. Energies 2023, 16, 3941. [Google Scholar] [CrossRef]
  4. Bao, J.; Qu, P.; Wang, H.; Zhou, C.; Zhang, L.; Shi, C. Implementation of various bowl designs in an HPDI natural gas engine focused on performance and pollutant emissions. Chemosphere 2022, 303, 135275. [Google Scholar] [CrossRef] [PubMed]
  5. Shi, C.; Chai, S.; Wang, H.; Ji, C.; Ge, Y.; Di, L. An insight into direct water injection applied on the hydrogen-enriched rotary engine. Fuel 2023, 339, 127352. [Google Scholar] [CrossRef]
  6. Broatch, A.; Ruiz, S.; García-Tíscar, J.; Roig, F. On the influence of inlet elbow radius on recirculating backflow, whoosh noise and efficiency in turbocharger compressors. Exp. Therm. Fluid Sci. 2018, 96, 224–233. [Google Scholar] [CrossRef]
  7. Abom, M.; Kabral, R. Turbocharger Noise—Generation and Control; SAE Technical Paper 2014-36-0802; SAE International: Warrendale, PA, USA, 2014. [Google Scholar]
  8. Sharma, S.; Broatch, A.; García-Tíscar, J.; Allport, J.; Nickson, A. Acoustic characterisation of a small high-speed centrifugal compressor with casing treatment: An experimental study. Aerosp. Sci. Technol. 2019, 95, 105518. [Google Scholar] [CrossRef]
  9. Karim, A.; Miazgowicz, K.; Lizotte, B.; Zouani, A. Computational Aero-Acoustics Simulation of Compressor Whoosh Noise in Automotive Turbochargers; SAE Technical Paper 2013-01-1880; SAE International: Warrendale, PA, USA, 2013. [Google Scholar] [CrossRef]
  10. Wolfram, D.; Carolus, T.H. Experimental and numerical investigation of the unsteady flow field and tone generation in an isolated centrifugal fan impeller. J. Sound Vib. 2010, 329, 4380–4397. [Google Scholar] [CrossRef]
  11. Torregrosa, A.J.; Broatch, A.; Navarro, R.; García-Tíscar, J. Acoustic characterization of automotive turbocompressors. Int. J. Engine Res. 2015, 16, 31–37. [Google Scholar] [CrossRef]
  12. Li, H.; Ning, M.; Hou, L.; Zhou, T. Experimental Study on the Noise Identification of the Turbocharger. Lect. Notes Electr. Eng. 2011, 121, 1–7. [Google Scholar] [CrossRef]
  13. Raitor, T.; Neise, W. Sound generation in centrifugal compressors. J. Sound Vib. 2008, 314, 738–756. [Google Scholar] [CrossRef]
  14. Figurella, N.; Dehner, R.; Selamet, A.; Tallio, K.; Miazgowicz, K.; Wade, R. Noise at the mid to high flow range of a turbocharger compressor. Noise Control. Eng. J. 2014, 62, 306–312. [Google Scholar] [CrossRef]
  15. Zhang, M.; Dong, X.; Li, J.; Sun, D.; Sun, X. Effect of differential tip clearance on the performance and noise of an axial compressor. Aerosp. Sci. Technol. 2023, 132, 109070. [Google Scholar] [CrossRef]
  16. Galindo, J.; Tiseira, A.; Navarro, R.; Tarí, D.; Meano, C.M. Effect of the inlet geometry on performance, surge margin and noise emission of an automotive turbocharger compressor. Appl. Therm. Eng. 2017, 110, 875–882. [Google Scholar] [CrossRef]
  17. Zhong, C.; Hu, L.; Gong, J.; Wu, C.; Wang, S.; Zhu, X. Effects analysis on aerodynamic noise reduction of centrifugal compressor used for gasoline engine. Appl. Acoust. 2021, 180, 108104. [Google Scholar] [CrossRef]
  18. Fontanesi, S.; Paltrinieri, S.; Cantore, G. CFD analysis of the acoustic behavior of a centrifugal compressor for high performance engine application. Energy Procedia 2014, 45, 759–768. [Google Scholar] [CrossRef] [Green Version]
  19. Sun, H.; Lee, S. Numerical prediction of centrifugal compressor noise. J. Sound Vib. 2004, 269, 421–430. [Google Scholar] [CrossRef]
  20. Zhang, J.; Chu, W.; Zhang, H.; Wu, Y.; Dong, X. Numerical and experimental investigations of the unsteady aerodynamics and aero-acoustics characteristics of a backward curved blade centrifugal fan. Appl. Acoust. 2016, 110, 256–267. [Google Scholar] [CrossRef]
  21. Dehner, R.; Sriganesh, P.; Selamet, A.; Miazgowicz, K. Generation Mechanism of Broadband Whoosh Noise in an Automotive Turbocharger Centrifugal Compressor. J. Turbomach. 2021, 143, 121003. [Google Scholar] [CrossRef]
  22. Galindo, J.; Gil, A.; Navarro, R.; Tarí, D. Analysis of the impact of the geometry on the performance of an automotive centrifugal compressor using CFD simulations. Appl. Therm. Eng. 2018, 148, 1324–1333. [Google Scholar] [CrossRef]
  23. Galindo, J.; Tiseira, A.; Navarro, R.; López, M. Influence of tip clearance on flow behavior and noise generation of centrifugal compressors in near-surge conditions. Int. J. Heat Fluid Flow 2015, 52, 129–139. [Google Scholar] [CrossRef]
  24. Sundström, E.; Semlitsch, B.; Mihaescu, M. Centrifugal compressor: The sound of surge. In Proceedings of the 21st AIAA/CEAS Aeroacoustics Conference, Dallas, TX, USA, 22–26 June 2015. [Google Scholar]
  25. Sundström, E.; Mihăescu, M.; Giachi, M.; Belardini, E.; Michelassi, V. Analysis of Vaneless Diffuser Stall Instability in a Centrifugal Compressor. Int. J. Turbomach. Propuls. Power 2017, 2, 19. [Google Scholar] [CrossRef] [Green Version]
  26. Jyothishkumar, V.; Mihaescu, M.; Semlitsch, B.; Fuchs, L. Numerical flow analysis in centrifugal compressor near surge condition. In Proceedings of the 43rd AIAA Fluid Dynamics Conference, San Diego, CA, USA, 24–27 June 2013. [Google Scholar] [CrossRef]
  27. Broatch, A.; Galindo, J.; Navarro, R.; García-Tíscar, J. Methodology for experimental validation of a CFD model for predicting noise generation in centrifugal compressors. Int. J. Heat Fluid Flow 2014, 50, 134–144. [Google Scholar] [CrossRef]
  28. Guo, Q.; Chen, H.; Zhu, X.C.; Du, Z.H.; Zhao, Y. Numerical simulations of stall inside a centrifugal compressor. Proceedings of the Institution of Mechanical Engineers. J. Power Energy 2007, 221, 683–693. [Google Scholar] [CrossRef]
  29. Tomita, I.; Ibaraki, S.; Furukawa, M.; Yamada, K. The Effect of Tip Leakage Vortex for Operating Range Enhancement of Centrifugal Compressor. J. Turbomach. 2013, 135, 051020. [Google Scholar] [CrossRef]
  30. Chen, Q.; Ni, J.; Wang, Q.; Shi, X. Match-based pseudo-MAP full-operation-range optimization method for a turbocharger compressor. Struct. Multidiscip. Optim. 2019, 60, 1139–1153. [Google Scholar] [CrossRef]
  31. Fan, H.; Ni, J.; Shi, X.; Qu, D.; Zheng, Y.; Zheng, Y. Simulation of a Combined Nozzled and Nozzleless Twin-Entry Turbine for Improved Efficiency. J. Eng. Gas Turbines Power 2019, 141, 051019. [Google Scholar] [CrossRef]
  32. Semlitsch, B.; JyothishKumar, V.; Mihaescu, M.; Fuchs, L.; Gutmark, E.; Gancedo, M. Numerical Flow Analysis of a Centrifugal Compressor with Ported and without Ported Shroud; SAE Technical Paper 2014-01-1655; SAE International: Warrendale, PA, USA, 2014. [Google Scholar] [CrossRef] [Green Version]
  33. Fardafshar, N.; Koutsovasilis, P. Ported Shroud Influence on the Aero-Acoustic Properties of Automotive Turbochargers: Quantification by Means of Simulation and Measurement. DAGA 2018—44. Jahrestagung für Akustik. 2018. Available online: https://www.google.com.hk/url?sa=t&source=web&cd=&cad=rja&uact=8&ved=2ahUKEwjogp3tmZyAAxVvg1YBHQ0kB60QFnoECAkQAQ&url=https%3A%2F%2Fpub.dega-akustik.de%2FDAGA_2018%2Fdata%2Farticles%2F000021.pdf&usg=AOvVaw1AnSuOQ2osRHo3dyat0V3z&opi=89978449 (accessed on 25 June 2023).
  34. Celik, I.B.; Ghia, U.; Roache, P.J.; Freitas, C.J. Procedure for Estimation and Reporting of Uncertainty Due to Discretization in CFD Applications. J. Fluids Eng. 2008, 130, 078001. [Google Scholar]
  35. Huang, R.; Ni, J.; Fan, H.; Shi, X.; Wang, Q. Investigating a New Method-Based Internal Joint Operation Law for Optimizing the Performance of a Turbocharger Compressor. Sustainability 2023, 15, 990. [Google Scholar] [CrossRef]
  36. Yin, S.; Ni, J.; Fan, H.; Shi, X.; Huang, R. A Study of Evaluation Method for Turbocharger Turbine Based on Joint Operation Curve. Sustainability 2022, 14, 9952. [Google Scholar] [CrossRef]
  37. Shi, C.; Chai, S.; Di, L.; Ji, C.; Ge, Y.; Wang, H. Combined experimental-numerical analysis of hydrogen as a combustion enhancer applied to wankel engine. Energy 2023, 263, 125896. [Google Scholar] [CrossRef]
  38. Zuo, S.G.; He, H.J.; Wu, X.D.; Wei, K.J. Numerical Analysis on Effects of Inlet Bent Pipe’s Position on a Centrifugal Compressor’s Aerodynamic Noise. Appl. Mech. Mater. 2014, 633–634, 1196–1201. [Google Scholar] [CrossRef]
  39. Zamiri, A.; Choi, M.; Chung, J.T. Effect of blade squealer tips on aerodynamic performance and stall margin in a transonic centrifugal compressor with vaned diffuser. Aerosp. Sci. Technol. 2022, 123, 107504. [Google Scholar] [CrossRef]
  40. Guan, D.; Sun, D.; Xu, R.; Bishop, D.; Sun, X.; Ni, S.; Du, J.; Zhao, D. Experimental investigation on axial compressor stall phenomena using aeroacoustics measurements via empirical mode and proper orthogonal decomposition methods. Aerosp. Sci. Technol. 2021, 112, 106655. [Google Scholar] [CrossRef]
  41. Liu, C.; Cao, Y.; Zhang, W.; Ming, P.; Liu, Y. Numerical and experimental investigations of centrifugal compressor BPF noise. Appl. Acoust. 2019, 150, 290–301. [Google Scholar] [CrossRef]
  42. Xu, Q.; Wu, J.; Wu, L.; Yang, H.; Wang, Z.; Wei, Y. Pressure and velocity fluctuations characteristics of the tip clearance flow in an axial compressor stage at the near-stall condition. Aerosp. Sci. Technol. 2022, 129, 107796. [Google Scholar] [CrossRef]
Figure 1. Investigation procedure.
Sustainability 15 11300 g001
Figure 2. Schematic diagram of compressor aerodynamic noise test device. 1. Compressor inlet flowmeter. 2. Compressor inlet pressure sensor. 3. Compressor inlet temperature sensor. 4. Speed sensor. 5. Compressor. 6. Compressor outlet temperature sensor. 7. Automatic circulating valve. 8. Electric exhaust control valve. 9. Electric trimming valve. 10. Turbine. 11. Burner. 12. Turbine inlet flowmeter. 13. Turbine inlet control valve. 14. Air source vent valve. 15. Filter. 16. Air source. 17. Vibration sensors. 18. Microphone. 19. Signal acquisition port. 20. Computer.
Sustainability 15 11300 g002
Figure 3. Aerodynamic noise test condition points.
Sustainability 15 11300 g003
Figure 4. Aerodynamic noise simulation points.
Sustainability 15 11300 g004
Figure 5. Compressor fluid domain and monitoring points distribution. (a) Compressor model (b) Rotor region (c) Diffuser and volute regions.
Sustainability 15 11300 g005aSustainability 15 11300 g005b
Figure 6. Extrapolation results in pressure ratio and efficiency to several elements at a speed of 60,000 r/min.
Sustainability 15 11300 g006
Figure 7. Compressor model test verification. (a) Pressure ratio (b) Efficiency.
Sustainability 15 11300 g007
Figure 8. Aerodynamic noise emissions composition.
Sustainability 15 11300 g008
Figure 9. Aerodynamic noise emissions spectral characteristics of the compressor under different operating conditions. (a) 60,000 r/min (b) 90,000 r/min (c) 110,000 r/min.
Sustainability 15 11300 g009aSustainability 15 11300 g009b
Figure 10. Aerodynamic noise emissions contour clouds of compressors under different operating conditions. (a) Case 1 (b) Case 2 (c) Case 3.
Sustainability 15 11300 g010aSustainability 15 11300 g010b
Figure 11. Total sound pressure level and blade passing frequency noise of the compressor under full operating range. (a) Total sound pressure level (b) BPF nose.
Sustainability 15 11300 g011
Figure 12. Blade passing frequency noise proportion.
Sustainability 15 11300 g012
Figure 13. Transient acoustic-vibration characteristics of the compressor under high-efficiency regions. (a) 60,000 r/min (b) 90,000 r/min (c) 110,000 r/min.
Sustainability 15 11300 g013aSustainability 15 11300 g013b
Figure 14. Fluctuation pressure analysis process of the compressor.
Sustainability 15 11300 g014
Figure 15. Time domain fluctuation pressure distributions of the compressor inlet region under different speeds. (a) 60,000 r/min (b) 90,000 r/min (c) 110,000 r/min.
Sustainability 15 11300 g015
Figure 16. Frequency domain fluctuation pressure distributions of the compressor inlet region under different speeds. (a) 60,000 r/min (b) 90,000 r/min (c) 110,000 r/min.
Sustainability 15 11300 g016
Figure 17. Time domain fluctuation pressure distributions of the compressor rotor region under different speeds. (a) 60,000 r/min (b) 90,000 r/min (c) 110,000 r/min.
Sustainability 15 11300 g017
Figure 18. Frequency domain fluctuation pressure distributions of the compressor rotor region under different speeds. (a) 60,000 r/min (b) 90,000 r/min (c) 110,000 r/min.
Sustainability 15 11300 g018
Figure 19. Pressure distribution in the compressor rotor region at 60,000 r/min of the high-efficiency region. (a) F1 (b) F2.
Sustainability 15 11300 g019
Figure 20. Time domain fluctuation pressure distributions of the compressor diffuser region under different speeds. (a) 60,000 r/min (b) 90,000 r/min (c) 110,000 r/min.
Sustainability 15 11300 g020aSustainability 15 11300 g020b
Figure 21. Frequency domain fluctuation pressure distributions of the compressor diffuser region under different speeds. (a) 60,000 r/min (b) 90,000 r/min (c) 110,000 r/min.
Sustainability 15 11300 g021
Figure 22. Time domain fluctuation pressure distributions of the compressor volute region under different speeds. (a) 60,000 r/min (b) 90,000 r/min (c) 110,000 r/min.
Sustainability 15 11300 g022aSustainability 15 11300 g022b
Figure 23. Frequency domain fluctuation pressure distributions of the compressor volute region under different speeds. (a) 60,000 r/min (b) 90,000 r/min (c) 110,000 r/min.
Sustainability 15 11300 g023
Figure 24. Static entropy and TKE distribution of the compressor at 60,000 r/min of the high-efficiency region. (a) Static entropy (b) TKE.
Sustainability 15 11300 g024
Figure 25. Blade-to-blade view of Static entropy and TKE distribution for the compressor at 60,000 r/min of the high-efficiency region. (a) Static entropy (b) TKE.
Sustainability 15 11300 g025
Table 1. Measuring ranges, accuracies, and uncertainties of instruments.
InstrumentsParametersMeasuring RangeAccuracyUncertainty
TachometerSpeed0~400,000 r/min0.1 r/min0.01 r/min
MicrophoneNoise15~165 dB0.1 dB±0.02 dB
Vibration sensorVibration±490 m/s2 pk1%±0.2 m/s2
Temperature sensorCompressor inlet and outlet temperature−200~400 °C0.25 °C±0.1 °C
Pressure sensorCompressor inlet pressure−175~35,000 Pa, −40~85 °C0.05%±0.01%
Pressure sensorCompressor outlet pressure0~700,000 Pa, −40~85 °C0.05%±0.01%
Temperature sensorTurbine inlet and outlet temperature−200~1372 °C0.4%±0.1 °C
Pressure sensorTurbine inlet pressure0~700,000 Pa, −40~85 °C0.05%±0.01%
Pressure sensorTurbine outlet pressure−175~35,000 Pa, −40~85 °C0.05%±0.01%
Table 2. Compressor parameters.
ItemValue
Turbocharger compatibilityHeavy-duty diesel engine
Outlet diameter of impeller (mm)94.4
Inlet diameter of impeller (mm)66.46
Main blade number7
Splitter blade number7
Diffuser height (mm)4.77
Design pressure ratio4.5
Rated speed (r/min)117,000
Outlet diameter of the diffuser (mm)166.15
Inlet diameter of the diffuser (mm)90
Type of coolingOil cooling
Table 3. Comparison of the various numerical parameters critical to modeling compressor aerodynamics and noise generation in this survey with other literature surveys.
StudyTip Diameter (mm)Elements (Million)Wheel Rotation (-)Turbulence Method (-)Boundary ConditionsTime Steps (°)
InletOutlet
Sundström et al. [24]889SlidingLESPressureMass flow1
Fontenasi et al. [18]-9.6SlidingDESMass flowPressure0.5
Broatch et al. [27]48.69.6SlidingDESMass flowPressure1
Karim et al. [9]--SlidingLESPressureMass flow-
Semlitsch et al. [32]886SlidingLESMass flowPressure5
Jyothishkumar et al. [26]886SlidingLESMass flowPressure5
Tomita et al. [29]503.2-URANS (k-ε)--3.6/7.2
Guo et al. [28]182.82.5SlidingURANS (k-ε)PressureMass flow3
Dehner et al. [21]-5.5StaticDESPressureMass flow-
Galindo et al. [22]-10SlidingDESMass flowPressure4
Galindo et al. [23]-9.5SlidingSST/DESMass flowPressure1
Fardafshar et al. [33]--StaticSAS-SST---
This investigation-4.9SlidingSSTPressureMass flow4
Table 4. Equations for Richardson extrapolation method.
FactorEquation
Representative mesh size h h = 1 N i = 1 N Δ V i 1 / 3
Grid refinement factor r r = h c o a r s e h f i n e
Apparent order p p = 1 l n r 21 l n ε 32 / ε 21 + q p
Approximate relative error e a 21 e a 21 = ϕ 1 ϕ 2 ϕ 1
Extrapolated relative error e e x t 21 e e x t 21 = ϕ e x t 12 ϕ 1 ϕ e x t 12
Grid convergence index G C I f i n e 21 G C I f i n e 21 = 1.25 e a 21 r 21 p 1
Table 5. Discretization errors of three meshes.
ϕ =   Pressure   Ratio ϕ =   Efficiency
N1, N2, N36,730,132, 4,932,456, 3,102,8946,730,132, 4,932,456, 3,102,894
r312.41922.4192
r211.82921.8292
r321.32261.3226
ϕ 1 1.58640.8146
ϕ 2 1.58410.8120
ϕ 3 1.57360.8017
p 0.79322.2437
ϕ e x t 21 1.59010.8155
e a 21 0.145%0.3192%
e e x t 21 0.2327%0.1101%
G C I f i n e 21 0.295%0.1387%
Table 6. Comparison of the investigation and other literature survey.
StudyResearch ObjectResearch MethodsMain Conclusions
Li et al. [12]Turbocharger for small vehiclesExperimentThe compressor was the main noise source of the turbocharger.
Raitor et al. [13]Two centrifugal compressors of SRV2 and SRV4Experiment
(1)
At the design speed, blade tone and buzz-saw noise were the main contributors.
(2)
On the inlet, rotor-alone noise was the main source.
Figurella et al. [14]An automotive centrifugal compressorExperimentNear-choke condition, discrete tones, including rotor-order frequency and its harmonics (blade-pass), were observed.
Zhang et al. [15]Single-stage compressor with low speed and high loadExperimentThe sound pressure level of the compressor was lowest at a relatively small tip clearance rather than zero.
Galindo et al. [16]A small automotive turbocharger compressorExperimentThe effects of several inlet geometries on compressor performance were investigated.
Dehner et al. [21]A turbocharger centrifugal compressor from a spark-ignition internal combustion engineNumerical simulation, experiments and modal decomposition
(1)
Revealed the presence of rotating instabilities that may interact with the rotor blades to generate noise.
(2)
The whooshing noise primarily propagated along the duct as acoustic azimuthal modes.
Galindo et al. [22]An automotive centrifugal compressorNumerical simulationThe use of a convergent-divergent nozzle could strongly reduce the intake orifice noise.
Galindo et al. [23]A 49 mm exducer diameter centrifugal compressorNumerical simulationIn near-surge conditions, there were no significant changes in the compressor acoustic signature when varying the tip clearance.
Sundström et al. [24]An automotive centrifugal compressorNumerical simulationFor the near-surge condition, an amplified broadband feature at two times the frequency of the rotating order of the shaft (possible whoosh noise) was captured. In addition, an amplified feature of around 50% of the rotating order was captured.
Jyothishkumar et al. [26]A turbocharger centrifugal compressor from a heavy truck engineNumerical simulationThere existed a flow-acoustics coupling at near-surge operating conditions.
Broatch et al. [27]A turbocharger centrifugal compressor from a diesel engineIn-duct experimental measurements and numerical simulation
(1)
A suitable comparison methodology was developed, relying on pressure decomposition.
(2)
Whoosh, noise at the outlet duct was detected in experimental and numerical spectra.
Guo et al. [28]A turbocharger centrifugal compressorNumerical simulationA distinct stall frequency at the given compressor speed.
This investigationA turbocharger centrifugal compressor from a heavy-duty diesel engineBased on radiated noise experimental measurements and numerical simulation
(1)
The aerodynamic noise characteristics of the centrifugal compressor in the full operating range based on the radiation noise experimental measurements were given.
(2)
For the centrifugal compressor from a heavy-duty diesel engine, the blade passing frequency and its harmonic frequency noise were mainly caused by the unsteady fluctuation pressure.
(3)
The impeller blades interfere with the incoming airflow, and the dynamic-static interference between the impeller and the diffuser significantly contributed to the BPF and its harmonic frequency noise.
Disclaimer/Publisher’s Note: The statements, opinions and data contained in all publications are solely those of the individual author(s) and contributor(s) and not of MDPI and/or the editor(s). MDPI and/or the editor(s) disclaim responsibility for any injury to people or property resulting from any ideas, methods, instructions or products referred to in the content.

