Article

Natural Nitrogen-Bearing and Phosphorus-Bearing Nanoparticles in Surface Sediments of the Pearl River Estuary, China: Implications for Nitrogen and Phosphorus Cycling in Estuarine and Coastal Ecosystems

1
School of Geographical Sciences, Shanxi Normal University, Taiyuan 030031, China
2
South China Institute of Environmental Sciences, Ministry of Ecology and Environment, Guangzhou 510655, China
3
Shanxi Museum of Geology, Taiyuan 030024, China
*
Authors to whom correspondence should be addressed.
Sustainability 2023, 15(19), 14301; https://doi.org/10.3390/su151914301
Submission received: 27 August 2023 / Revised: 24 September 2023 / Accepted: 25 September 2023 / Published: 27 September 2023

Abstract

:
Eutrophication creates multiple environmental problems, threatening the ecological security and sustainability of estuarine and coastal ecosystems worldwide. Key nutrients of concern are nitrogen (N) and phosphorus (P), which are the main controls in eutrophication. Considering that sediments are inseparable sinks of N and P, concern has grown regarding the forms in which N and P occur in the surface sediments of estuaries and coastal areas. Nonetheless, studies on the natural N-bearing or P-bearing nanoparticles in estuarine and coastal sediments have rarely been reported. Herein, the surface sediments (0–5 cm) of the Pearl River Estuary in China were collected and subjected to analysis. Using high-resolution transmission electron microscopy (HR-TEM) analysis, numerous natural N-bearing and P-bearing nanoparticles were observed. The results revealed that there are some differences in the occurrence forms of N and P in nanoparticles, suggesting that N and P could be adsorbed by nanoparticles of minerals such as hematite, goethite, muscovite, anorthite and quartz in estuarine and coastal environments, and further form N-bearing and P-bearing nanoparticles. These nanoparticles contained small amounts of N (1.52–3.73 wt%) and P (0.22–1.12 wt%), and were mainly single crystal or polycrystalline in form, with sizes ranging from 10 nm × 50 nm to 250 nm × 400 nm. In addition, P was shown to exist in the form of Ca and Fe phosphate nanoparticles in the estuarine sediments. The Ca and Fe phosphate nanoparticles had higher phosphorus content (5.02–9.97 wt%), mainly amorphous, with sizes ranging from 50 nm × 120 nm to 250 nm × 400 nm. Moreover, N-bearing and P-bearing nanoparticles could influence the migration, precipitation and release processes of N and P, and play a certain role in the N-cycling and P-cycling of estuarine and coastal ecosystems. Furthermore, we explored the role of N-bearing and P-bearing nanoparticles in the N-cycling and P-cycling in estuarine and coastal ecosystems. Thus, this study could provide new ideas for water environment management and other related research fields.

1. Introduction

As interaction and transition zones between ocean and land, estuarine and coastal areas provide highly valuable ecosystem benefits for humans [1,2,3]. However, urbanization and human-led development have greatly accelerated the flows of nutrients to estuarine and coastal areas over recent decades, alarmingly increasing rates of nutrient over-enrichment and causing widespread eutrophication [4,5,6]. Eutrophication creates multiple problems, including hypoxic “dead zones”, harmful algal blooms, threatening the ecological security and sustainability of estuarine and coastal ecosystems world-wide [7,8]. Key nutrients of concern include nitrogen (N) and phosphorus (P), which are considered to be the most important limiting nutrients for life processes in aquatic ecosystems and the main controls in eutrophication [7,9]. As the supply rate of N and P in water bodies determines the primary production of aquatic plants, the research of nutrient elements N and P has gradually received more attention in the field of water management [1,5,7,10,11,12].
As a closely linked part of water bodies, sediments are generally regarded as the main sinks of N and P in estuarine and coastal ecosystems, playing an important role in local N-cycling and P-cycling [5,13,14,15]. Due to the frequent changes in physical–chemical properties and hydrodynamic conditions, the precipitated N and P in sediments can be released and enter into overlying water bodies, thus leading to anabatic water pollution and eutrophication [16,17,18]. Previous studies on estuarine and coastal systems have usually focused on the common forms of N (ion forms NH4+, NO3− and NO2−; molecule forms NO, NO2, and NO3; and macromolecular compounds protein and DNA) and P (ion form PO43−; insoluble phosphate forms Ca, Fe and Al phosphates; and organic phosphorus) [5,19,20,21,22]. On the other hand, nanoparticles are abundant in estuarine and coastal sediments due to the continual supergene processes [23]. Natural nanoparticles have special properties such as high mobility and adsorption properties due to their extremely small size and surface-to-volume ratio [24,25]. Thus, nanoparticles always play an important role in the many physiochemical processes [26,27]. Therefore, in recent years, researchers have begun to pay attention to the role of nanoparticles in the N-cycling and P-cycling of aquatic ecosystems. For example, the interaction of nanoparticles of minerals such as hematite, goethite and titanium dioxide with N and P (organic and inorganic forms) has been investigated under laboratory conditions in recent studies [28,29,30,31]. Meanwhile, recent studies have also revealed that hematite and goethite nanoparticles have significant adsorption effects on N and P compounds, and this effect is affected by physical and chemical conditions and the particle size of nanoparticles [28,29,31,32]. Moreover, N-bearing nanoparticles have been observed to participate in the biochemical processes of a variety of bacteria and fungi [33,34], and can play a role in providing nutrients during plant growth [35]. Nonetheless, studies on the natural N-bearing or P-bearing nanoparticles in estuarine and coastal sediments have rarely been reported. Liu et al. [36] first observed that N could occur as nanoparticles in estuarine surface sediments, and proposed that N-bearing nanoparticles may be a new transport form of N in estuarine and coastal environments. However, to the best of our knowledge, no work has yet been reported regarding natural P-bearing nanoparticles in estuarine and coastal sediments.
As one of the most important economic centers and the main river in South China, the Pearl River Estuary has long suffered from environmental problems such as eutrophication and harmful algal blooms caused by excessive nutrients (especially N and P) [37,38]. Therefore, the Pearl River Estuary is an excellent place to study the mechanisms of N-cycling and P-cycling in estuary and coastal ecosystems.
In this study, high-resolution transmission electron microscopy (HR-TEM) was used as our primary probing technique. We discovered and analyzed numerous N-bearing and P-bearing nanoparticles in surface sediments. The characteristics of N-bearing and P-bearing nanoparticles, including categories, sizes, shapes, chemical compositions and crystalline features, were obtained. Based on the HR-TEM observation results, the forms in which N-bearing and P-bearing nanoparticles were present in surface sediments were compared and analyzed. Furthermore, we explored the role of N-bearing and P-bearing nanoparticles in the N-cycling and P-cycling in estuarine and coastal ecosystems. Thus, this study could provide new ideas for the water environment management and other related research fields.

2. Materials and Methods
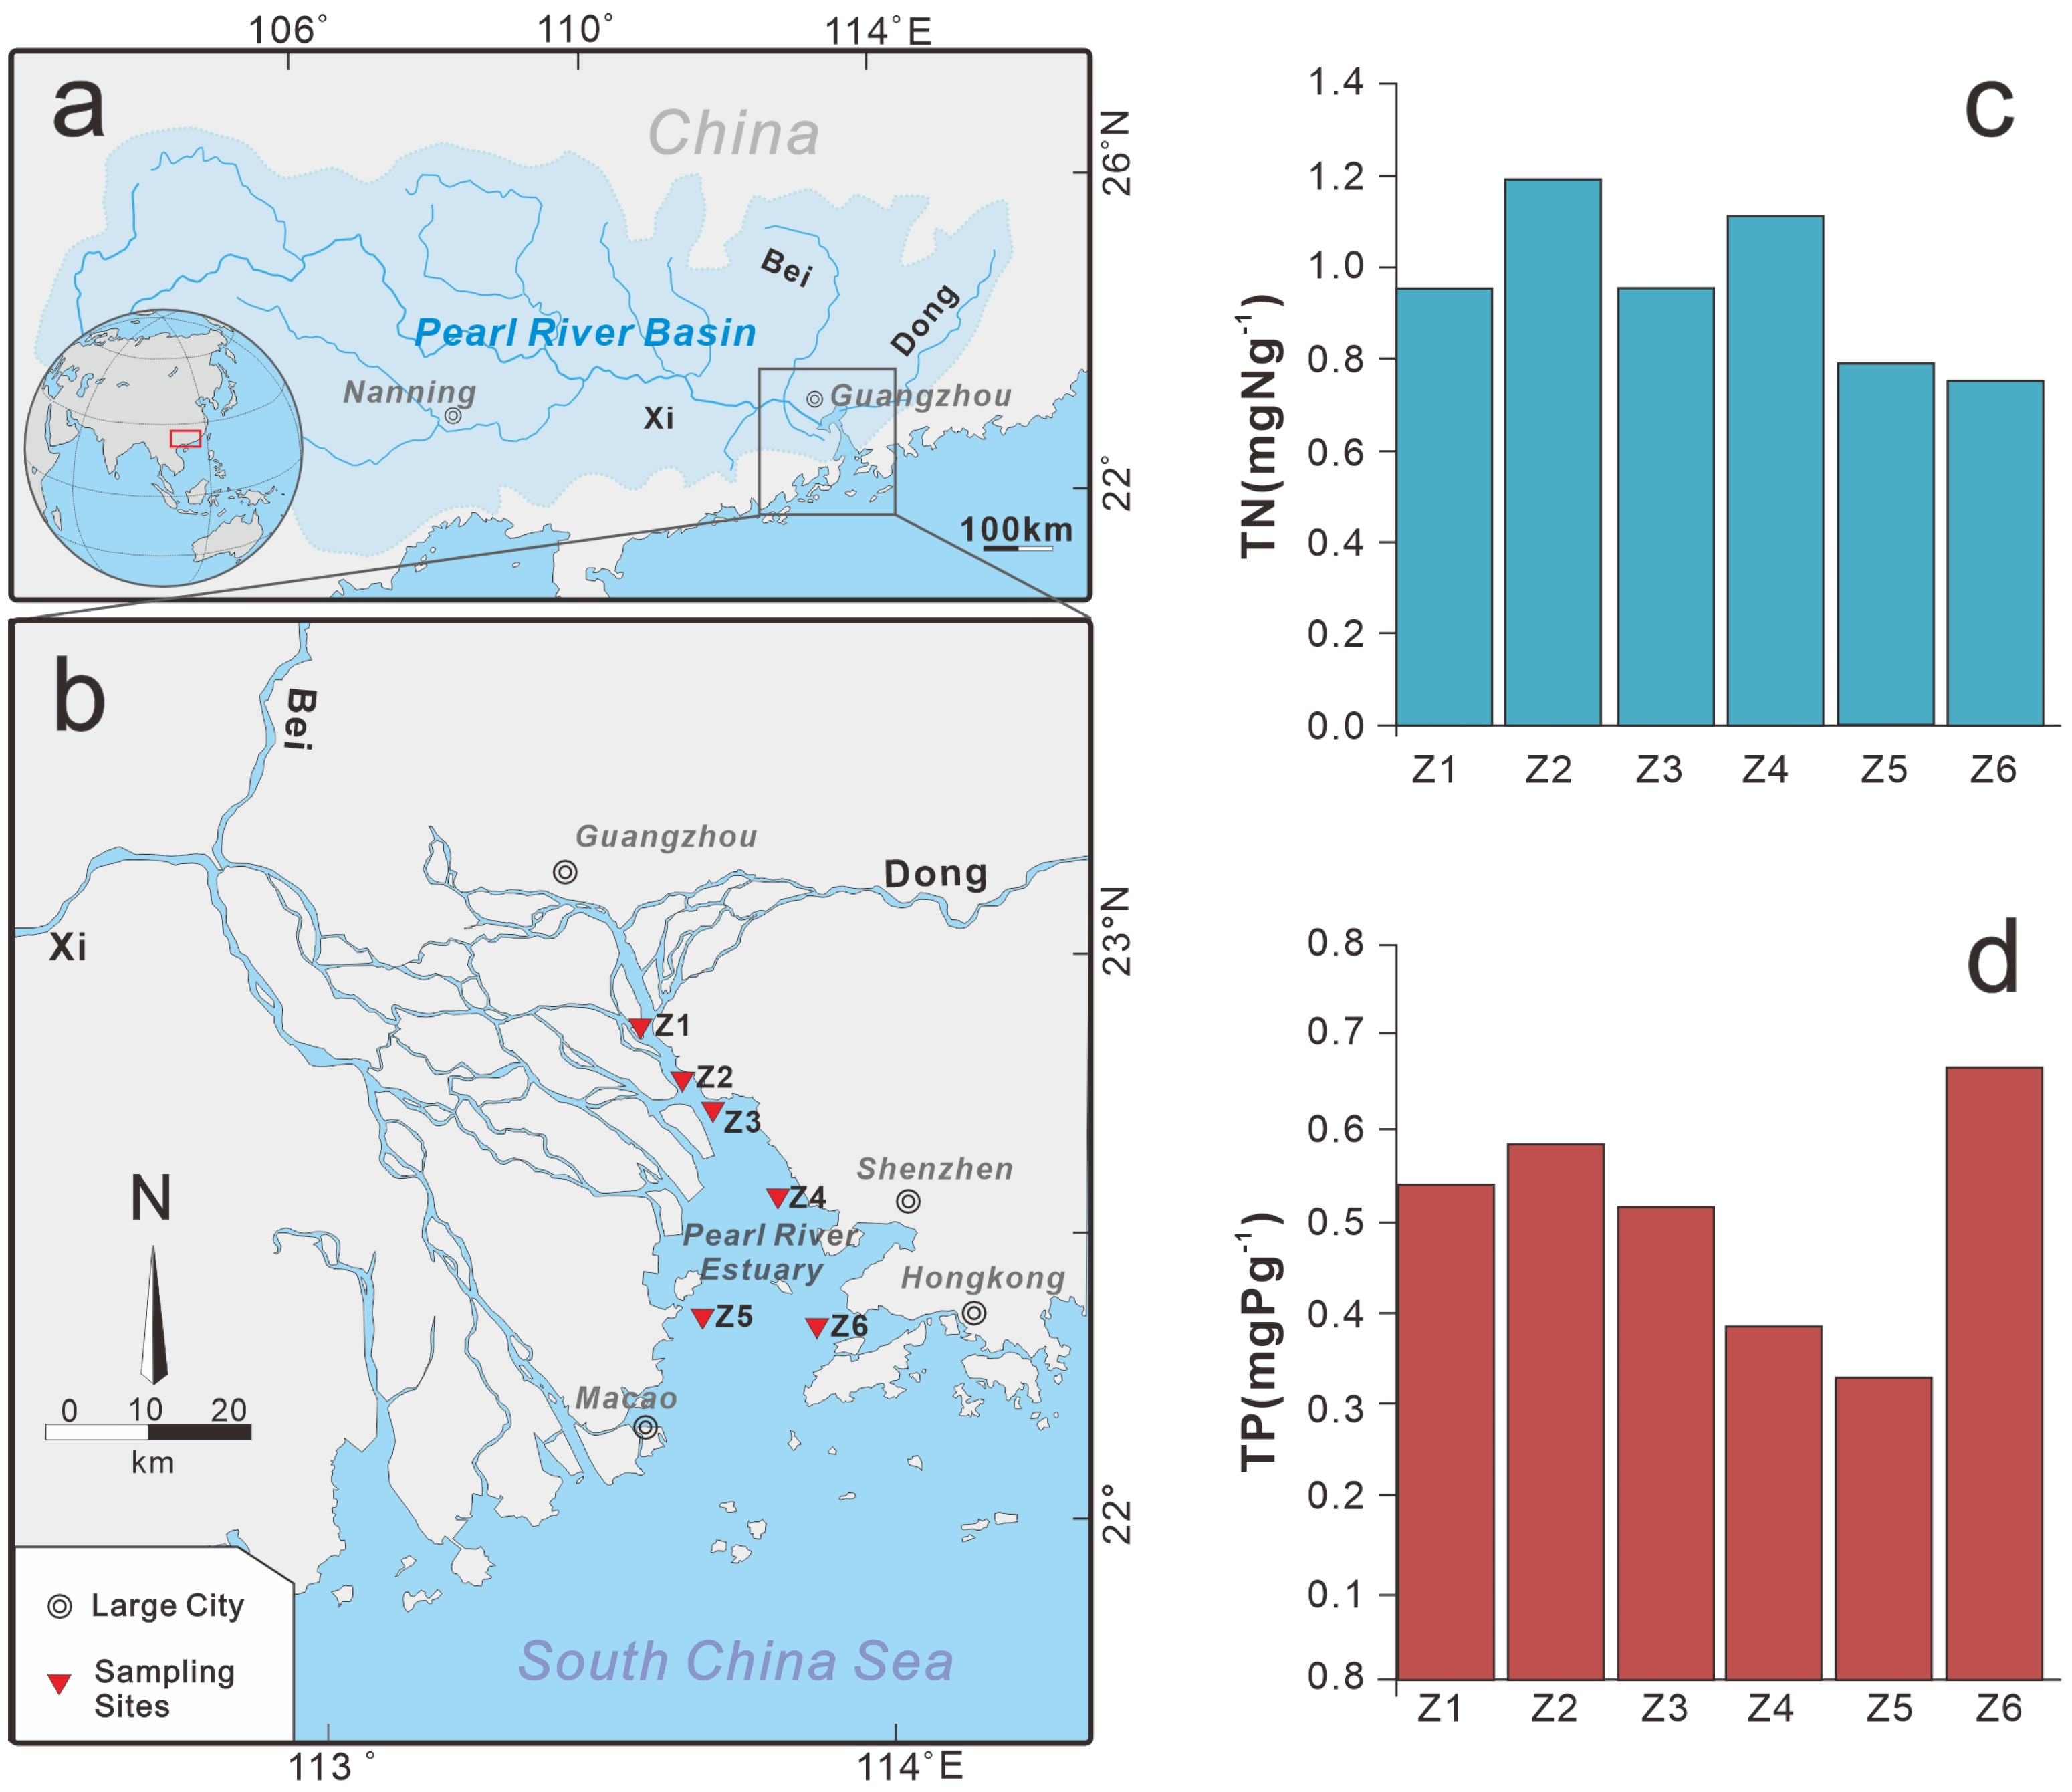
2.1. Study Area

The Pearl River, spanning a total length of 2320 km and encompassing a drainage area exceeding 450,000 km2, stands as the paramount river in Southern China (Figure 1a,b) [39,40,41]. According to the Pearl River Sediment Bulletin 2021, the average annual runoff of the Pearl River exceeds 342.1 km3, ranking second only to the Yangtze River in China. The Xi (west), Bei (north), and Dong (east) Rivers are the three principal branches of the Pearl River, which eventually converge and flow into the Pearl River Estuary. The Pearl River Delta, where the Pearl River Estuary is located, has a diverse ecosystem and rich products, feeding a population exceeding 50 million [39,42]. The Pearl River Delta serves as the foundation basis for the urban agglomeration of the Guangdong–Hong Kong–Macao Greater Bay Area (GBA), which has evolved into one of the foremost bay regions globally [43]. With the rapid growth in population and expansion of human activities over recent decades, the Pearl River Estuary has gradually become a region with numerous ecological problems, such as eutrophication and harmful algal blooms caused by excessive nutrients (especially N and P) [37,38]. Located in the northern part of the South China Sea, the Pearl River Estuary spans 2000 km2 and has an average depth of less than 30 m [39]. Its sediments primarily comprise diverse geological units in the basin and stored a variety of terrigenous materials [44,45].

2.2. Sampling Methods

In this study, 6 surface sediment samples were collected from 6 sampling sites in the Pearl River Estuary in 2021. The locations of sampling sites (Z1–Z6) are shown in Figure 1 and Table 1. The surface sediment (0–5 cm) was collected at each sampling site using a stainless-steel grab sampler, with a total weight of 500 g. The samples were immediately sealed separately in the sampling bag and transported on ice to the laboratory. The grain sizes of the 6 samples were mainly muddy-silty, while their colors were mainly yellow to brownish yellow. In the laboratory, the sediments in each station were divided into two individual parts. A part of each sample was stored at 4 °C until further X-ray powder diffraction (XRD) analysis and TEM analysis. Another part of each sample was preserved at −20 °C for measurements of total nitrogen (TN) and total phosphorus (TP).

2.3. Analysis Methods

The analysis methods for the determination of total nitrogen (TN) and total phosphorus (TP) were in accordance with the national standard (GB/T 17378.5-2007) of China [46]. TN and TP contents were determined using the semi-micro Kjeldahl method and molybdate colorimetry method, respectively. The P contents in the samples were determined using a visible spectrophotometer (722 type, Shanghai, China). The methods were described in detail in a previous study [47]. All analyses of TN and TP were conducted at the South China Institute of Environment Sciences (Guangzhou, China).
The main mineral components of the samples were analyzed using XRD. Before analysis, sediment samples underwent pretreatment. A part of each sample was extracted and subjected to drying at 50 °C for 24 h. After cooling, the sample was removed and passed through 200 mesh sieves. Each resulting sample was then stored in an individual sealed bag for subsequent XRD analysis. The instrument employed in this study was Rigaku SmartLab X-ray diffractometer (Tokyo, Japan). With the following key parameters: Cu radiation; voltage: 30 kV; current: 20 mA; scanning range: 5° to 100°; scanning rate: 4°/min.
The structural/chemical information of the samples was obtained using an FEI Talos F200X high-resolution transmission electron microscope (HR-TEM) instrument. The sediment samples were placed on the Cu/Mo-C TEM grids for TEM-EDS analysis. The preparation method has been described in previous studies [36,48]. The main steps were as follows: (I) The TEM grid was carefully handled with a clean tweezer, and a minute amount of the original sample stored at 4 °C was delicately collected using another tweezer and evenly spread on the grid. (II) Subsequently, this TEM grid was placed on a dry and clean filter paper to absorb the water in the sediment. (III) Then, the TEM grid was securely clamped with a clean tweezer, and the impurities present on the surface of the grid were blown off by a rubber pipette bulb. (IV) Steps (II) and (III) were repeated iteratively until all visible impurities and moisture had been eliminated from the surface of the TEM grid. The prepared TEM grid was carefully placed in a clean container, ensuring that the TEM test commenced within a time frame of 15 min. The energy dispersive X-ray spectra (EDS), image, selected area electron diffraction (SAED) pattern and HR-TEM of the nanoparticles were obtained. The maximum accelerating voltage was 200 kV, and the dot resolution and linear resolution were 0.20 nm and 0.14 nm, respectively. The maximum magnification of the TEM and TEM(STEM) were 1.5 and 2.3 million, respectively. The high-angle annular dark-field scanning transmission electron microscope (HAADF-STEM) were used in this study, and the image resolution was 0.16 nm. The C and Cu/Mo contents were not considered to avoid the effects of the chemical composition of Cu/Mo-C TEM grids.
The XRD and the TEM tests were conducted at the Sinoma Institute of Materials Research (Guangzhou, China) Co., Ltd.

3. Results

3.1. Total Nitrogen (TN) and Total Phosphorus (TP) in the Surface Sediments

Figure 1c,d and Table 1 show the concentrations of total nitrogen (TN) and total phosphorus (TP) in the surface sediments from the Pearl River Estuary. The TN concentrations in sediments ranged from 0.758 to 1.190 mg/g, with the mean value of 0.960 mg/g, while TP concentrations in surface sediments ranged from 0.328 to 0.668 mg/g, with the mean value of 0.503 mg/g. These results indicate that the TN contents in the sediments of the studied area generally exceeded the standard safety level (TN < 0.55 mg/g), while the TP contents in some of the sediments (Z1, Z2 and Z6) were close to or exceeded the standard safety level (TP < 0.60 mg/g), which could cause low-level ecotoxicological effects (according to the Manual for Sediment Quality Assessment by Ontario Environment and Energy, 1992).

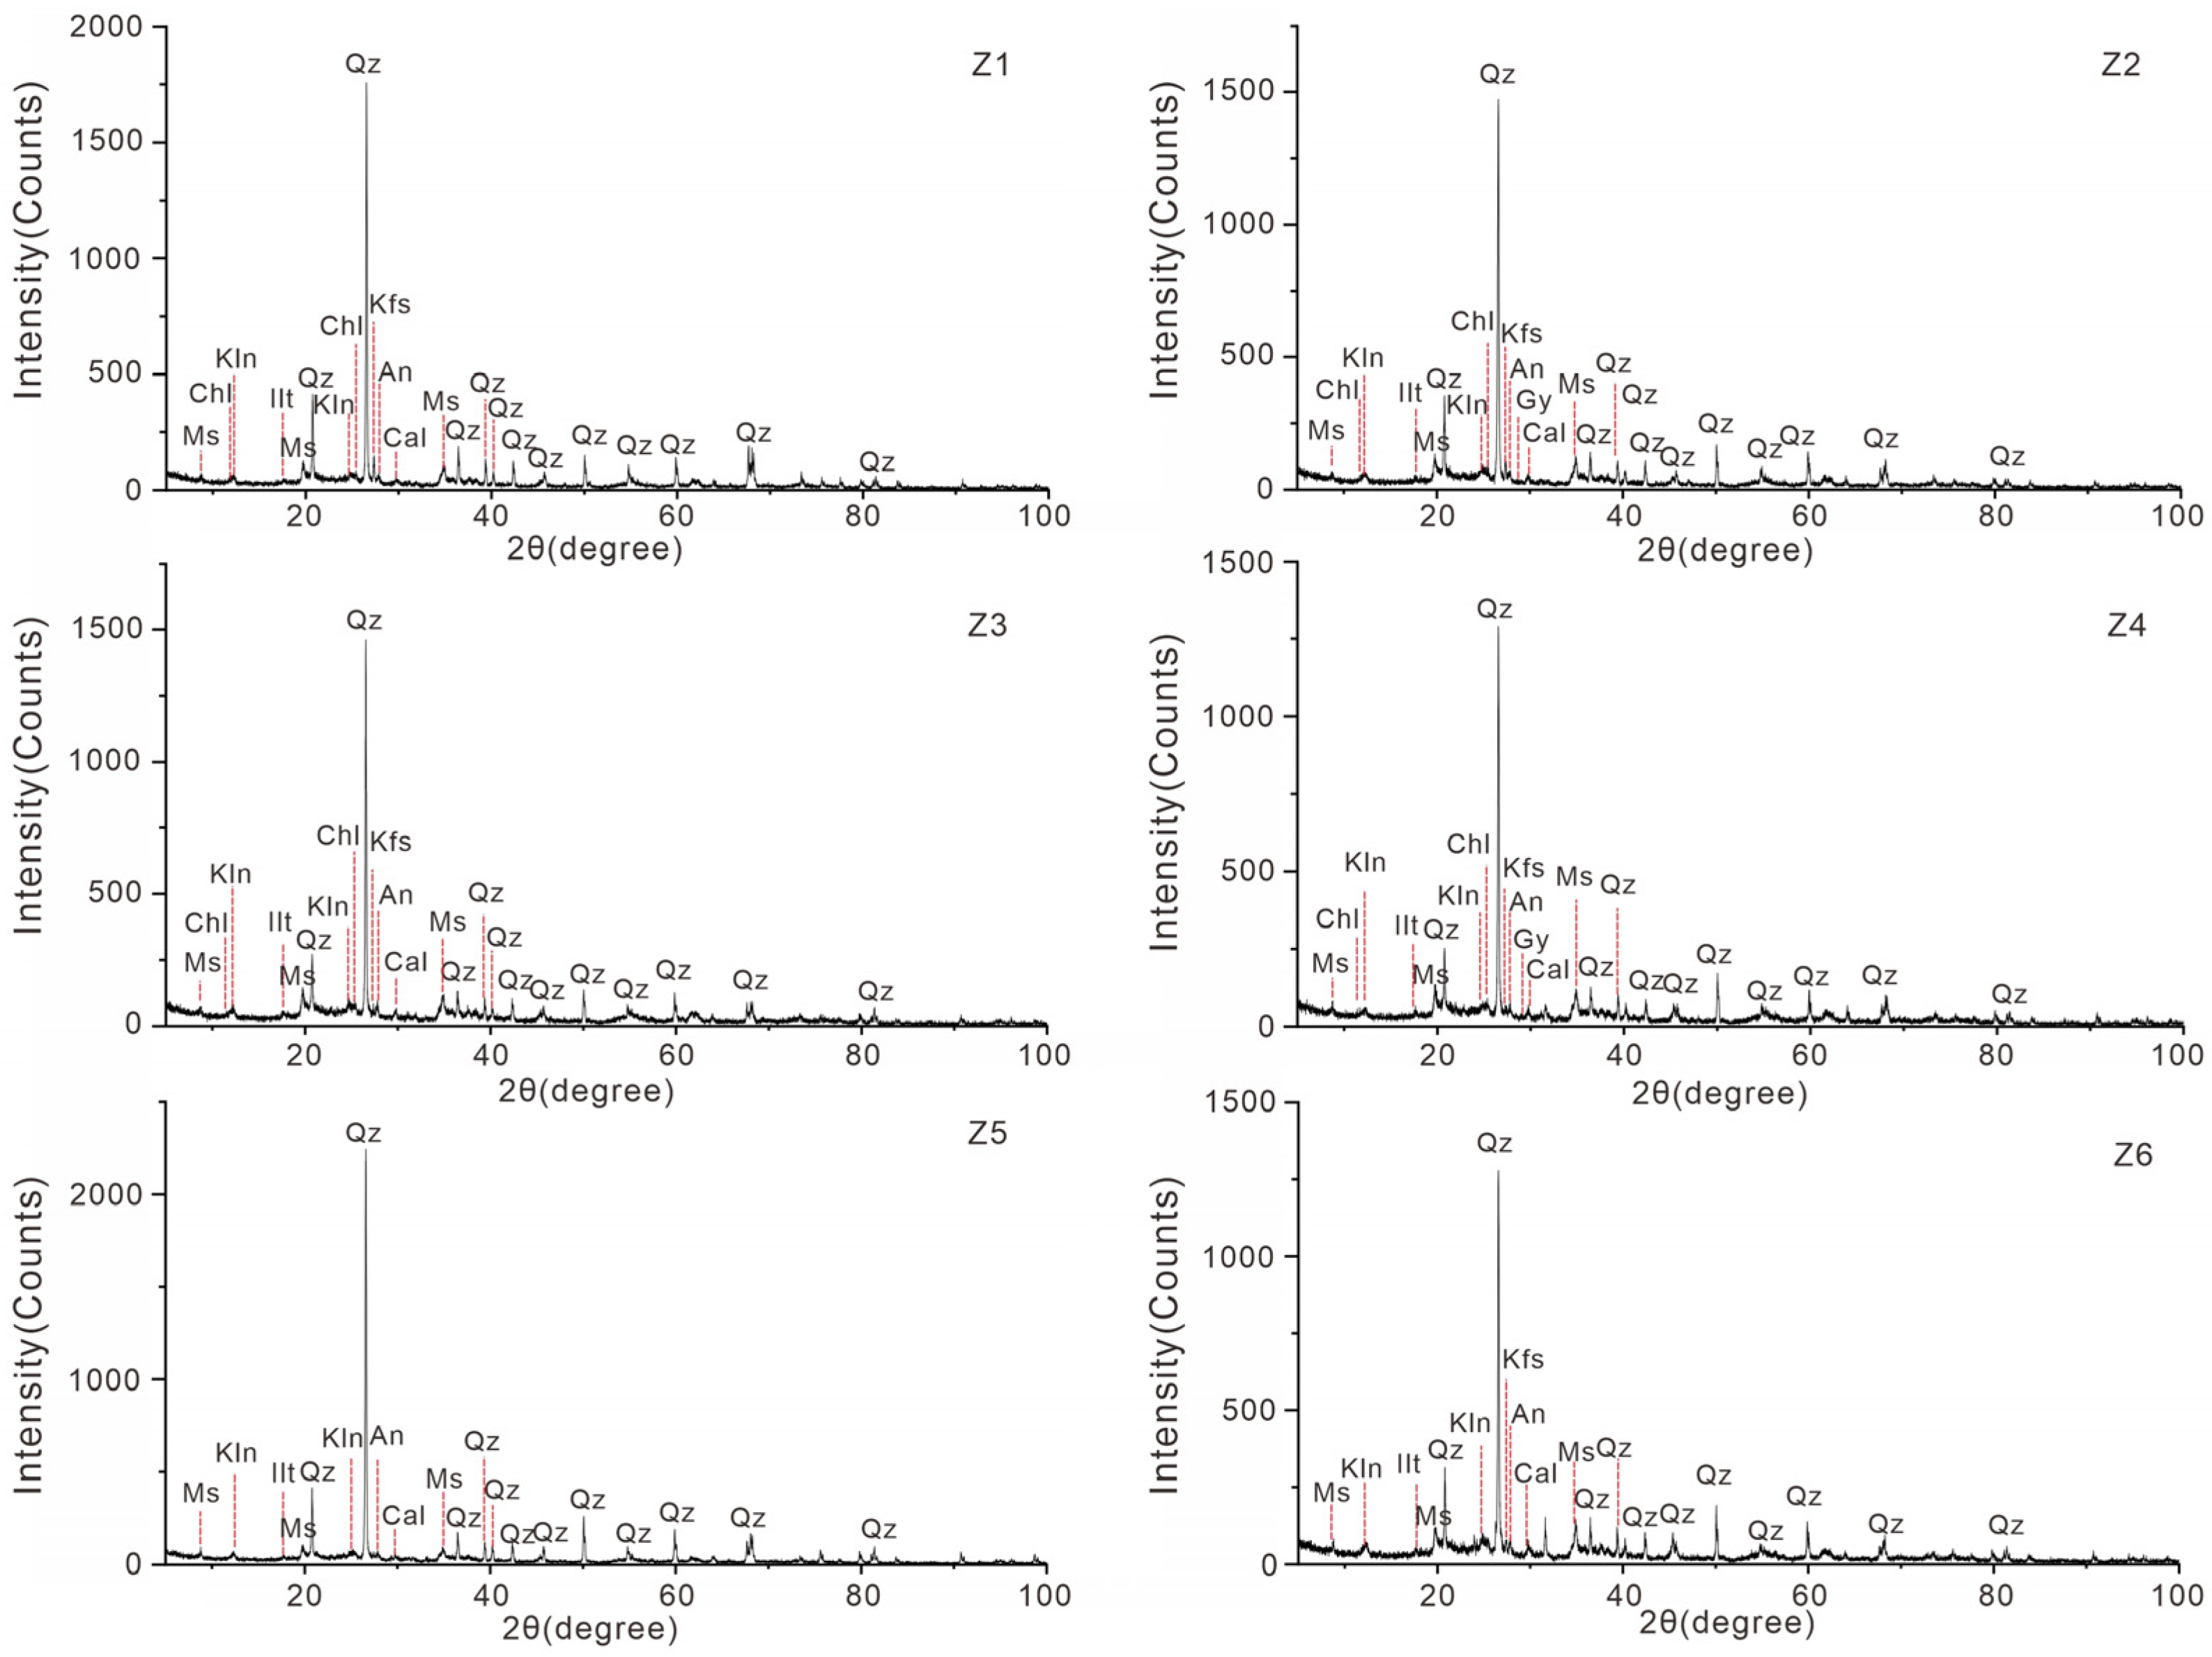
3.2. Main Mineral Components of the Surface Sediments

The XRD results are shown in Figure 2, indicating that the sediments samples primarily consisted of quartz, muscovite, anorthite, K-feldspar, chlorite, kaolinite, illite and calcite. The main mineral compositions of each sample were similar across all samples. These minerals were mainly produced by the weathering of various rocks in the Pearl River Basin, and were subsequently transported and precipitated in the Pearl River Estuary.

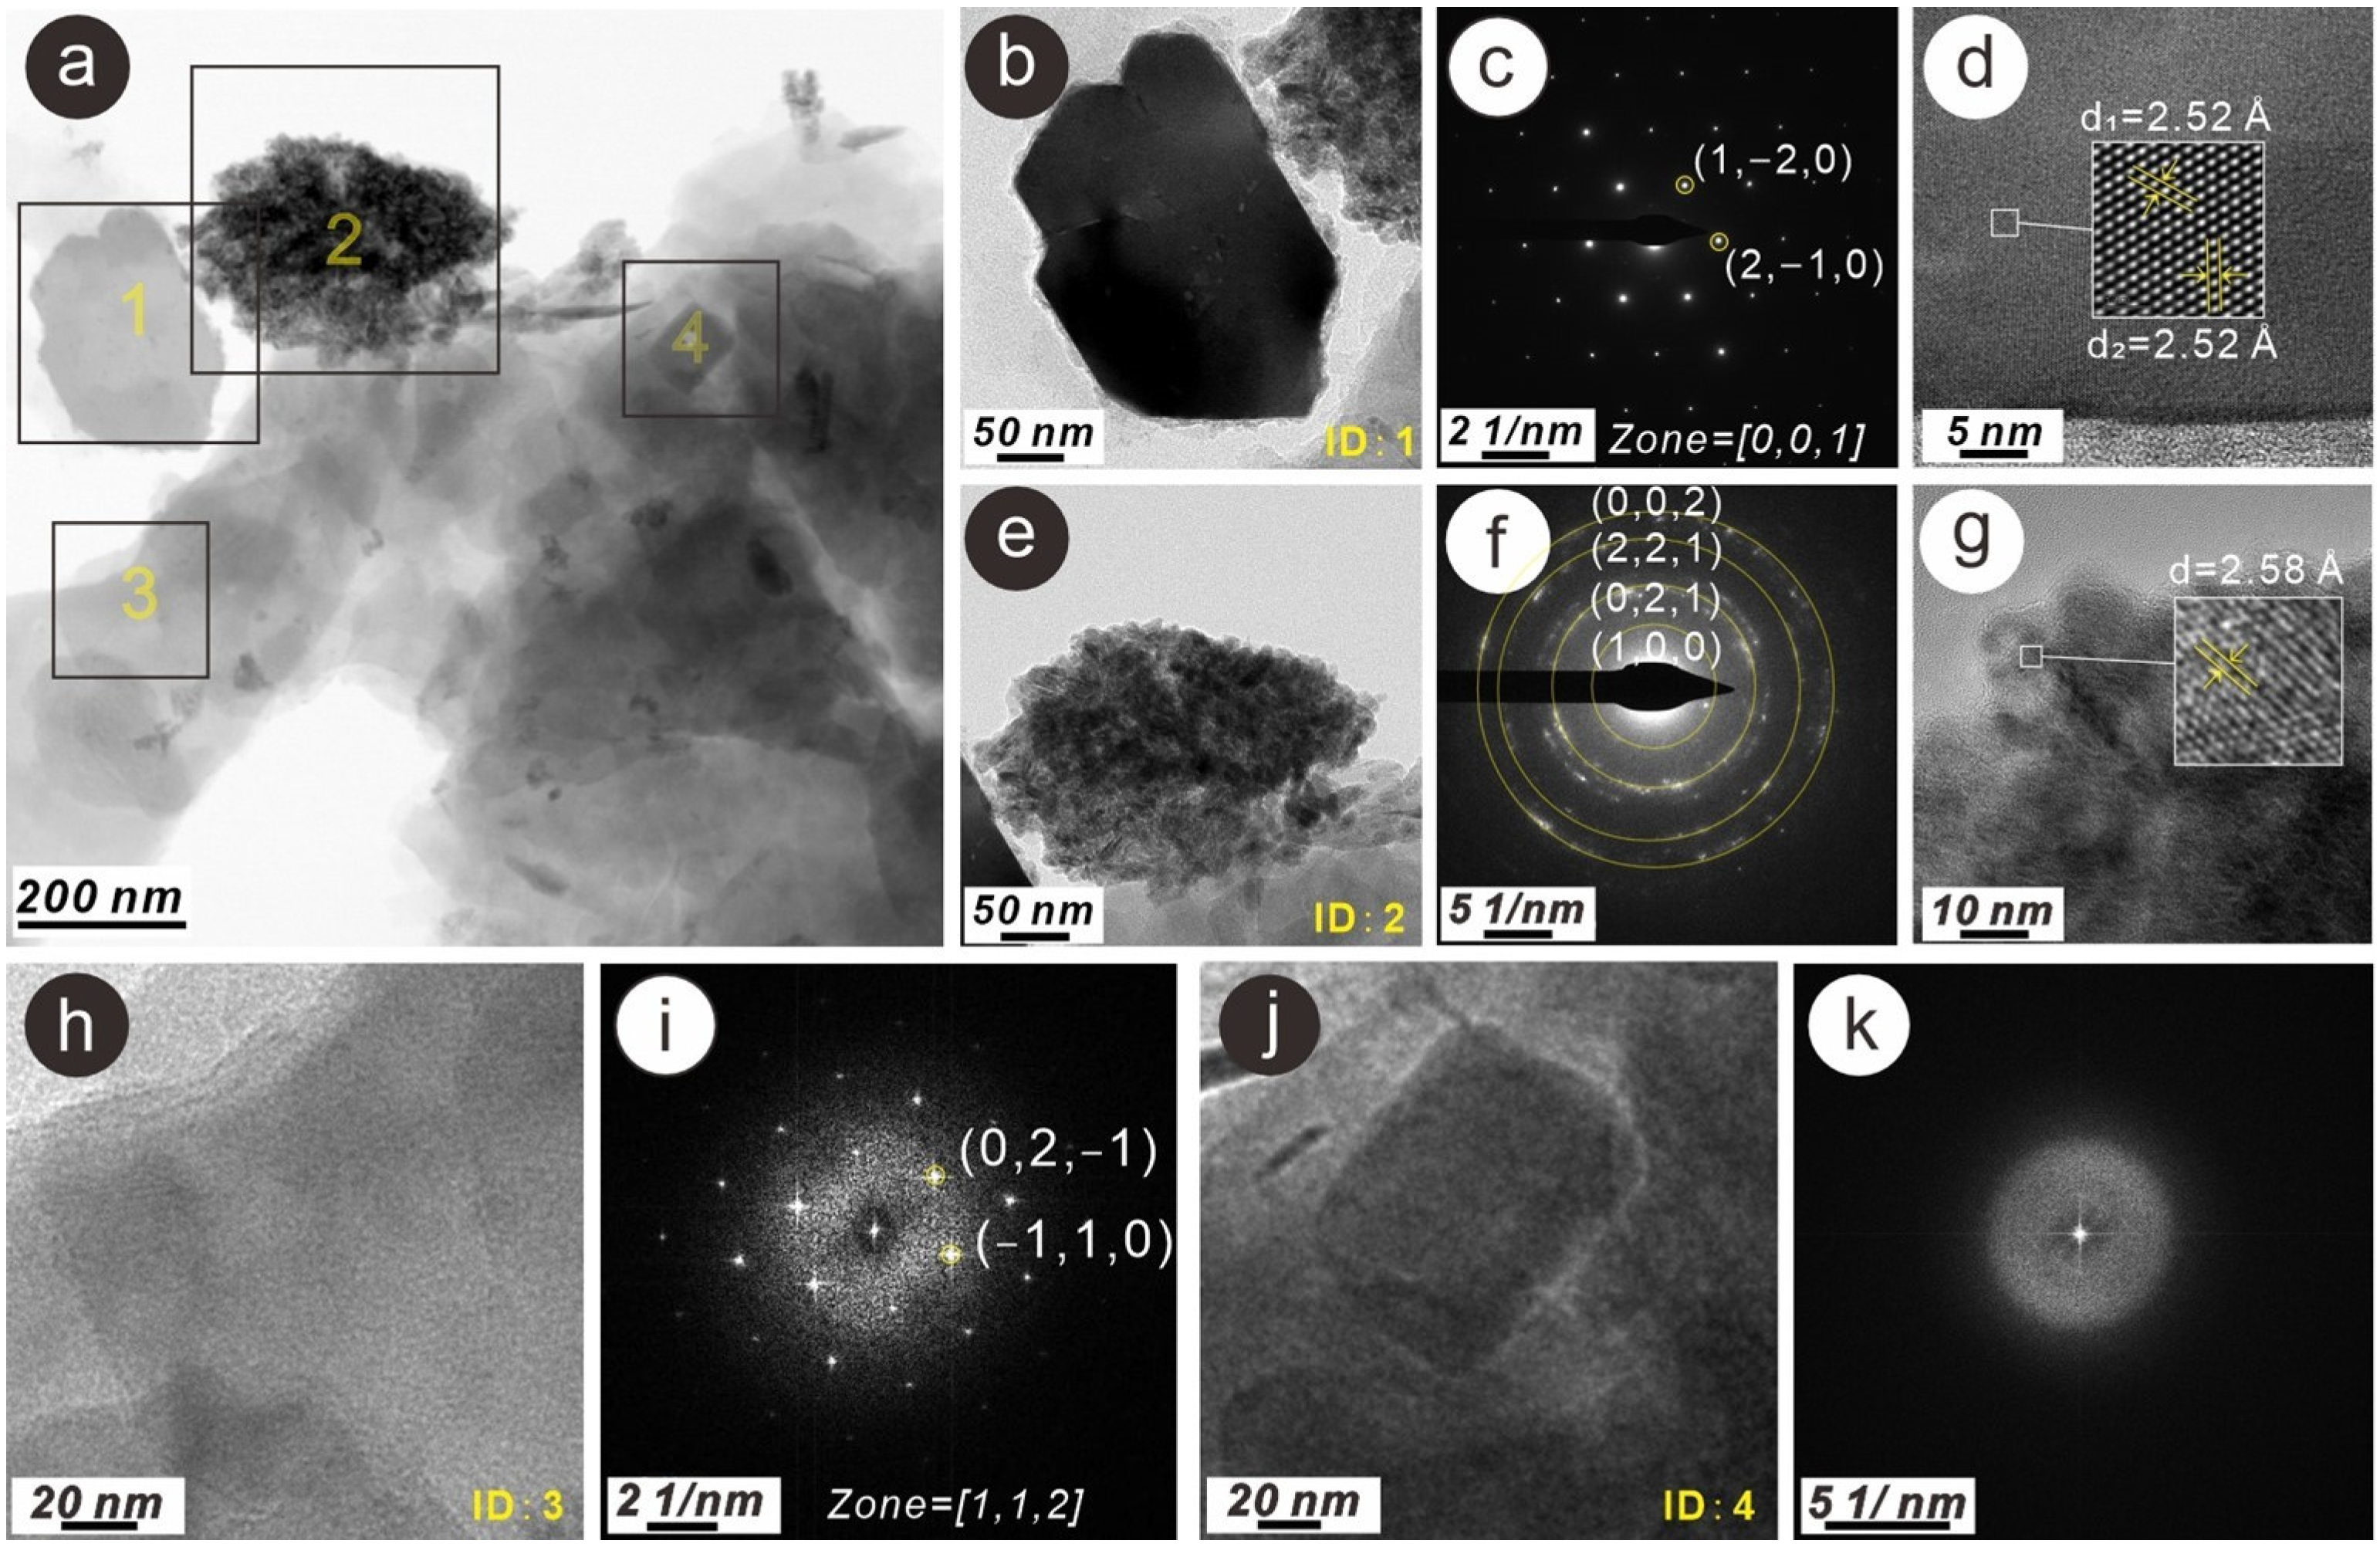
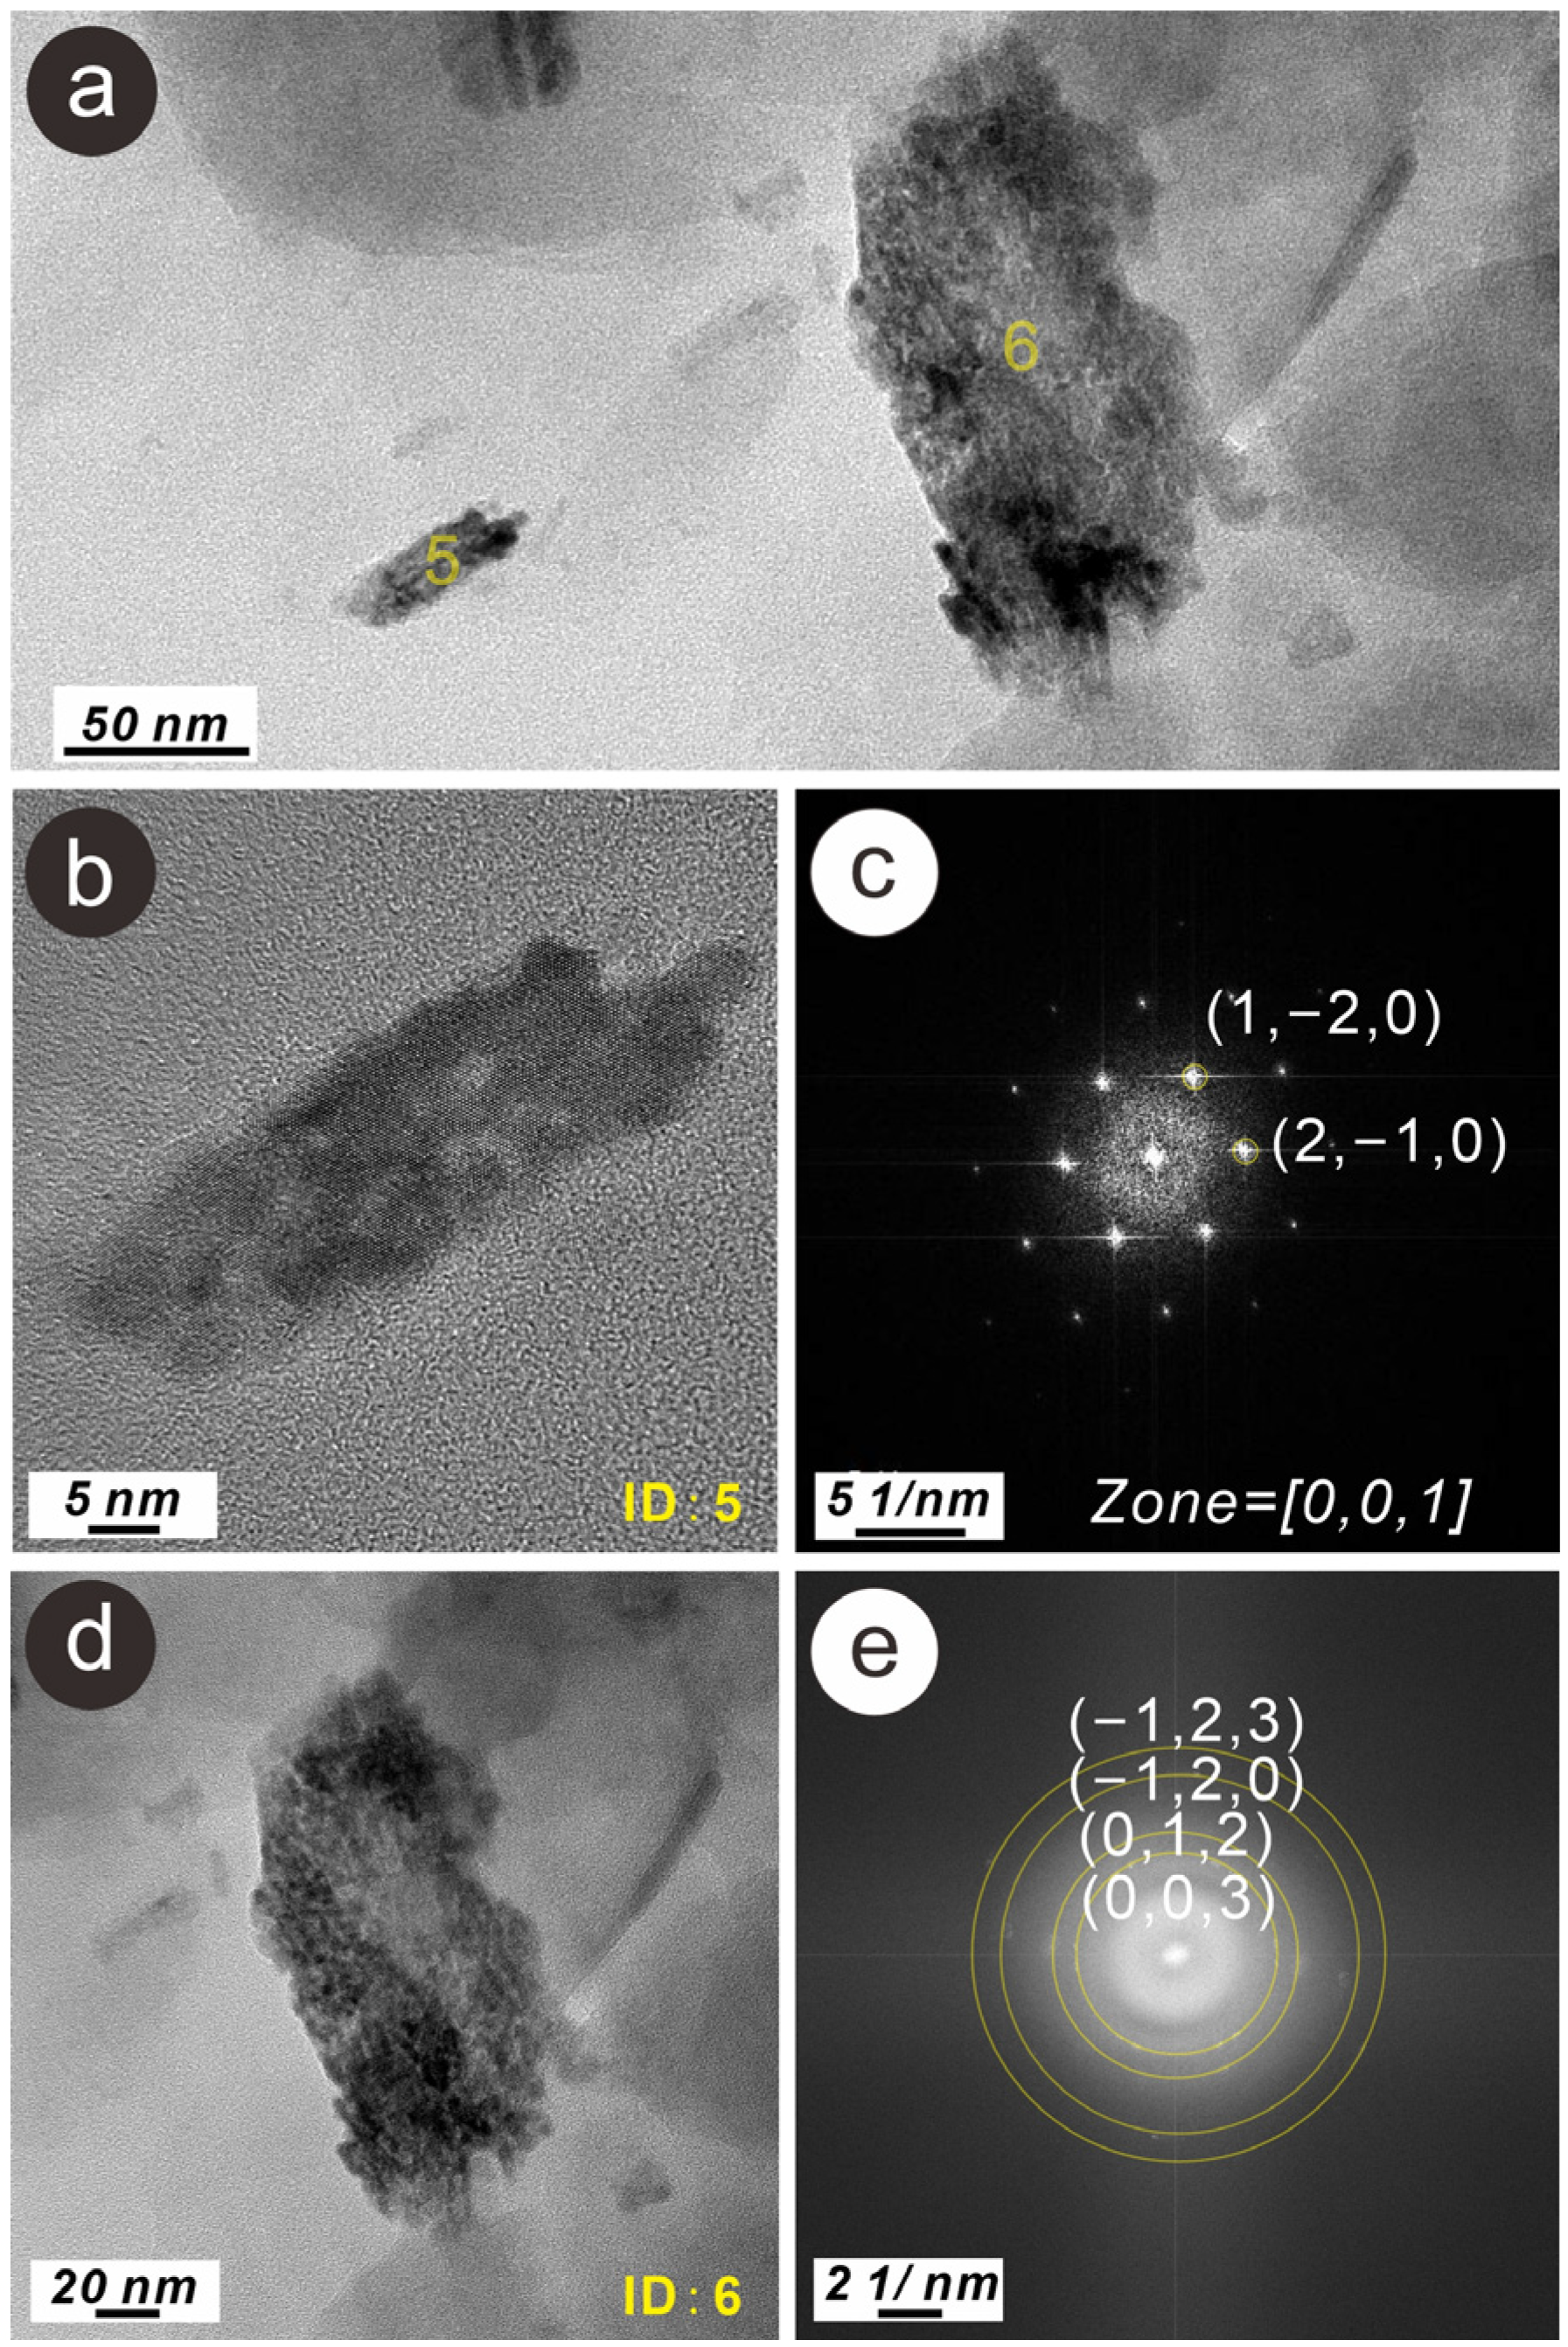
3.3. Characteristics of N-Bearing and P-Bearing Nanoparticles in the Surface Sediments

In this study, a total of 113 nanoparticles in surface sediment samples were preliminarily examined and analyzed by HR-TEM to determine their morphology and EDS results. Meanwhile, a total of 25 N-bearing and/or P-bearing nanoparticles were observed. Based on their main components, the main types of these nanoparticles include Fe oxides, silicates (or SiO2) and phosphates. Finally, a total of nine representative nanoparticles from the aforementioned types were selected for further detailed analysis (Figure 3, Figure 4, Figure 5, Figure 6, Figure 7, Figure 8, Figure 9, Figure 10, Figure 11 and Figure 12, Table 2).
Figure 3a shows several nanoparticles, and the representative nanoparticles (Table 2, ID: 1–4) were observed and analyzed in detail (Figure 3b–k). The primary compositions and characteristics of these nanoparticles are shown in Figure 4 and Table 2. The nanoparticles in Figure 3a are mainly composed of N, O, Al, Si, P, S, Ca and Fe, and the distribution of the main elements is shown in Figure 5. Figure 3b shows an irregular nanoparticle (ID: 1) with a size of approximately 150 nm × 200 nm. The EDS results show that the main components of this nanoparticle included O and Fe, with minor amounts of N, Si, Al, P, etc. Based on the SAED pattern and HR-TEM image (Figure 3c,d), the d-spacings measure d1 = d2 = 2.52 Å, and the SAED pattern corresponds to the zone axis = [001] of hematite (Fe2O3, PDF#87-1165), suggesting an N- and P-bearing hematite nanoparticle. Figure 3e shows an irregular nanoparticle aggregation (ID: 2), and a total size of approximately 150 nm × 200 nm. The EDS results indicate that the aggregation mainly consists of O and Fe, with minor amounts of Al, Si, N, P, etc. Based on the SAED pattern and HR-TEM image (Figure 3f,g), the d-spacings measure 2.58 Å, and the polycrystalline diffraction rings in SAED pattern correspond to the crystalline planes of goethite (α-Fe3+O(OH), PDF#29-0713), indicating an N- and P-bearing goethite nanoparticle aggregation. Figure 3h shows a layer nanoparticle with a size of approximately 50 nm × 100 nm. The EDS results indicate that this layer nanoparticle mainly comprises O, Si and Al, with small amounts of K, N, F, Mg and Fe. The FFT pattern corresponds to the zone axis = [112] ofmuscovite-2M (KAl2 (Si3Al) O10(OH, F)2, PDF#06-0263), suggesting an N-bearing muscovite nanoparticle. Figure 3j shows a nearly rectangle nanoparticle (ID: 4) with a size of approximately 50 nm × 120 nm. The EDS results indicate that the nanoparticle primarily consists of O, Si, Ca, Al and P, with minor amounts of N, F, K, Fe, etc. However, the HAADF-STEM image and elemental TEM distribution (Figure 5) show that the nearly rectangular nanoparticle has been adsorbed onto the surface of the layered silicate nanoparticle. Therefore, we suggest that the Si, Al, K and F in this position (ID: 4) belong to layered silicate. In addition, the nearly rectangular nanoparticle mainly consists of O, Ca and P, suggesting that it is a calcium phosphate nanoparticle. Moreover, none of the diffraction spots are shown in the FFT pattern (Figure 3k), indicating that this particle is amorphous.
Figure 6a shows two typical N- and P-bearing nanoparticles (ID: 5 and 6). As shown in Figure 7 and Table 2, the compositions of these nanoparticles are similar, primarily consisting of O and Fe, with small amounts of N, Al, Si, P, etc. Figure 6b shows a strip nanoparticle (ID: 5) with a size of approximately 10 nm × 50 nm. The FFT pattern (Figure 6c) corresponds to the zone axis = [001] of hematite (Fe2O3, PDF#87-1165), suggesting that it is an N- and P-bearing hematite nanoparticle. Figure 6d shows an irregular nanoparticle aggregation, with a size of approximately 50 nm × 100 nm. The polycrystalline diffraction rings in the FFT pattern (Figure 6e) also correspond to the crystalline planes of hematite, suggesting an N- and P-bearing hematite nanoparticle aggregation.
Figure 8a shows two irregular N- and P-bearing nanoparticles (ID: 7–8), and the EDS results are shown in Figure 9 and Table 2. An irregular nanoparticle (ID: 7) is shown in Figure 8b, with a size of approximately 250 nm × 400 nm. The EDS results indicate that the nanoparticle primarily consisted of O, Si, Ca and Al, with small amounts of N, P, S, Fe, etc. The SAED pattern corresponds to the zone axis = [ 1 ¯ 01] of anorthite (CaAl2Si2O8, PDF #86-1707), suggesting that it is an N- and P-bearing anorthite nanoparticle. Figure 8d shows an irregular nanoparticle (ID: 8) with a size of approximately 150 nm × 250 nm. The EDS results indicate that the nanoparticle primarily consists of O and Si, with a minor amount of N, P, Na, Mg, Al, etc. The SAED pattern correspons to the zone axis = [10 1 ¯ ] of quartz (SiO2, PDF #83-0541), suggesting an N- and P-bearing quartz nanoparticle.
Figure 10a shows a P-bearing irregular nanoparticle (ID: 9) with a size of approximately 250 nm × 400 nm. The EDS results are shown in Figure 11 and Table 2; the nanoparticle primarily consists of O, Fe and P, with small amounts of S, Mn, Na, Ca, Mg, etc. The HAADF-STEM image and elemental TEM maps (Figure 12) show that the main composition elements O, Fe and P were homogeneously distributed in the nanoparticle; we speculate that the nanoparticle was composed primarily of ferric phosphate. In addition, none of the diffraction spots are shown in the SAED pattern (Figure 10b), indicating that this particle was amorphous.

4. Discussion

4.1. Comparison of the Forms of Natural N-Bearing and P-Bearing Nanoparticles in the Surface Sediments of the Pearl River Estuary

The Pearl River Estuary has long suffered from environmental problems such as eutrophication and harmful algal blooms caused by excessive nutrients (especially N and P) [37,38]. In this study, the TN contents and TP contents in most of the sediments were close to or exceeded the standard safety level, which could cause low-level ecotoxicological effects. These results indicate that N and P have accumulated excessively in the sediments of some areas of the Pearl River Estuary. Meanwhile, we discovered and investigated the characteristics of N-bearing and P-bearing nanoparticles in surface sediments, providing a new perspective on the mechanism of eutrophication in estuarine and coastal ecosystems.
Based on the observation and analysis of the N-bearing nanoparticles (ID: 1–3 and 5–8), we found that N was present in small amounts (1.52–3.73 wt%) in nanoparticles of minerals such as hematite, goethite, muscovite, anorthite and quartz. Among them, siliceous minerals such as quartz, anorthite and muscovite are primary minerals in the sediments (Figure 2). Nanoparticles of Fe oxide minerals such as goethite and hematite can be formed by oxidation of Fe-bearing minerals such as chlorite and muscovite [23,49]. These N-bearing nanoparticles were mainly single crystal or polycrystalline in form, with sizes ranging from 10 nm × 50 nm to 250 nm × 400 nm. Nanoparticles are abundant in the estuarine environment, due to the supergene processes including oxidation [23,49], grinding of faults [50,51,52,53] and biogeochemical processes [54]. Nanoparticles have excellent absorptivity due to their extremely small size, large surface-to-volume ratio and generally charged surfaces [55,56]. Recent studies have demonstrated that mineral nanoparticles such as hematite, goethite and silicate clay minerals have significant adsorption effects on N and P compounds [28,29,30,31]. In this study, the HAADF-STEM diagram showed that N and P were evenly distributed on the surface of Fe oxide and siliceous nanoparticles (Figure 5). Based on the previous studies and the observations in this study, we speculate that these N-bearing nanoparticles were formed by the adsorption of N (e.g., NH4+, NO3−, NO2−, macromolecular compounds, etc.) in seawater by nanoparticles of minerals such as iron oxides, silicates and quartz in estuarine environment. Similarly, we observed that a very small amount of P (0.22–1.12 wt%) was present in the nanoparticles (ID: 1–2 and 5–8), and that they may be also formed by the adsorption of P (e.g., phosphate ions and organic phosphorus) in seawater by nanoparticles in an estuarine environment.
In addition, we observed nanoparticles (ID: 4 and 9) in the form of iron phosphate and calcium phosphate in the sediments. These nanoparticles had higher phosphorus content (5.02–9.97 wt%), mainly amorphous, with sizes ranging from 50 nm × 120 nm to 250 nm × 400 nm, which indicated that P could exist in the form of insoluble Fe and Ca phosphate nanoparticles in estuarine sediments.

4.2. Implications for N-Cycling and P-Cycling in Estuarine and Coastal Ecosystems

Based on the HR-TEM observations, various forms of nitrogen and phosphorus nanoparticles were identified in surface sediments in Pearl River Estuary (Table 2, ID:1–9). In addition, the sizes of these nanoparticles ranged from 10 nm × 50 nm to 150 nm × 400 nm. Due to their extremely small size and high mobility, some nanoparticles do not precipitate immediately after their formation, and they can migrate with sea water flow over long distances [57]. In this process, N and P are transported in the form of nanoparticles in the estuarine and coastal environment. Meanwhile, previous studies suggested that nanoparticles have the potential to enter into the biological body and that their long-term accumulation affects the health of an organism [58,59,60]. Previous studies have reported that N can enter plants in the form of N-bearing nanoparticles to provide growth nutrients [35]. Therefore, N-bearing nanoparticles in sediments of estuarine have potential to be directly absorbed by plants and affect nutrient cycling in estuarine and coastal ecosystems. Moreover, some of the N-bearing and P-bearing nanoparticles eventually precipitated and solidified, separating N and P from biological elemental cycling [36,57,61]. On the other hand, as discussed above in Section 4.1, N and P could be adsorbed by nanoparticles of minerals in an estuarine and coastal environment, and further form N-bearing and P-bearing nanoparticles (ID: 1–3 and 5–8). In addition, P could exist in the form of Ca and Fe phosphate nanoparticles (ID: 4 and 9). It is noteworthy that the physical–chemical factors, biogeochemical processes and hydrodynamic conditions in the environment can affect the adsorption and aggregation of nanoparticles [23,47,62,63,64] and the decomposition of Fe and Ca phosphates [61,65,66] in different ways. As a result, N and P can be released in the form of ions or molecules, and continue to be bioavailable and enter the ecosystem. Therefore, due to the difference in the forms of N and P in nanoparticles, the transport and release of N and P in the form of nanoparticles will also be different.
Furthermore, the findings mentioned above can also be applied to water management in estuarine and coastal ecosystems. In this study, it was observed that the nano-mineral particles with adsorption effect on N and P mainly included Fe oxides and siliceous minerals, such as goethite, hematite, muscovite, etc. (Table 2). Therefore, natural Fe oxides and siliceous nano-mineral particles can be poured into water bodies in estuarine aeras to reduce excess N and P, so as to control eutrophication. In addition, due to the difference in the forms of N and P in nanoparticles, the release of N and P in the form of nanoparticles will also be different as a result of different physical–chemical factors (including temperature, pH, salinity, etc.) [62,63,64]. Thus, in the process of water environmental management, the release of N and P contained in the nanoparticles in sediments can be controlled by adjusting the physical and chemical conditions of the water bodies.
Moreover, to the best of our knowledge, no work has yet been reported regarding natural P-bearing nanoparticles in estuarine and coastal sediments. In this study, nanoparticles in the form of Ca and Fe phosphate were found in estuarine and costal sediments. Phosphorous deposits are an important non-renewable resource, mainly in the form of phosphates, mostly formed in marine sedimentary environment [67,68,69]. Therefore, further investigation of nano-phosphate particles in sedimentary environment may provide nanoscale evidence for study on phosphate mineralization.
In summary, N-bearing and P-bearing nanoparticles could have a significant influence on the migration, precipitation and release processes of N and P, and play a certain role in the N-cycling and P-cycling of estuarine and coastal ecosystems. Thus, the management of the water environment of the Pearl River Estuary should also pay attention to sediment, especially with respect to N-bearing and P-bearing nanoparticles. In addition, the further investigation of P-bearing nanoparticles in sediments may provide nanoscale evidence for phosphorus enrichment and mineralization in marine environment.

5. Conclusions

  • Based on the HR-TEM observation, various forms of N and P nanoparticles were identified in surface sediments in the Pearl River Estuary of South China.
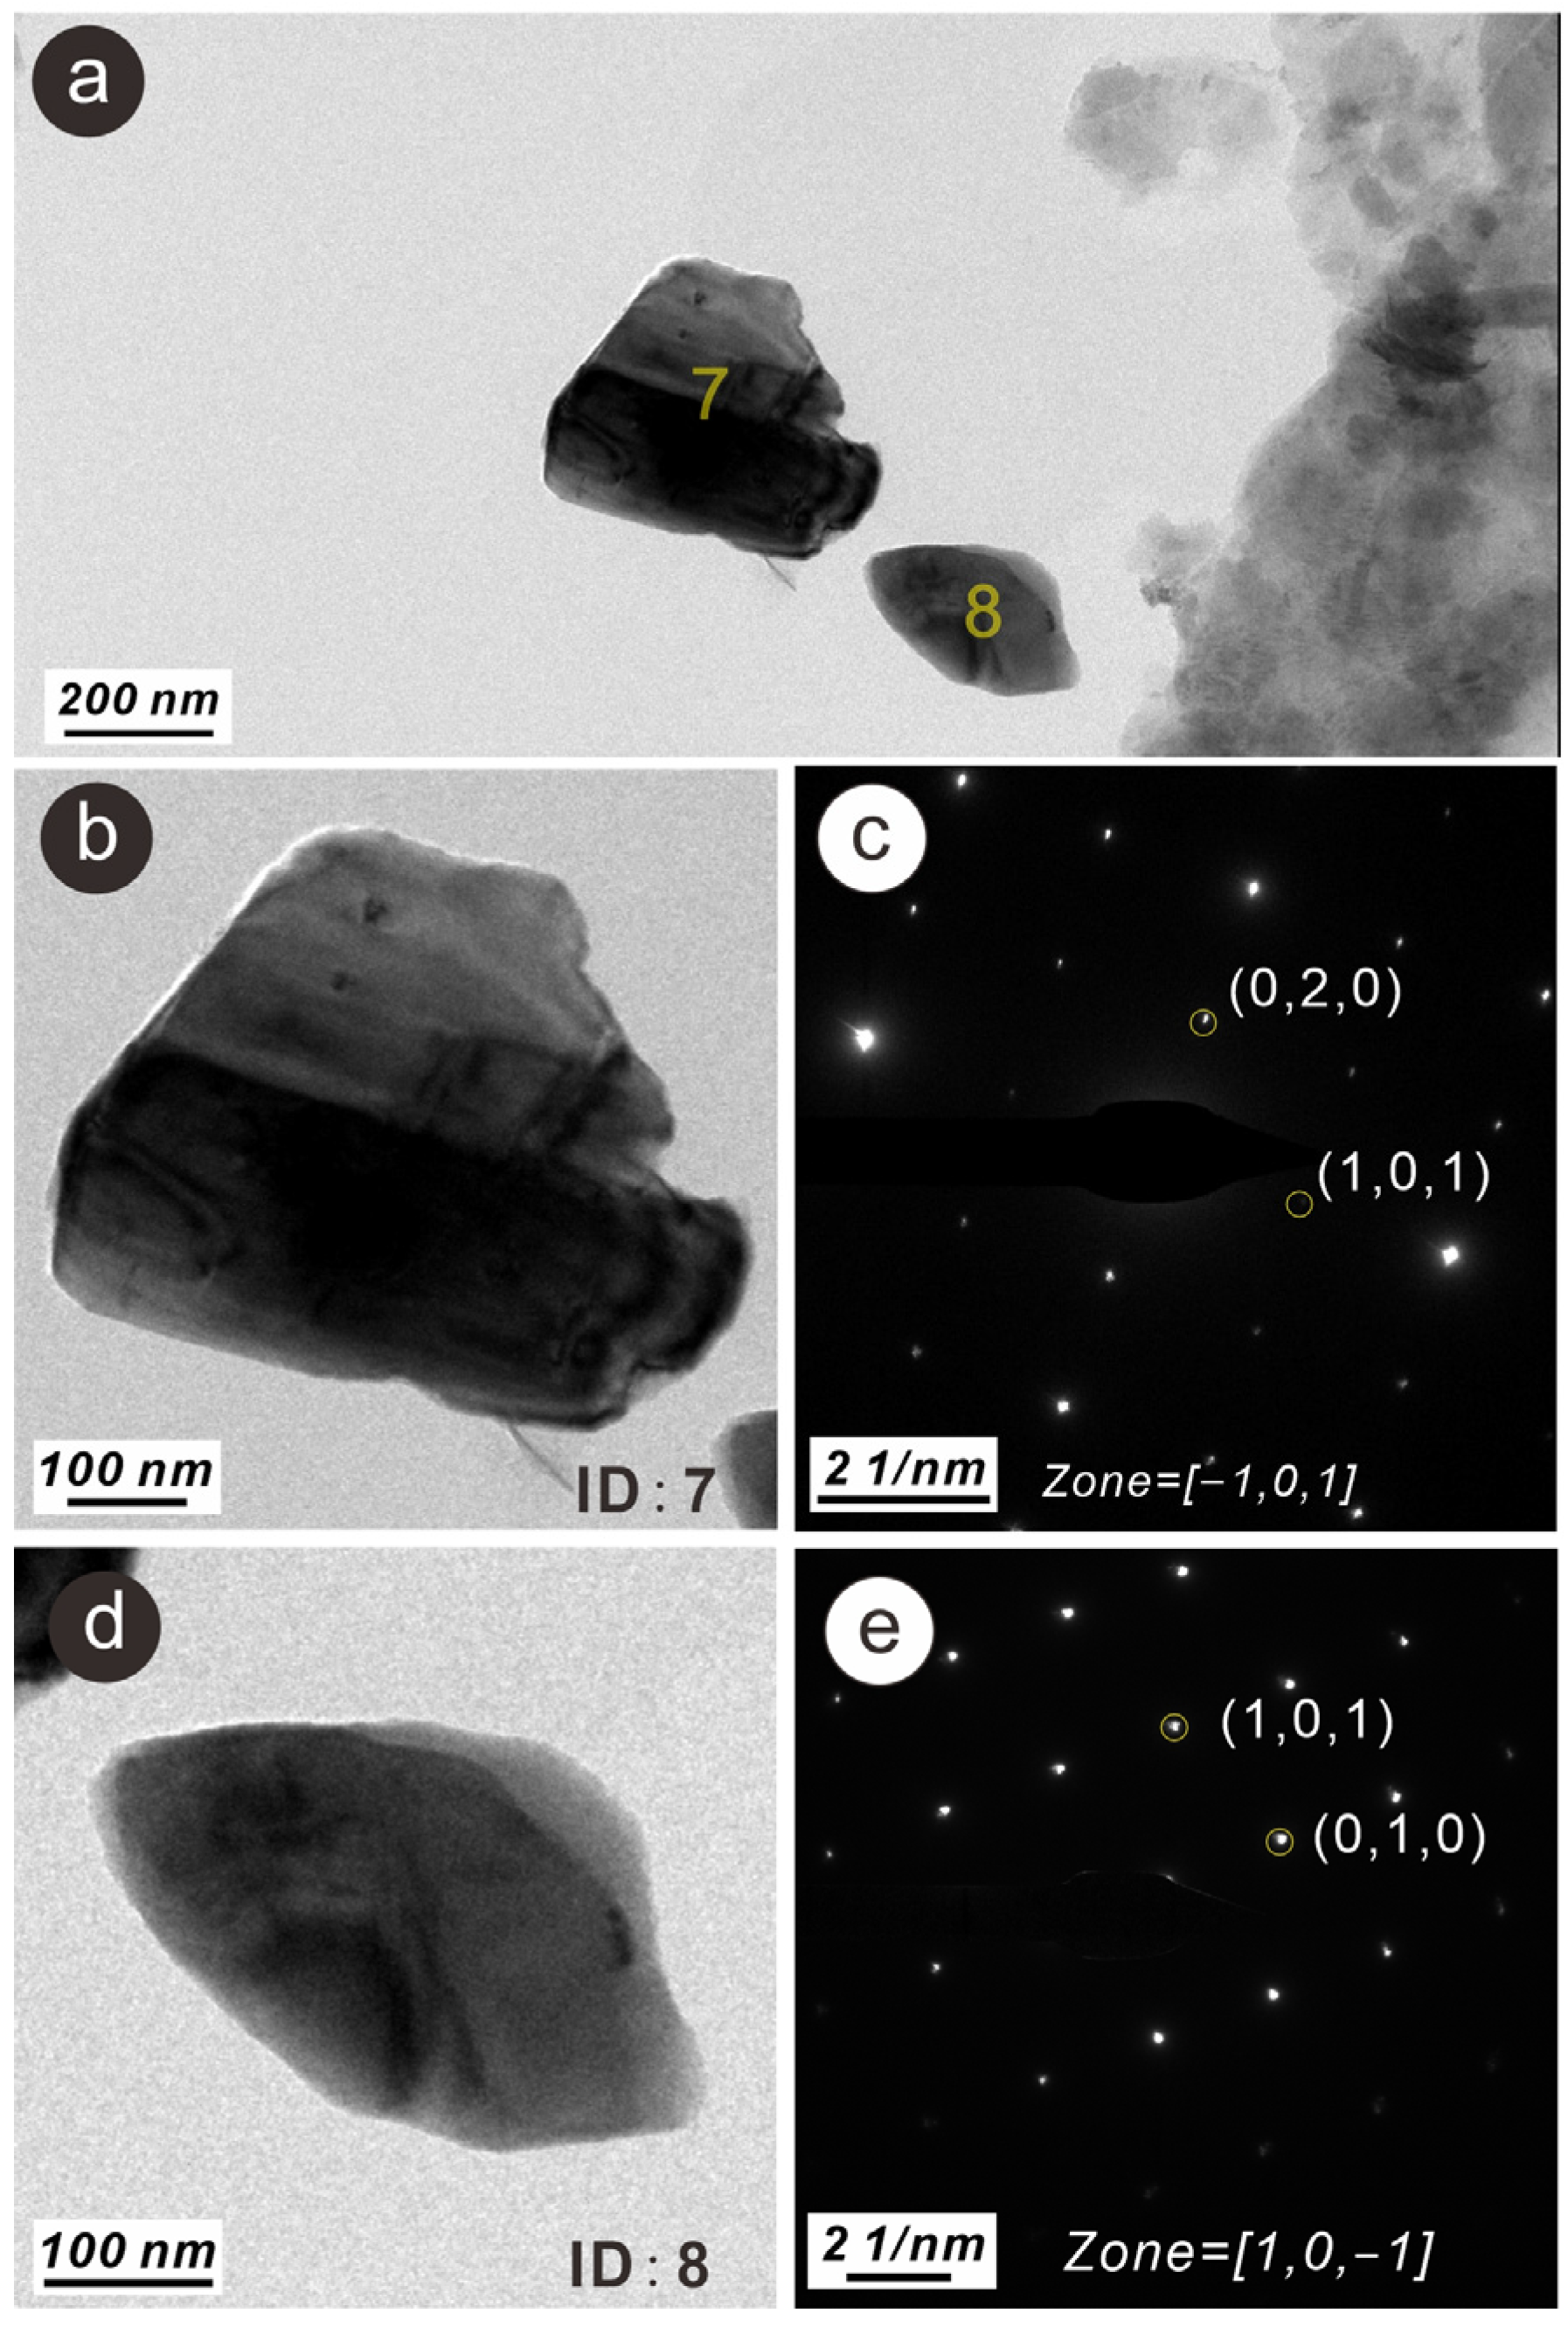
  • Both N and P can be adsorbed by nanoparticles of minerals such as hematite, goethite, muscovite, anorthite and quartz in an estuarine and coastal environment, and further form N-bearing and P-bearing nanoparticles. These nanoparticles contained small amounts of N (1.52–3.73 wt%) and P (0.22–1.12 wt%), mainly single crystal or polycrystalline in form, with sizes ranging from 10 nm × 50 nm to 250 nm × 400 nm.
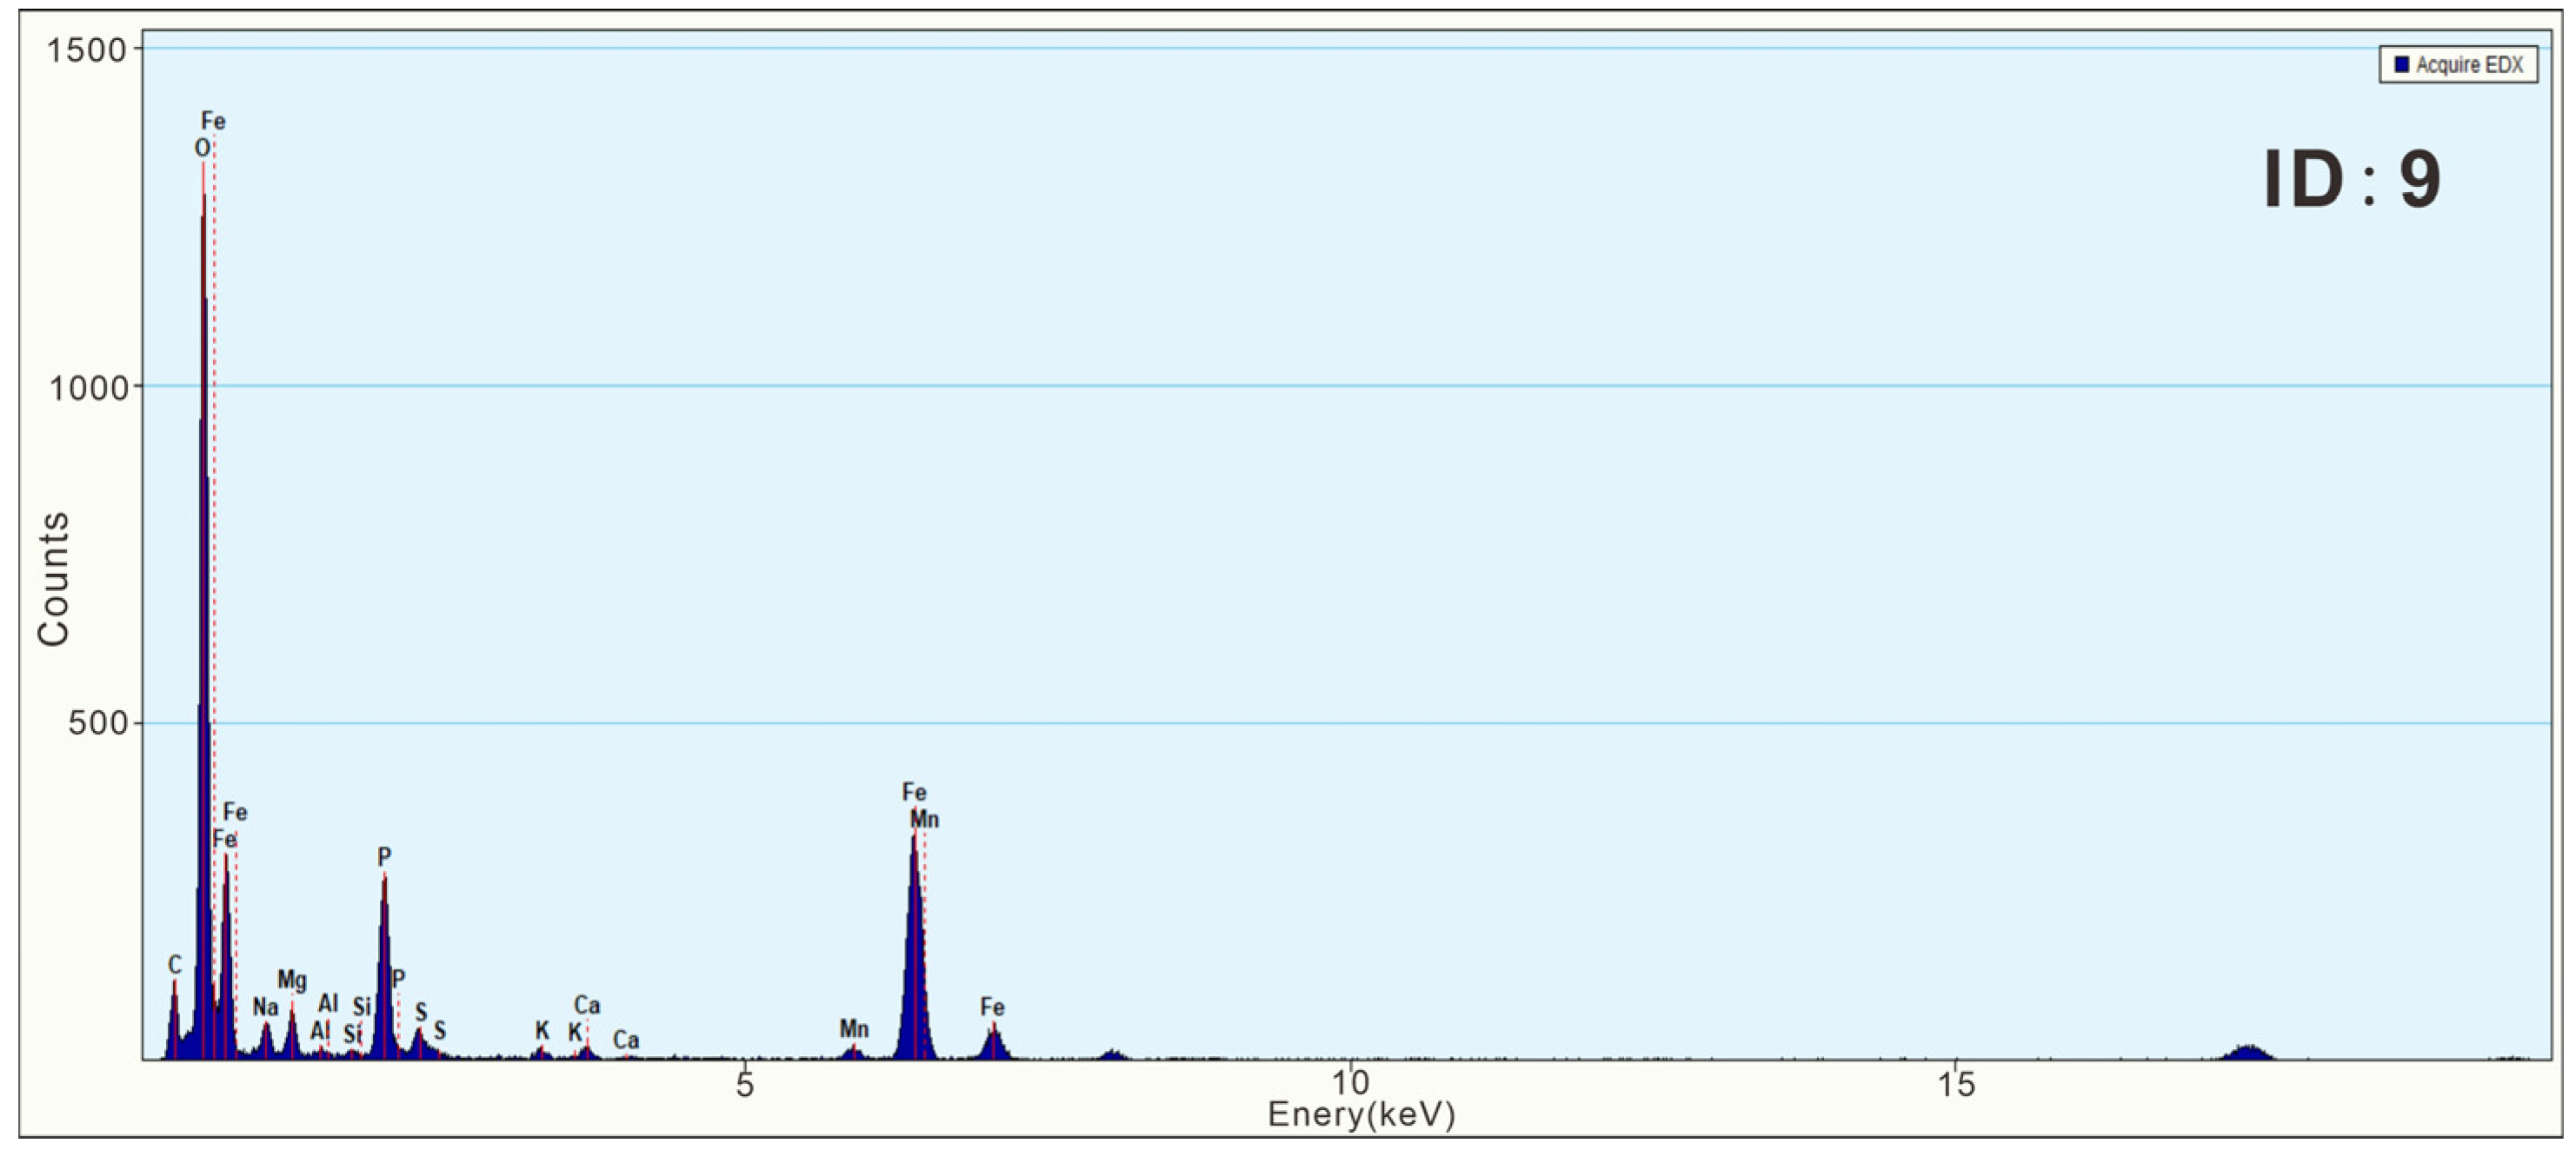
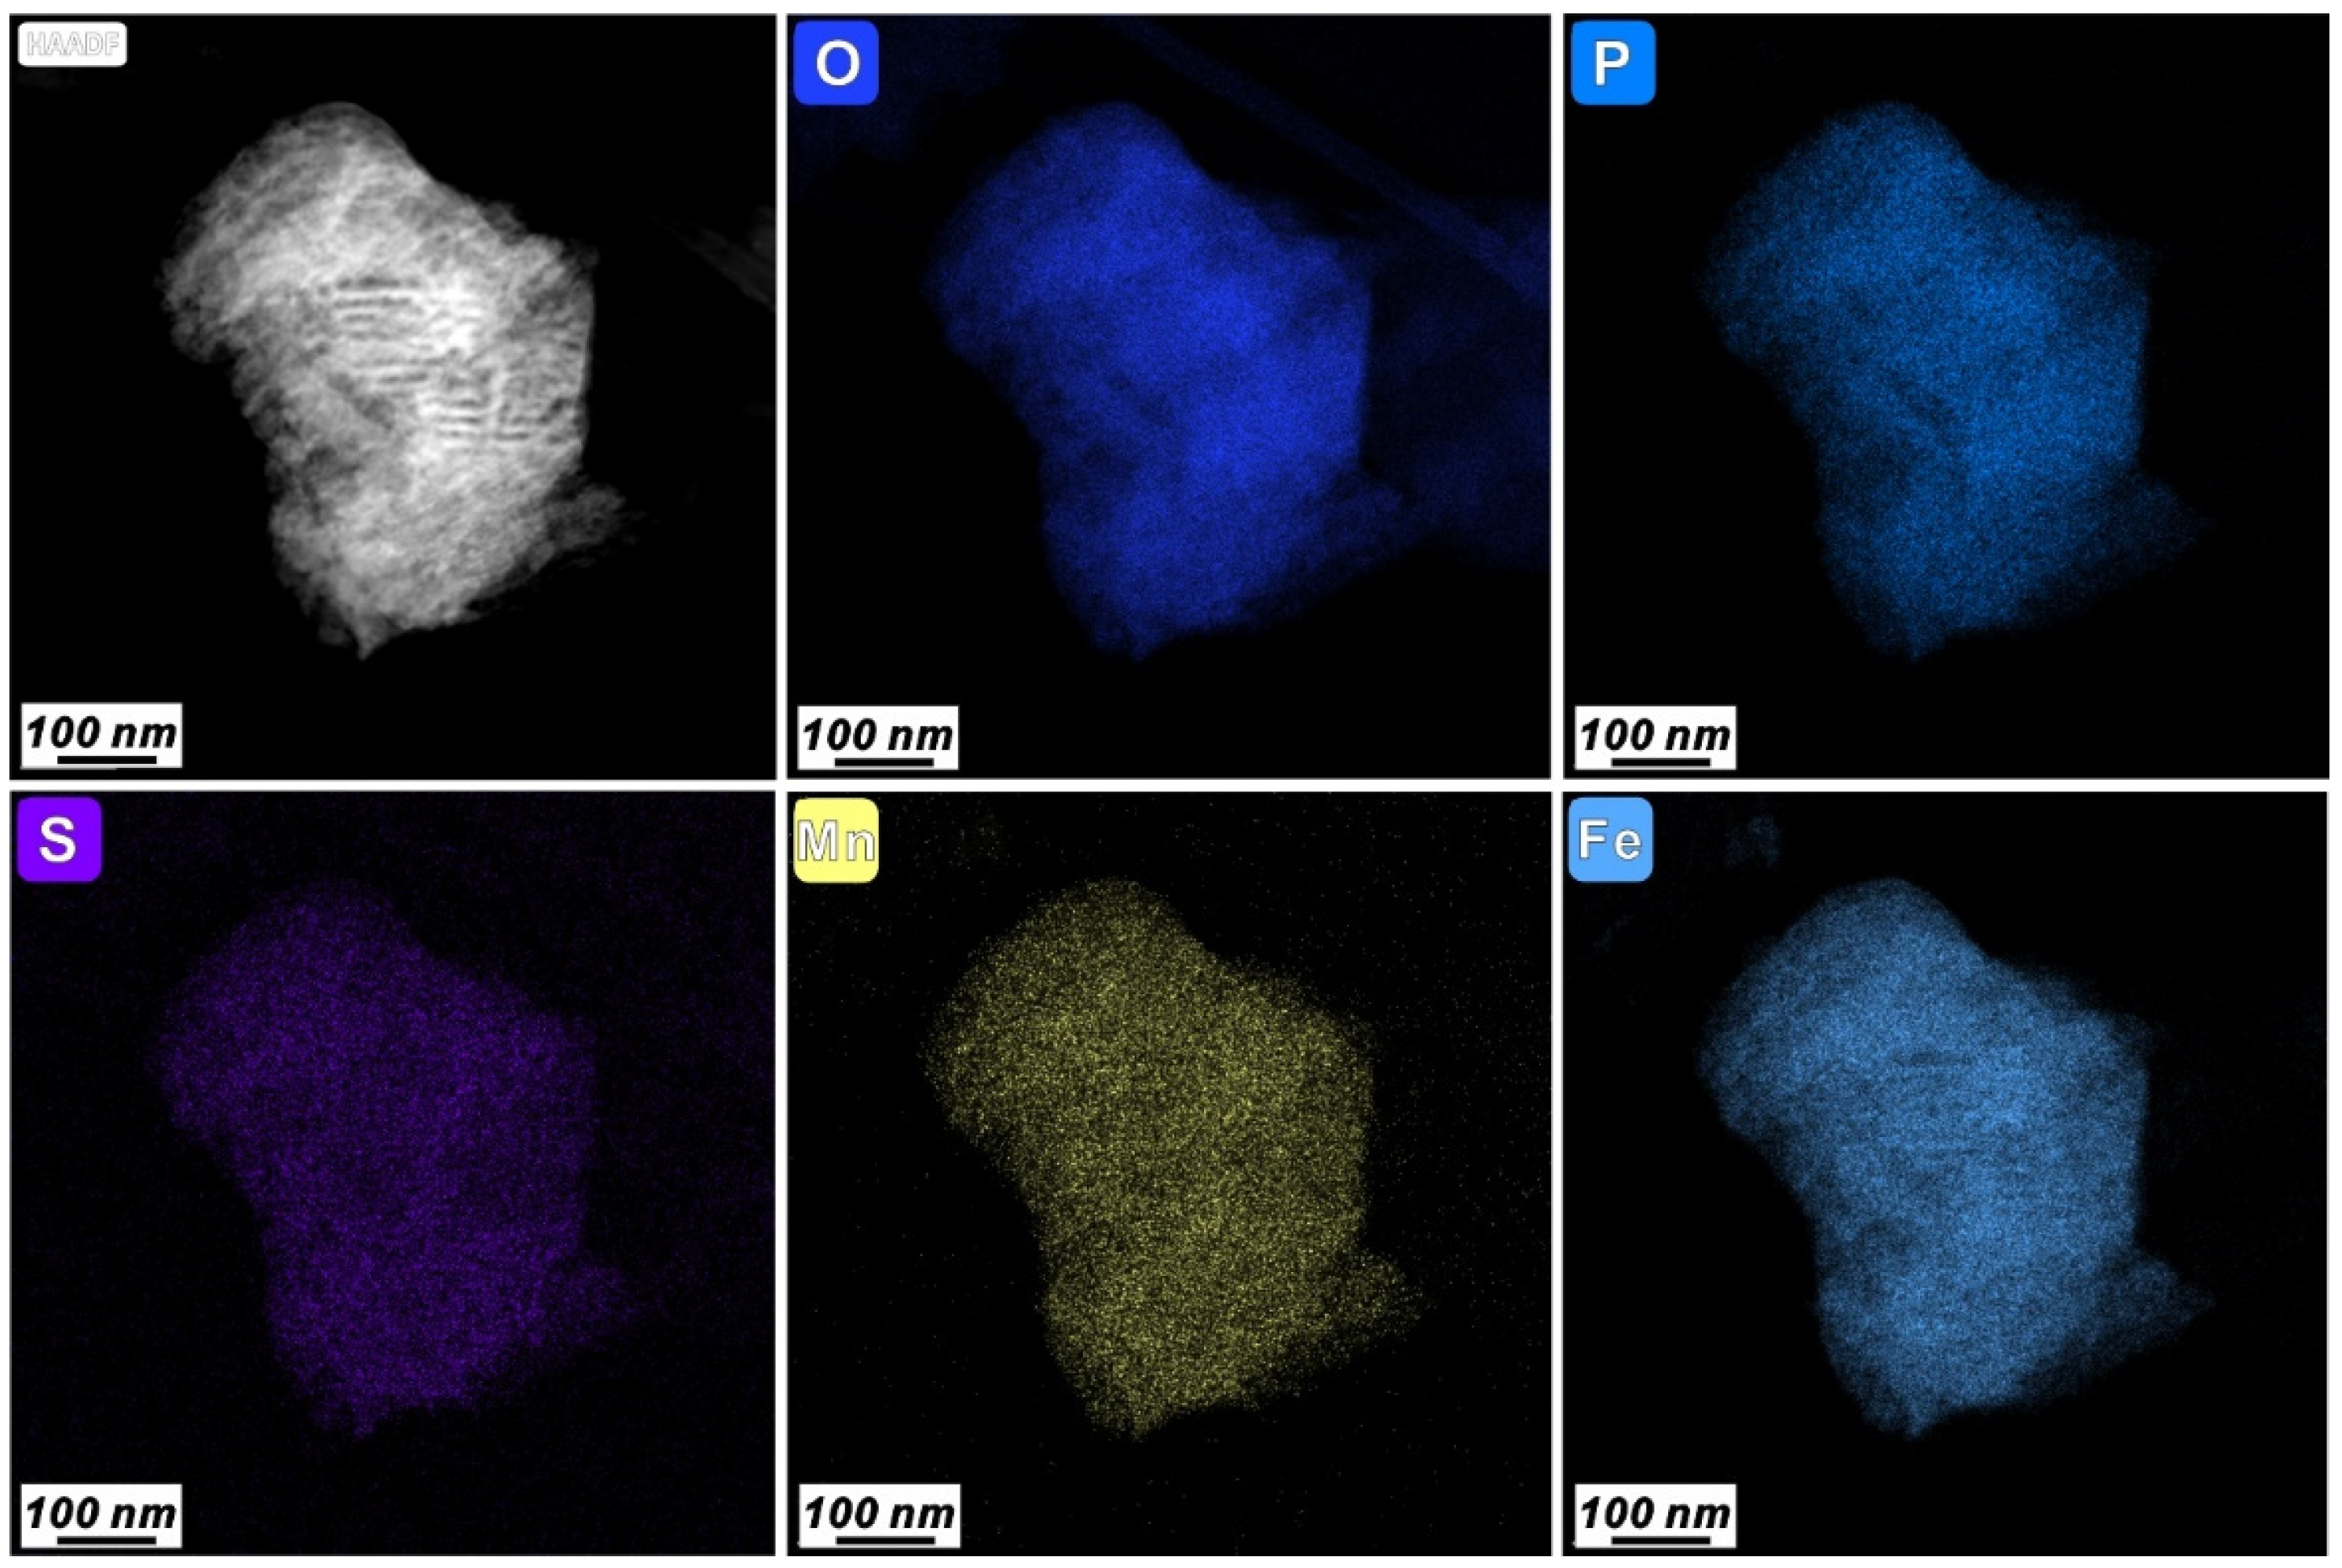
  • P could exist in the form of Ca and Fe phosphate nanoparticles in the estuarine sediments. These phosphate nanoparticles have higher phosphorus content (5.02–9.97 wt%) and are mainly amorphous, with sizes ranging from 50 nm × 120 nm to 250 nm × 400 nm.
  • N-bearing and P-bearing nanoparticles could influence the migration, precipitation and release processes of N and P, and play a certain role in the N-cycling and P-cycling of estuarine and coastal ecosystems. The water environmental management should also pay attention to sediment, especially the N-bearing and P-bearing nanoparticles.
  • The further investigation of P-bearing nanoparticles in sediments may provide nanoscale evidence for phosphorus enrichment and mineralization in marine environment.

Author Contributions

Writing—original draft and data analysis, G.W.; conceptualization, supervision, and writing—reviewing and editing, T.Y., T.L. and G.W.; sample collection and sample preparation, T.Y; evidence collection and data curation, M.Z., Q.C., C.Z., X.W. and L.D. All authors have read and agreed to the published version of the manuscript.

Funding

This research was funded by the Scientific and Technological Innovation Project of Colleges and Universities in Shanxi Province (2021L273), the Fundamental Research Program of Shanxi Province (202103021223249), the Central Public-interest Scientific Institution Basal Research Fund of China (PM-zx703-202002-043, PM-zx703-202004-152), the Investigation and Assessment of Ecological Environment in Key Sea Areas of Guangdong Province (PM-zx555-202106-195) and the Science and Technology Program of Guangzhou (PM-zx913-202105-165).

Data Availability Statement

The data presented in this work are available on request from the corresponding author.

Acknowledgments

We thank the Sinoma Institute of Materials Research (Guangzhou, China) Co., Ltd., for assistance with microscopic analysis.

Conflicts of Interest

The authors declare no conflict of interest.

References

  1. Crooks, S.; Turner, R.K. Integrated Coastal Management: Sustaining Estuarine Natural Resources. Adv. Ecol. Res. 1999, 29, 241–289. [Google Scholar] [CrossRef]
  2. Statham, P.J. Nutrients in estuaries—An overview and the potential impacts of climate change. Sci. Total. Environ. 2012, 434, 213–227. [Google Scholar] [CrossRef] [PubMed]
  3. Booi, S.; Mishi, S.; Andersen, O. Ecosystem Services: A Systematic Review of Provisioning and Cultural Ecosystem Services in Estuaries. Sustainability 2022, 14, 7252. [Google Scholar] [CrossRef]
  4. Nixon, S.W. Coastal marine eutrophication: A definition, social causes, and future concerns. Ophelia 1995, 41, 199–219. [Google Scholar] [CrossRef]
  5. Paerl, H.W. Controlling Eutrophication along the Freshwater–Marine Continuum: Dual Nutrient (N and P) Reductions are Essential. Estuaries Coasts 2009, 32, 593–601. [Google Scholar] [CrossRef]
  6. Howarth, R.; Chan, F.; Conley, D.J.; Garnier, J.; Doney, S.C.; Marino, R.; Billen, G. Coupled biogeochemical cycles: Eutrophication and hypoxia in temperate estuaries and coastal marine ecosystems. Front. Ecol. Environ. 2011, 9, 18–26. [Google Scholar] [CrossRef]
  7. Conley, D.J.; Paerl, H.W.; Howarth, R.W.; Boesch, D.F.; Seitzinger, S.P.; Havens, K.E.; Lancelot, C.; Likens, G.E. Controlling eutrophication: Nitrogen and phosphorus. Am. Assoc. Adv. Sci. 2009, 323, 5917. [Google Scholar] [CrossRef]
  8. Wurtsbaugh, W.A.; Paerl, H.W.; Dodds, W.K. Nutrients, eutrophication and harmful algal blooms along the freshwater to marine continuum. WIREs Water 2019, 6, e1373. [Google Scholar] [CrossRef]
  9. Elser, J.J.; Bracken, M.E.S.; Cleland, E.E.; Gruner, D.S.; Harpole, W.S.; Hillebrand, H.; Ngai, J.T.; Seabloom, E.W.; Shurin, J.B.; Smith, J.E. Global analysis of nitrogen and phosphorus limitation of primary producers in freshwater, marine and terrestrial ecosystems. Ecol. Lett. 2007, 10, 1135–1142. [Google Scholar] [CrossRef]
  10. Conley, D.J.; Paerl, H.W.; Howarth, R.W.; Boesch, D.F.; Seitzinger, S.P.; Havens, K.E.; Lancelot, C.; Likens, G.E. Eutrophication: Time to Adjust Expectations—Response. Science 2009, 324, 724–725. [Google Scholar] [CrossRef]
  11. Khan, M.S.; Shahid, M. Improving Water Quality Using Metal−Organic Frameworks. ACS Symp. Ser. 2021, 1395, 171–191. [Google Scholar] [CrossRef]
  12. Khan, M.S.; Khalid, M.; Shahid, M. What triggers dye adsorption by metal organic frameworks? The current perspectives. Mater. Adv. 2020, 1, 1575–1601. [Google Scholar] [CrossRef]
  13. Seitzinger, S.; Harrison, J.A.; Böhlke, J.K.; Bouwman, A.F.; Lowrance, R.; Peterson, B.; Tobias, C.; Van Drecht, G. Denitrification across Landscapes and Waterscapes: A Synthesis. Ecol. Appl. 2006, 16, 2064–2090. [Google Scholar] [CrossRef] [PubMed]
  14. Chon, H.-S.; Ohandja, D.-G.; Voulvoulis, N. The role of sediments as a source of metals in river catchments. Chemosphere 2012, 88, 1250–1256. [Google Scholar] [CrossRef] [PubMed]
  15. Zhang, W.Q.; Jin, X.; Liu, D.; Tang, W.Z.; Shan, B.Q. Assessment of the sediment quality of freshwater ecosystems in eastern China based on spatial and temporal variation of nutrients. Environ. Sci. Pollut. Res. 2017, 24, 19412–19421. [Google Scholar] [CrossRef]
  16. Carpenter, S.R. Eutrophication of aquatic ecosystems: Bistability and soil phosphorus. Proc. Natl. Acad. Sci. USA 2005, 102, 10002–10005. [Google Scholar] [CrossRef]
  17. Kraal, P.; Burton, E.D.; Rose, A.L.; Cheetham, M.D.; Bush, R.T.; Sullivan, L.A. Decoupling between Water Column Oxygenation and Benthic Phosphate Dynamics in a Shallow Eutrophic Estuary. Environ. Sci. Technol. 2013, 47, 3114–3121. [Google Scholar] [CrossRef]
  18. Zhu, M.; Zhu, G.; Li, W.; Zhang, Y.; Zhao, L.; Gu, Z. Estimation of the algal-available phosphorus pool in sediments of a large, shallow eutrophic lake (Taihu, China) using profiled SMT fractional analysis. Environ. Pollut. 2013, 173, 216–223. [Google Scholar] [CrossRef]
  19. Smith, V.H.; Tilman, G.D.; Nekola, J.C. Eutrophication: Impacts of excess nutrient inputs on freshwater, marine, and terrestrial ecosystems. Environ. Pollut. 1999, 100, 179–196. [Google Scholar] [CrossRef]
  20. Paerl, H.W.; Hall, N.S.; Peierls, B.L.; Rossignol, K.L. Evolving Paradigms and Challenges in Estuarine and Coastal Eutrophication Dynamics in a Culturally and Climatically Stressed World. Estuaries Coasts 2014, 37, 243–258. [Google Scholar] [CrossRef]
  21. Huang, F.; Lin, X.; Hu, W.; Zeng, F.; He, L.; Yin, K. Nitrogen cycling processes in sediments of the Pearl River Estuary: Spatial variations, controlling factors, and environmental implications. Catena 2021, 206, 105545. [Google Scholar] [CrossRef]
  22. Zhao, K.; Fu, H.; Zhu, Y.; Wang, Y.; Wang, S.; Li, F. Environmental Impacts of Nitrogen and Phosphorus Nutrient Diffusion Fluxes at a Sediment-Water Interface: The Case of the Yitong River, China. Sustainability 2023, 15, 1210. [Google Scholar] [CrossRef]
  23. Cao, J.J.; Hu, X.Y.; Jiang, Z.T.; Li, H.W.; Zou, X.Z. Simulation of adsorption of gold nanoparticles carried by gas ascending from the Earth’s interior in alluvial cover of the middle-lower reaches of the Yangtze River. Geofluids 2010, 10, 438–446. [Google Scholar] [CrossRef]
  24. Yon, J.N.; Lead, J.R. Manufactured nanoparticles: An overview of their chemistry, interactions and potential environmental implications. Sci. Total Environ. 2008, 400, 396–414. [Google Scholar]
  25. Zhang, P.; Lu, J.; Zuo, L.; Wang, Y.; Liu, R.; Tao, D.; Chen, Z.; Tao, G.; Wang, K. Identification of Natural Nearly or Nanoscale Particles in Bituminous Coal: An Important Form of Elements in Coal. Sustainability 2023, 15, 6276. [Google Scholar] [CrossRef]
  26. Hochella, M.F., Jr.; Lower, S.K.; Maurice, P.A.; Penn, R.L.; Sahai, N.; Sparks, D.L.; Twining, B.S. Nanominerals, Mineral Nanoparticles, and Earth Systems. Science 2008, 319, 1631–1635. [Google Scholar] [CrossRef]
  27. Hochella, M.F., Jr.; Mogk, D.W.; Ranville, J.; Allen, I.C.; Luther, G.W.; Marr, L.C.; McGrail, B.P.; Murayama, M.; Qafoku, N.P.; Rosso, K.M.; et al. Natural, incidental, and engineered nanomaterials and their impacts on the Earth system. Science 2019, 363, eaau8299. [Google Scholar] [CrossRef]
  28. Ruttenberg, K.C.; Sulak, D.J. Sorption and desorption of dissolved organic phosphorus onto iron (oxyhydr)oxides in seawater. Geochim. Cosmochim. Acta 2011, 75, 4095–4112. [Google Scholar] [CrossRef]
  29. Johnson, B.B.; Quill, E.; Angove, M.J. An investigation of the mode of sorption of inositol hexaphosphate to goethite. J. Colloid Interface Sci. 2012, 367, 436–442. [Google Scholar] [CrossRef]
  30. Wan, B.; Yan, Y.; Liu, F.; Tan, W.F.; He, J.J.; Feng, X.H. Surface speciation of myo-inositol hexakisphosphate adsorbed on TiO2 nanoparticles and its impact on their colloidal stability in aqueous suspension: A comparative study with orthophosphate. Sci. Total. Environ. 2016, 544, 134–142. [Google Scholar] [CrossRef]
  31. Xu, C.-Y.; Li, J.-Y.; Xu, R.-K.; Hong, Z.-N. Sorption of organic phosphates and its effects on aggregation of hematite nanoparticles in monovalent and bivalent solutions. Environ. Sci. Pollut. Res. 2017, 24, 7197–7207. [Google Scholar] [CrossRef] [PubMed]
  32. Madden, A.S.; Hochella, M.F.; Luxton, T.P. Insights for size-dependent reactivity of hematite nanomineral surfaces through Cu2+ sorption. Geochim. Cosmochim. Acta 2006, 70, 4095–4104. [Google Scholar] [CrossRef]
  33. Fortin, D.; Beveridge, T.J. Mechanistic routes towards biomineral surface development. In Biomineralisation: From Biology to Biotechnology and Medical Application; Baeuerlein, E., Ed.; Wiley-VCH Verlag: Weinheim, Germany, 2000. [Google Scholar]
  34. Raliya, R.; Tarafdar, J.C.; Biswas, P. Enhancing the Mobilization of Native Phosphorus in the Mung Bean Rhizosphere Using ZnO Nanoparticles Synthesized by Soil Fungi. J. Agric. Food Chem. 2016, 64, 3111–3118. [Google Scholar] [CrossRef] [PubMed]
  35. Thomas, E.; Rathore, I.; Tarafdar, J.C. Bio-Inspired Synthesis of Nitrogen Nanoparticles and Its Application on Pearl Millet (Pennisetum americanum L.) cv. HHB 6. J. Bionanosci. 2016, 10, 300–306. [Google Scholar] [CrossRef]
  36. Liu, R.; Lin, X.; Wang, G.; Liu, X. Natural N-bearing nanoparticles in sediments of a shallow bay of the south china: A new N form in N-cycling. Ecol. Indic. 2021, 122, 107281. [Google Scholar] [CrossRef]
  37. Luo, X.; Jiao, J.J.; Moore, W.S.; Cherry, J.A.; Wang, Y.; Liu, K. Significant chemical fluxes from natural terrestrial groundwater rival anthropogenic and fluvial input in alarge-rive r deltaic estuary. Water Res. 2018, 144, 603–615. [Google Scholar] [CrossRef]
  38. Liu, J.; Du, J.; Wu, Y.; Liu, S. Nutrient input through submarine groundwater discharge in two major Chinese estuaries: The Pearl River Estuary and the Changjiang River Estuary. Estuar. Coast. Shelf Sci. 2018, 203, 17–28. [Google Scholar] [CrossRef]
  39. Yuan, X.Q.; Yang, Q.S.; Luo, X.X.; Yu, F.L.; Liu, F.; Li, J.Y.; Wang, Z.H. Distribution of grain size and organic elemental composition of the surficial sediments in Lingding Bay in the Pearl River Delta, China: A record of recent human activity. Ocean Coast. Manag. 2019, 178, 104849. [Google Scholar] [CrossRef]
  40. He, J.; Garzanti, E.; Cao, L.C.; Wang, H. The zircon story of the Pearl River (China) from Cretaceous to present. Earth Sci. Rev. 2020, 201, 103078. [Google Scholar] [CrossRef]
  41. Fu, T.; Niu, L.X.; Dang, H.M.; Yang, Q.S. Effects of seasonal variation of the river discharge input on nitrogen and phosphorus nutrients in Pearl River Estuary. Chin. J. Mar. Environ. Sci. 2023, 42, 122–130, (In Chinese with English Abstract). [Google Scholar]
  42. Wu, Z.; Milliman, J.D.; Zhao, D.; Cao, Z.; Zhou, J.; Zhou, C. Geomorphologic changes in the lower Pearl River Delta, 1850–2015, largely due to human activity. Geomorphology 2018, 314, 42–54. [Google Scholar] [CrossRef]
  43. Gao, L.-H.; Ning, J.; Bao, W.-L.T.Y.; Yan, A.; Yin, Q.-R. A study on the marine ecological security assessment of Guangdong-Hong Kong-Macao Great Bay Area. Mar. Pollut. Bull. 2022, 176, 113416. [Google Scholar] [CrossRef] [PubMed]
  44. Chen, S.Z.; Pei, C.M. Geology and geochemistry of source rocks of the eastern Pearl River mouth basin, South China Sea. J. Asian Earth Sci. 1993, 8, 393–406. [Google Scholar]
  45. Hu, D.; Clift, P.D.; Böning, P.; Hannigan, R.; Hillier, S.; Blusztajn, J.; Wan, S.M.; Fuller, D.Q. Holocene evolution in weathering and erosion patterns in the Pearl River delta. Geochem. Geophys. Geosyst. 2013, 14, 2349–2368. [Google Scholar] [CrossRef]
  46. GB/T 17378.5-2007; The Specificatoin for Marine Monitoring. Part 5: Sediment Analysis. General Administration of Quality Supervision, Inspection and Quarantine of the People’s Republic of China: Beijing, China, 2007.
  47. Wang, G.Q.; Yang, T.J.; Fan, Y.T.; Bai, S.S.; Yin, P.Y. Calcium Sulfate Nanoparticles in Surface Sediments of Lingding Bay of the Pearl River Estuary, China: Implications for the Nonclassical Crystallization Pathway of Gypsum in the Natural Estuary Environment. Minerals 2023, 13, 903. [Google Scholar] [CrossRef]
  48. Yang, X.Z.; Wang, Q.; Qu, X.L.; Jiang, W. Bound and unbound humic acids perform different roles in the aggregation and deposition of multi-walled carbon nanotubes. Sci. Total. Environ. 2017, 586, 738–745. [Google Scholar] [CrossRef]
  49. Li, Y.K.; Cao, J.J.; Hopke, P.K.; Holub, R.F.; Jiang, T. The discovery of the metallic particles of groundwater from the Dongshengmiao polymetallic deposit, Inner Mongolia, and their prospecting significance. J. Geochem. Explor. 2016, 161, 49–61. [Google Scholar] [CrossRef]
  50. Chester, J.S.; Chester, F.M.; Kronenberg, A.K. Fracture surface energy of the Punchbowl fault, San Andreas system. Nature 2005, 437, 133–136. [Google Scholar] [CrossRef]
  51. Dor, O.; Ben-Zion, Y.; Rockwell, T.K.; Brune, J. Pulverized rocks in the Mojave section of the San Andreas Fault Zone. Earth Planet. Sci. Lett. 2006, 245, 642–654. [Google Scholar] [CrossRef]
  52. Sun, Y.; Shu, L.; Lu, X.; Liu, H.; Zhang, X.H.; Lin, A.; Kosaka, K. Recent progress in studies on the nano-sized particle layer in rock shear planes. Prog. Nat. Sci. Mater. 2008, 18, 367–373. [Google Scholar] [CrossRef]
  53. Wang, G.Q.; Cao, J.J.; Dai, D.L. TEM analysis of nano- or near-nanoparticles in fault gouge from the Kaxiutata iron deposit (CHN) and the implications for ore body exploration. J. Geochem. Explor. 2019, 207, 106390. [Google Scholar] [CrossRef]
  54. Southam, G.; Lengke, M.F.; Fairbrother, L.; Reith, F. The Biogeochemistry of Gold. Elements 2009, 5, 303–307. [Google Scholar] [CrossRef]
  55. Wei, X.J.; Cao, J.J.; Holub, R.F.; Hopke, P.K.; Zhao, S.J. TEM study of geogastransported nanoparticles from the Fankou lead–zinc deposit, Guangdong Province, South China. J. Geochem. Explor. 2013, 128, 124–135. [Google Scholar] [CrossRef]
  56. Luo, S.Y.; Cao, J.J.; Yan, H.B.; Yi, J. TEM observations of particles based on sampling in gas and soil at the Dongshengmiao polymetallic pyrite deposit, Inner Mongolia, Northern China. J. Geochem. Explor. 2015, 158, 95–111. [Google Scholar] [CrossRef]
  57. Yücel, M.; Gartman, A.; Chan, C.S.; Luther, G.W., III. Hydrothermal vents as a kinetically stable source of iron-sulphide-bearing nanoparticles to the ocean. Nat. Geosci. 2011, 4, 367–371. [Google Scholar] [CrossRef]
  58. Borm, P.J.; Kreyling, W. Toxicological Hazards of Inhaled Nanoparticles—Potential Implications for Drug Delivery. J. Nanosci. Nanotechnol. 2004, 4, 521–531. [Google Scholar] [CrossRef]
  59. Craft, E.S.; Abu-Qare, A.W.; Flaherty, M.M.; Garofolo, M.C.; Rincavage, H.L.; Abou-Donia, M.B. Depleted and Natural Uranium: Chemistry and Toxicological Effects. J. Toxicol. Environ. Health Part B 2004, 7, 297–317. [Google Scholar] [CrossRef]
  60. Oberdörster, G.; Sharp, Z.; Atudorei, V.; Elder, A.; Gelein, R.; Kreyling, W.; Cox, C. Translocation of Inhaled Ultrafine Particles to the Brain. Inhal. Toxicol. 2004, 16, 437–445. [Google Scholar] [CrossRef]
  61. Tsandev, I.; Reed, D.C.; Slomp, C.P. Phosphorus diagenesis in deep-sea sediments: Sensitivity to water column conditions and global scale implications. Chem. Geol. 2012, 330–331, 127–139. [Google Scholar] [CrossRef]
  62. Baalousha, M. Aggregation and disaggregation of iron oxide nanoparticles: Influence of particle concentration, pH and natural organic matter. Sci. Total Environ. 2009, 407, 2093–2101. [Google Scholar] [CrossRef]
  63. Hotze, E.M.; Phenrat, T.; Lowry, G.V.; Loery, G.V.; Bernhardt, E.S.; Dionysiou, D.D.; Wiesner, M.R. Nanoparticle aggregation: Hallenges to understanding transport and reactivity in the environment. J. Environ. Qual. 2010, 39, 1909. [Google Scholar] [CrossRef] [PubMed]
  64. Afshinnia, K.; Baalousha, M. Effect of phosphate buffer on aggregation kinetics of citrate-coated silver nanoparticles induced by monovalent and divalent electrolytes. Sci. Total Environ. 2017, 581–582, 268–276. [Google Scholar] [CrossRef] [PubMed]
  65. Ingall, E.D.; Jahnke, R.A. Evidence for enhanced phosphorus regeneration from marine sediments overlain by oxygen depleted waters. Geochim. Cosmochim. Acta 1994, 58, 2571–2575. [Google Scholar] [CrossRef]
  66. Mort, H.P.; Slomp, C.P.; Gustafsson, B.G.; Andersen, T.J. Phosphorus recycling and burial in Baltic Sea sediments with contrasting redox conditions. Geochim. Cosmochim. Acta 2010, 74, 1350–1362. [Google Scholar] [CrossRef]
  67. Pufahl, P.K.; Groat, L.A. Sedimentary and Igneous Phosphate Deposits: Formation and Exploration: An Invited Paper. Econ. Geol. 2017, 112, 483–516. [Google Scholar] [CrossRef]
  68. Nelson, G.J.; Pufahl, P.K.; Hiatt, E.E. Paleoceanographic constraints on Precambrian phosphorite accumulation, Baraga Group, Michigan, USA. Sediment. Geol. 2010, 226, 9–21. [Google Scholar] [CrossRef]
  69. Yu, L.M.; Liu, M.X.; Dan, Y.; Said, N.; Wu, J.H.; Hou, M.C.; Zou, H. The Origin of Ediacaran Phosphogenesis Event: New Insights from Doushantou Formation in the Danzhai phosphorite deposit, South China. Ore Geol. Rev. 2022, 152, 105230. [Google Scholar] [CrossRef]
Figure 1. (a) Water system map of the Pearl River Basin. (b) Sketch map of the study area and sampling sites (modified from [40,41]). (c) Total nitrogen (TN) and (d) total phosphorus (TP) content in the surface sediments (0–5 cm) in the Pearl River Estuary, China.
Sustainability 15 14301 g001
Figure 2. The XRD results of the surface sediments (Z1–Z6). Mineral abbreviations: Qz—quartz; Ms—muscovite; An—anorthite; Kfs—K-feldspar; Gy—gypsum; Cal—calcite; Chl—chlorite; Kln—kaolinite; Ill—illite.
Sustainability 15 14301 g002
Figure 3. (a) TEM image of N-bearing and P-bearing nanoparticles (ID:1–4); the EDS results are shown in Figure 4 and Table 2. (bd) HR-TEM images and SAED pattern of an N- and P-bearing hematite nanoparticle (ID: 1). (ek) HR-TEM images and SAED pattern of an N- and P-bearing goethite nanoparticle aggregation (ID: 2). (h,i) HR-TEM image and fast Fourier transform (FFT) pattern of an N-bearing muscovite nanoparticle (ID: 3). (j,k) HR-TEM image and FFT pattern of a Ca phosphate nanoparticle (ID: 4).
Sustainability 15 14301 g003
Figure 4. EDS images of N- and P-bearing nanoparticles (ID:1–4).
Sustainability 15 14301 g004
Figure 5. HAADF-STEM image and N, O, Al, Si, P, S, Ca and Fe TEM maps of N-and P-bearing nanoparticles (ID:1–4).
Sustainability 15 14301 g005
Figure 6. (a) TEM image of N- and P-bearing nanoparticles (ID: 5–6); the EDS results are shown in Figure 7 and Table 2. (b,c) HR-TEM image and FFT pattern of an N- and P-bearing hematite nanoparticle (ID: 5). (d,e) HR-TEM image and FFT pattern of an N- and P-bearing hematite nanoparticle aggregation (ID: 6).
Sustainability 15 14301 g006
Figure 7. EDS images of N- and P-bearing nanoparticles (ID: 5–6).
Sustainability 15 14301 g007
Figure 8. (a) TEM image of two N- and P-bearing nanoparticles (ID: 7–8); the EDS results are shown in Figure 9 and Table 2. (b,c) HR-TEM image and SAED pattern of an N- and P-bearing anorthite nanoparticle (ID: 7). (d,e) HR-TEM image and SAED pattern of an N- and P-bearing quartz nanoparticle (ID: 8).
Sustainability 15 14301 g008
Figure 9. EDS images of two N- and P-bearing nanoparticles (ID: 7–8).
Sustainability 15 14301 g009
Figure 10. (a) TEM image and SAED pattern of a Fe phosphate nanoparticle (ID: 9); the EDS results are shown in Figure 11 and Table 2. (b) SAED pattern of (a).
Sustainability 15 14301 g010
Figure 11. EDS images of the Fe phosphate nanoparticle (ID: 9).
Sustainability 15 14301 g011
Figure 12. HAADF-STEM image and O, P, S, Mn and Fe TEM maps of the Fe phosphate nanoparticle (ID: 9).
Sustainability 15 14301 g012
Table 1. Location information of sampling sites, total nitrogen (TN) and total phosphorus (TP) in surface sediments of the Pearl River Estuary.
Sample NumberLatitude (°N)Longitude (°E)Depth (m)TN (mg/g)TP (mg/g)
Z122°52′33″113°33′48″16.30.9530.540
Z222°48′49″113°36′41″6.01.1900.584
Z322°45′57″113°39′10″4.50.9550.514
Z422°34′45″113°45′09″13.91.1130.383
Z522°22′25″113°40′10″4.50.7920.328
Z622°20′25″113°51′53″6.50.7580.668
Table 2. Detailed information of natural N-bearing and P-bearing nanoparticles (ID: 1–9) in surface sediments in the Pearl River Estuary.
Sample NumberEDS IDTypeSize (nm)ShapeCrystallinityElement
NOFNaMgAlSiPSClKCaTiMnFe
Z11N- and P-bearing hematite nanoparticle150 × 200IrregularSingle crystalwt%3.7347.90 0.430.442.143.540.230.180.310.130.26 1.12 39.59
at%6.2570.21 0.440.421.852.960.150.120.210.080.15 0.54 16.62
Z12N- and P-bearing goethite nanoparticle aggregation150 × 200IrregularPoly crystalwt%3.5656.76 0.390.804.082.391.120.660.200.130.17 0.84 28.91
at%5.4275.62 0.360.703.221.810.770.430.120.070.08 0.36 11.04
Z13N-bearing muscovite nanoparticle50 × 100LayerSingle crystalwt%1.8850.210.75 1.0617.7223.28 3.92 1.17
at%2.7063.230.79 0.8813.2416.71 2.03 0.42
Z14Ca phosphate nanoparticle50 × 120Nearly rectangleAmorphouswt%1.6947.022.17 1.278.0716.345.02 2.4514.24 1.72
at%2.5562.302.42 1.126.3412.333.44 1.347.52 0.65
Z25N- and P-bearing hematite nanoparticle10 × 50StripSingle crystalwt%2.1543.14 0.740.422.332.990.690.130.10 0.180.100.05 46.99
at%3.8767.94 0.820.432.182.680.550.090.07 0.110.050.02 21.18
Z26N- and P-bearing hematite nanoparticle aggregation50 × 100IrregularPoly crystalwt%3.5952.08 0.650.845.253.870.750.330.24 0.270.280.64 31.21
at%5.6671.82 0.620.764.293.040.540.230.14 0.140.160.28 12.33
Z47N- and P-bearing anorthite nanoparticle250 × 400IrregularSingle crystalwt%2.3654.61 0.420.2913.6214.950.270.100.18 0.1412.72 0.33
at%3.3968.38 0.360.2410.1010.670.170.060.10 0.076.35 0.11
Z48N- and P-bearing quartz nanoparticle150 × 250IrregularSingle crystalwt%1.5266.52 0.210.150.4030.610.220.090.06 0.050.12 0.06
at%2.0176.96 0.160.120.2820.170.120.050.03 0.020.05 0.02
Z59Fe phosphate nanoparticle250 × 400IrregularAmorphouswt% 51.66 1.131.920.370.359.971.97 0.181.04 1.5829.82
at% 74.09 1.131.820.310.287.381.40 0.090.59 0.6512.25
Disclaimer/Publisher’s Note: The statements, opinions and data contained in all publications are solely those of the individual author(s) and contributor(s) and not of MDPI and/or the editor(s). MDPI and/or the editor(s) disclaim responsibility for any injury to people or property resulting from any ideas, methods, instructions or products referred to in the content.

