Article

The Relationship between the Built Environment and Climate Change: The Case of Turkish Provinces

1
Department of City and Regional Planning, Faculty of Architecture, Erciyes University, Kayseri 38280, Türkiye
2
Department of City and Regional Planning, Faculty of Architecture, Yildiz Technical University, Istanbul 34349, Türkiye
*
Author to whom correspondence should be addressed.
Sustainability 2023, 15(2), 1659; https://doi.org/10.3390/su15021659
Submission received: 22 November 2022 / Revised: 29 December 2022 / Accepted: 10 January 2023 / Published: 14 January 2023

Abstract

:
The relationship between the built environment and climate change has been discussed from many perspectives. This study examines the effect of the built environment on climate change indicators in Turkish provinces over the last 18 years, contributing to the literature on built environment analyses regarding both urban and rural areas, unlike other studies that have focused mostly on urban areas. The study discusses the changes in climate indicators using maps and analyzes the effects of the built environment on climate change using linear regression. The results indicate that provinces in Türkiye have experienced climate change effects such as increased annual mean temperature, maximum temperature, maximum precipitation, extreme weather events, and drought. These effects differed both in terms of geography and the subperiods over the examined period. The results also demonstrate the increase in the built environment to have a positive correlation with the increases in annual maximum temperature and the annual number of extreme weather events. The built environment in Türkiye increased 63% between 1990 and 2018, and the average number of extreme weather events per province increased from 0.3 to 8 over this same period. At the same time, the average annual mean temperature increased from 12.9 to 15.1 °C, the average maximum temperature went up from 24.6 to 25.8 °C, the average annual maximum precipitation increased from 125.6 to 157.7 mm, and the average number of dry months per year increased from 3.4 to 3.8.

1. Introduction

A mutual interaction exists between the built environment and climate change and has been observed in urban areas in particular [1,2,3,4]. Increased population sizes, especially as a result of urbanization, require commensurate increases in the built environment. These increases and subsequent large-scale changes in land use have significant effects on climate change [5]. Each different land use change has had varying degrees of impact on the climate, with the result being that cities have become a direct cause of the climate change problem. Researchers first attempted for many years to explain the human impact on climate change by focusing on alteration in atmospheric conditions; however, studies assessing climate change have revealed the effects of land use transformation for nearly three decades [6,7,8,9,10,11,12]. In addition to the effects of the built environment and land use changes on greenhouse gas emissions, studies are also found to have directly attributed regional climate change to factors such as changing evaporation levels, precipitation regimes, increased temperatures, changing temperature flows, and increased surface flows [1,6,13,14,15,16,17,18]. When considering the projections regarding growing urban populations, the triggering effect cities have on climate change will clearly increase in the future, leaving urban areas more exposed to climate phenomena such as floods, high water levels, heat waves, droughts, and storms. The relationship between increasing the built environment and local climate thus appears to be substantial at the provincial scale, which includes urban and rural areas [2,3,19,20,21].
Countries’ different geographical characteristics result in climate change being analyzed under different indicators. These generally include a wide range of factors such as greenhouse gases, weather and climate, oceans, snow and glaciers, health and society, and ecosystems [22]. Among these global indicators, however, also exist short-term and direct indicators related to weather and climate, such as temperature, precipitation, drought, and extreme weather events [22,23,24]. These indicators are also classified as the direct effects of climate change [25]. Many countries such as the Netherlands, America, and England have attempted to address climate change in relation to weather and climate factors based on these basic variables [22,23,24,26,27]. The Ministry of Environment, Urbanization and Climate Change in Türkiye published an environmental indicators booklet in 2006 [4] that classified temperature, irregularities in the precipitation regime (maximum precipitation), drought, and extreme weather events, using weather and climate factors as basic climate change indicators.
The relationship among changes in climate, land use, and the built environment has been examined from different perspectives in the literature. Various studies have been conducted on the effects caused by changes in the built environment and climate change using climate change indicators and land carbon stores [28], urbanization and high flow levels in basins [29,30], the urban built environment and temperature [31,32,33,34,35], the impacts of the urban built environment and climate change on urban flooding [36,37,38], and the impacts of the urban built environment on extreme weather events [39,40].
Increasing the built environment has a significant effect on temperature. The majority of the research on this topic comprises comparisons between rural and urban areas, which has demonstrated urban areas to have higher temperatures. Brovkin et al. [28] evaluated the effects of transformation in land use and land cover on climate and land carbon stores. One of the most important indications of their research was that climate change indicators were more serious in regions where alterations in anthropogenic land use and land cover had exceeded 10%. Lin et al. [33] examined changes in the frequency, duration, magnitude, and timing of heat waves (HWs) in the city of Fujian in southeast China between 1971 and 2014 and found HWs to have started earlier, ended later, and become more frequent, intense, and persistent in the densely populated and highly urbanized areas in Fujian. The researchers estimated that urbanization had been responsible for about half of the increase in HWs. Argüeso et al. [31] examined the impact of future urban growth on temperature for Sydney, Australia. Their analysis of temperature changes revealed that future urbanization would strongly affect minimum temperatures, while having little effect on maximum temperatures. Meanwhile, Chapman et al.’s [32] systematic review of the relationship between climate change, urbanization, and temperature examined the effect of urban growth on local temperatures. According to their study, urban growth had an impact on temperature increases of up to 5 °C in the northeast section of the USA. They also found that, while the heat island effect in cities such as Chicago and Beijing had increased with climate change, it had reduced in cities such as Paris and Brussels.
Another important indicator of the built environment regarding climate change is the shifting precipitation regimes, with lower transpiration–evaporation rates that result from the decreased filtration capacity of the soil, lower soil porosity/voids, changes in soil moisture, and decreased vegetation [6,37]. As a result of such changes, some regions receive heavy rains, while others remain drier throughout the year. While heavy rains increase the frequency of urban floods, drought becomes the most significant problem for many cities in periods of decreased precipitation. Increasing the built environment causes turbulent heat forms and serious surface flows [6,37]. The water saturation point of soil also affects the time and magnitude of floods, with precipitation density and soil moisture being the two most important factors that initiate flash floods. Studies have shown urbanization to increase runoff by a factor of 2–6 [41]. Bradshaw et al. [36] found a 10% decrease in natural forest areas to increase flood rates by 4–28% after conducting a study on large-scale watersheds in 56 developing countries between 1990 and 2000.
Another problem area caused by changing precipitation regimes is drought. The turbulence of the built environment and the heat forms that emerge from land use transformation result in less transpiration, which in turn leads to less humidity and precipitation. This also leads to a decrease in thunderstorm activity in affected regions [6]. Decreased humidity and evaporation give rise to drought problems, especially in summer months.
Important climate change indicators such as temperature, precipitation, and drought affect extreme weather events in settlements, with one significant factor regarding extreme weather events being runoff. Zhao et al.’s [30] study examined high flow levels regarding the peak flows over the San Antonio River basin in Texas. The most significant result from their study was how combining the changes in the urban built environment with the effects of climate change had revealed a 58% increase in the annual peak flow levels during the 2070–2099 period compared to the 2020–2049 period [30]. Zhou et al.’s [38] research on the hydrological flows and urban floods connected to urban development in northern China also demonstrated how urbanization has led to a 208–413% increase in annual runoff, with urban flood volumes able to vary greatly depending on the performance of the urban drainage system.
In one of the most significant studies on the urban built environment and extreme weather events, Lin et al. [39] demonstrated urban agglomerations (UAs) throughout China to have contributed to increases in extreme heat and decreases in extreme cold, with 20 UAs being found responsible for approximately 30% of the total variation in extreme temperature events in the urban core. On the other hand, the effects of urbanization on extreme precipitation indices showed stronger regional differences than on extreme temperatures. Urban agglomerations in coastal areas also appeared to have weakening effects on extreme precipitation events, while having intensifying effects in the central and western regions of China. Qiu et al. [34] investigated the effect of urbanization on regional extreme temperatures, revealing urbanization to significantly increase the extreme minimum temperatures, extreme maximum temperatures, and average temperatures in different seasons and in different regions. They also found the extreme temperature indices at high latitudes to increase faster compared to those at lower altitudes and the effects of urbanization on extreme minimum temperatures and average temperatures to be higher than on extreme maximum temperatures. Limited studies are noteworthily found in the literature on the relationship between climate change and the built environment in Türkiye. These studies have mostly focused on urban areas. Some of these studies are as follows: Kazancı [42] evaluated the role of smart cities in adapting to climate change with regard to the Muğla metropolitan area. Karacan [43] examined greenhouse gas reduction strategies in the context of urban climate change for the case of Ankara. Onur and Tezer [44] investigated urbanization with regard to the climate change adaptation framework in Istanbul. Gülbaz et al. [29] analyzed low-impact urbanization implementations on surface runoff for the case of Istanbul University’s Avcılar Campus. Balaban [45] investigated global warming and climate change with regard to urban and urbanization features, while Oruç et al. [40] analyzed climate change, extreme rains, and their effects for the case of Etimesgut District in Ankara. Meanwhile, one study [35] conducted in Türkiye examined the effect of urban growth on ground surface temperatures in Mersin and determined Mersin city center to have experienced an average temperature increase of 6 °C as a result of the destruction and transformation of many natural areas into artificial ones over 30 years.
These studies demonstrate that increases in the built environment and transformations in land use have different effects on climate change. However, the fact that they are on urban areas also necessitates analyses of the whole urban–rural system.
Multiple international agreements have been made and studies performed in the fight against global climate change (e.g., the Intergovernmental Panel on Climate Change, the UN Framework Convention on Climate Change, Kyoto Protocols, Montreal Protocols, and the Paris Climate Agreement). These agreements and studies have led to a deeper understanding of the importance of the relationship between climate change and urbanization. In Türkiye, strategies and plans are being developed in accordance with many international policy agreements, including initiatives on climate change mitigation and adaptation. These initiatives are encountered at the national and local levels as climate change mitigation action plans and adaptation action plans. Although the focus on this topic has increased recently, the relationship between the built environment, land use transformation, and climate change in urban areas has been a subject of extensive debate in the literature for nearly three decades [1,7,13,18,31,32,33,34,39,46,47,48]. Such debates have demonstrated the need for policies to focus on urban land use transformation in order to both improve adaptation to climate change and mitigate its impacts.
This study examines the effects of changes in the built environment on climate change across all of Türkiye’s provinces. The research focuses on the built environment of both urban and rural areas at the provincial scale, unlike other studies that have focused mostly on urban areas. Accordingly, the hypothesis of the study is that the built environment at the provincial scale has a significant effect on local climate based on five basic indicators: average temperature, maximum temperature, maximum precipitation, extreme weather events, and drought. In testing this hypothesis, this study focuses not only on urban areas but also tries to capture the effects of climate change as faced by all the provinces throughout Türkiye, with the aim of contributing to the literature by focusing on climate change at the provincial level.
The research focuses on the issue of how built environments increase the levels of climate change indicators and consists of four main sections, including the introduction. The second section presents the data and methodology used in the research. The third section presents the research findings, first outlining 30 years of change in climate indicators for the provinces of Türkiye using maps and then evaluating whether the built environment has had a significant effect on climate change using the prepared regression tables. The final section involves a discussion of the research findings that have been obtained within the scope of the research hypothesis and explains the authors’ suggestions for future research and policies. The next section of the study examines the effect of the built environment on climate change across all Turkish provinces and presents the data and methodology used in the research.

2. Data and Methodology

This study uses six data sets: one for the built environment and five for climate change. The built environment data set is the independent variable and was obtained from the Coordination of Information on the Environment (CORINE) portal of Türkiye’s Ministry of Agriculture and Forestry, which provides land use information at the provincial level through the CORINE system. CORINE categorizes land use in Europe, inclusive of Türkiye, into 44 classes using satellite images detailing areas larger than 25 hectares (ha). The system is essential in enabling comparisons of similar changes in land use for 1990, 2000, 2006, 2012, and 2018 [49]. CORINE categorizes the 44 classes of land use under five main headings: artificial surfaces (built environment), agricultural areas, forests and semi-natural areas, wetlands, and water bodies. This study uses the artificial surfaces data (ha). The CORINE system has four subheadings for artificial areas. The first is called urban fabric, where areas whose surfaces are covered more than 80% by impermeable features are defined as continuous urban fabric, and areas whose surfaces are covered between 30%–80% by impermeable features are defined as discontinuous urban fabric. The second subheading is industrial, commercial, and transport units and mainly consists of industrial or commercial units and transportation units such as roads, ports, and airports. The third subheading involves mining, refuse, and construction sites. These pertain to man-made waste dump sites, construction sites, and extraction activities. The last subheading involves artificial, non-agricultural vegetated areas. These involve sports and leisure facilities, as well as leisure urban parks [50].
The study has also acquired data for annual mean temperatures (°C), annual maximum temperatures (°C), and annual maximum precipitation rates (mm = kg ÷ m2) for each province between 1990 and 2019 through official correspondence with the General Directorate of Meteorology (GDM) of Türkiye, the main institution offering data sets for climate change indicators. The data comprise the mean values from all weather stations in each province and are used directly in the analyses.
A data set for extreme weather events was also obtained from the GDM outlining the number and type of each such event. This set was reorganized in terms of the annual total number of extreme weather events per province. Both the literature and the GDM documents define the main extreme weather events as storms, hurricanes, forest fires, floods, and lightning strikes [51,52,53].
This study also analyzes droughts for each province between 1990 and 2019 using precipitation data, namely the standardized precipitation index (SPI) developed by McKee et al. [54], which is one of the accepted indices for drought analysis [55]. This index uses the total monthly precipitation data for the past 30 years [54,56,57]. The SPI can be calculated using monthly data in 3-, 6-, 12-, 24-, or 48-month periods [54]; these different periods are related to how the length of a drought is able to decrease precipitation. A 1–3-month drought period [short-term] is referred to as meteorological, a 6-month drought period is called agricultural, and a drought lasting more than 6 months (long-term) is called hydrological [58,59]. The analysis results show the dry months and their severity, with Table 1 providing the drought classification according to the SPI results.
Various software is available for performing drought analysis using the SPI, including the meteorological droughts monitoring (MDM) software developed by Salehina et al. [57]. The study used MDM as it allows drought analyses for different periods.
The study’s SPI analysis was made in 6-month periods, for which the SPI values from each province were calculated over 30 years (1990–2019). Months with SPI values below −0.50 (see Table 1) were classified as dry months, and the number of dry months over the given period was calculated for each province.
A two-stage analysis was performed using these data sets. First, changes in both the built environment and climate indicators were compared by means of maps made based on geographic information systems (GIS). Changes in the built environment were analyzed by comparing 1990 and 2018. Changes in climate indicators were analyzed according to the averages for two years of data to provide more balance. Accordingly, the averages for 1990 and 1991 and for 2018 and 2019 were compared in order to analyze the changes in climate indicators.
The second stage comprised an examination of whether changes in the built environment had had a significant effect on the climate change indicators using linear regression analysis, a parametric test method that calculates the effect of the independent variable on the dependent variable [60]. This analysis was performed using IBM’s Statistical Package for the Social Sciences (SPSS). Analyzing the scatter and residual diagrams is important for choosing between a linear or non-linear regression analysis. Diagrams that show a linear trend mean that linear regression should be selected, while diagrams that reveal a curved pattern indicate that non-linear regression should be selected [61,62]. These diagrams were analyzed using SPSS for each dependent and independent variable. The diagrams showed linear trends, thus linear regression was selected for the analysis. In addition to the linearity of the data, the data were also seen to be continuous, normally distributed, and homoscedastic and thus match the assumptions of linear regression [62,63,64].
The analysis of the effect of the built environment on climate change indicators was conducted by calculating the regression between the changes in the built environment (1990–2018) and those in the climate indicators (i.e., the difference between the averages for 2018 and 2019 and the averages for 1990 and 1991). Furthermore, this comparison was made on subperiods according to CORINE data: 1990–2000; 2000–2012; and 2012–2018.
For the regression analyses, the initial factor analysis was performed to reduce the number of climate change indicators; however, the result of this analysis was not statistically significant. Therefore, the regressions between the built environment and climate change were performed for each climate change indicator separately (Figure 1).
In order to perform a regression analysis, the data sets need to be normally distributed [60]. Accordingly, the distribution of the datasets was analyzed and the outliers were excluded in order to obtain a normal distribution for each set. Lastly, the regression analysis was performed to determine whether the built environment has had a significant effect on climate change.

3. Results

The findings of the research are outlined in two parts: The first comprises an examination using maps of the changes in the built environment and climate change indicators for all provinces in Türkiye. The second uses regression analysis to determine whether the built environment has had a significant effect on climate change in the provinces of Türkiye.
The built environment across all provinces was revealed to have increased over the 30 years from 1990 to 2019. This rise was greater in the highly populated provinces located in the west and the relatively less populated provinces in the north and east. Highly populated provinces such as İstanbul (province code [PC] 34), Ankara (PC 6), İzmir (PC 35), Bursa (PC 16), and Antalya (PC 7) saw the greatest increases in their built environments, almost five times greater than the general average. Along with Konya (PC 42), these provinces had the most built environments in 2018. In addition, Van (PC 65), Diyarbakır (PC 21), and Şanlıurfa (PC 63) are highly populated provinces in the east where the built environment increased more than the average of other eastern provinces (Figure 2).
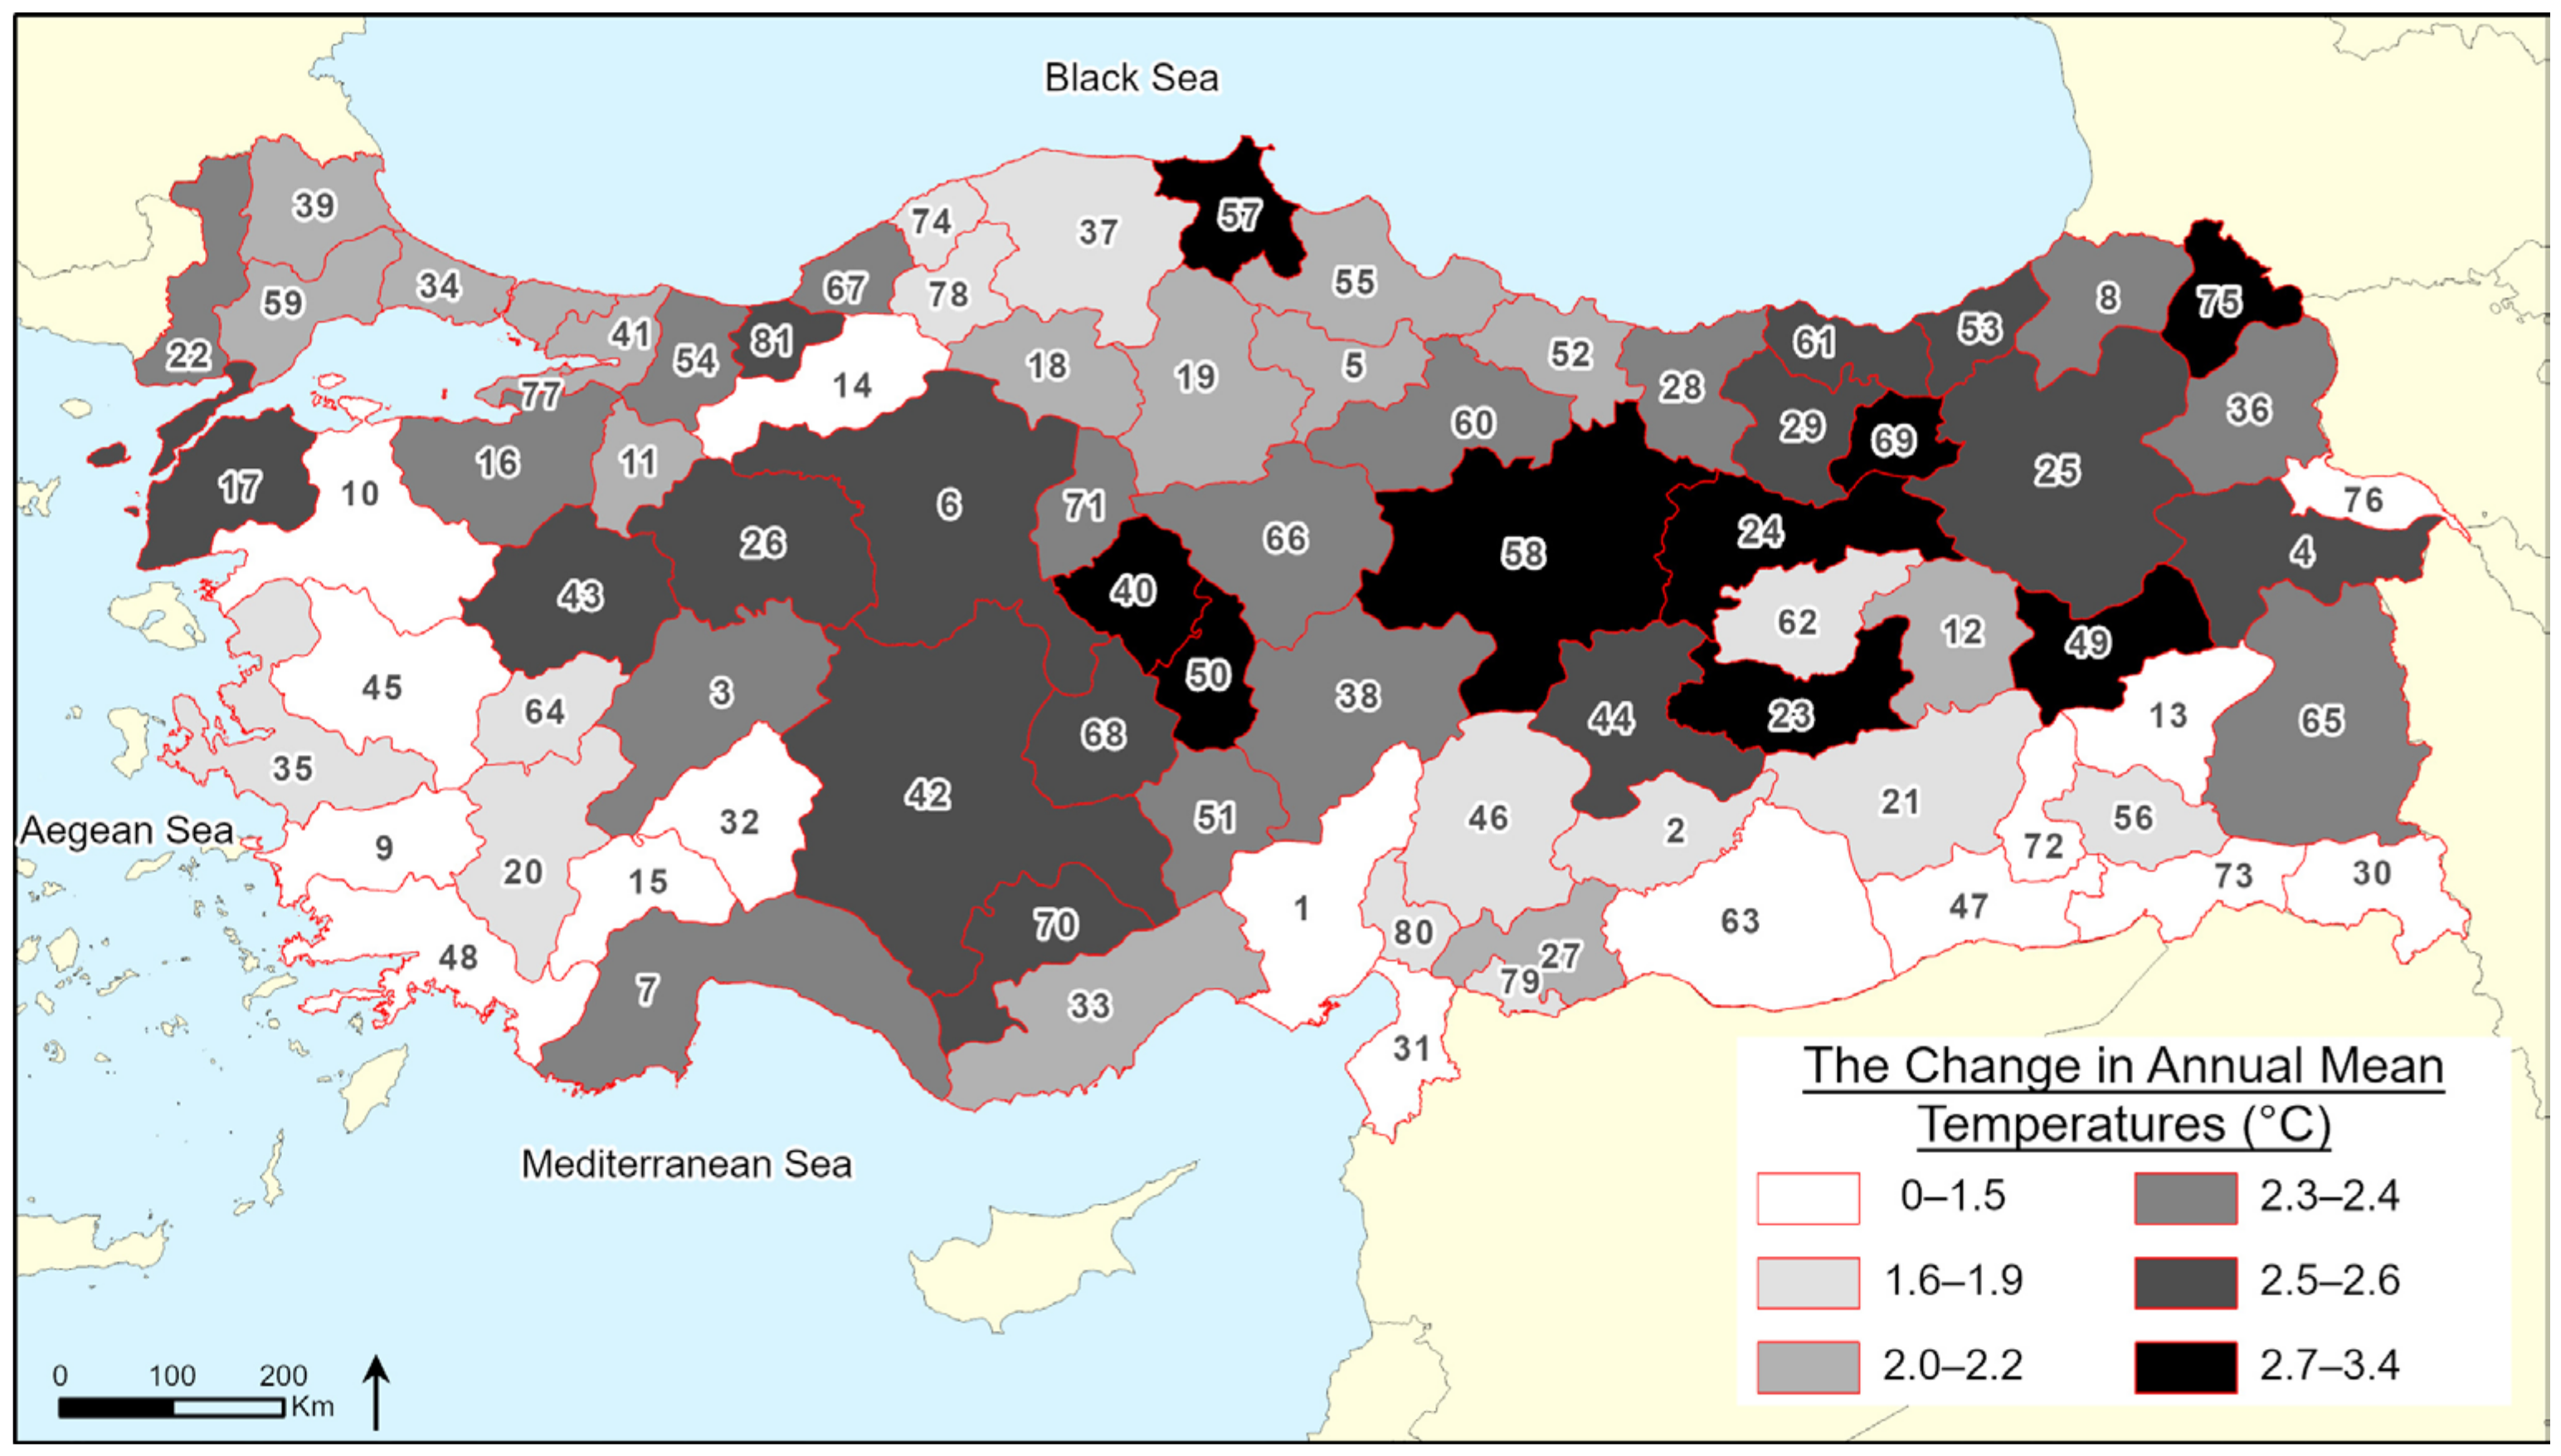
All provinces saw an increase in annual mean temperature, one of the main indicators of climate change; over 30 years, the annual mean temperature has increased by 2 °C across the country. The lowest rise in average temperature was seen in the western and southeastern parts of the country. The provinces in these regions already experienced the highest temperatures in the country in both 1990 and 2019; while their mean temperatures experienced the lowest increase (less than 1.5 °C) to 14.8 °C in 1990–1991, this was 2.4 °C higher than any other province. In 2018–2019, the mean temperature for these provinces was 15.8 °C, only 1.2 °C higher than the rest. Thus, the annual mean temperature increases in provinces with already high mean temperatures clearly was low. The annual temperature in provinces along the line from northeastern Türkiye to the center saw the highest rises in mean temperature (Figure 3).
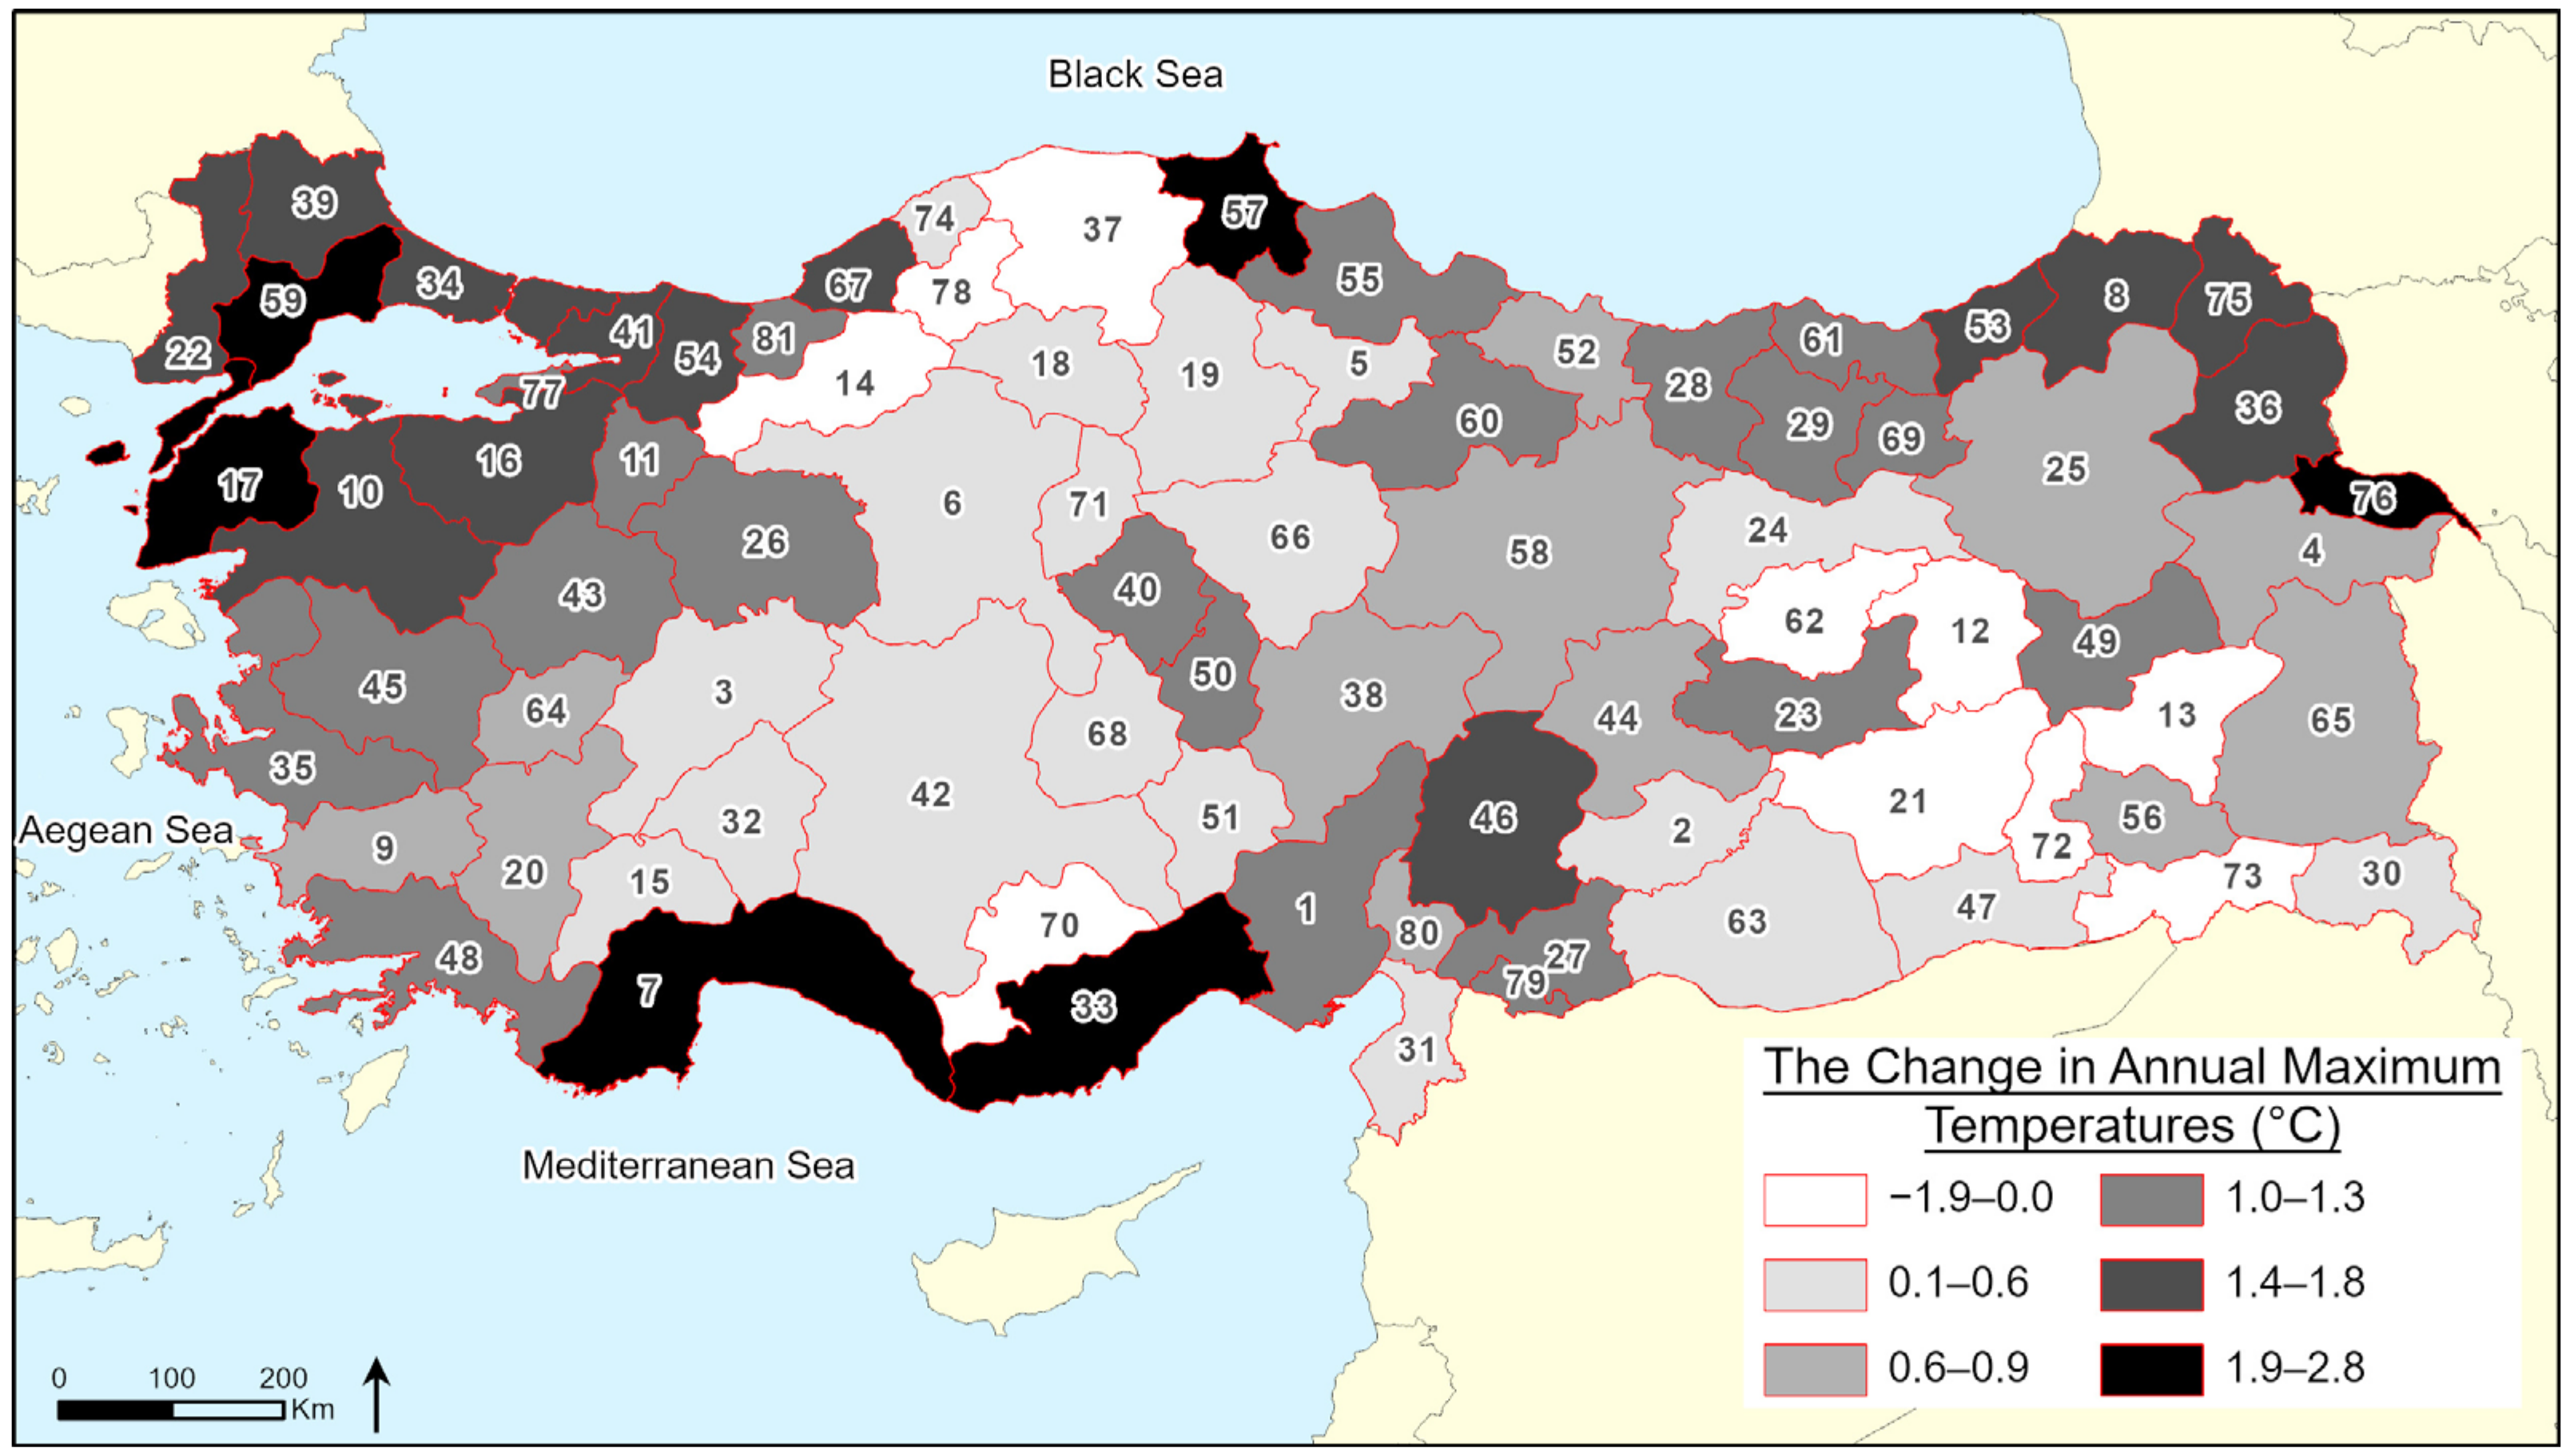
The annual maximum temperature increased in all but nine provinces, rising 0.8 °C overall across the country. Unlike the mean temperature rise, the increase in maximum temperature was higher in the provinces located along the coastline of the Aegean and Mediterranean Seas (Figure 4); thus, these regions appear to be more closely related to this increase in the built environment (Figure 2).
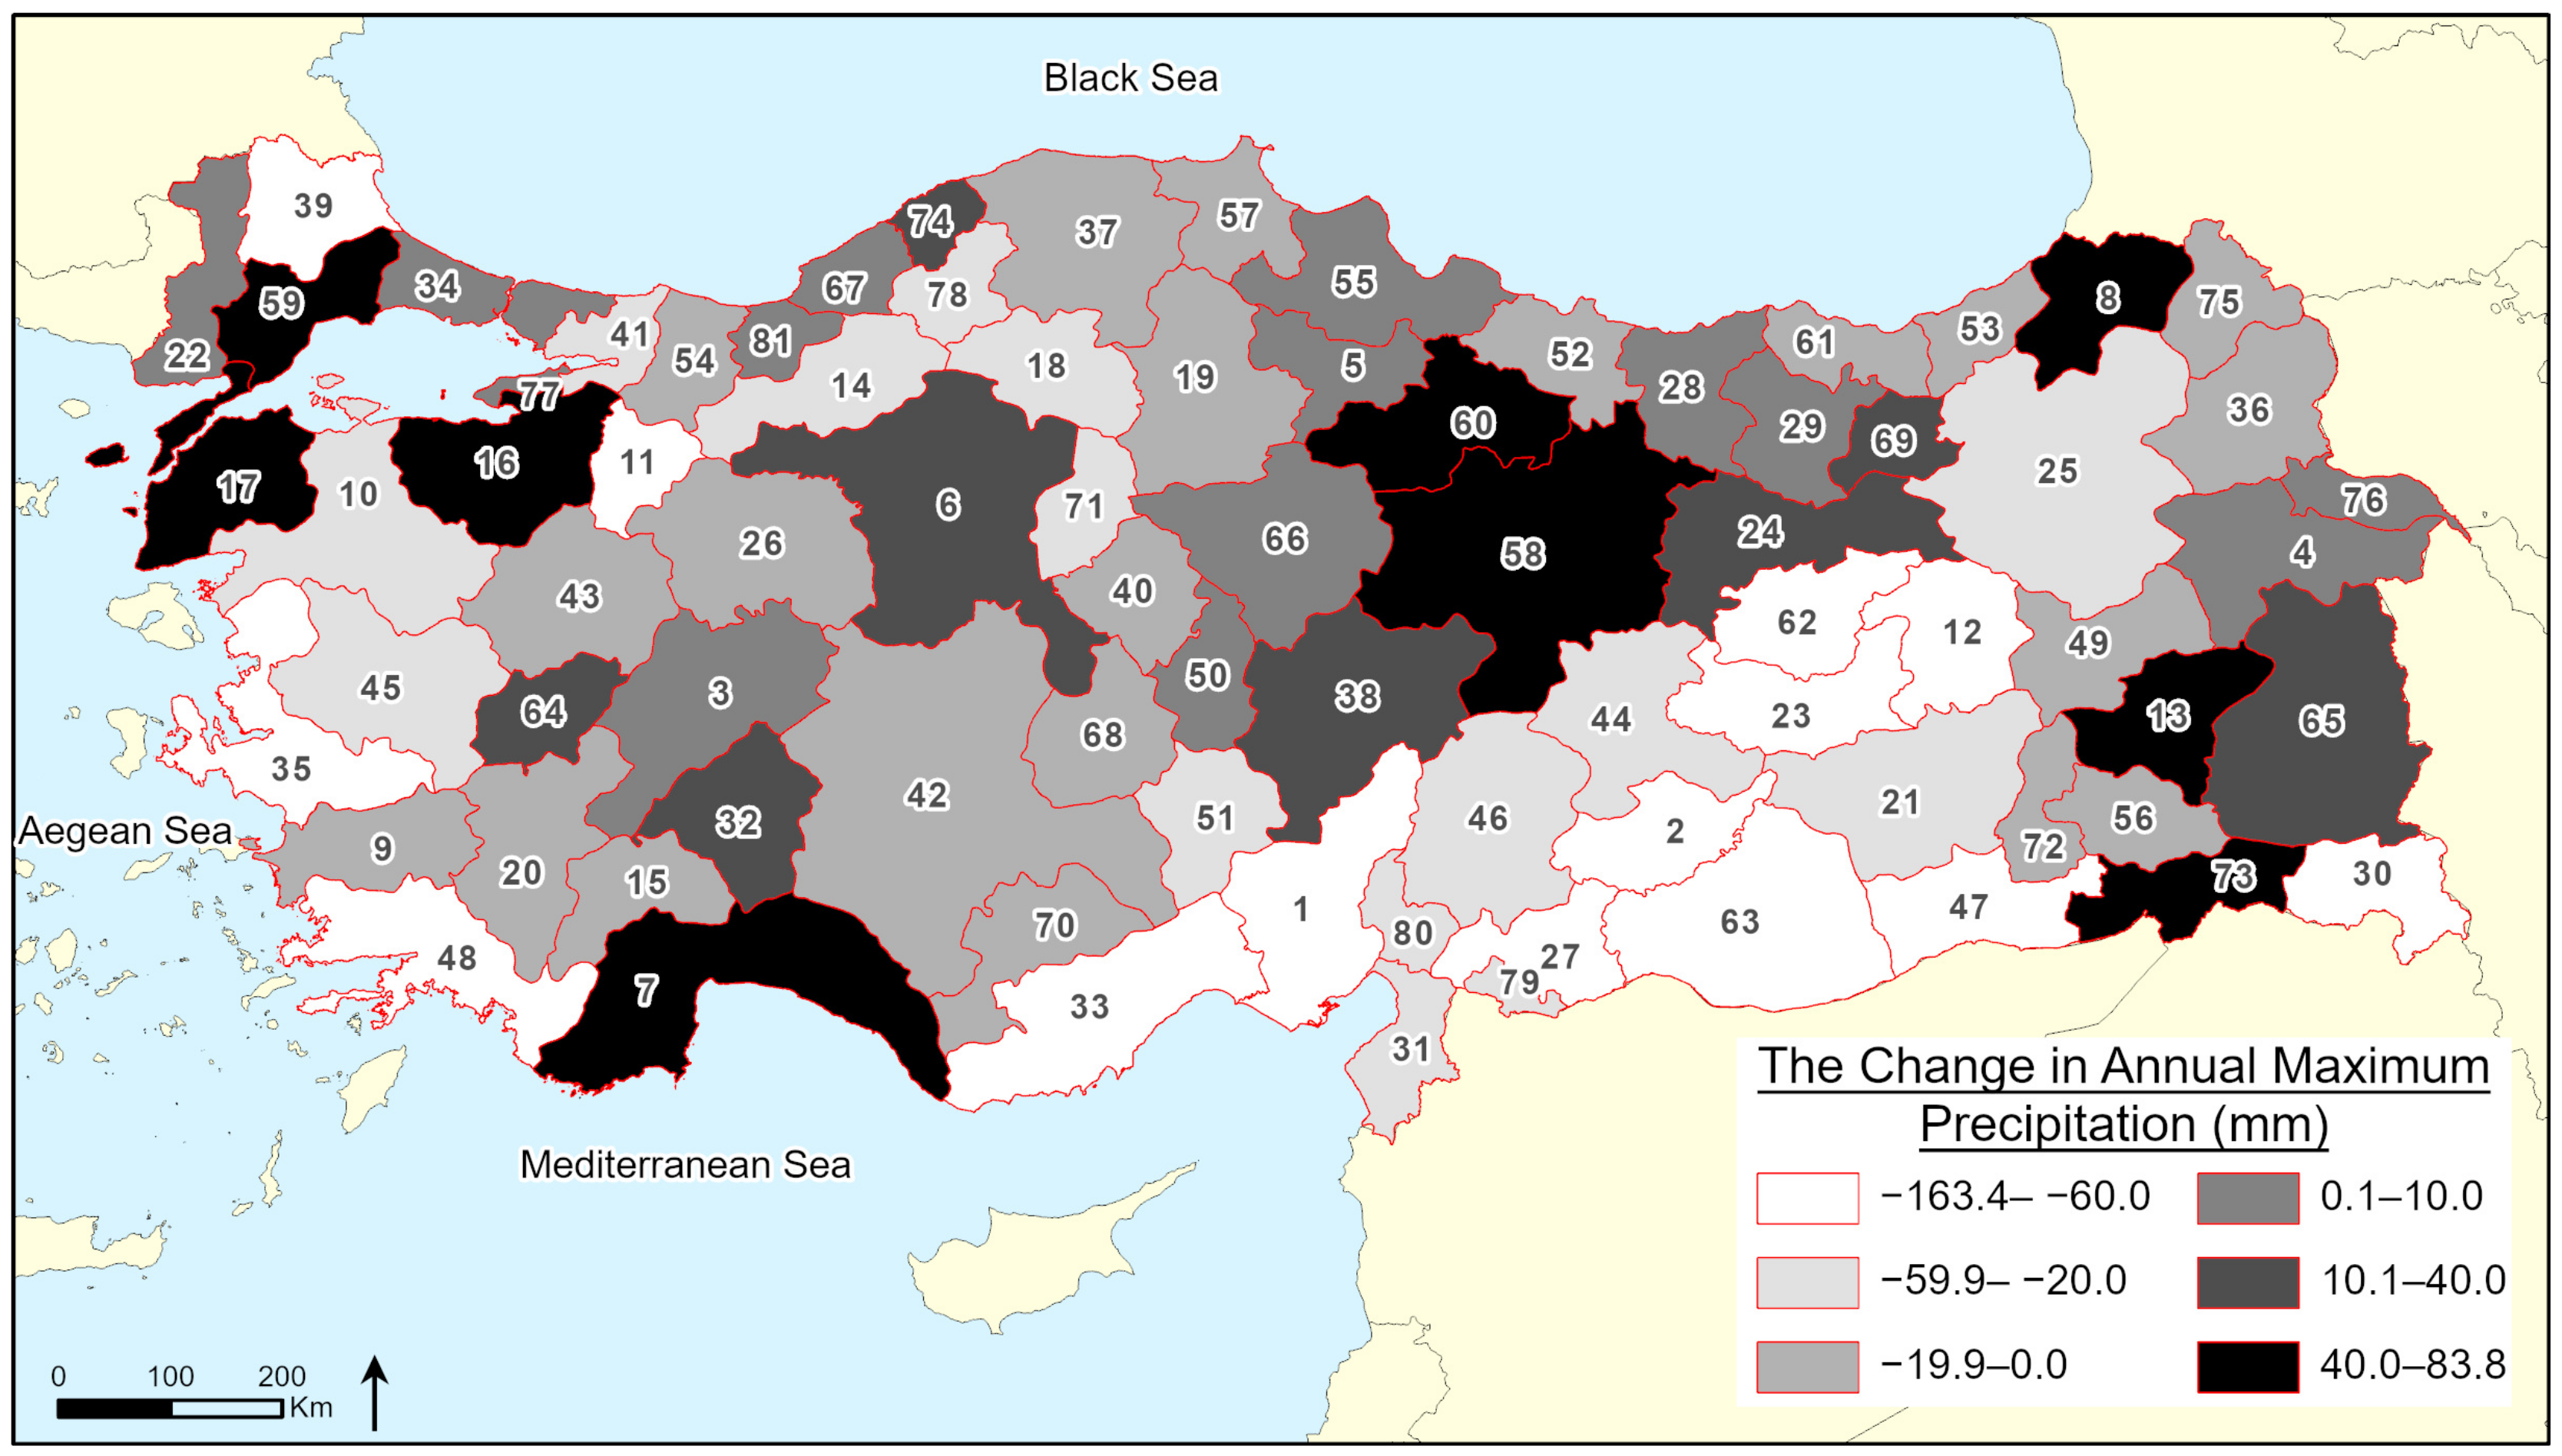
The increase in annual maximum precipitation due to changes in the precipitation regime is another important indicator of climate change. However, annual maximum precipitation fell in 51 of Türkiye’s 81 provinces over the analyzed period, but this particular shift varied for different ranges, as happened with other climate indicators. For example, between 1990 and 2000, annual maximum precipitation increased in 60 provinces, while between 1990 and 2019, the annual maximum precipitation rose in the southeastern and central provinces (Figure 5).
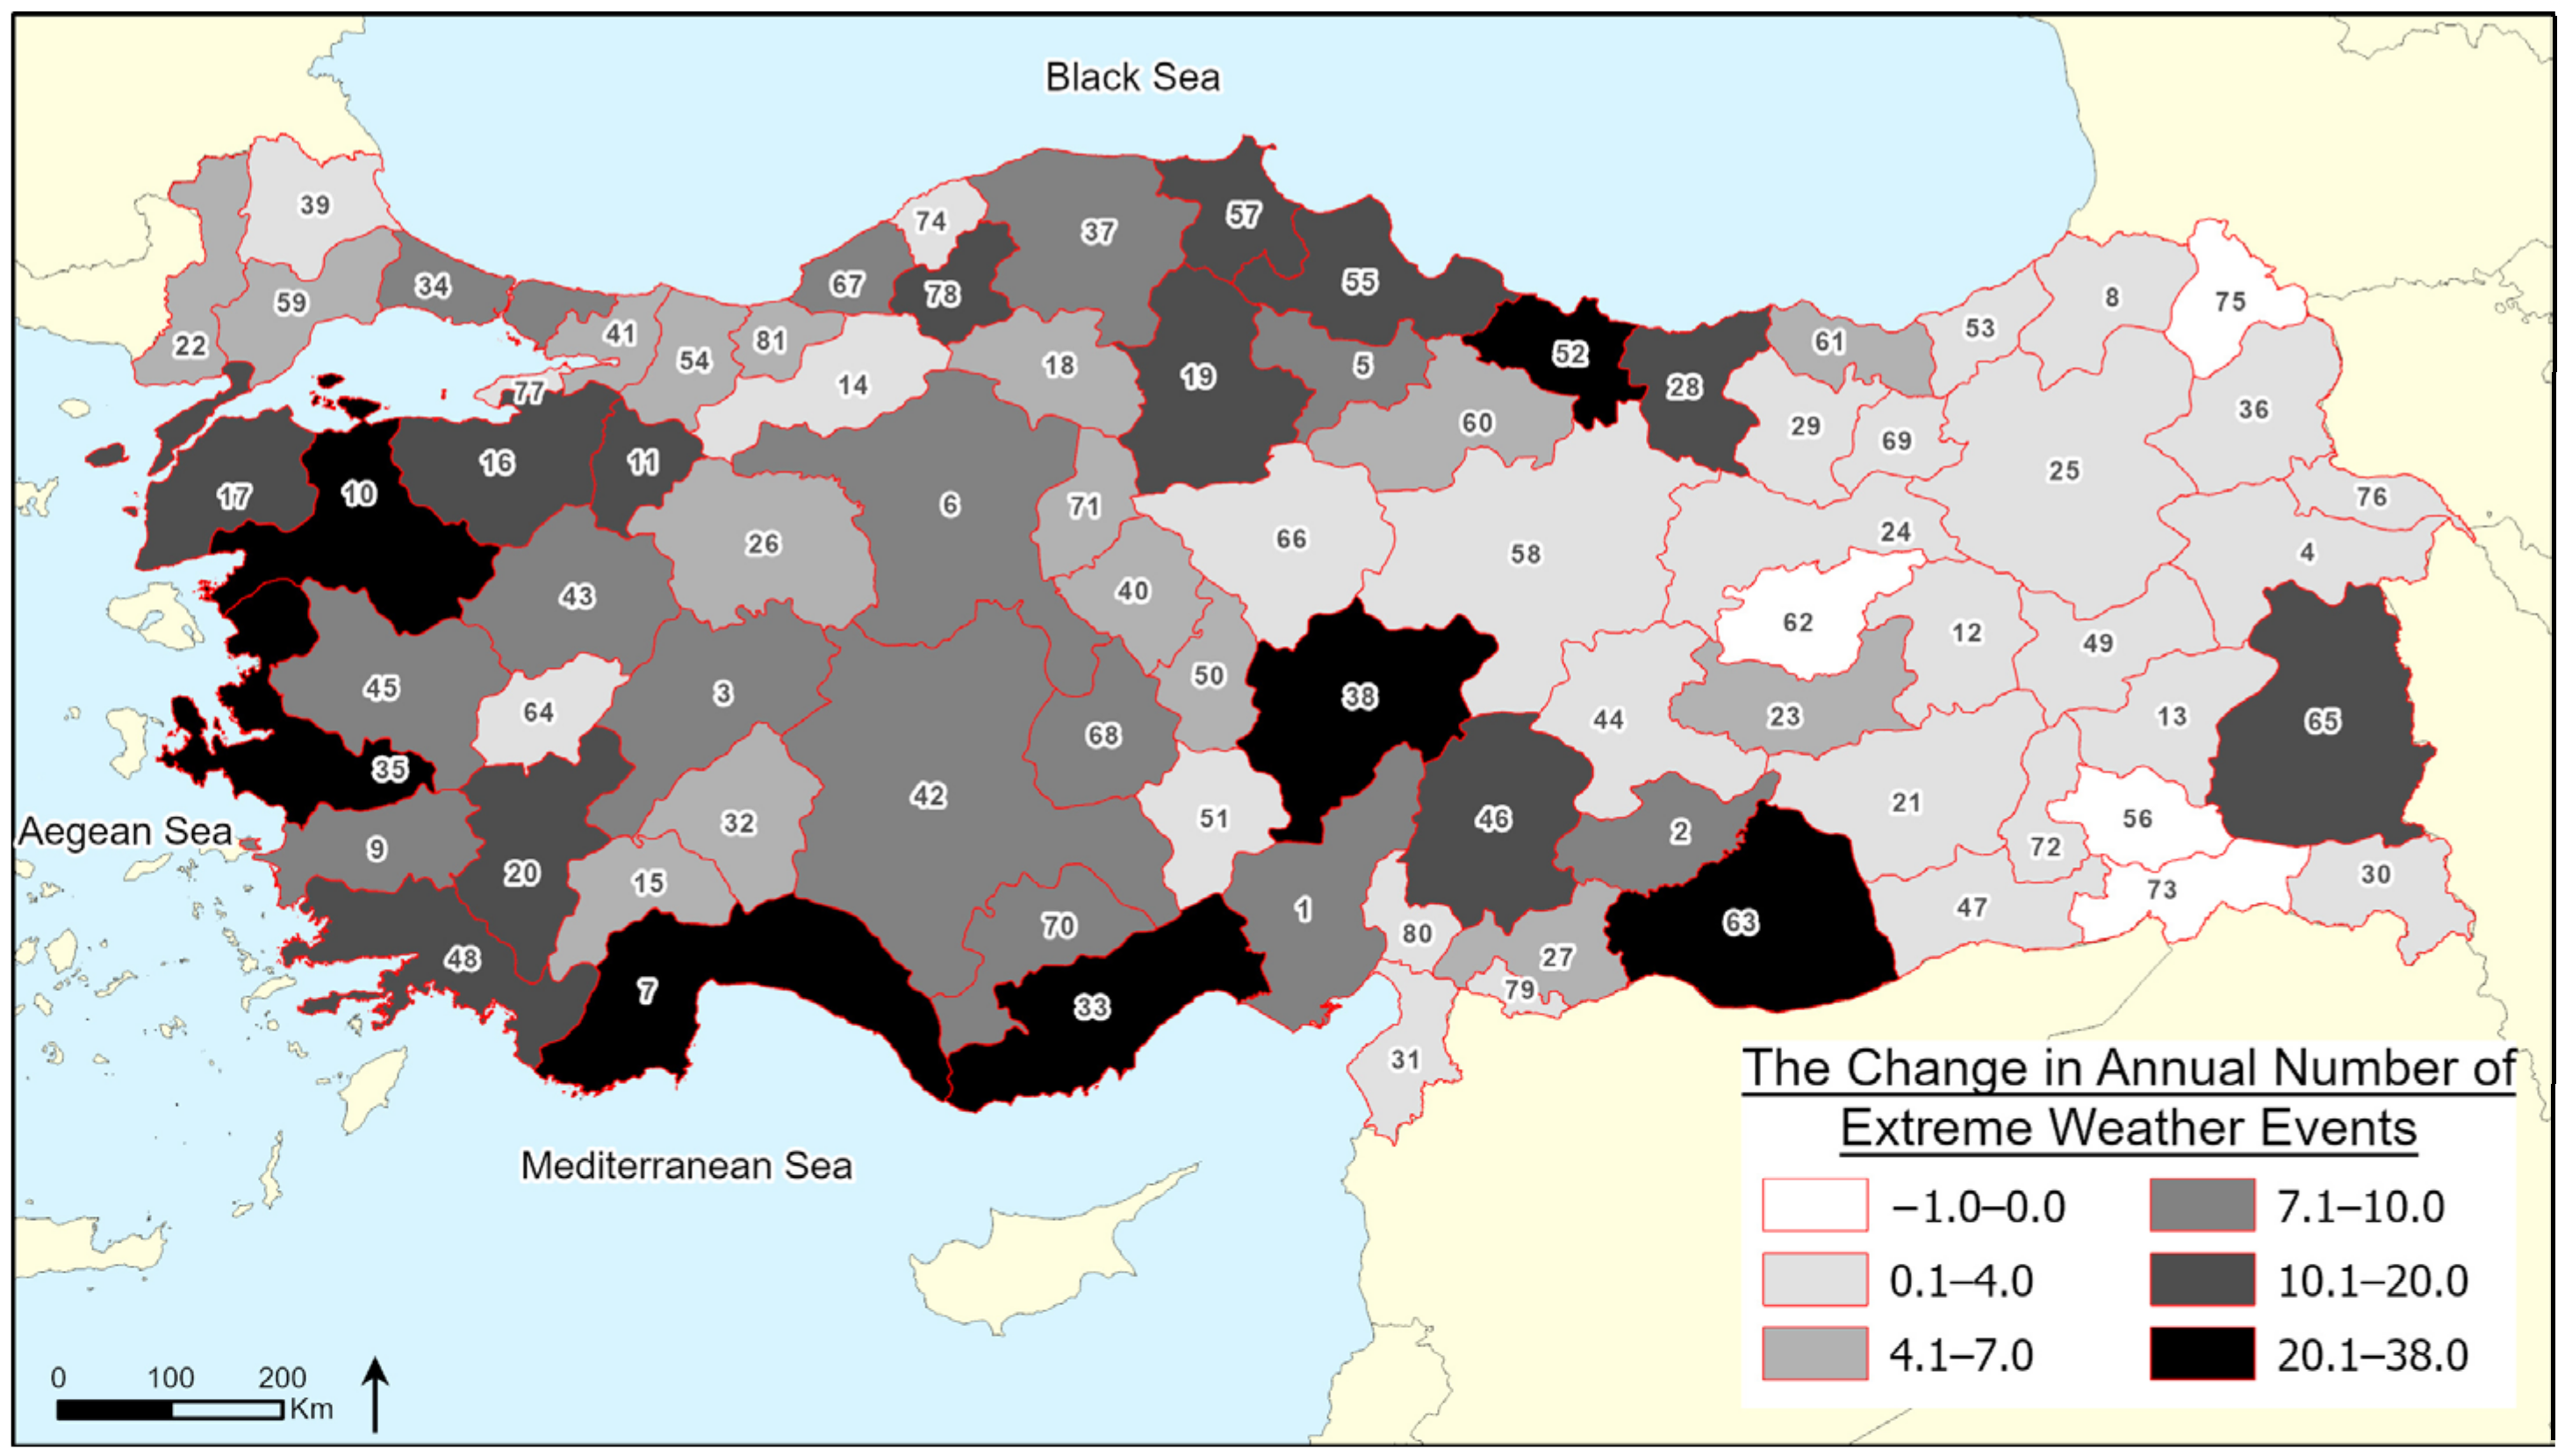
The annual number of extreme weather events is seen to have increased in each province except Şırnak (PC 73), Siirt (PC 56), Tunceli (PC 62), and Bitlis (PC 13), with provinces located along coastlines seeing the highest rates of increase. When evaluated together, the rise in the number of extreme weather events and the increase in the built environment appear to align closely in the southern and western provinces. Moreover, both the built environment and the number of extreme weather events increased at a relatively lower rate in the eastern provinces (Figure 6). The change in the built environment and number of extreme events have a similar distribution across the country, and this supports the findings in the literature [36,37,38,39,51,52,53,65].
The number of dry months per year rose in 39 of the 81 provinces, indicating no general increase in the number of dry months across the country. The map of the change in the number of dry months appears to be inversely correlated to that of the change in the number of extreme weather events. Meanwhile, the increase in the number of extreme weather events was high in the west, the east, and, especially, the northeast, which saw the highest rise in the number of dry months. As in the case of maximum precipitation, the change in the number of dry months varied according to period range. For example, the number of dry months per year between 1990 and 2000 increased in 66 provinces (Figure 7).
The changes in the indicators vary with respect to the subperiods. The average amount of built environment increased 27% between 1990 and 2000, 20% between 2000 and 2012, and 7% between 2012 and 2018. For weather events, the average number of weather events per province increased from 0.3 to 1.1 between 1990 and 2000, from 1.1 to 3.5 between 2000 and 2012, and from 3.5 to 8 between 2012 and 2018. These two indicators are shown to have experienced the same patterns in these subperiods.
The average annual mean temperature in all provinces increased from 12.9 to 13.1 °C between 1990 and 2000, from 13.1 to 13.8 °C between 2000 and 2012, and from 13.8 to 15.1 °C between 2012 and 2018. The average maximum temperature in all provinces increased from 24.6 to 26.5 °C between 1990 and 2000, from 26.5 to 26.2 °C between 2000 and 2012, and from 26.2 to 25.8 °C between 2012 and 2018. The average annual maximum precipitation increased from 125.6 to 133.2 mm between 1990 and 2000, from 133.2 to 165.4 mm between 2000 and 2012, and from 165.4 to 157.7 mm between 2012 and 2018. The average number of dry months per year increased from 3.4 to 5 between 1990 and 2000, decreased from 5 to 3 between 2000 and 2012, and increased from 3 to 3.8 between 2012 and 2018.
After analyzing the change in both the built environment and climate change indicators, an examination was undertaken of whether the built environment had had a significant effect on climate change in the provinces of Türkiye.
According to the results from the regression analysis regarding the changes in the built environment between 1990 and 2018 and the changes in climate indicators between the first period (1990–1991) and the last period (2018–2019), the increase in the built environment is shown to have had a statistically significant effect on the increase in the annual number of extreme weather events (regression coefficient R2 = 0.158). As shown in Figure 1 and Figure 5, the annual number of extreme weather events generally rose in provinces where the built environment had also increased. Almost 40% of extreme weather events between 1990 and 2019 were related to floods, leading to the conclusion that increases in the built environment had been a significant factor in transforming extreme precipitation into floods. This finding supports the literature that has connected the effects of the built environment to extreme weather events [36,37,38,39,51,52,53,65].
Moreover, the regression analysis indicated increases in the built environment to have had a significant, albeit low, effect on increases in the annual maximum temperature (R2 = 0.063), with the increase in the built environment explaining 7% of the increase in annual maximum temperature (see Table 2). This finding is similar to what the research of Oke [66], Hale et al. [67], and Stone [46] found.
This study did not find increases in the built environment to have had a significant effect on mean temperature, maximum precipitation, or drought. This result might differ from those in the literature due to the current study’s focus on the built environment in both urban and rural areas, as the related studies in the literature generally focused on urban areas.

4. Conclusions

This study used a linear regression analysis to examine the impact of the built environment on climate change in an attempt to contribute to the literature by jointly analyzing built environments at the urban and provincial levels.
The study evaluated results in terms of the research questions and objectives. Over the past 30 years, all Turkish provinces are seen to have experienced an increase in their built environment. At the same time, all provinces experienced an increase in average annual temperatures, and all but a few provinces experienced an increase in annual maximum temperature and the number of extreme weather events. In addition, both the annual maximum precipitation level and number of dry months per year are seen to have increased overall throughout the provinces in general. However, these rates have fluctuated over the past 30 years. Climate change has affected all Turkish provinces, but each province has been affected differently. The annual mean temperature and annual maximum precipitation level per province increased more rapidly in central Türkiye, while the annual maximum temperature increased more rapidly along the coastal regions. The study has also found the geographic distributions regarding the increase in the number of dry months per year and the number of extreme weather events per year to be inversely related.
The impacts from climate change are seen to involve extreme weather events in Türkiye’s western provinces, while these impacts are particularly pronounced in the form of droughts in northeastern Türkiye.
The regression analysis showed the increase in the built environment to have had significant impacts on both the number of extreme weather events and the maximum annual temperature. However, no significant results were found from the analyses for annual mean temperature, maximum annual precipitation, or number of dry months per year. This result must be relevant to the analysis being conducted over built environments at the combined urban and provincial levels. Therefore, further studies should conduct separate regression analyses for urban and rural areas on the built environment and climate change indicators.
Türkiye has signed various agreements and established national and regional strategies to combat climate change. The recently signed Paris Agreement has brought about important commitments on local climate change and adaptation plans. These commitments are still in development and represent important steps for adapting to climate change in line with international agreements such as this. However, in order to realize these strategies, a cause-and-effect analysis of climate change needs to be done at the provincial level. In addition, having states identify and apply ideal strategies is also important. These results can also be used as tools for defining mitigation strategies by guiding urban development. Similar to the studies that have focused on urban areas, the current study has also shown the impacts of climate change to differ in urban and rural areas. Considering these differences should therefore help identify climate strategies. However, although this study focused on the built environment, many other indicators exist that also influence climate change, as shown by many studies in the literature. Lastly, analyzing the impact of other indicators is thus also recommended.

Author Contributions

Conceptualization, Y.B. and A.S.; methodology, Y.B. and A.S.; software, Y.B. and A.S.; validation, Y.B. and A.S.; formal analysis, Y.B. and A.S.; investigation, Y.B. and A.S.; resources, Y.B. and A.S.; data curation, Y.B. and A.S.; writing—original draft preparation, Y.B. and A.S.; writing—review and editing, Y.B. and A.S.; visualization, Y.B. and A.S.; project administration, Y.B. and A.S.; funding acquisition, Y.B. and A.S. All authors have read and agreed to the published version of the manuscript.

Funding

This research received no external funding.

Institutional Review Board Statement

Not applicable.

Informed Consent Statement

Not applicable.

Data Availability Statement

Not applicable.

Conflicts of Interest

The authors declare no conflict of interest.

References

  1. Dale, V.H. The relationship between land-use change and climate change. Ecol. Appl. 1997, 7, 753–769. [Google Scholar] [CrossRef]
  2. Wilby, R.L. A review of climate change impacts on the built environment. Built Environ. 2007, 33, 31–45. [Google Scholar] [CrossRef] [Green Version]
  3. Zhang, P.; Li, Y.; Jing, W.; Yang, D.; Zhang, Y.; Liu, Y.; Geng, W.; Rong, T.; Shao, J.; Yang, J.; et al. Comprehensive assessment of the effect of urban built-up land expansion and climate change on net primary productivity. Complexity 2020, 2020, 8489025. [Google Scholar] [CrossRef]
  4. T.R. The Ministry of Environment, Urbanization and Climate Change, Directorate of Environmental Impact Assessment, Permit and Inspection, Çevresel Göstergeler. (Yayın No. 49-1). 2020. Available online: https://ced.csb.gov.tr/cevresel-gostergeler-kitapcigi-i-82681 (accessed on 27 May 2021).
  5. Resilience Alliance. Urban Resilience Research Prospectus. Resource Document. Resilience Alliance. 2007. Available online: http://www.resalliance.org/1610.php (accessed on 1 January 2021).
  6. Pielke, R.A.; Marland, G.; Betts, R.A.; Chase, T.N.; Eastman, J.L.; Niles, J.O.; Niyogi D dutta, S.; Running, S.W. The influence of land-use change and landscape dynamics on the climate system: Relevance to climate-change policy beyond the radiative effect of greenhouse gases. Philos. Trans. R. Soc. London. Ser. A Math. Phys. Eng. Sci. 2002, 360, 1705–1719. [Google Scholar] [CrossRef] [PubMed]
  7. Mendelsohn, R.; Dinar, A. Land use and climate change interactions. Annu. Rev. Resour. Econ. 2009, 1, 309–332. [Google Scholar] [CrossRef]
  8. Şen, Z. İklim Değişikliği Tatlı Su Kaynakları ve Türkiye (Climate Change, Fresh Water Resources and Türkiye); Su Vakfı: Istanbul, Turkiye, 2009. (In Turkish) [Google Scholar]
  9. House-Peters, L.A.; Chang, H. Modeling the impact of land use and climate change on neighborhood-scale evaporation and nighttime cooling: A surface energy balance approach. Landsc. Urban Plan. 2011, 103, 139–155. [Google Scholar] [CrossRef]
  10. Kaplan, J.O.; Krumhardt, K.M.; Zimmermann, N.E. The effects of land use and climate change on the carbon cycle of Europe over the past 500 years. Glob. Change Biol. 2012, 18, 902–914. [Google Scholar] [CrossRef]
  11. Tran, D.X.; Pla, F.; Latorre-Carmona, P.; Myint, S.W.; Caetano, M.; Kieu, H.V. Characterizing the relationship between land use land cover change and land surface temperature. ISPRS J. Photogramm. Remote Sens. 2017, 124, 119–132. [Google Scholar] [CrossRef] [Green Version]
  12. Doelman, J.C.; Stehfest, E.; Tabeau, A.; van Meijl, H.; Lassaletta, L.; Gernaat, D.E.H.J.; Hermans, K.; Harmsen, M.; Daioglou, V.; Biemans, H.; et al. Exploring SSP land-use dynamics using the IMAGE model: Regional and gridded scenarios of land-use change and land-based climate change mitigation. Glob. Environ. Change 2018, 48, 119–135. [Google Scholar] [CrossRef] [Green Version]
  13. Nobre, C.A.; Sellers, P.J.; Shukla, J. Amazonian deforestation and regional climate change. J. Clim. 1991, 4, 957. [Google Scholar] [CrossRef]
  14. Dickinson, R.E.; Kennedy, P. Impacts on regional climate of Amazon deforestation. Geophys. Res. Lett. 1992, 19, 1947–1950. [Google Scholar] [CrossRef] [Green Version]
  15. Costa, M.H.; Foley, J.A. Combined effects of deforestation and doubled atmospheric co2 concentrations on the climate of Amazonia. J. Clim. 2000, 13, 17. [Google Scholar] [CrossRef]
  16. Pielke, R.A. Land use as climate change. Science 2005, 310, 1625–1626. [Google Scholar] [CrossRef] [Green Version]
  17. Satterthwaite, D. The implications of population growth and urbanization for climate change. Environ. Urban. 2009, 21, 545–567. [Google Scholar] [CrossRef] [Green Version]
  18. Rienow, A.; Kantakumar, L.N.; Ghazaryan, G.; Dröge-Rothaar, A.; Sticksel, S.; Trampnau, B.; Thonfeld, F. Modelling the spatial impact of regional planning and climate change prevention strategies on land consumption in the Rhine-Ruhr Metropolitan Area 2017–2030. Landsc. Urban Plan. 2022, 217, 104284. [Google Scholar] [CrossRef]
  19. Pitman, A.J.; de Noblet-Ducoudré, N.; Cruz, F.T.; Davin, E.L.; Bonan, G.B.; Brovkin, V.; Claussen, M.; Delire, C.; Ganzeveld, L.; Gayler, V.; et al. Uncertainties in climate responses to past land cover change: First results from the LUCID intercomparison study. Geophys. Res. Lett. 2009, 36, L14814. [Google Scholar] [CrossRef] [Green Version]
  20. Ehrlich, D.; Kemper, T.; Pesaresi, M.; Corbane, C. Built-up area and population density: Two Essential Societal Variables to address climate hazard impact. Environ. Sci. Policy 2018, 90, 73–82. [Google Scholar] [CrossRef]
  21. Verdonck, M.-L.; Demuzere, M.; Hooyberghs, H.; Beck, C.; Cyrys, J.; Schneider, A.; Dewulf, R.; Van Coillie, F. The potential of local climate zones maps as a heat stress assessment tool, supported by simulated air temperature data. Landsc. Urban Plan. 2018, 178, 183–197. [Google Scholar] [CrossRef]
  22. EPA-Environment Protection Agency. Climate Change Indicators in The United States (Fourth Edition). 2016. Available online: https://www.epa.gov/sites/default/files/2021-02/documents/climate_indicators_2016.pdf (accessed on 1 July 2021).
  23. Rovers, V.; Bosch, P.; Albers, R. Final Report Climate Proof Cities 2010–2014. 2014. Available online: https://klimaatadaptatienederland.nl/en/themes-sectors/themes/climate-change/ (accessed on 23 May 2021).
  24. EEA-European Environment Agency. Europe’s Changing Climate Hazards-An Index-Based Interactive EEA Report. 2021. Available online: https://www.eea.europa.eu/downloads/163297bf75d54a45a1dcbe5d8ce1d9fe/1637331959/climate-hazards-indices.pdf (accessed on 23 May 2021).
  25. THCA (Turkish Healthy Cities Association). COP24 Special Report, Sağlık ve İklim Değişikliği. 2020. Available online: https://apps.who.int/iris/bitstream/handle/10665/276405/9786057496713-tur.pdf (accessed on 27 May 2021).
  26. NAS (National Adaptation Strategy). National Climate Adaptation Strategy. 2016. Available online: https://nas-adaptatietool.nl/ (accessed on 27 May 2021).
  27. EEA-European Environment Agency. National and Transnational Climate Atlases in Europe. 2021. Available online: https://www.eea.europa.eu/publications/europes-changing-climate-hazards-1/national-and-transnational-climate-atlases/view (accessed on 27 May 2021).
  28. Brovkin, V.; Boysen, L.; Arora, V.K.; Boisier, J.P.; Cadule, P.; Chini, L.; Claussen, M.; Friedlingstein, P.; Gayler, V.; van den Hurk, B.J.J.M.; et al. Effect of anthropogenic land-use and land-cover changes on climate and land carbon storage in CMIP5 projections for the twenty-first century. J. Clim. 2013, 26, 6859–6881. [Google Scholar] [CrossRef]
  29. Gülbaz, S.; Kaya, Y.E.; Alhan, C.M.K. Düşük etkili kentleşme uygulamalarının yüzeysel akışa etkisi: İstanbul üniversitesi avcılar kampüsü örneği (The Impact of LID Implementation on Surface Runoff: Case Study of Istanbul University, Avcılar Campus). İklim Değişikliği Ve Çevre 2018, 3, 45–50. (In Turkish) [Google Scholar]
  30. Zhao, G.; Gao, H.; Cuo, L. Effects of urbanization and climate change on peak flows over the San Antonio River Basin, Texas. J. Hydrometeorol. 2016, 17, 2371–2389. [Google Scholar] [CrossRef]
  31. Argüeso, D.; Evans, J.P.; Fita, L.; Bormann, K.J. Temperature response to future urbanization and climate change. Clim. Dyn. 2014, 42, 2183–2199. [Google Scholar] [CrossRef]
  32. Chapman, S.; Watson, J.E.M.; Salazar, A.; Thatcher, M.; McAlpine, C.A. The impact of urbanization and climate change on urban temperatures: A systematic review. Landsc. Ecol. 2017, 32, 1921–1935. [Google Scholar] [CrossRef]
  33. Lin, L.; Ge, E.; Liu, X.; Liao, W.; Luo, M. Urbanization effects on heat waves in Fujian Province, Southeast China. Atmos. Res. 2018, 210, 123–132. [Google Scholar] [CrossRef]
  34. Qiu, J.; Yang, X.; Cao, B.; Chen, Z.; Li, Y. Effects of urbanization on regional extreme-temperature changes in China, 1960–2016. Sustainability 2020, 12, 6560. [Google Scholar] [CrossRef]
  35. Orhan, O. Mersin ilindeki kentsel büyümenin yer yüzey sıcaklığı üzerine etkisinin araştırılması (Investigation of the effect of urban expansion on surface temperature in Mersin city). Geomatik 2021, 6, 69–76. (In Turkish) [Google Scholar]
  36. Bradshaw, C.J.A.; Sodhi, N.S.; Peh, K.S.-H.; Brook, B.W. Global evidence that deforestation amplifies flood risk and severity in the developing world. Glob. Change Biol. 2007, 13, 2379–2395. [Google Scholar] [CrossRef]
  37. Chang, H.; Franczyk, J. Climate Change, land-use change, and floods: Toward an integrated assessment: Climate change, land-use change, and floods. Geogr. Compass 2008, 2, 1549–1579. [Google Scholar] [CrossRef]
  38. Zhou, Q.; Leng, G.; Su, J.; Ren, Y. Comparison of urbanization and climate change impacts on urban flood volumes: Importance of urban planning and drainage adaptation. Sci. Total Environ. 2019, 658, 24–33. [Google Scholar] [CrossRef]
  39. Lin, L.; Gao, T.; Luo, M.; Ge, E.; Yang, Y.; Liu, Z.; Zhao, Y.; Ning, G. Contribution of urbanization to the changes in extreme climate events in urban agglomerations across China. Sci. Total Environ. 2020, 744, 140264. [Google Scholar] [CrossRef]
  40. Oruç, S.; Yücel, İ.; Yılmaz, A. İklim Değişikliği, Ekstrem Yağışlar ve Etkileri: Etimesgut, Ankara Örneği (Climate Change, Extreme Rainfall and Its Effects: The Case of Etimesgut, Ankara). In Proceedings of the 10. Ulusal Hidroloji Kongresi, Muğla, Turkiye, 9–12 October 2019. (In Turkish). [Google Scholar]
  41. Kadıoğlu, M. Sellere dirençli kent oluşturmanın adımları (Steps to build a flood resilience city). Şehir ve Toplum 2018, 10, 77–89. (In Turkish) [Google Scholar]
  42. Kazancı, G. İklim Değişikliğine Uyum Kapsamında Akıllı Kentlerin Rolü: Muğla Metropoliten Alanı Üzerine Bir Değerlendirme (The Role of Smart Cities Under the Adaptation into Climate Change: An Evaluation on Mugla Metropolitan Area); Yüksek Lisans Tezi; İstanbul Teknik Üniversitesi: Istanbul, Turkiye, 2019. (In Turkish) [Google Scholar]
  43. Karacan, G. Kentsel Iklim Değişikliği Kapsamında Sera Gazı Azaltım Stratejileri; Ankara Örneği (Greenhouse Gas Reduction Strategies In The Context of Urban Climate Change; Case of Ankara); Yüksek Lisans Tezi; Süleyman Demirel Üniversitesi: Isparta, Turkiye, 2020. (In Turkish) [Google Scholar]
  44. Onur, A.C.; Tezer, A. Ecosystem services based spatial planning decision making for adaptation to climate changes. Habitat Int. 2015, 47, 267–278. [Google Scholar] [CrossRef]
  45. Balaban, O. İklim Değişirken Kent ve Kentleşme (City and Urbanization as the Climate Changes). In Proceedings of the 2023 Türkiye’si Sempozyumu, Ankara, Turkiye, 26–28 April 2018. (In Turkish). [Google Scholar]
  46. Stone, B. Land use as climate change mitigation. Environ. Sci. Technol. 2009, 43, 9052–9056. [Google Scholar] [CrossRef]
  47. Kotharkar, R.; Bagade, A. Evaluating urban heat island in the critical local climate zones of an Indian city. Landsc. Urban Plan. 2018, 169, 92–104. [Google Scholar] [CrossRef]
  48. Tezer, A.; Kazancı, G. İklim değişikliğine uyum konusunda öne çıkan mekânsal planlama kriterleri (Spatial planning criteria for adaptation to climate change). Mimar. Ve Mühendis Derg. 2019, 31, 90–94. (In Turkish) [Google Scholar]
  49. Büttner, G.; Kosztra, B.; Maucha, G.; Pataki, R.; Kleeschulte, S.; Hazeu, G.; Vittek, M.; Schröder, C.; Littkopf, A. Copernicus Land Monitoring Service CORINE Land Cover-User Manual; European Environment Agency: Copenhagen, Denmark, 2021. [Google Scholar]
  50. Kozstra, B.; Büttner, G.; Hazeu, G.; Arnold, S. Updated CLC Illustrated Nomen-Clature Guidelines; European Environment Agency: Copenhagen, Denmark, 2017; pp. 1–124. Available online: https://land.copernicus.eu/user-corner/technical-library/corine-land-cover-nomenclature-guidelines/docs/pdf/CLC2018_Nomenclature_illustrated_guide_20190510.pdf (accessed on 27 May 2021).
  51. Mirza, M.M.Q. Climate change and extreme weather events: Can developing countries adapt? Clim. Policy 2003, 3, 233–248. [Google Scholar] [CrossRef]
  52. Huber, D.G.; Gulledge, J. Extreme Weather and Climate Change: Understanding the Link, Managing the Risk; Pew Center on Global Climate Change: Arlington, TX, USA, 2011. [Google Scholar]
  53. Stott, P. How climate change affects extreme weather events. Science 2016, 352, 1517–1518. [Google Scholar] [CrossRef]
  54. McKee, T.B.; Doesken, N.J.; Kleist, J. The relationship of drought frequency and duration to time scales. In Proceedings of the 8th Conference on Applied Climatology, Anaheim, CA, USA, 17–22 January 1993. [Google Scholar]
  55. European Comission. Standardized Precipitation Index (SPI). European Drought Observatory Indicator Factsheet; European Comission: Brussels, Belgium, 2020. [Google Scholar]
  56. Sonmez, F.K.; Komuscu, A.U.; Erkan, A.; Turgu, E. An analysis of spatial and temporal dimension of drought vulnerability in Turkey using the standardized precipitation index. Nat. Hazards 2005, 35, 243–264. [Google Scholar] [CrossRef]
  57. Salehnia, N.; Alizadeh, A.; Sanaeinejad, H.; Bannayan, M.; Zarrin, A.; Hoogenboom, G. Estimation of meteorological drought indices based on AgMERRA precipitation data and station-observed precipitation data. J. Arid. Land. 2017, 9, 797–809. [Google Scholar] [CrossRef] [Green Version]
  58. WMO—World Meteorological Organization. Standardized Precipitation Index User Guide; (WMO-No. 1090); WMO: Geneva, Switzerland, 2012. [Google Scholar]
  59. Caloiero, T.; Veltri, S.; Caloiero, P.; Frustaci, F. Drought analysis in Europe and in the Mediterranean basin using the standardized precipitation index. Water 2018, 10, 1043. [Google Scholar] [CrossRef] [Green Version]
  60. Kahane, L.H. Regression Basics, 2nd ed.; Sage Publication: London, UK, 2008. [Google Scholar]
  61. Motulsky, H.; Christopoulos, A. Fitting Models to Biological Data Using Linear and Nonlinear Regression: A Practical Guide to Curve Fitting, 1st ed.; Oxford University Press: Oxford, UK, 2014. [Google Scholar]
  62. Montgomery, D.C.; Peck, E.A.; Vining, G.G. Introduction to Linear Regression Analysis; John Wiley & Sons: Hoboken, NJ, USA, 2021. [Google Scholar]
  63. Moore, D.S.; McCabe, G.P.; Craig, B.A. Introduction to the Practice of Statistics, 8th ed; W.H. Freeman and Company: New York, NY, USA, 2014. [Google Scholar]
  64. Casson, R.J.; Farmer, L.D. Understanding and checking the assumptions of linear regression: A primer for medical researchers. Clin. Exp. Ophthalmol. 2014, 42, 590–596. [Google Scholar] [CrossRef] [PubMed]
  65. Li, H.; Zhou, Y.; Wei, Y.D. Institutions, extreme weather, and urbanization in the Greater Mekong Region. Ann. Am. Assoc. Geogr. 2019, 109, 1317–1340. [Google Scholar] [CrossRef]
  66. Oke, T.R. The energetic basis of the urban heat island. Q. J. R. Meteorol. Soc. 1982, 108, 1–24. [Google Scholar] [CrossRef]
  67. Hale, R.C.; Gallo, K.P.; Loveland, T.R. Influences of specific land use/land cover conversions on climatological normals of near-surface temperature. J. Geophys. Res. 2008, 113, D14113. [Google Scholar] [CrossRef]
  68. Rosner, B. Fundamentals of Biostatistics, 8th ed.; Cengage Learning: Boston, MA, USA, 2016. [Google Scholar]
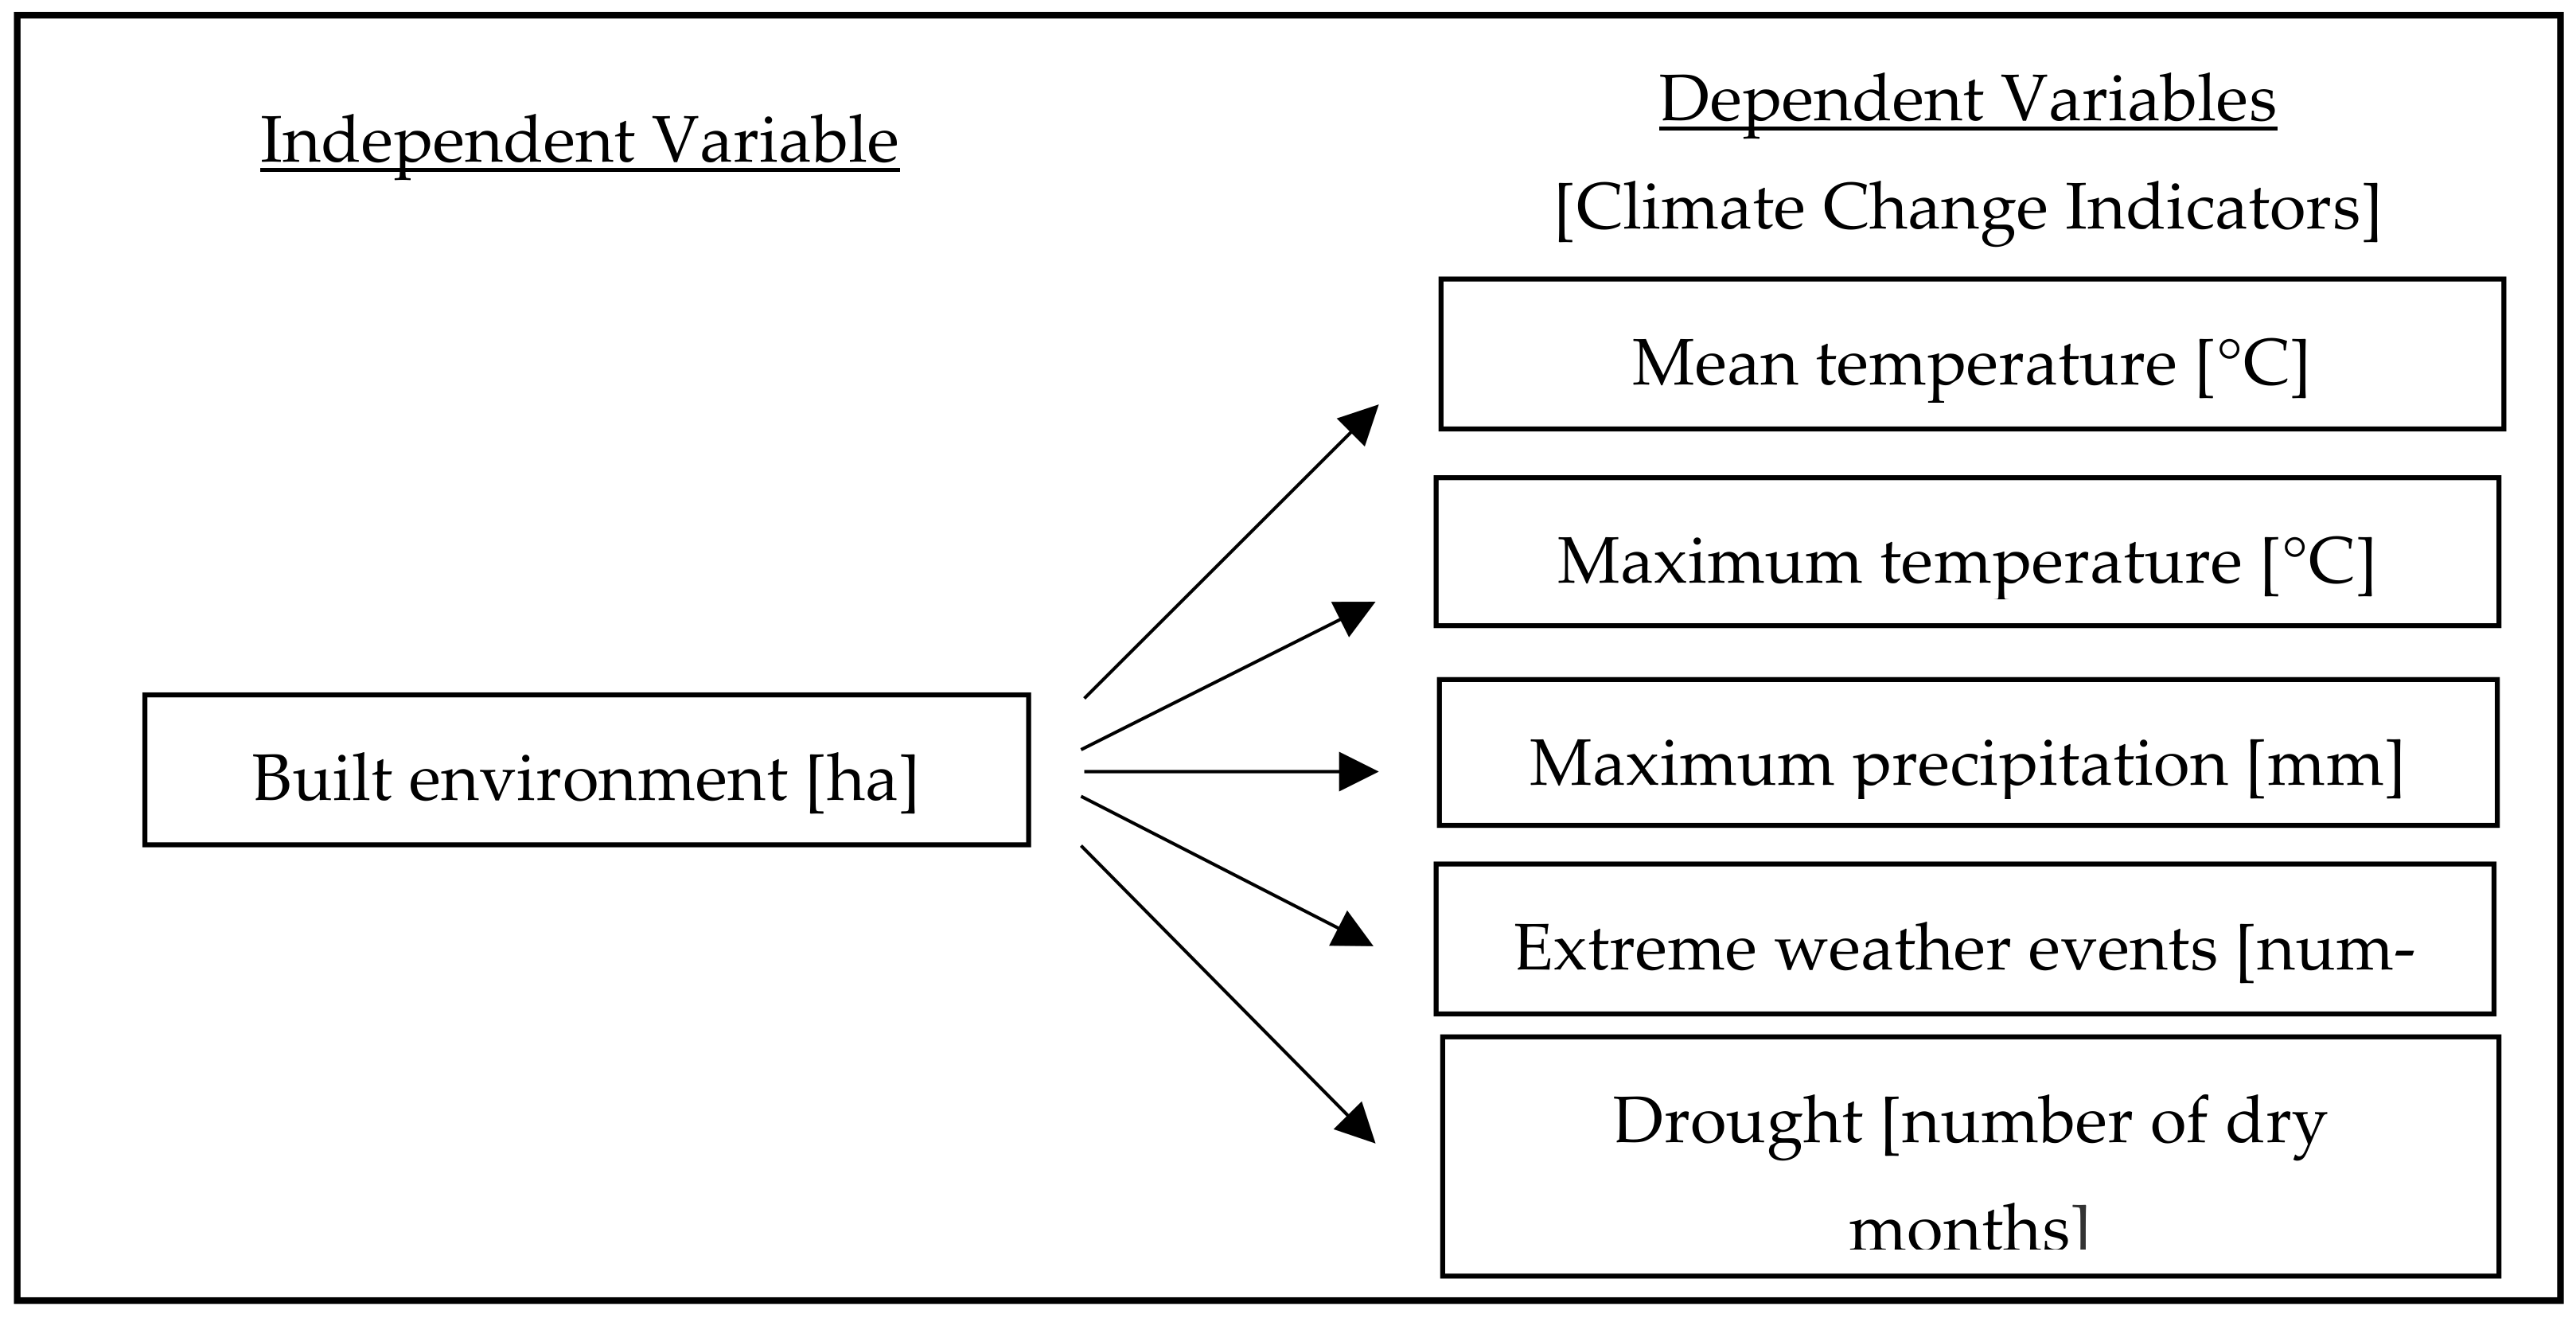
Figure 1. The variables used in regression analyses.
Sustainability 15 01659 g001
Figure 2. Changes in the built environment in 1990–2018 (ha).
Sustainability 15 01659 g002
Figure 3. The change in annual mean temperatures (comparison of the 1990–1991 and 2018–2019 means).
Sustainability 15 01659 g003
Figure 4. The change in annual maximum temperatures (comparison of the 1990–1991 and 2018–2019 mean).
Sustainability 15 01659 g004
Figure 5. The change in annual maximum precipitation (comparison of 1990–1991 mean and 2018–2019 mean).
Sustainability 15 01659 g005
Figure 6. The change in the annual number of extreme weather events (comparison of 1990–1991 mean and 2018–2019 mean).
Sustainability 15 01659 g006
Figure 7. The change in the number of dry months per year (comparison of 1990–1991 mean and 2018–2019 mean).
Sustainability 15 01659 g007
Table 1. Drought classification according to the SPI results.
SPIClassification
2.0 or higherExceptionally moist
1.60 to 1.99Extremely moist
1.30 to 1.59Very moist
0.80 to 1.29Moderately moist
0.51 to 0.79Abnormally moist
0.50 to −0.50Normal
−0.51 to −0.79Abnormally dry
−0.80 to −1.29Moderately dry
−1.30 to −1.59Very dry
−1.60 to −1.99Extremely dry
−2.0 or lowerExceptionally dry
Table 2. The regression results for the built environment (Difference between 1990 and 2018) and climate change indicators (Difference between the 1990–1991 average and the 2018–2019 average).
Dependent Var.Annual Mean TemperatureAnnual Maximum TemperatureAnnual Maximum PrecipitationAnnual Number of Extreme Weather EventsNumber of Dry Months per Year
Independent Var.
Built EnvironmentR2 = 0.009
Sig = 0.420
R2 = 0.063
Sig = 0.029
R2 = 0.008
Sig = 0.435
R2 = 0.158
Sig = 0.000
R2 = 0.023
Sig = 0.196
Notes: Sig = significance and is statistically significant when Sig < 0.05 [63,68].
Disclaimer/Publisher’s Note: The statements, opinions and data contained in all publications are solely those of the individual author(s) and contributor(s) and not of MDPI and/or the editor(s). MDPI and/or the editor(s) disclaim responsibility for any injury to people or property resulting from any ideas, methods, instructions or products referred to in the content.