Article

Mechanism and Empirical Evidence of Green Taxation Influencing Carbon Emissions in China’s Yangtze River Economic Belt

1
School of Economics, Anhui University, Hefei 230601, China
2
Anhui Research Center for Ecology and Economic Development, Hefei 230601, China
3
Department of Economics, West Michigan University, Kalamazoo, MI 49008, USA
4
Department of Economics, Chung Cheng University, Chiayi 621301, Taiwan, China
*
Author to whom correspondence should be addressed.
Sustainability 2023, 15(20), 14983; https://doi.org/10.3390/su152014983
Submission received: 7 September 2023 / Revised: 3 October 2023 / Accepted: 11 October 2023 / Published: 17 October 2023
(This article belongs to the Section Air, Climate Change and Sustainability)

Abstract

:
Based on the panel data of 100 cities in China’s Yangtze River Economic Belt from 2010 to 2020 and the extended STIRPAT model, this paper uses SYS-GMM to empirically study the impact of green taxation on carbon emissions in the Yangtze River Economic Belt. Then, it explores the effect path of green taxation on regional carbon emissions using the intermediary effect model and analyzes the threshold characteristics of the influence of urban greening level on the regional carbon emissions of green taxation using the threshold effect model. The results show that, (1) from 2010 to 2020, the carbon emissions in China’s Yangtze River Economic Belt showed a slow rising trend, and carbon emissions in the lower reaches were significantly higher than those in the middle and upper reaches. (2) Green taxation can significantly suppress carbon emissions in the Yangtze River Economic Belt. However, green taxation has the weakest inhibitory effect on carbon emissions in the upstream region and is slightly stronger in the middle reaches, with the strongest inhibitory effect on carbon emission in the downstream region. (3) From the perspective of the action path, the level of green technology innovation has a significant partial mediating effect. Green taxation mainly realizes carbon emission reductions by improving the level of urban green technology innovation, and its intermediary effect accounts for 17.6% of the total effect of green taxation on regional carbon emissions and 15.6% of the total effect of green taxation on per capita carbon emission intensity. (4) Further research shows that the emission reduction effect of green taxation is also influenced by the level of urban greening, showing a single threshold effect. Before reaching the threshold value, the inhibition effect of green taxation on carbon emission levels is relatively strong, and after crossing the threshold value, the inhibition effect is weakened.

1. Introduction

China’s Yangtze River Economic Belt, with its dense cities, large population and industrial agglomeration, is an important support belt for China’s economic development. However, in the process of development, rapid development in the early stage mainly depends on the high input of various resources, which brings various environmental pollution, resource waste and ecological damage, especially the use of a large amount of fossil energy, resulting in a rapid increase in carbon emissions. In September 2020, President Xi Jinping pledged at the 75th General Debate of the United Nations General Assembly that China would strive to peak its carbon dioxide emissions by 2030 and achieve “carbon neutrality” by 2060. As the “backbone” of China’s economy, the Yangtze River Economic Belt must strictly abide by the ecological red line and is also an important region for realizing the “Double Carbon” target (“Double Carbon”, short for “carbon peak” and “carbon neutral”). Its carbon emission reduction effect will affect the overall development of our country. The “Carbon Peak” means that by 2030, China aims to stop the growth of carbon dioxide emissions and reduce them slowly after reaching the peak. “Carbon Neutral” means that China strives to offset its carbon dioxide emissions via various measures, including planting trees and saving energy by 2060. The carbon reduction effect will affect the overall development of China. China first proposed a “carbon tax” in 2010. The introduction of a carbon tax is an important policy tool for the implementation to reach the carbon peak and carbon neutral goals. At present, China has introduced a carbon trading market system but has yet to establish a “carbon tax”, so energy saving and emission reductions have a long way to go. Green taxation, as an effective means of regulating the environmental management of microeconomic entities, is similar in function to a carbon tax, and plays a guiding and regulating role in carbon emission reductions and environmental protection. Therefore, it is important to explore the impact of green taxation on carbon emissions to achieve overall carbon emission reductions in China.

2. Literature Review

The connotations of green taxation were first reflected in British economist Pigou’s book “Welfare Economics”. Pigou advocated that the government should solve the externalities of environmental pollution through taxation to realize the internalization of external costs (CLEMENZ G 1999) [1], which also laid a theoretical foundation for the government to formulate green taxation policies to achieve the goal of carbon emission reductions. Nobanee Haitham and Ullah Saif (2023) conducted an econometric analysis and a comprehensive survey of the green taxation literature. In the process, they explored the inhibiting effect of green taxation on environmental pollution and predicted that more research on green taxation may be conducted in the future in the direction of analyzing distributional effects, evaluating international cooperation, promoting clean technologies and being used for environmental protection activities [2].
Scholars began to study green taxation and carbon emissions as early as the 1990s. NAKATA et al. (2001) analyzed the effects of the carbon tax and energy tax on carbon emissions of the Japanese energy system with a partial equilibrium model. The result showed that green taxation, such as carbon taxes and energy taxes, are effective in reducing CO2 emissions [3]. Wissema et al. (2007) developed a general equilibrium model and used the SAM model to examine the effect of the energy tax on carbon emissions in Ireland. The result showed that green taxation, such as energy taxes, can effectively curb carbon emissions [4]. Murray et al. (2015) empirically analyzed the effects achieved by the introduction of a carbon tax in North America and showed that the implementation of a carbon tax significantly reduced carbon emission levels [5]. Ploeg and Withagen (2015) believed that well-intentioned climate policies would lead to adverse consequences such as carbon leakage, and the imposition of a higher carbon tax can increase the extraction rate of fossil fuels and thus reduce carbon emissions [6]. Robert Kok (2015) evaluated the effectiveness of CO2 tax incentives for low-carbon vehicles in the Netherlands over the past six years and came to the conclusion that green taxation can effectively reduce CO2 emissions [7]. Yinxiang Zhou et al. (2018) used a CGE model to simulate and analyze the impact of a transportation carbon tax on the transportation sector, macroeconomy and social welfare. The results show that the negative impact of a carbon tax rate of 50 RMB/ton CO2 is small (“RMB” is the currency of the People’s Republic of China, and the unit of RMB is the “Yuan”), and a the carbon tax can realize the “weak double dividend” effect of the carbon tax, which can help reduce the carbon emission level of transportation [8]. Uddin Kazi Mohammed Kamal et al. (2023) used a PLS-SEM model to analyze the impact of green taxation and energy efficiency on sustainable development with manufacturing firms in Bangladesh, and the results proved that green taxation has a significant positive impact on sustainable development environmentally and socially and energy efficiency plays an important mediating role [9].
Scholars in China have made extensive research on green taxation and carbon emissions in the Chinese setting in recent years. Chen, S.Y. (2011) pointed out that the imposition of green taxation represented by a carbon tax can effectively promote carbon emission reductions, but a carbon tax alone achieves the expected emission reduction effect with difficulty and should be supplemented by other related green taxation [10]. Xu, Y. Z. et al. (2015) empirically analyzed the path of environmental regulations such as green taxation on carbon emissions using provincial panel data and found that, as the level of environmental regulations such as green taxation became higher, the stronger the carbon reduction effect from changes in the industrial structure became stronger [11]. Based on the STIRPAT model, Tie, W. and Song, S. (2015) studied the effect of taxes related to carbon emission reductions on carbon emissions in China and found that the effect of resource taxes and consumption taxes on carbon emissions was weak, and the effect of vehicle purchase taxes was significant [12]. Wu, H. (2016) specifically pointed out that two types of green taxation, resource taxes and consumption taxes, should be improved to further optimize the green taxation system to promote energy conservation and emission reductions [13]. Xu, H. C. and Zhang, X. J. (2018) believed that green tax policies have a legal force, which can encourge enterprises to carry out technological innovation and guide enterprises to take the initiative in energy conservation and emission reductions. Therefore, green tax policies are an important means to realize the coordinated development of a green economy and low-carbon development [14]. Fu, S. et al. (2018) empirically studied the carbon emission effects of green taxation in 30 Chinese provinces (municipalities and autonomous regions) using the systematic GMM method and found that narrow and broad green taxation can effectively reduce carbon emissions in China, and there is a significant path-dependent effect [15]. Zhou, D. and Luo, D. Q. (2021) found that green taxation has a threshold effect in the impact of industrial structure changes on carbon emissions. Before the threshold is reached, green taxation can more effectively promote the carbon emission reduction effect of industrial structure optimization and upgrading [16]. Li, B. L. and Xiao, J. G. (2021) pointed out that it is necessary to strengthen top-level design, improve green tax policies and give a greater guiding role to green taxation to coordinate the realization of the “Double Carbon” goal [17].
In summary, it can be seen that most of the existing literature has focused on the impact of environmental regulations on carbon emissions, being more focused on the carbon tax. At present, the academic circle has not yet unified the definition of green taxation. There are relatively few papers that directly study the impact of green taxation on carbon emissions, with only a few papers that study the path of the effect of green taxation on carbon emissions. In addition, most literature studies are based on the provincial level, and there is not enough literature on the study of carbon emissions at the city level. However, because local governments play a pivotal role in the formulation and implementation of tax policies, it is crucial to study at the city level. From this perspective, this paper contributes to the literature in the following four aspects. First, this paper switches the research perspective to the city level of China’s Yangtze River Economic Belt. Based on a comprehensive consideration of green tax intensity and carbon emission status in the Yangtze River Economic Belt, this paper empirically analyzes the impact of the green tax on carbon emissions by expanding the STIRPAT model and SYS-GMM estimation method in order to find a new path for carbon emission reductions in China. Second this paper takes urban carbon emissions and per capita carbon emission intensity as two indicators to measure the level of urban carbon emissions, selects the level of urban green technology innovation as the intermediary variable and deeply explores the effect path of green taxation on carbon emissions. Third, according to the geographical location of the cities in the Yangtze River Economic Belt, this paper divides the cities into regions, conducts a regional heterogeneity test and discusses the effects of economic development, industrial structure and other factors on the effect of green tax emission reductions. Fourth, the greening level of cities is designed as the threshold variable to explore the effect of green taxation on regional carbon emissions under different levels of greening.

3. Theoretical Analysis and Research Hypotheses

3.1. The Mechanism of the Direct Effect of Green Taxation on Carbon Emissions

As early as 1920, Pigou proposed to solve the problem of environmental pollution through taxation. He believed that the inconsistency between the private and social costs of the economic parties was the reason for the market failure of efficient resource allocation. Therefore, the optimization of the private sector led to a non-optimal society, and in reality, it was difficult to achieve the Pareto Optimal state only by relying on the automatic regulation of the market. This requires the government to take legal policies to intervene. Green taxation has roughly the same connotations as the Pigovian tax. According to the theory of the “Pigouvian tax” and “negative externality”, green taxation mainly affects the decision-making behavior of a series of economic entities, such as coal miners, producers and consumers, by increasing their costs. Specifically, the government imposes heavier green taxation on economic agents, causing high emissions to internalize the external costs of economic agents and play the role of a tax wedge. A heavy tax on social products associated with high emissions and a light tax on products with low emissions increase the production cost of high emission products, raise product prices and cause a decrease in relative income, whereas the relative price of low- carbon products decreases, which in turn influences market agents’ economic decisions. For coal resource miners, green taxation increases their mining costs and reduces their mining profits, thus prompting them to reduce their mining of coal energy and reduce the market flow of high-pollution energy such as coal. For producers of coal resources, they not only have to bear the higher tax burden imposed by green taxation in this stage, which increases the input cost of their production process, but they also have to bear the tax burden passed on by the miners of coal resources. Therefore, the production cost of the producers is greatly increased, and thus, the producers are encouraged to reduce the use and production of high-carbon resources. For consumers of coal resources, they are the last link of tax burden transfer and bear a heavier tax burden passed on by local resource miners and producers, which is reflected in the rising prices of consumer products. Therefore, consumers change their consumption patterns, reduce their choice of high-carbon products with higher prices and choose low-carbon products with relatively lower prices. This in turn reduces overall carbon dioxide emissions. Given the above mechanism analysis, this paper proposes to test Hypothesis 1:
H1. 
Green taxation can curb carbon emissions and has a positive “reverse emission reduction” effect.

3.2. The Mechanism of the Indirect Effect of Green Taxation on Carbon Emissions

The impact of green taxation on green technology innovation is mainly manifested in two aspects: the compensation effect and the offset effect. When the compensation effect dominates, green taxation has a positive incentive effect on economic agents. When the government formulates more stringent green tax policies to achieve emission reduction goals, if enterprises continue to choose to bear the cost of pollution instead of engaging in technological innovation, they bear more heavy tax burdens and even face the risk of shutting down their business. However, with the increasing intensity of green taxation and the continuous improvement of green tax systems, enterprises will gradually realize that blindly bearing the cost of environmental pollution is not a viable strategy in the long run. The cost of green technological innovation is not only far lower than the cost of pollution but can also bring additional profits to enterprises. Moreover, the government has formulated corresponding green taxation incentives and tax subsidies for enterprises to carry out green technology innovation, which provide incentives for enterprises to increase green R&D capital investment, purchase special environmental protection equipment and carry out green technology innovation to reap the green taxation dividend of carbon emission reductions. When the offset effect is dominant, enterprises face a situation in which the intensity of the green tax is too strong, and the tax burden is too heavy. With a restricted capital flow, enterprises may use innovation and R&D funds for pollution prevention and control, partially crowding out R&D funds and hindering green technology innovation, which may dampen the emission reduction effect of green taxation. The mechanism of action was shown in Figure 1. As such, this paper proposes to test Hypothesis 2:
H2. 
Green taxation achieves carbon reductions by increasing the level of green technology innovation in cities.
Regarding research on the relationship between green taxation and carbon emissions, most of the conclusions drawn in the previous literatures are linear. However, considering that the Yangtze River Economic Belt spans the three regions of east, middle and west China and is an inland river economic belt with global influence and regional heterogeneity, the emission reduction effect of green taxation is affected by various factors. Therefore, there may be a non-linear relationship between green taxation and carbon emissions, i.e., a “threshold effect”. Green construction is a symbol of the vitality of cities, which not only has the positive effect of beautifying urban spaces but can also can effectively improve air quality. Specifically, planting a large number of green plants can make these plants absorb the excess carbon dioxide through photosynthesis and reduce carbon emissions. Green taxation is a macro policy formulated by the government to protect the environment, reduce pollution emissions and achieve sustainable human development. Because ecological greening can absorb carbon dioxide to a certain extent, the effect of green taxation on carbon emissions may also be affected by the level of urban greening. When the greening level of a city is low, it needs to rely more on the green tax policy imposed by the government to achieve the carbon emission reduction target. When the green level is gradually improved, the ecological environment has a stronger ability to absorb carbon emissions in the city. In addition, citizens have increased awareness of environmental protection, and the government has increased governance efficacy. Thus, the emission reduction effect of green taxation may be further enhanced as well. The mechanism of action was shown in Figure 1. Hence, this paper proposes to test Hypothesis 3:
H3. 
There is a threshold effect of urban greening levels on green taxation affecting carbon emissions.

4. Research Design

4.1. Model Settings

The IPAT environmental impact equation is a quantitative relational model that represents the impact of human activities on the environment, first proposed by Ehrlich et al. (1971). They conducted an in-depth analysis of the environmental degradation problem and measured the impact of human activities on the environment “I” in terms of population size “P”, affluence “A” and technological progress “T”, i.e., “I = PAT” [18]. This model has been widely used since its introduction. Dietz et al. (1994) modified the IPAT equation and proposed the STIRPAT stochastic expansion equation, which expands the original equation to [19]
I = α P β A γ T δ e
In Equation (1), “I” denotes the environmental load, and “α” is the equation coefficient. The elasticity index “β” of population size “P”, “γ” of affluence “A”, and “δ” of technological progress “T” are the equation indices. The introduction of indices accounts up for the defects of the original equation and can more accurately reflect the nonlinear effects of different factors on the environment. Each elasticity index indicates that each 1% change in the three influencing factors, “P”, “A” and “T”, causes “I” to change by β%, γ%, and δ% respectively, where “e” is the random error term. When “α = β = γ = δ = 1”, the extended STIRPAT equation is simplified to the original IPAT equation [20]. Generally, the two sides of the equation of the STIRPAT equation are taken as natural logarithms in practical applications to facilitate the derivation of the elasticity coefficients of each influencing factor’s impact on the environment. The expression of the equation taking the natural logarithm is as follows:
l n I = α + β l n P + γ l n A + δ l n T + e
In this paper, drawing on Fu, S. and Wang, J. (2018), based on Equation (2), the influencing factors are appropriately adjusted, and the lagged term of carbon emissions, the level of urbanization, the industrial structure and the level of openness to the outside world are introduced into the equation to construct the following baseline regression Equation (3) [15]:
l n C M i t = α 0 + α 1 l n C M i , t 1 + α 2 l n G T i t + β 1 l n R G D P i t + β 2 l n P i t + β 3 l n U b r i t + β 4 l n I n d i t + β 5 l n E n e r i t + β 6 l n O p e n i t + μ i + ε i t
In Equation (3), the subscript “i” denotes the region, and “t” denotes the time. “ C M i t ” is the explained variable, indicating the carbon emission level of each region; “ G T i t ” is the core explanatory variable, indicating the green taxation intensity of each region; and “ C M i , t 1 ” is the first order lag of the carbon emission level. The control variables include the level of economic development (RGDP), population size (P), urbanization level (Ubr), industrial structure (Ind), energy intensity (Ener) and openness level (Open). “ μ i ” is the regional fixed effect, and “ ε i t ” is the residual term.

4.2. Variable Selection and Description

4.2.1. Explained (Dependent) Variables

Total carbon emissions are denoted as CM1, and the per capita carbon emission intensity is CM2. Because there is no direct data source for CO2 emissions at the city level, and because the state has not yet made uniform regulations for the calculation of carbon emissions in each region, this paper draws on Wu, J. X. and Guo, Z. Y. (2016) and Ren, X. S. et al. (2020) to apply the following formula to calculate CO2 emissions to measure the carbon emissions of 100 cities in China’s Yangtze River Economic Belt from 2010 to 2020 [21,22].
C O 2 = i = 1 4 C i = i = 1 4 E i × k i
In Equation (4), “ C O 2 ” indicates the total carbon dioxide emissions.“ C 1 ”, “ C 2 ”, “ C 3 ” and “ C 4 ” indicate the carbon dioxide produced by natural gas, liquefied petroleum gas, the total electricity consumption of the whole society, and the consumption of raw coal respectively. The consumption of raw coal is calculated from the city heat supply, the thermal efficiency value (70%), and the average low heat generation coefficient of raw coal (20,908 KJ/kg), and then the amount of energy consumed for urban heating is calculated from the raw coal conversion standard coal coefficient (0.7143 kg standard coal/kg), which in turn is used to calculate the carbon dioxide emissions produced by city heating. E i denotes the consumption of four types of energy, and k i denotes the CO2 emission coefficient of each type of energy. The CO2 emission conversion factors of the four types of energy sources are shown in Table 1.
Through the calculation of the above formula, the carbon dioxide emissions of 100 cities in China’s Yangtze River Economic Belt for each year from 2010 to 2020 can be initially obtained, which is one of the explained (dependent) variables in this paper, and then the calculated data are divided by the year-end resident population of each region to obtain the other explained variables in this paper, which is the per capita carbon emission intensity.

4.2.2. Core Explanatory Variable

Green taxation intensity (GT) is the core explanatory variable. Green taxation is a tax levied for the purpose of protecting the environment and promoting the green consumption of resources. In essence, it is an economic regulation means to internalize the negative costs of the environment and resources. It mainly follows the polluter pays principle [21]. In this paper, green taxation is defined as taxation with green functions, but it is not limited to those with the direct purpose of protecting the environment, i.e., green taxation in a broad sense, including resource taxes, urban maintenance, construction taxes, urban land use taxes, vehicle taxes, arable land occupation taxes and environmental protection taxes. Considering that the environmental protection tax has been levied by the sewage charge since 2018 based on the principle of “tax burden shifting”, the data before 2018 were chosen to be replaced by the sewage charge levied by each region. In addition, although the consumption tax and vehicle purchase tax have the nature of green taxation, they are not included in the scope of green taxation in this paper because they are purely central taxes. Drawing on Fu, S. et al. (2018), this paper defines the broad green taxation intensity as follows: (resource tax + urban maintenance and construction tax revenue + urban land use tax + vehicle and boat tax + arable land occupation tax + environmental protection tax or sewage charge)/tax revenue [15].

4.2.3. Mediating Variable

The level of green technology innovation (Patent) is the mediating variable. In this paper, borrowing from Tao, F. et al. (2021), the number of green patent applications is used to measure the level of green technology innovation in cities, and the total number of green patent applications is obtained by adding the number of green invention patent applications and the number of green utility model patent applications published by the State Intellectual Property Office [23].

4.2.4. Threshold Variable

Urban greening level (GR) is the threshold variable. Specifically, it is measured using the greening coverage of urban built-up areas.

4.2.5. Control Variables

The following six control variables were selected for this paper: level of economic development (RGDP), measured using the ratio of the gross domestic product of each region to the resident population at the end of the year; population size (P), measured using the year-end resident population of each region; urbanization level (Ubr), measured using the ratio of the number of urban permanent residents to the number of year-end permanent residents in each region; industrial structure (Ind), characterized by the results of the weighted calculation of the output value of the three major industries; energy intensity (Ener), measured using the ratio of energy consumption to regional GDP for each region; and external openness level (Open), measured using the ratio of the total import and export trade (in million yuan) to the regional GDP for each region. In addition, it has been argued in the past literature that carbon emissions have a strong lag effect, so this paper refers to the method of Fu, S. et al. (2018), who chose the lagged one-period of the explained variable as the independent variable [15].
All variables are defined as shown in Table 2:

4.3. Data Sources and Descriptive Statistics

Due to the serious missing data some cities are eliminated, and this paper finally takes the relevant data of 100 cities in the Yangtze River Economic Belt from 2010 to 2020 as the basis of research and forms 1100 cities’ balanced panel data. The relevant index data are mainly obtained from various statistical information sources, such as the statistical yearbooks of provinces and cities in the past years, the statistical bulletin of national economic and social development, the China Urban Statistical Yearbook, the China Environmental Statistical Yearbook, the China Energy Statistical Yearbook and the EPS database, and some data are provided by third-party organizations. Moreover, the linear interpolation method is used to complete the sample with a small amount of missing data. In order to avoid the influence of extreme values and heteroskedasticity, the original data of relevant indicators are processed as follows: first, some indicators are logized, and second, winsorize tail reduction is performed on the 1% and 99% quantiles of all continuous variables. The above operations are all completed in Stata 17.0. The descriptive statistics of each variable are shown in Table 3.

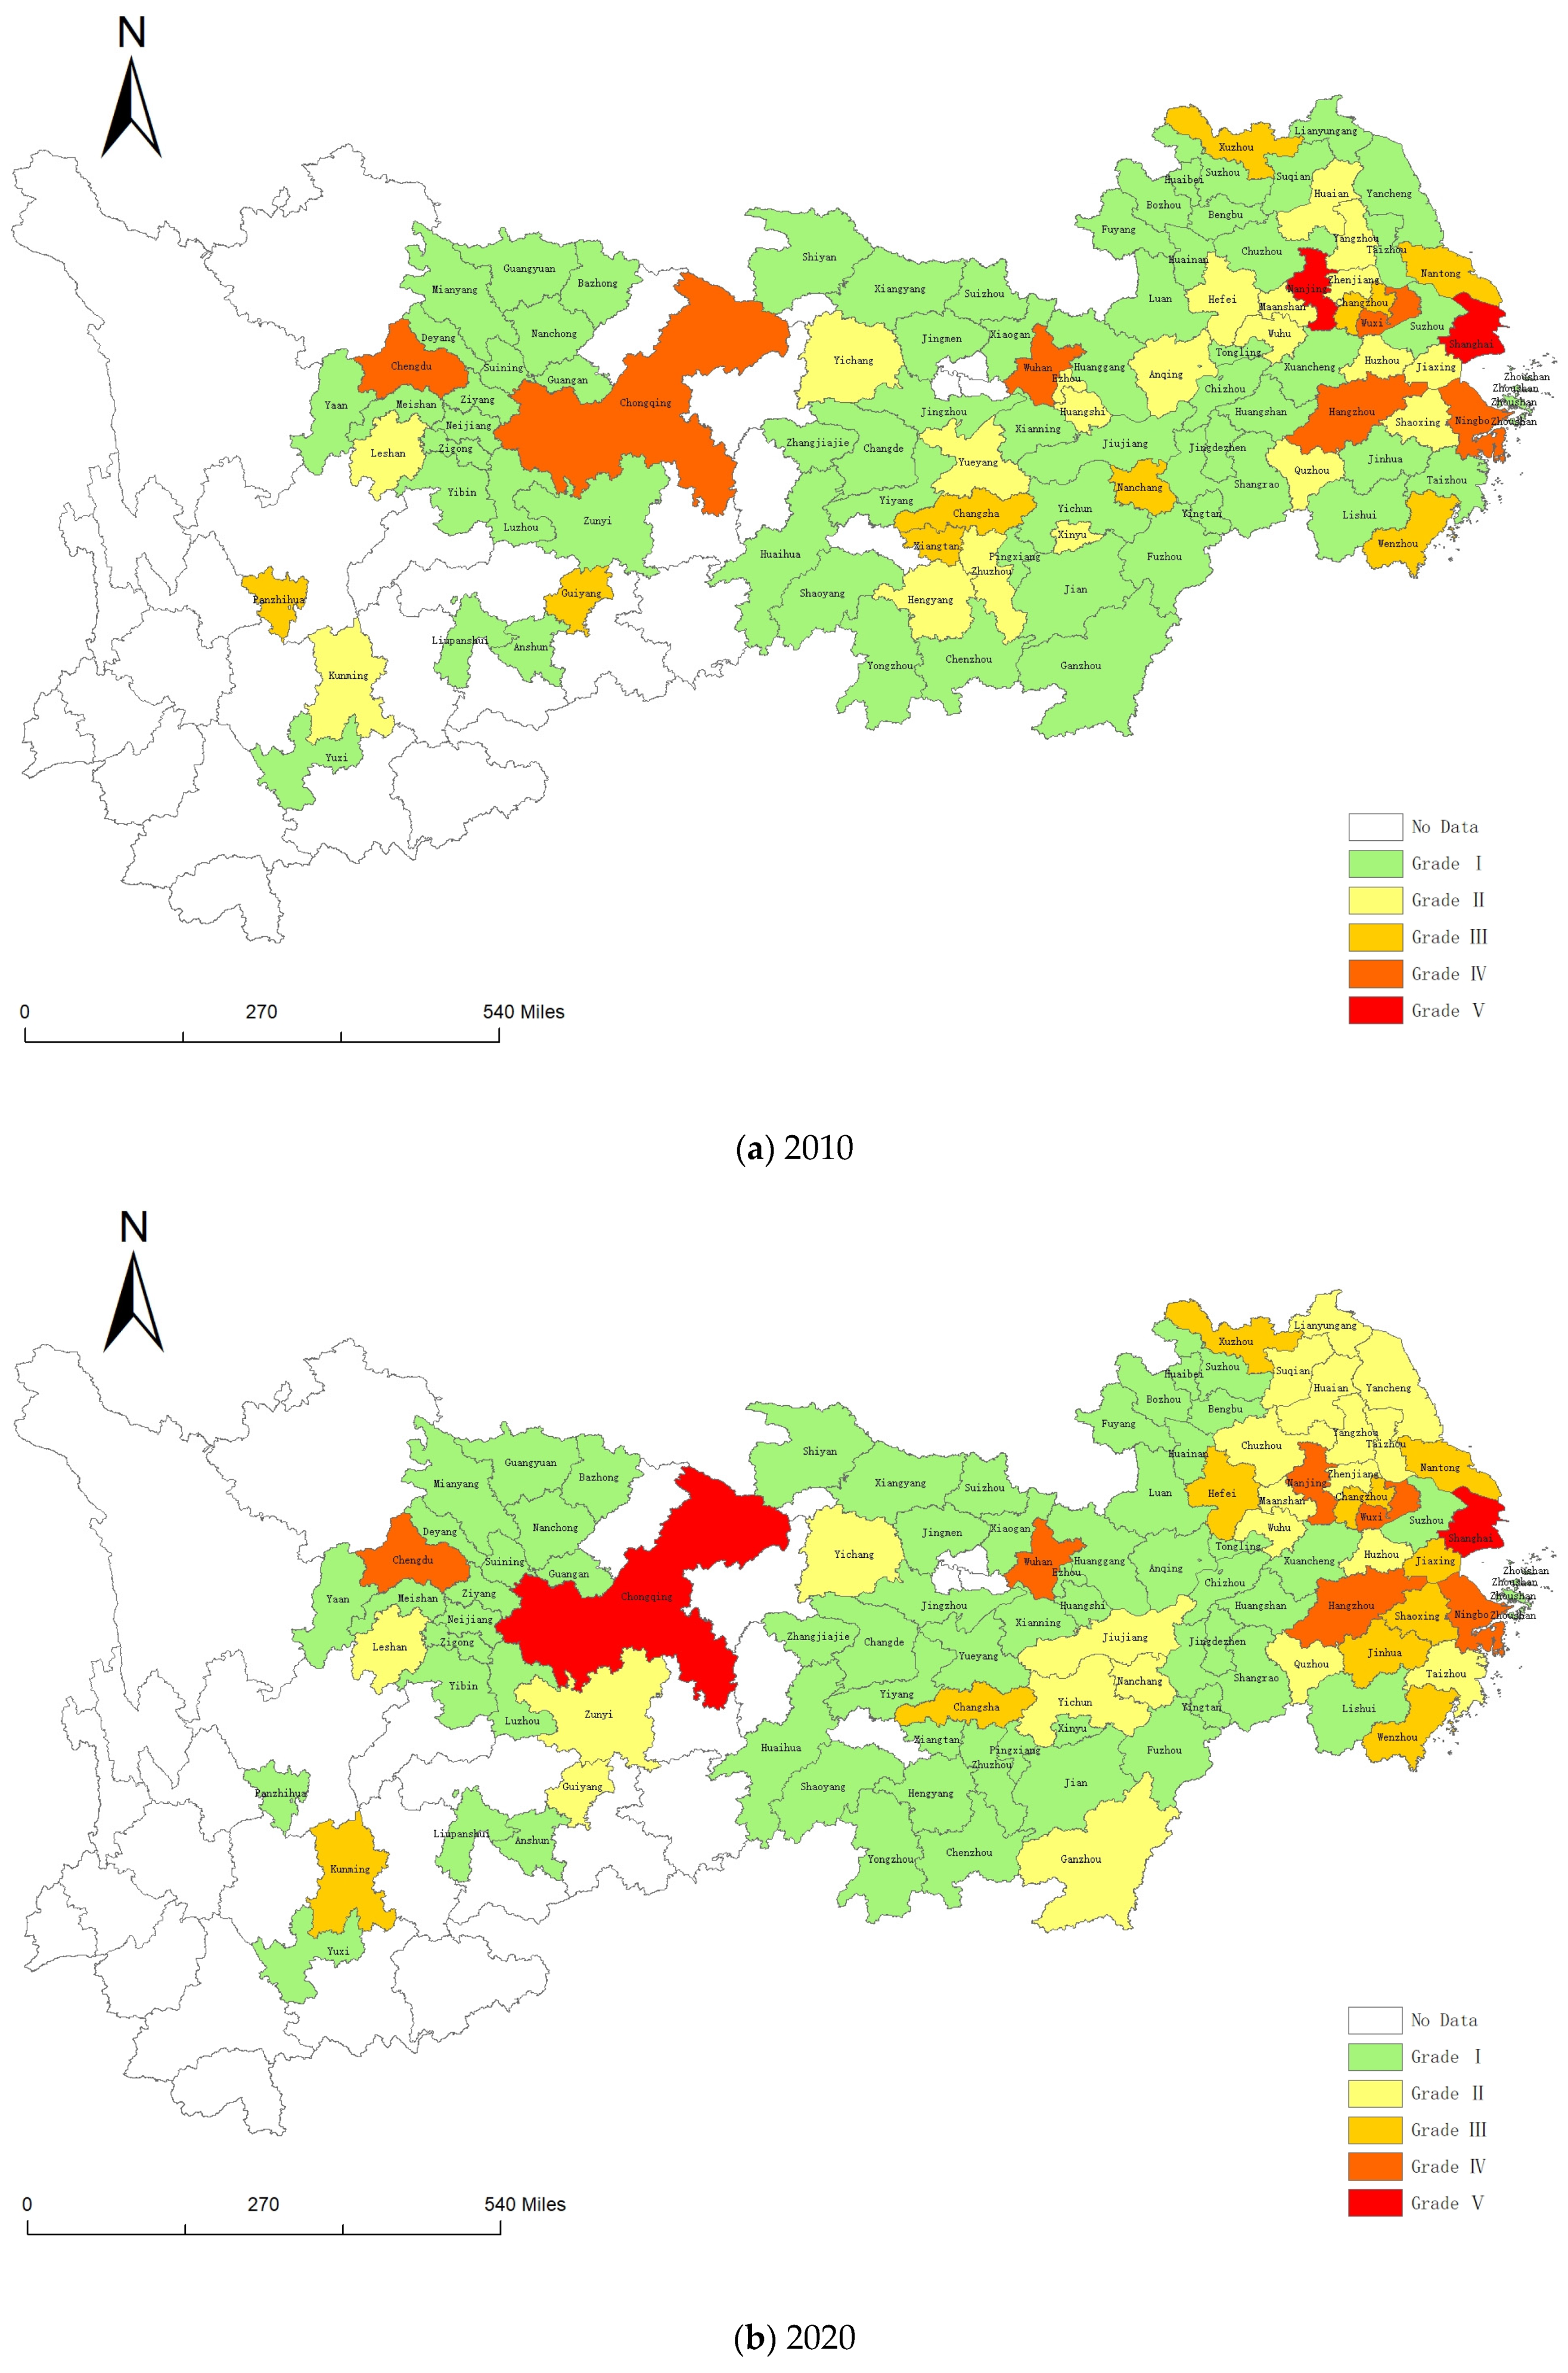
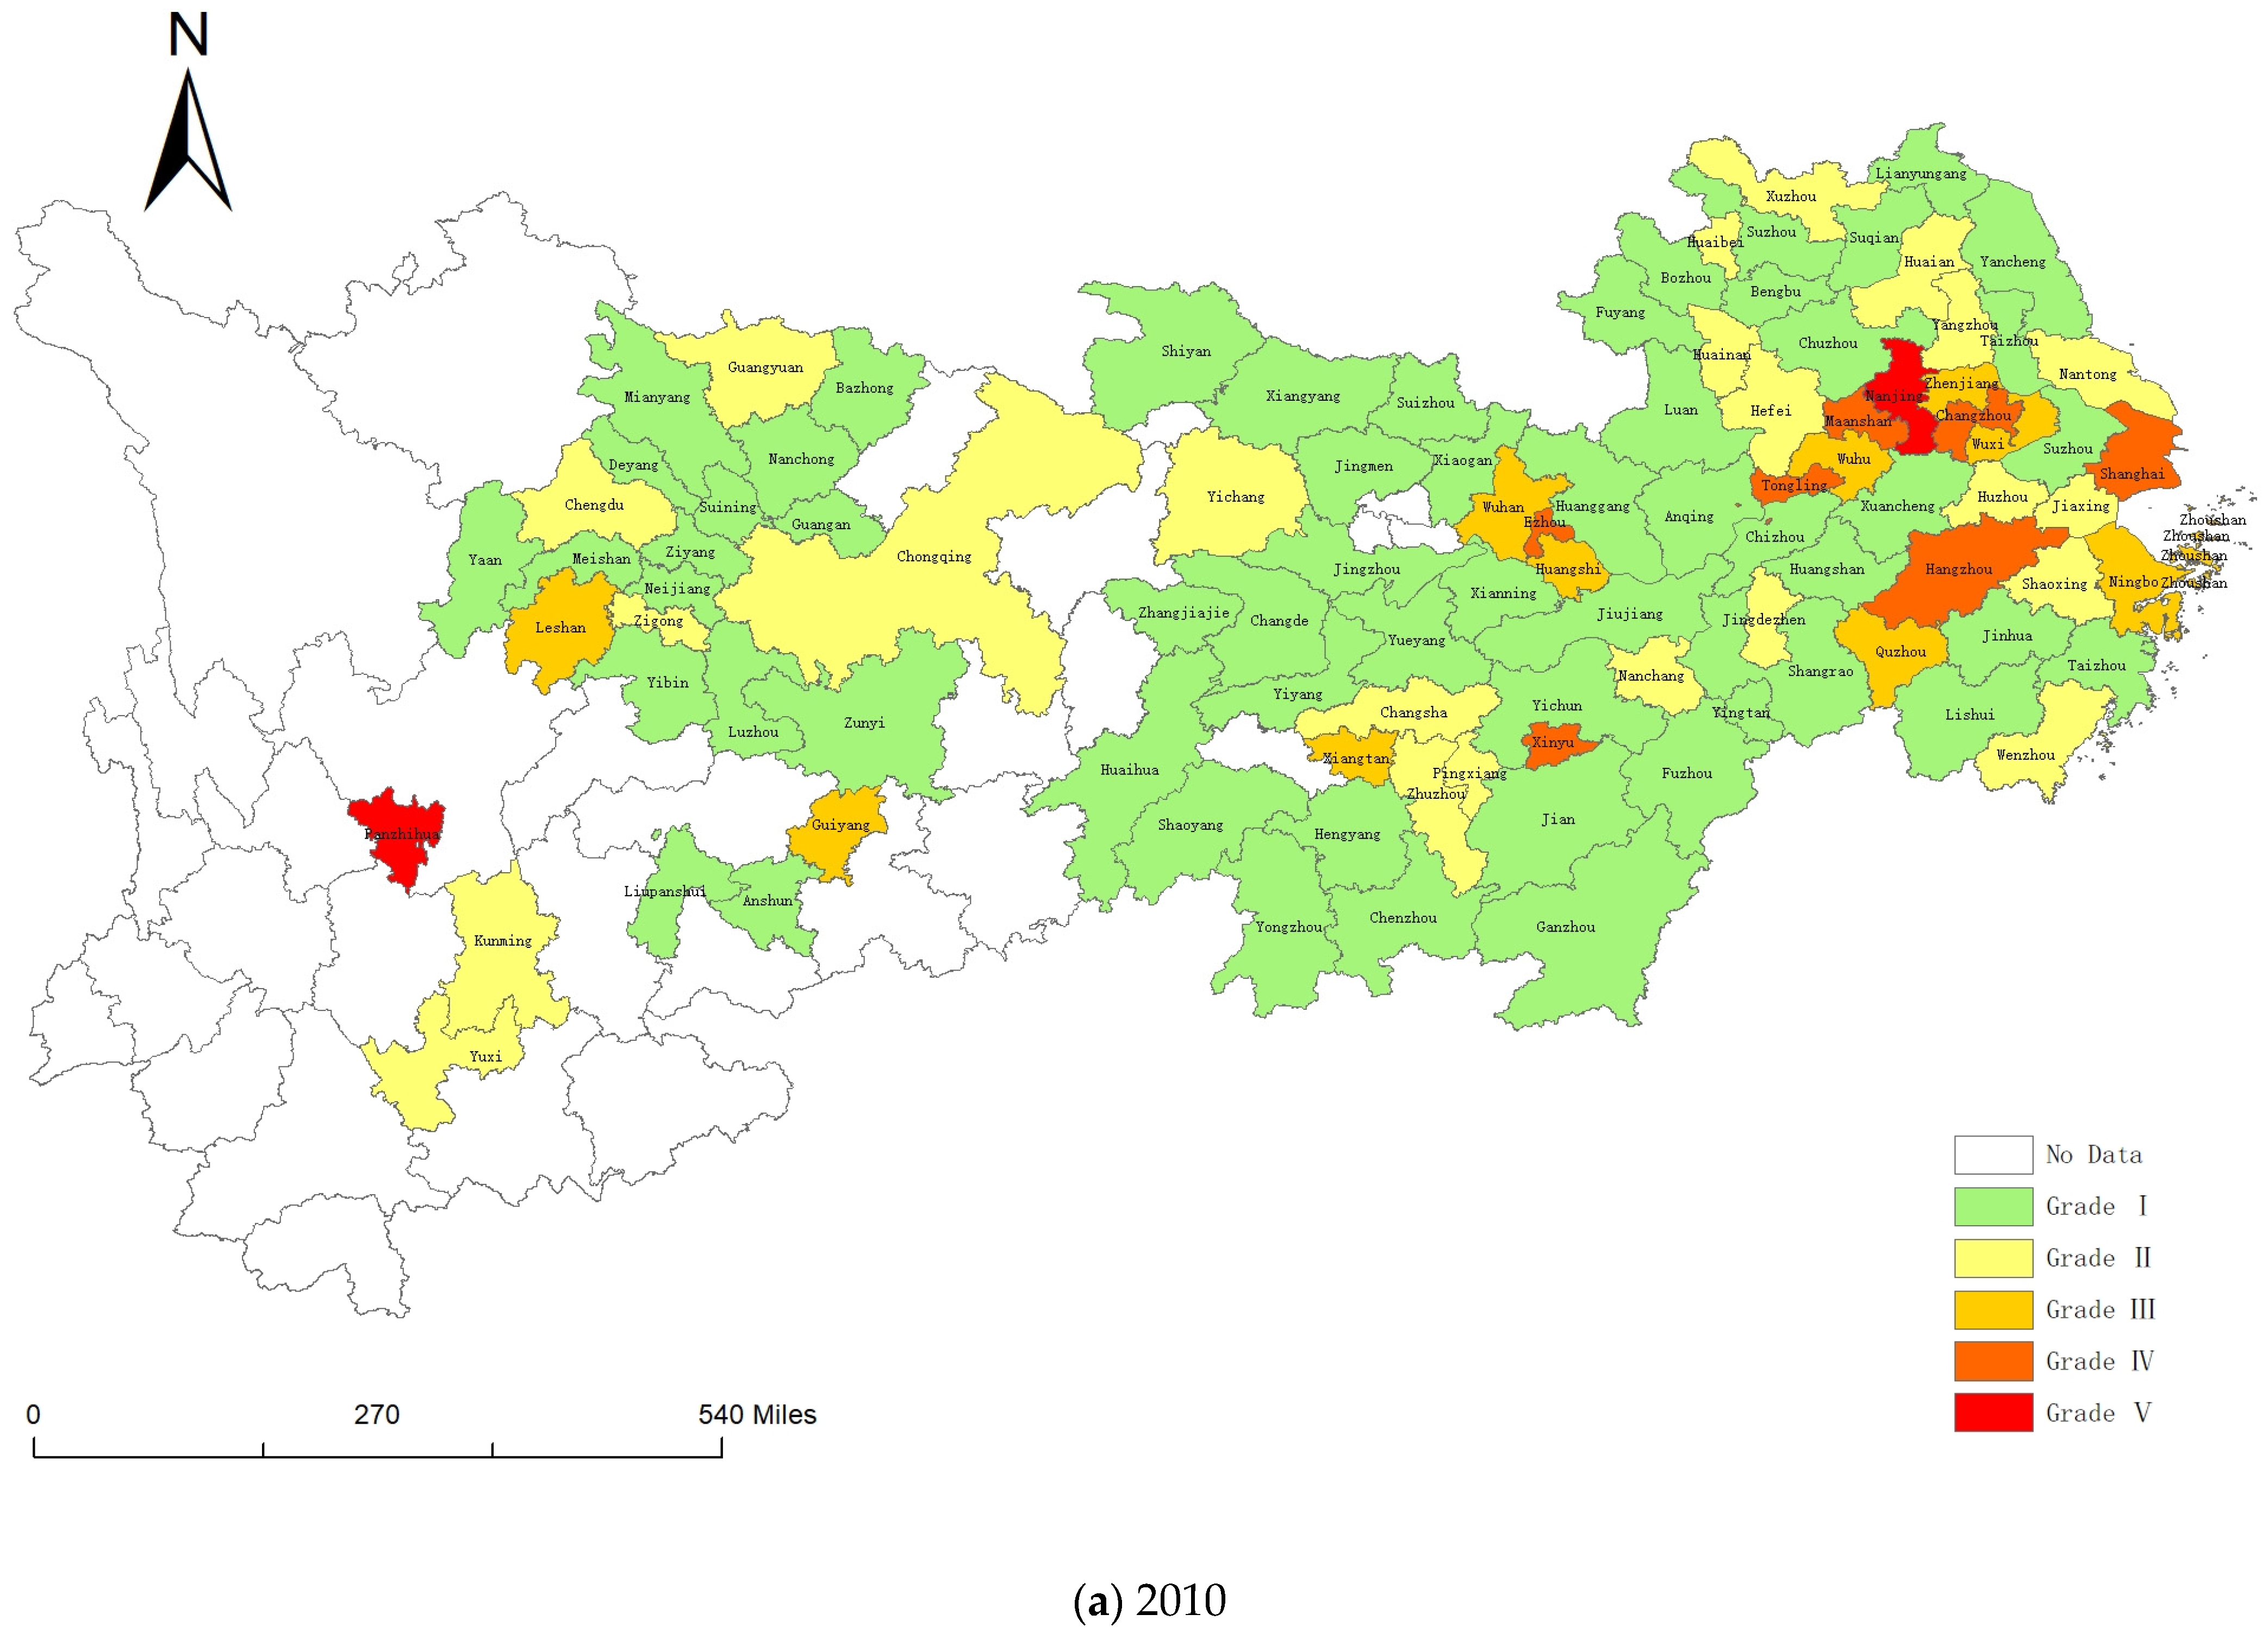
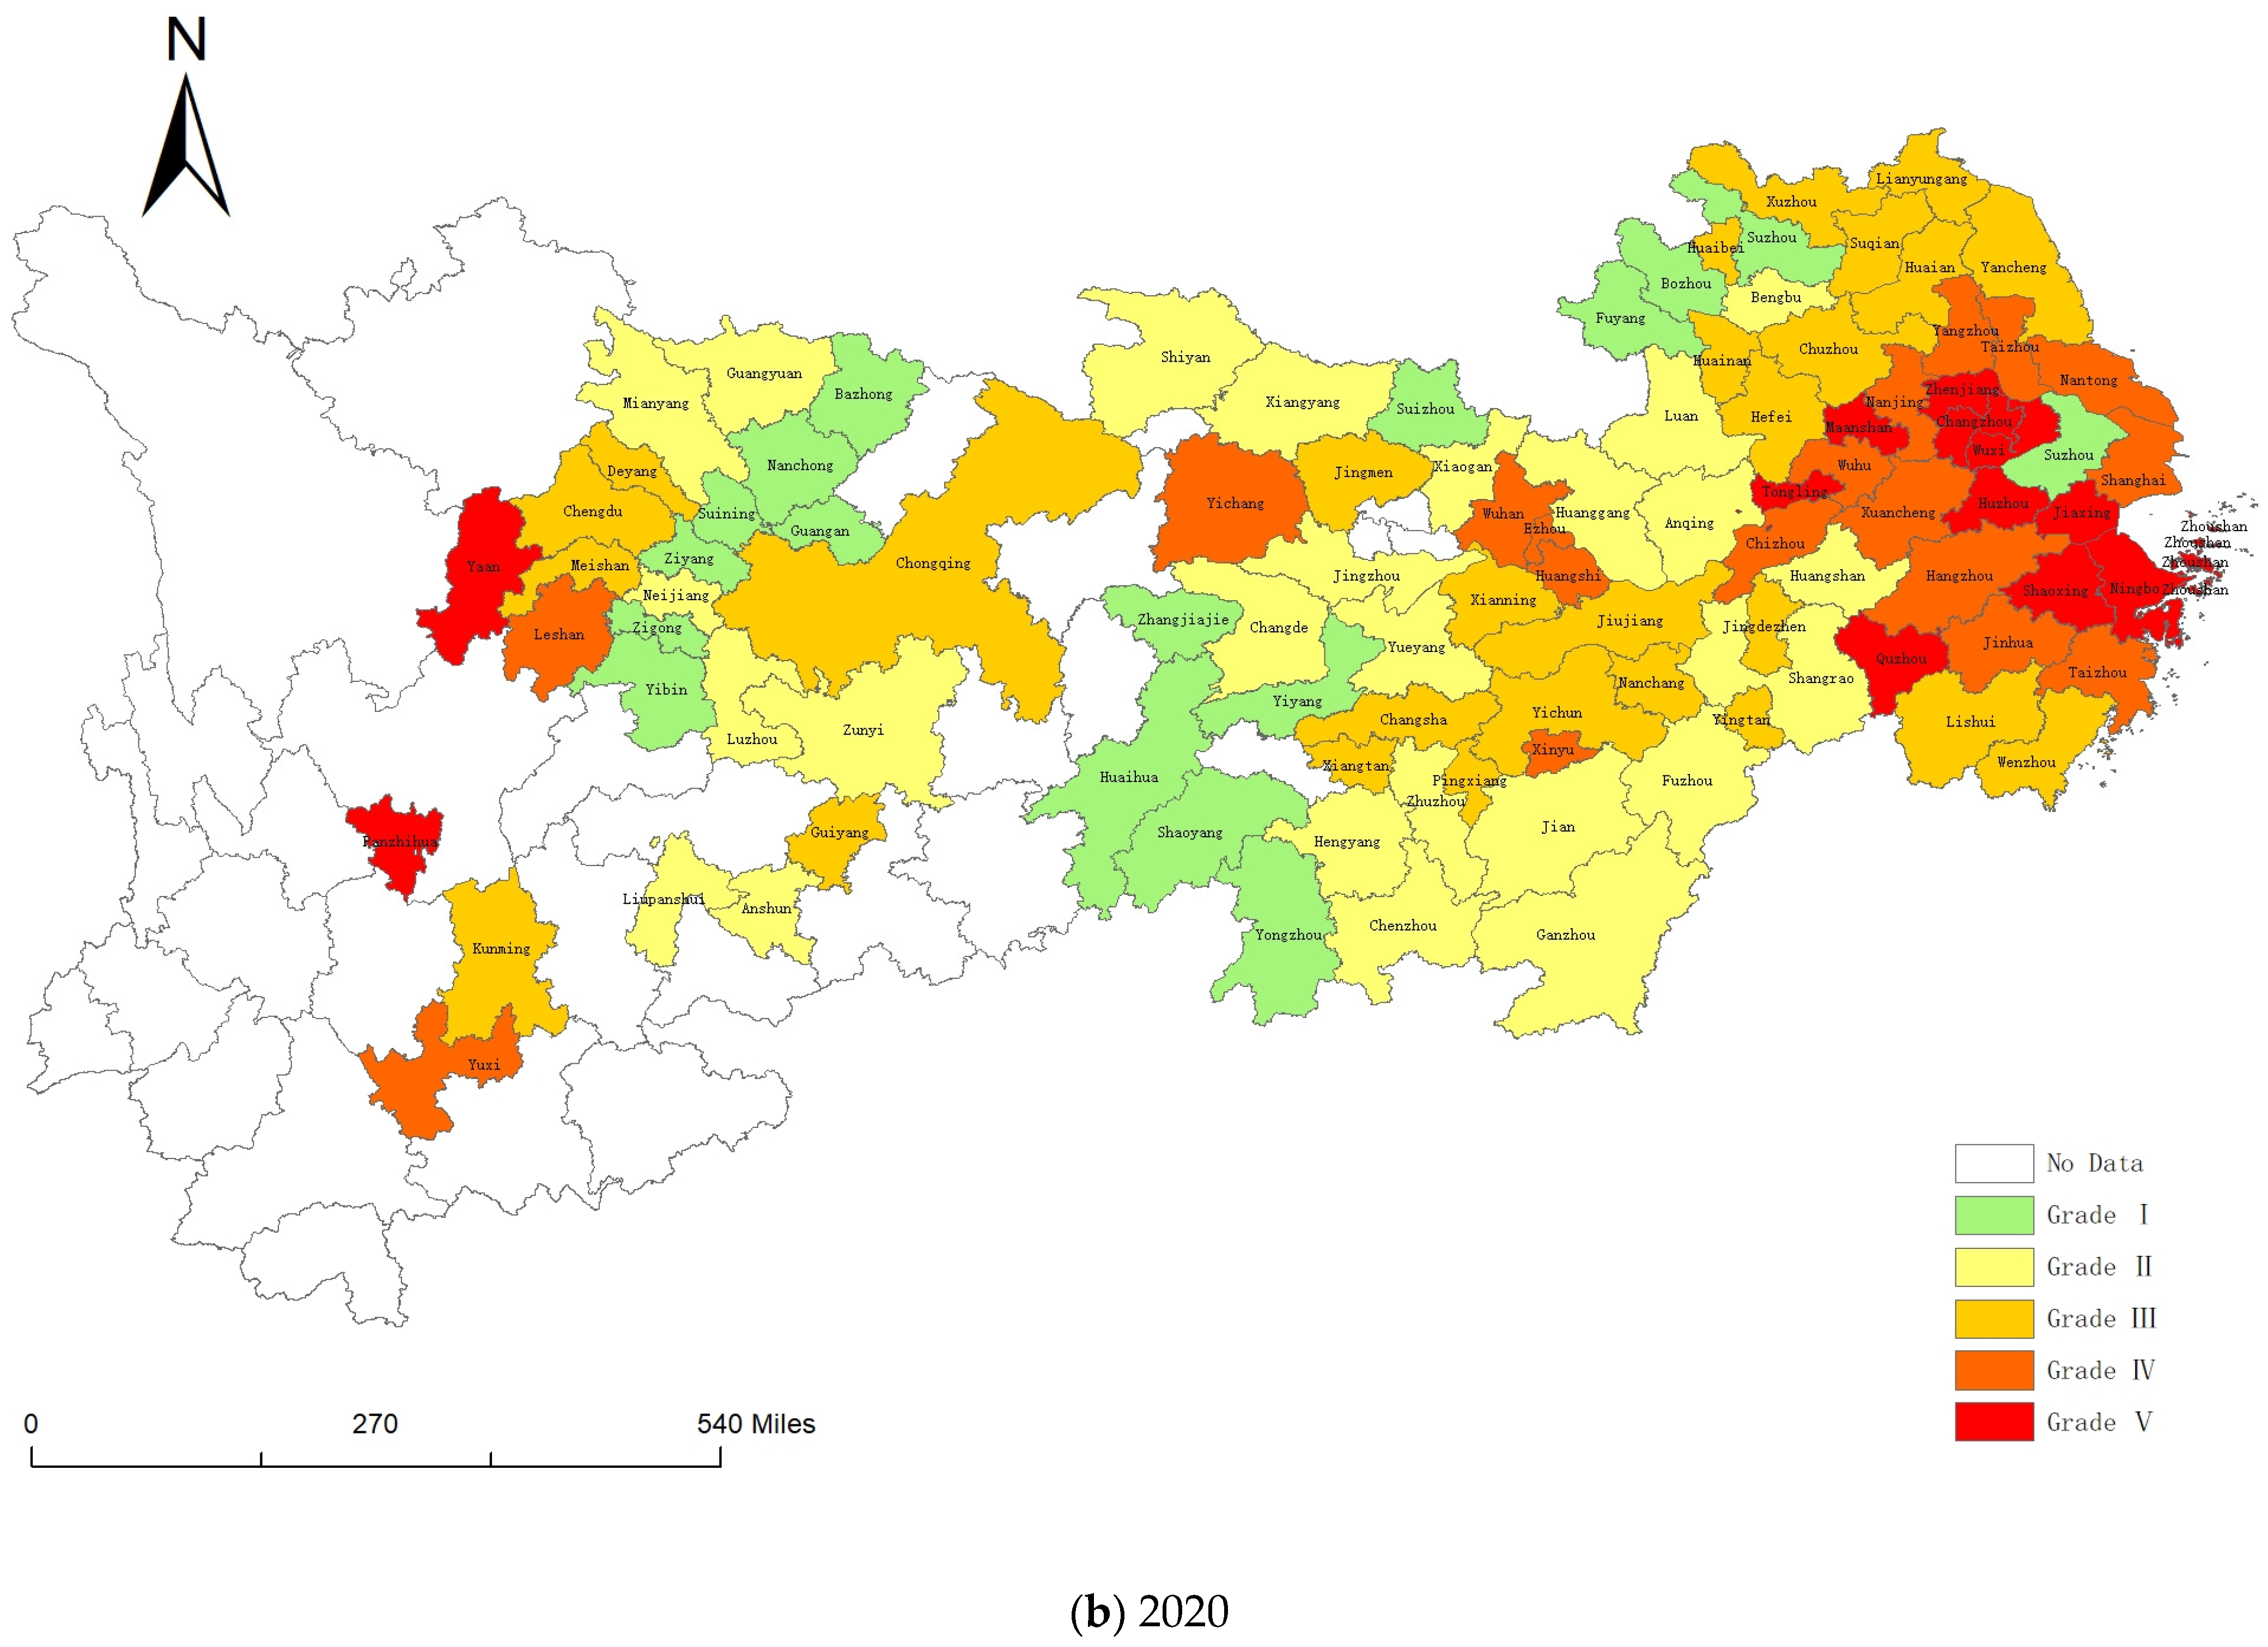
5. Analysis of Spatial and Temporal Changes in Carbon Emissions in China’s Yangtze River Economic Belt

To further investigate the spatial and temporal characteristics of carbon emissions and per capita carbon intensity in 100 cities in China’s Yangtze River Economic Belt, this paper uses ArcGIS 10.8 software to visualize the total carbon emissions and per capita carbon intensity in 100 cities in the Yangtze River Economic Belt from 2010 to 2020, respectively, and divides the total carbon emissions into five levels according to the natural breakpoint grading method, with higher levels representing higher carbon emissions. As the rank increase, the level of carbon emissions also increase. The spatial distribution is shown in Figure 2a,b at two-time points: 2010 and 2020. The blank area in the figure indicates the cities in the 11 provinces and municipalities in the Yangtze River Economic Belt (excluding the 100 cities) and the minority autonomous regions, which are not included in this study, and the same treatment is shown in Figure 3. Overall, the carbon emission level in the downstream region is always higher than that in the upstream and midstream regions, among which Jiangsu and Zhejiang provinces are always at a high level. The carbon emission levels of Chongqing, Chengdu, Panzhihua, and other cities in the upstream region are also relatively high. It can be seen that the regions with higher total carbon emissions are mainly concentrated in the provincial capitals and their surrounding cities with higher levels of economic development, as well as in cities with a higher proportion of secondary industries.
It appears from Figure 2 that there are obvious spatial differences in the total carbon emissions between the upper, middle and lower parts of China’s Yangtze River Economic Belt, with a general characteristic of “high in the east and low in the west”. In 2010, the number of cities in each grade from Grade I to Grade V was 64, 20, 8, 6 and 2 in that order. Among them, Shanghai and Nanjing showed the highest carbon emissions, with 113.70 million tons and 70.60 million tons, respectively, and most of the rest of the cities were Grade I. In 2020, the number of cities in each grade from Grade I to Grade V was 63, 21, 10, 6 and 2, in that order. Among them, Shanghai’s carbon emissions still ranked first, at 151.17 million tons. The number of cities in Grades II and III has increased compared with 2010, and the carbon emission levels of Chongqing and Kunming have surged significantly.
From the spatial distribution of carbon emission intensity per capita in Figure 3a,b, in 2010, the number of cities in each grade from Grade I to Grade V was 57, 23, 11, 7 and 2 in that order. Among them, Panzhihua, Nanjing, Maanshan, Shanghai and Hangzhou, showed the middle and high carbon emission intensities of 8.93 tons/person, 8.82 tons/person, 5.68 tons/person, 4.94 tons/person and 3.66 tons/person, respectively. Compared with 2010, the number of cities in each grade from Grade I to Grade V in 2020 was 17, 25, 27, 18 and 13, in that order. Among them, Suzhou, Panzhihua, Changzhou and Wuxi, represented by the carbon emissions intensity at the forefront, showed carbon emission intensities of 9.93 tons/person, 9.77 tons/person, 8.75 tons/person and 8.60 tons/person, respectively. Most of the cities jumped upward by one grade in the carbon emission intensity rank, but the majority of them are in the Grades I and II per capita carbon emission intensity rank. This indicates that the cause of carbon emission reductions in China’s Yangtze River Economic Belt still needs to be vigorously promoted.

6. Empirical Analysis

6.1. Baseline Regression Analysis

In this paper, Stata 17.0 software is mainly used to empirically test the effect of green tax intensity on the carbon emission levels of cities in China’s Yangtze River Economic Belt. Considering that the lag term of the explained variable is introduced into the model, which leads to the endogenous problem, the Systematic Generalized Methods of Moments Estimation (SYS-GMM) is chosen to estimate the model. The problem of endogeneity can be overcome effectively by using instrumental variables, and the results of parameter estimation can be more effective. The results of the baseline regression analysis are shown in Table 4.
Table 4 presents the results of the SYS-GMM regression of green tax intensity affecting carbon emissions, where Model (1) shows the regression results of the first explained variable indicator of the total carbon emissions (CM1), and Model (2) shows the regression results of the second explained variable indicator of carbon emission intensity per capita (CM2). It can be seen that the p-values of the Arellano–Bond autocorrelation test AR (1) statistic (0.012 and 0.028) are less than 0.1, indicating the existence of first-order autocorrelation in the random disturbance term. The p-values of the AR (2) statistic (0.309 and 0.396) are greater than the 10% significance level, so the null hypothesis of “there is no second-order serial autocorrelation in the random disturbance terms” is accepted, indicating that there is no second-order serial autocorrelation in the estimation model. The p-values of Hansen test statistics (0.636 and 0.176) are greater than 0.1, indicating that the model does not suffer from over-identification and that the instrumental variables selected (i.e., the first–fourth order lagged terms of the explained variables) have validity, and therefore, the SYS-GMM method can be used for parameter estimation of the model [24].
Table 4 shows that the elasticity coefficients of the core explanatory variable, green tax intensity, are both significantly negative at the 1% level, i.e., for every 1 percentage point increase in green tax intensity, total carbon emissions decrease by 0.008 percentage points, and per capita carbon emissions decrease by 0.009 percentage points, indicating that green taxation has a statistically significant reduction effect on carbon dioxide emissions in China. The regression results are consistent with the expectation of Hypothesis 1 of this paper. Shi, M. N. and Liu, N. (2022) also found in their research that China’s green taxation has a significant effect on reducing carbon emissions [24]. Wang, T. Y et al. (2023) revealed that the environmental tax is an important force in mitigating carbon emissions in their investigation of the interactions among green finance, the environmental tax and CO2 in OECD countries over the past 30 years [25]. Fu, S. and Wang, J. (2018) designed green taxation in both broad and narrow terms, taking Chinese provincial data as a sample, and demonstrated that both broad and narrow green tax policies can significantly curb carbon emissions in China [15]. The results of this paper are consistent with these studies and thus are validated. Therefore, the conclusions are reliable and valid. This is closely related to the efforts made by the state to protect the environment in recent years. In 2014, the resource tax reform changed the quantitative taxation method to the ad valorem rate method and raised the tax rate of the coal resources tax. Moreover, enterprises that were engaged in clean energy development were granted tax incentives and financial subsidies to a certain extent. On 1 January 2018, the Environmental Protection Tax Law was officially implemented, which abolished the collection of pollution charges. The implementation of this tax law indicates that the punishment for environmental pollution is strong, the standards are clearer, and the implementation is more standardized, which has contributed to the reductions in carbon emissions in various regions. Further analysis of the regression results shows that both total carbon emissions and per capita carbon emission intensity in the previous period have a significant positive effect on the carbon emission level in the current period at the 1% level, with regression coefficients of 0.116 and 0.106, respectively, thus indicating that carbon emissions have dynamic and continuous cumulative characteristics [24].
Table 4 shows the following regression results of the control variables. First, the effect of economic development on carbon emission level is significantly positive at the 1% level, indicating that economic development has a significant positive effect on carbon emissions, which is closely related to the rough economic growth model of “high pollution, high energy consumption, and high emission” in China. China has always been a large consumer of coal and fossil energy, and the development of green low-carbon industries is not fully mature at this stage, coupled with the fact that China is in a stage of industrialization and urbanization, and the rapid development of the economy is inseparable from the consumption of coal and fossil energy, which will inevitably lead to an increase in carbon emissions. Second, the effect of population size on carbon emissions is significantly positive at the 10% level, which indicates that an increase in population will lead to an increase in total carbon emissions, and population growth will damage the ecological environment to some extent and reduce nature’s ability to absorb carbon emissions, thus causing an increase in carbon emissions [15]. In addition, the effect of population size on per capita carbon emission intensity is significantly negative at the 1% level. The rapid growth of the population can decrease the per capita carbon emissions because, when the urban population becomes more and more concentrated, the supply of energy such as electric heating and electric heat also becomes more concentrated, which effectively improves the efficiency of energy supply and use and to some extent reduces energy consumption, which eventually reduces carbon emissions [26]. Third, the effects of the urbanization level on carbon emission levels are all significantly negative at the 1% level. This is because the rapid urbanization in China’s Yangtze River Economic Belt in recent years has brought out the agglomeration effect and economy of scale effect of the regional population, transportation and industry, which has driven the rapid development of domestic and productive service industries, thus reducing carbon emission levels [27]. Fourth, the effect of industrial structure on the carbon emission level in China’s Yangtze River Economic Belt is significantly positive at the 1% level. This is possibly because the carbon emissions from the secondary industry have been ranked first in the overall carbon emissions, and the growth rate of carbon emissions from the tertiary industry has been accelerated significantly, which has gradually become the main “contributor” to the increase in carbon emissions. Fifth, the effect of energy intensity on carbon emissions is significantly positive at the 1% level. Energy consumption has been an important source for the increase in carbon emissions. China’s energy consumption structure has been dominated by coal and fossil energy, and clean energy only occupies a low proportion, making it so that, as the intensity of energy consumption strengthens, carbon emissions increase. Sixth, the openness level has a positive influence on the carbon emission level, but the significance is not strong. On the one hand, the increasing engagement with the outside world leads to the advancement of science and technology, which is conducive to the reductions in carbon emissions. On the other hand, increases in foreign investment promote regional economic development, which in turn will increases the level of regional carbon emissions, making the impact of openness on the level of regional carbon emissions uncertain.

6.2. Intermediation Effect Test

To further investigate the role path of green taxation affecting carbon emissions, this paper constructs a mediating effect model by drawing on the mediating effect test process of Tan, X. C. et al. (2023) and Shi, B. Z. et al. (2020), and it selects the level of green technology innovation as the mediating variable [28,29]. The mediating effect regression equation is constructed as follows:
l n C M i t = β 0 + α 1 l n C M i , t 1 + α 2 l n G T i t + Σ β c c o n t r o l i t + μ i + ε i t
l n P a t e n t i t = β 0 + α 3 l n P a t e n t i , t 1 + α 4 l n G T i t + Σ β c c o n t r o l i t + μ i t + ε i t
l n C M i t = β 0 + α 5 l n C M i , t 1 + α 6 l n G T i t + λ k l n P a t e n t i t + Σ β c c o n t r o l i t + μ i t + ε i t
where Equation (5) is consistent with the baseline regression equation, and “Patent” denotes the level of green technology innovation. “ α 4 ” represents the estimation coefficient of the core explanatory variable, green taxation intensity, on the mediating variable; “ α 6 ” is the effect of the core explanatory variable on the explained variable after controlling for the mediating variable; and “ λ k ” is the degree of the mediating variable on the explained variable after controlling for the core explanatory variable. When “ α 4 ” and “ λ k ” are significant at the same time, it indicates that green taxation can realize the emission reduction effect by enhancing the level of green technological innovation in cities. For further analysis, the total effect of green taxation on carbon emission levels can be divided into direct effects and indirect effects. “ α 6 ” in Equations (6) and (7) indicates the direct effect, and “ α 4 · λ k ” indicates the indirect effect.
The first step’s regression results of analyzing the mediating effects are reported in Table 4, which shows that the total effect of green taxation on total carbon emissions (CM1) and per capita carbon intensity (CM2) are both significantly negative at the 1% level, with regression coefficients of −0.008 and −0.009, respectively. Model (3) in Table 5 shows the second step’s results of testing the mediating effect, where the effect of green taxation intensity on the mediating variable is significantly positive at the 1% level and the regression coefficient is 0.016, indicating that green taxation can significantly increase the level of green technological innovation in cities. Models (4) and (5) in Table 5 show the third step’s results of testing the mediating effect of green technological innovation on total carbon emissions and per capita carbon emission intensity, respectively, where the coefficients of green taxation intensity are −0.005 and −0.006, which are both significantly negative at the 5% level, and the regression coefficients of the urban green technology innovation level are both −0.088, with significance negative at the 1% level. Therefore, it can be concluded that there is a significant partial mediating effect of the level of green technology innovation, and the magnitude of this effect is both −0.001408 (calculated by multiplying the regression coefficients of “GT” in Model (3) with the regression coefficients of “Patent” in Models (4) and (5), respectively). The mediating effect accounts for 17.6% of the total effect of green taxation on total regional carbon emissions and 15.6% of the total effect of green taxation on per capita carbon emissions intensity (calculated by dividing the above mediating effects by the regression coefficients of “GT” in Models (1) and (2) in Table 4), and the test results are shown in Table 6. The above analysis suggests the existence of a mediating effect of green taxation to suppress the level of urban carbon emissions by increasing the level of green technology innovation in cities. Hypothesis 2 is tested and confirmed.

6.3. Sub-Regional Heterogeneity Test

Due to the long span of the Yangtze River basin, this paper refers to the approach of Zhang, C. L. et al. (2022) and divides China’s Yangtze River Economic Belt into three zones (upstream, midstream and downstream) to conduct SYS-GMM regressions separately, as a way to test and analyze whether there are significant regional differences in the effects of green taxation on carbon emissions [30]. The upstream region includes cities in Guizhou, Sichuan, Yunnan and Chongqing provinces, the midstream region includes cities in Hunan, Hubei and Jiangxi provinces, and the downstream region includes cities in Shanghai, Anhui, Zhejiang and Jiangsu provinces. The results of the sub-regional heterogeneity test are shown in Table 7.
Model (6), Model (8) and Model (10) in Table 7 show the heterogeneity regression results of green taxation on total carbon emissions in the upper, middle and lower reaches of China’s Yangtze River Economic Belt, respectively, and Model (7), Model (9) and Model (11) show the heterogeneity regression results of green taxation on per capita carbon emission intensity in the upper, middle and lower reaches of China’s Yangtze River Economic Belt, respectively. It can be seen that there is significant regional heterogeneity in the effects of green taxation on carbon emissions in the upstream, midstream and downstream regions of China’s Yangtze River Economic Belt. Specifically, the regression coefficients of green taxation on total and per capita carbon emissions in the downstream region are the most significant, with both being significantly negative at the 1% level; the regression coefficients of green taxation on total and per capita carbon emissions in the midstream region are both significantly negative at the 5% level; and the regression coefficients of green taxation on total and per capita carbon emissions in the upstream region are the least significant, with both being significantly negative at the 10% level. This indicates that green taxation in the upstream, middle, and downstream regions of China’s Yangtze River Economic Belt have different degrees of inhibiting effects on carbon emissions, and the differences in the level of economic development, industrial structure, and the level of governance of local governments lead to significant differences among regions, with carbon emission levels in economically developed regions being more likely to be affected by green taxation. Moreover, the green taxation system in regions with relatively low economic development levels still needs to be optimized, and local governments should give full play to their regional advantages and establish inter-regional ecological compensation mechanisms to realize coordinated green development among regions.

6.4. Robustness Tests

To further test the reliability of the empirical results, this paper adopts the following two robustness tests. First, to avoid the influence of municipalities directly under the central government on the regression results, this paper follows Shi, M. X. et al. (2022) and excludes the two municipalities directly under the central government, Shanghai and Chongqing, from the sample, and it conducts SYS-GMM regression on the remaining sample to re-examine the effect of green taxation on carbon emission levels [24]. The test results are shown in Model (12) and Model (13) of Table 8. Second, the regression is conducted by replacing the metrics of the original core explanatory variables with total green taxation revenues, and the test results are shown in Model (14) and Model (15) of Table 8.
As can be seen from the regression results in Table 8, Model (12) and Model (13) illustrate that the regression coefficients of green taxation intensity (GT) on the explained variables, total carbon emissions (CM1) and per capita carbon emissions intensity (CM2), are 0.007 and 0.008, respectively, and both are significantly negative at the 1% statistical level, indicating that there is a significant suppressive effect of green taxation on carbon emissions. The results are consistent with those in Table 4. Model (14) and Model (15) show that the regression coefficients of total green taxation revenue (GT′), total carbon emissions (CM1) and per capita carbon emission intensity (CM2), are 0.162 and 0.184, respectively, and both are significantly negative at the 1% level, indicating that total green taxation revenue (the alternative core explanatory variable) has a significant suppressive effect on regional carbon emission levels. Again, the results are consistent with those in Table 4. In addition, it appears that the regression coefficients of each control variable in Table 8 are similar to those in Table 4. In summary, the robustness test results support and verify that the research results derived from this paper are robust and reliable.

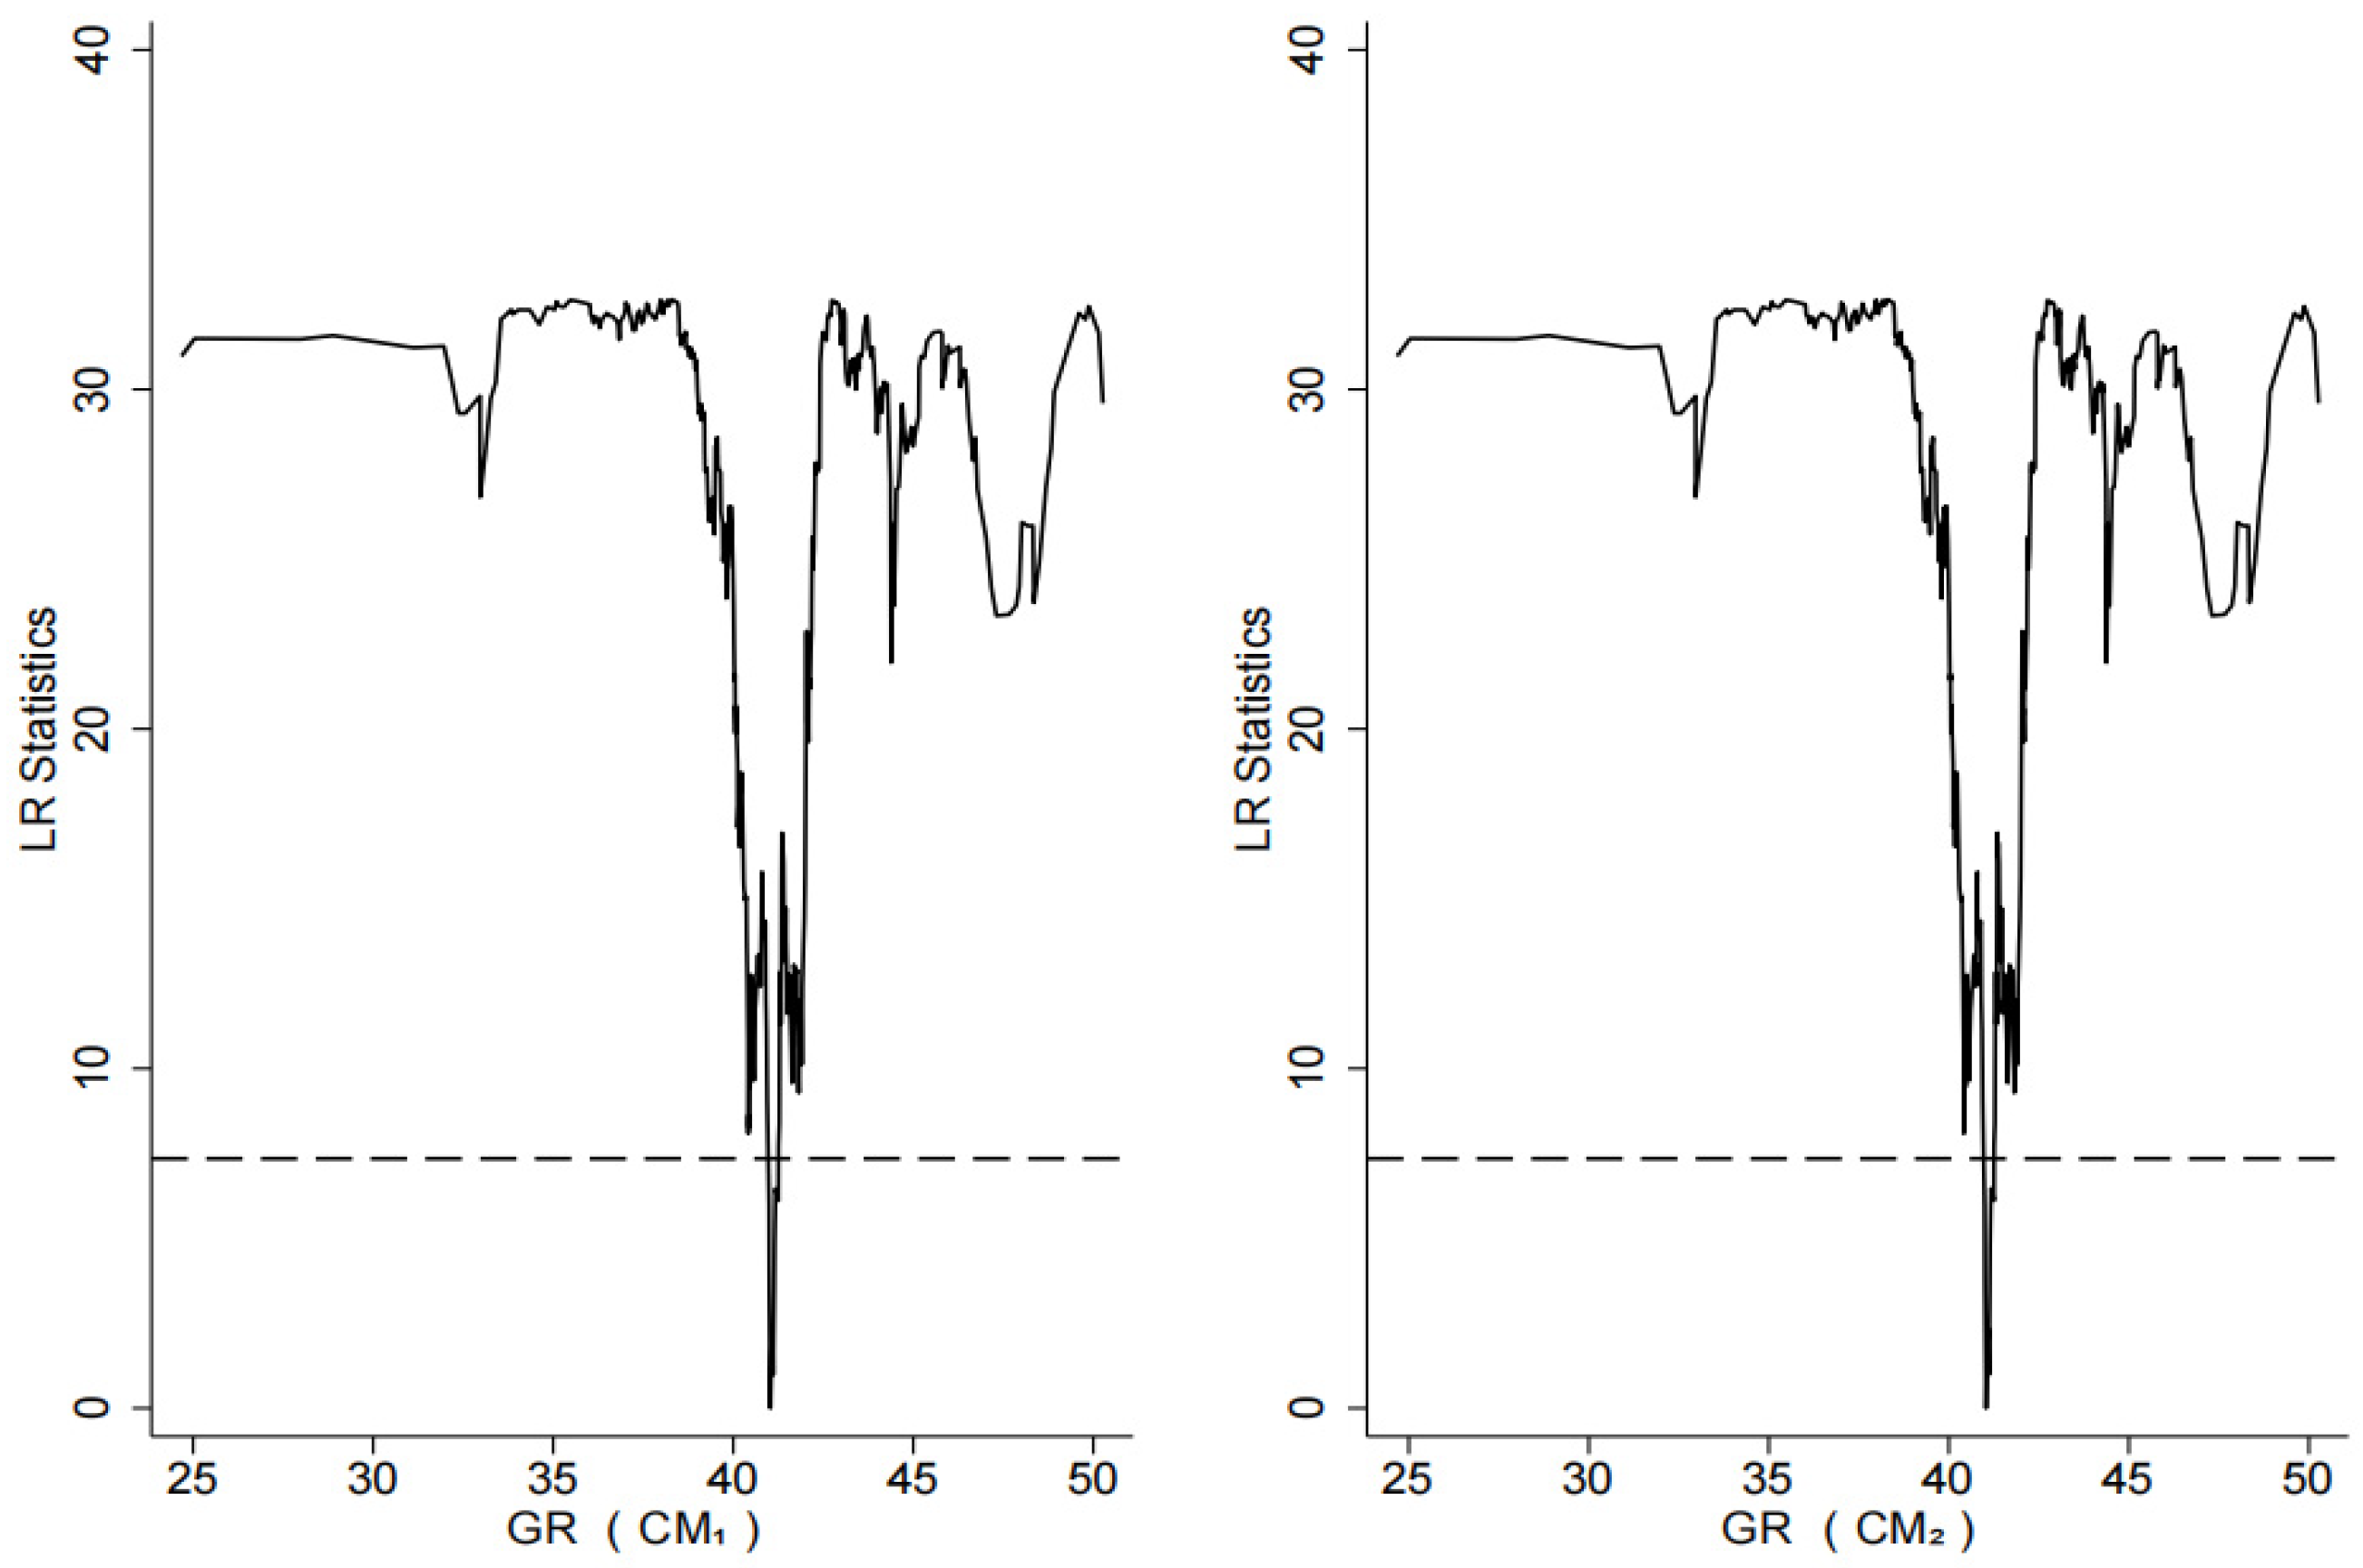
6.5. Threshold Effect Test

From the baseline regression results, we can see that green taxation has a significant linear effect on the regional carbon emission level. However, the effect of green taxation on carbon emission levels may change under different urban greening levels, and there could be a “threshold effect” of the urban greening level, where the urban greening level (GR) is expressed by the green coverage of the urban built-up area. To further test whether there is a nonlinear relationship between the variables, this paper draws on the threshold model proposed by Hansen (1999) to test the relationship between the variables [31]. The single threshold regression equation is set as follows:
l n C M i t = α 0 + α 1 l n G T i t · I G R γ + α 2 l n G T i t · I ( G R > γ ) + α 3 c o n t r o l i t + ε i t
In Equation (8), I(·) is the demonstrative function, “GR” is the threshold variable, and “γ” is the threshold value to be estimated. According to whether the threshold variable, the urban greening level “GR”, is greater than the threshold value “γ”, the sample interval can be divided into two zone systems, which are represented by “ α 1 ” and “ α 2 ”, respectively. “Control” denotes the control variables, which are, specifically, the economic development level (RGDP), population size (P), urbanization level (Ubr), industrial structure (Ind), energy intensity (Ener) and level of openness to the outside world (Open).
In this paper, we test whether there is a threshold value and the number of thresholds for the greening level (GR) of 100 cities in China’s Yangtze River Economic Belt. We draw on the bootstrap method of Hansen (1999) to determine whether there is a threshold effect by repeatedly sampling the p-value corresponding to the test statistic 1000 times in Stata 17.0 software [31]. The test results are shown in Table 9.
As can be seen from Table 9, when the urban greening level “GR” is the threshold variable, the F-statistics for both dependent variables are significant at the 1% level in the single threshold case, but the double and triple thresholds do not pass the test. Therefore, there is a single-threshold effect between green taxation and carbon emission level when the urban greening level is used as the threshold variable. Hypothesis 3 is therefore tested and supported. The results of the single-threshold estimation are presented in Table 10.
Figure 4 shows a plot of the likelihood ratio function for a single threshold estimate of 41.0308 for 100 cities in the Yangtze River Economic Belt at a 95% confidence interval, where the lowest point of the LR statistic is the corresponding true threshold estimate, and the dashed line indicates the critical value of 7.35. It is obvious that the critical value is greater than the threshold value, so the threshold is valid.
Table 11 shows the results of the panel threshold regression, and it can be seen that the effect of green taxation on carbon emission levels varies to some extent when the threshold variable, GR, is taken at different values. However, the effect of green taxation on carbon emission levels is suppressed regardless of the change in urban greening levels. Specifically, when the urban greening level is less than the threshold value of 41.0308, the effect of green taxation on the carbon emission level is significantly negative, with a regression coefficient of −0.00848. When the urban greening level reaches and exceeds the threshold value of 41.0308, the inhibitory effect of green taxation on the carbon emission level decreases, with a regression coefficient of −0.00574. This indicates that, with the gradual improvement of the urban greening level, after reaching a certain threshold value (41.0308), although green taxation can continue to reduce carbon emissions, its emission reduction effect weakens. This is perhaps caused by the fact that the ecological environment gains a stronger ability to absorb urban carbon emissions, and people’s environmental protection awareness and the government’s environmental governance ability are also gradually strengthened.

7. Conclusions and Recommendations

7.1. Research Conclusions

This paper takes the panel data of 100 cities in China’s Yangtze River Economic Belt from 2010 to 2020 as the research sample, constructs a STIRPAT model and empirically analyzes the impact of green taxation on carbon emissions using Systematic Generalized Moment Estimation (SYS-GMM), a mediating effect model, a threshold effect model, etc. The main findings are as follows.
(1) From 2010 to 2020, carbon emissions in China’s Yangtze River Economic Belt showed a slow upward trend, with carbon emissions in the downstream region being significantly higher than those in the midstream and upstream regions. Green taxation had a significant inhibitory effect on carbon emissions in China’s Yangtze River Economic Belt, forming a “reverse emission reduction” effect. In addition, there was significant regional heterogeneity in the impacts of green taxation on carbon emissions in the upstream, midstream and downstream regions of the Yangtze River Economic Belt, with the downstream region having the strongest effect of green taxation on carbon emission reductions, the midstream region being the next strongest and the upstream region having the weakest inhibitory effect.
(2) Green taxation can indirectly suppress carbon emissions by improving the level of green technology innovation in cities, for which there is a significant partial intermediary effect of the green technology innovation level, which accounts for 17.6% of the total effect of green taxation in suppressing regional carbon emissions and 15.6% of the total effect of green taxation in suppressing per capita carbon emission intensity.
(3) There is a single-threshold effect based on the greening level of cities, and when the greening level of cities does not cross the threshold (41.0308), the suppression effect of green taxation on carbon emission levels is relatively strong, and after crossing the threshold, the suppression effect is weakened.

7.2. Policy Countermeasures and Recommendations

7.2.1. Differential Implementation of Green Taxation Policies

It would be advisable to set up differential green taxation policies in different regions of China’s Yangtze River Economic Belt, in order to harmonize the heterogeneity of green taxation impacts on regional carbon emissions. For the middle and lower reaches of the region with better economic development and higher levels of carbon emissions, where the public’s awareness of environmental protection is stronger, the government can appropriately increase the intensity of green taxation, increase the tax burden of high-polluting and high-energy-consuming enterprises, such as industrial enterprises, and raise the cost of their energy consumption and carbon dioxide emissions. On the one hand, this would encourage enterprises to reduce the consumption of highly polluting energy and increase the use of new energy. On the other hand, this would force enterprises to carry out green technological innovation, thus achieving the purpose of carbon emission reductions. For upstream regions with poor economic development and low carbon emissions, the incentive role of green taxation policies could be fully utilized. Tax policy subsidies and incentives could be given to green and low-carbon industries, micro-bodies could be encouraged to carry out green technological innovation while focusing on the quality of innovative technologies, and the diversity and universality of tax policies could be enhanced, thus guiding each economic body to reduce carbon dioxide emissions.

7.2.2. Investing in Green Technological Innovation

It is necessary for the government to pay attention to the problem of enterprises’ “difficulty in financing and scarcity of financing” and to support enterprises in terms of policies and funds to carry out green technological innovation. For new energy enterprises, the government can formulate preferential green taxation policies to encourage enterprises to actively carry out research and development of green technology, such as subsidizing research and development expenses and providing incentives and rewards for development results. Moreover, the government can set different levels of progressive tax rates according to the amount of polluting energy consumption or carbon dioxide emissions, focusing on supporting the green technology innovation of high-polluting, high-energy-consuming enterprises to seek a common breakthrough point for green transformation and low-carbon development. In addition, the government needs to make strides to develop the tertiary industry in conjunction with its geographical advantages, enhancing the level of green technological innovation in the industry and increasing the proportion of green and low-carbon enterprises. Enterprises can also seize the opportunity of government policy support in a timely manner, actively respond to the call of the state, and closely follow the policy direction of the authorities. Specifically, enterprises can increase investment and funding in green low-carbon technology research and development and focus on training high-tech personnel, introducing high-end machinery and equipment to accelerate the realization of green transformation.

7.2.3. Cooperate to Promote Regional Low-Carbon Development

For areas with a high level of urban greening, the government could focus on urban greening work and make full use of nature’s absorption and digestion capacity of carbon emissions, and for areas with a low level of urban greening and rapid industrial development, the government could appropriately increase the intensity of green taxation and consider accounting for the lack of nature’s absorption capacity with a reasonable green tax policy. In addition, to strengthen inter-regional cooperation, local governments could give full play to their regional advantages, promote the efficient flow of resource elements between regions, optimize the efficiency of resource allocation between regions and establish an inter-regional ecological compensation mechanism. The government could aim at efficiency, harmony and sustainable development, take a low-carbon economy as an important support, actively introduce and use low-carbon technology, vigorously develop strategic new industries with significant leading and driving effects, lower material and resource consumption, increase growth potential and obtain good overall benefits. Moreover, the government could vigorously improve the quality and efficiency of economic development, promote the cooperation of various regions to explore diversified green and low-carbon development paths, realize green and coordinated development among regions and ultimately achieve the ambitious goal of “carbon peaking and carbon neutrality”.

Author Contributions

Original draft preparation: X.F. and M.W.; Reviewing, revising, and editing: X.F. and W.-C.H. All authors have read and agreed to the published version of the manuscript.

Funding

This research was supported by the Major Project on Human Studies and Social Science Research in Anhui Provincial University in 2021: Research on Green Transformation of Traditional Manufacturing Industry in Anhui Province under Dual Carbon Target: Driving Mechanism, Effect Evaluation and Path Optimization (Funding Number: SK2021ZD0014). Funder: Anhui Provincial Department of Education. Project manager: Xingcun Fang.

Institutional Review Board Statement

Not applicable.

Informed Consent Statement

Not applicable.

Data Availability Statement

All data and materials applied in this study are available from the corresponding author only upon academic or other non-business requests.

Conflicts of Interest

Authors Xingcun Fang, Mengting Wei, and Wei-Chiao Huang declare that they have no financial interests. The authors have no relevant financial or non-financial interests to disclose.

References

  1. Clemenz, G. Adverse selection and Pigou taxes. Environ. Resour. Econ. 1999, 13, 13–29. [Google Scholar] [CrossRef]
  2. Haitham, N.; Saif, U. Mapping green tax: A bibliometric analysis and visualization of relevant research. Sustain. Futures 2023, 6, 100129. [Google Scholar]
  3. Nakata, T.; Lamont, A. Analysis of the impacts of carbon taxes on energy systems in Japan. Energy Policy 2001, 29, 159–166. [Google Scholar] [CrossRef]
  4. Wissema, W.; Dellink, R. AGE analysis of the impact of a carbon energy tax on the Irish economy. Ecol. Econ. 2007, 61, 671–683. [Google Scholar] [CrossRef]
  5. Murray, B.; Rivers, N. British Columbia’s revenueneutral carbon tax: A review of the latest “grand experiment” in environmental policy. Energy Policy 2015, 86, 674–683. [Google Scholar] [CrossRef]
  6. Ploeg, F.; Withagen, C. Global Warming and the Green Paradox: A Review of Adverse Effects of Climate Policies. Oxcarre Work. Pap. 2015, 9, 285. [Google Scholar]
  7. Kok, R. Six years of CO2-based tax incentives for new passenger cars in The Netherlands: Impacts on purchasing behavior trends and CO2 effectiveness. Transp. Res. Part A 2015, 77, 137–153. [Google Scholar] [CrossRef]
  8. Zhou, Y.; Fang, W.; Li, M.; Liu, W. Exploring the impacts of a low-carbon policy instrument: A case of the carbon tax on transportation in China. Resour. Conserv. Recycl. 2018, 139, 307–314. [Google Scholar] [CrossRef]
  9. Kamal, M.K.U.; Mominur, M.R.; Shuvabrata, S. The impact of green tax and energy efficiency on sustainability: Evidence from Bangladesh. Energy Rep. 2023, 10, 2306–2318. [Google Scholar]
  10. Chen, S.Y. Marginal abatement costs and environmental tax reform in China. China Soc. Sci. 2011, 3, 85–100+222. [Google Scholar]
  11. Xu, Y.Z.; Yang, Y.C.; Guo, J. The path and effect of environmental regulation on carbon emission reduction—An empirical analysis based on provincial data in China. Sci. Technol. Manag. 2015, 36, 135–146. [Google Scholar]
  12. Tie, W.; Song, S. Research on tax policy and carbon emission based on STIRPAT model. J. Xi’an Univ. Financ. Econ. 2015, 28, 5–10. [Google Scholar]
  13. Wu, H. Analysis of the effect of China’s energy conservation and emission reduction tax policy. Tax. Res. 2016, 5, 58–61. [Google Scholar]
  14. Xu, H.C.; Zhang, X.J. Discussion on improving China’s green taxation system. Tax. Res. 2018, 9, 101–104. [Google Scholar]
  15. Fu, S.; Wang, J. Have green taxation policies reduced carbon emissions in China?—An empirical study based on the extended STIRPAT model. Mod. Econ. Inq. 2018, 2, 72–78. [Google Scholar]
  16. Zhou, D.; Luo, D.Q. The impact of industrial structure change on carbon emissions in China from the perspective of green taxation. Resour. Sci. 2021, 43, 693–709. [Google Scholar]
  17. Li, B.L.; Xiao, J.G. Green taxation to promote “carbon peaking” and “carbon neutrality”. China Tax. 2021, 5, 62–63. [Google Scholar]
  18. Ehrlich, P.R.; Holden, J.P. Impact of population growth. Science 1971, 171, 1212–1217. [Google Scholar] [CrossRef]
  19. Dietz, T.; Rosa, E.A. Rethinking the environmental impacts of population, affluence, and technology. Hum. Ecol. Rev. 1994, 1, 277–300. [Google Scholar]
  20. Xiang, J. Analysis and Prediction of Factors Influencing Carbon Emissions in Shenmu City, Shaanxi Province. Master’s Thesis, Shanghai University of Applied Technology, Shanghai, China, 2022. [Google Scholar]
  21. Ren, X.S.; Liu, Y.J.; Zhao, G.H. Impact of economic agglomeration on carbon emission intensity and transmission mechanism. China Popul.-Resour. Environ. 2020, 30, 95–106. [Google Scholar]
  22. Wu, J.X.; Guo, Z.Y. Convergence analysis of carbon emissions in China based on continuous dynamic distribution method. Stat. Res. 2016, 33, 54–60. [Google Scholar]
  23. Tao, F.; Zhao, J.Y.; Zhou, H. Does environmental regulation achieve “incremental improvement” in green technology innovation? Has environmental regulation achieved “incremental improvement” in green technology innovation—Evidence from the environmental protection target responsibility system. China Ind. Econ. 2021, 2, 136–154. [Google Scholar]
  24. Shi, M.X.; Liu, N. Can tax greening reduce carbon emissions?—An empirical analysis based on provincial panel data in China. Fisc. Sci. 2022, 10, 98–112. [Google Scholar]
  25. Wang, T.; Umar, M.; Li, M.; Shan, S. Green finance and clean taxes are the ways to curb carbon emissions: An OECD experience. Energy Econ. 2023, 124, 106842. [Google Scholar] [CrossRef]
  26. Zhang, H.M.; Yuan, P.F.; Zhu, Z.S. Population size, industrial agglomeration and carbon emissions in Chinese cities. China Environ. Sci. 2021, 41, 2459–2470. [Google Scholar]
  27. Hu, J.H.; Jiang, X. Study on the effect of urbanization on carbon emission from the perspective of urban agglomeration. J. China Univ. Geosci. (Soc. Sci. Ed.) 2015, 15, 11–21. [Google Scholar]
  28. Shi, B.Z.; Li, J.T. Does the Internet promote the division of labor: Evidence from Chinese manufacturing firms. Manag. World 2020, 36, 130–149. [Google Scholar]
  29. Tan, X.C.; Gao, J.X.; Zeng, A.; Xing, X.C. Assessment of the impact of green financial reform and innovation pilot zone policies on carbon emissions. Adv. Clim. Chang. Res. 2023, 19, 213–226. [Google Scholar]
  30. Zhang, C.L.; Zhang, F. The impact of ecological protection and industrial structure upgrading on carbon emissions--empirical evidence based on the data of China’s Yangtze River Economic Belt. Stat. Decis. Mak. 2022, 38, 77–80. [Google Scholar]
  31. Hansen, B.E. Threshold Effect in Non-dynamic Panels: Estimation, Testing and Inference. J. Econom. 1999, 93, 345–368. [Google Scholar] [CrossRef]
Figure 1. The mechanism of green taxation and carbon emissions.
Sustainability 15 14983 g001
Figure 2. Spatial distribution of total carbon emissions by cities in China’s Yangtze River Economic Belt in 2010 and 2020.
Sustainability 15 14983 g002
Figure 3. Spatial distribution of per capita carbon emission intensity of cities in China’s Yangtze River Economic Belt in 2010 and 2020.
Sustainability 15 14983 g003aSustainability 15 14983 g003b
Figure 4. Results of single-threshold estimation of urban greening level in China’s Yangtze River Economic Belt.
Sustainability 15 14983 g004
Table 1. Carbon dioxide emission factors.
Type of EnergyGasLiquefied Petroleum GasSocial Electricity ConsumptionRaw Coal
Carbon emission factors2.162253.10131.32031.9003
Unit Kg C O 2 /m3 Kg C O 2 /kg Kg C O 2 /kW·h Kg C O 2 /kg
Table 2. Definition of the main variables.
Variable TypesName of VariableVariable
Symbols
Variable DefinitionData Processing Methods
Explained variablesTotal carbon emissionsCM1Regional CO2 emissionsTake logarithm
Per capita carbon intensityCM2 R e g i o n a l   C O 2   e m i s s i o n s R e g i o n a l   y e a r     e n d   r e s i d e n t   p o p u l a t i o n Take logarithm
Explanatory variableGreen taxation intensityGT T o t a l   o f   t h e   s i x   g r e e n   t a x e s T o t a l   t a x   r e v e n u e Actual value, winsorize
Mediating variableLevel of green technology innovationPatentGreen patent applicationsTake logarithm
Threshold VariableCity greening levelGRGreening coverage rate of urban built-up areasActual value
Control
variables
Level of economic developmentRGDP R e g i o n a l   G D P R e g i o n a l   y e a r     e n d   r e s i d e n t   p o p u l a t i o n Take logarithm
Size of populationPRegional year-end resident populationTake logarithm
Level of urbanizationUbr U r b a n   r e s i d e n t   p o p u l a t i o n U r b a n   r e s i d e n t   p o p u l a t i o n + R u r a l   r e s i d e n t   p o p u l a t i o n Actual value, winsorize
Industrial structureIndOutput value of primary industry × 1 + output value of secondary industry × 2 + output value of tertiary industry × 3Take logarithm
Energy intensityEner L o c a l   e n e r g y   c o n s u m p t i o n R e g i o n a l   G D P Take logarithm
Level of external openingOpen T o t a l   i m p o r t   a n d   e x p o r t   t r a d e R e g i o n a l   G D P Actual value, winsorize
Table 3. Descriptive statistics of variables.
Variable
Types
Variable
Symbols
Mean ValueStandard
Deviation
Min. ValueMax. ValueNumber of Observations
Explained
variables
CM115.5551.15012.72118.8341100
CM29.5420.9836.62011.5591100
Explanatory
variable
GT18.7146.4615.68739.1621100
Mediating
variable
Patent5.6251.6101.6099.8211100
Threshold
variable
GR40.9334.3901457.1031100
Control
variables
RGDP10.7340.5939.06212.1011100
P6.0130.6444.2828.0741100
Ubr55.28212.41829.08587.2001100
Ind17.5770.95415.48220.7781100
Ener6.4410.6004.4978.7511100
Open16.53021.1270.458108.0421100
Table 4. Results of baseline regression analysis.
VariablesModel (1)Model (2)
L.CM10.116 ***
(0.013)
L.CM2 0.106 ***
(0.014)
GT−0.008 ***
(0.002)
−0.009 ***
(0.003)
RGDP0.460 ***
(0.159)
0.436 ***
(0.160)
P0.313 *
(0.185)
−0.623 ***
(0.180)
Ubr−0.017 ***
(0.005)
−0.016 ***
(0.005)
Ind0.592 ***
(0.182)
0.611 ***
(0.180)
Ener0.994 ***
(0.019)
1.001 ***
(0.019)
Open0.001
(0.001)
0.001
(0.001)
_Cons−8.787 ***
(0.720)
−8.520 ***
(0.713)
AR (1)0.0120.028
AR (2)0.3090.396
Hansen test0.6360.176
N10001000
Note: *** and * denote 1% and 10% significance levels, respectively; t-values are in parentheses; p-values are for AR (1), AR (2) and Hansen test. Source: Authors’ own work.
Table 5. Regression results of intermediate effect test.
VariablesModel (3)Model (4)Model (5)
Patent C M 1 C M 2
L.Patent0.424 ***
(0.057)
L.CM1 0.082 ***
(0.017)
L.CM2 0.081 ***
(0.017)
GT0.016 ***
(0.005)
−0.005 **
(0.002)
−0.006 **
(0.002)
Patent −0.088 ***
(0.024)
−0.088 ***
(0.023)
_Cons−13.740 ***
(2.841)
−11.271 ***
(1.094)
−11.221 ***
(1.050)
Control variablesYesYesYes
AR (1)0.0000.0030.003
AR (2)0.8730.2860.315
Hansen test0.6230.9970.996
N100010001000
Note: *** and ** denote 1% and 5% significance levels, respectively; t-values are in parentheses. Source: Authors’ own work.
Table 6. Results of the intermediate effect test.
Green Technology Innovation LevelTotal Carbon EmissionsCarbon Emissions Intensity per Capita
Indirect (intermediary) effects−0.001408−0.001408
Direct effects−0.005−0.006
Total effects−0.008−0.009
Intermediary effect/Total effect0.1760.156
Table 7. Results of regional heterogeneity test.
VariablesUpstreamMidstreamDownstream
Model (6)Model (7)Model (8)Model (9)Model (10)Model (11)
L.CM10.098 ***
(0.029)
0.175 ***
(0.033)
0.090 ***
(0.025)
L.CM2 0.126 ***
(0.044)
0.185 ***
(0.031)
0.082 ***
(0.022)
GT−0.010 *
(0.005)
−0.009 *
(0.005)
−0.012 **
(0.006)
−0.009 **
(0.004)
−0.014 ***
(0.003)
−0.014 ***
(0.003)
RGDP0.036
(0.184)
0.221
(0.396)
0.065
(0.461)
0.145
(0.513)
0.689 ***
(0.216)
0.706 ***
(0.227)
P−0.131
(0.190)
−0.972 ***
(0.300)
0.003
(0.402)
−0.743 *
(0.417)
0.534 ***
(0.202)
−0.365 *
(0.216)
Ubr−0.011
(0.006)
−0.020
(0.018)
−0.016 **
(0.006)
−0.016 **
(0.006)
−0.007 *
(0.004)
−0.007 *
(0.004)
Ind1.004 ***
(0.195)
0.934 ***
(0.264)
0.863 **
(0.401)
0.794 *
(0.423)
0.278
(0.198)
0.269
(0.208)
Ener0.916 ***
(0.055)
0.911 ***
(0.081)
0.960 ***
(0.037)
0.947 ***
(0.046)
1.016 ***
(0.032)
1.021 ***
(0.030)
Open−0.003
(0.004)
−0.004
(0.004)
0.004
(0.003)
0.004 *
(0.002)
0.000
(0.001)
−0.000
(0.001)
_Cons−8.364 ***
(1.070)
−9.231 ***
(2.496)
−8.084 ***
(1.062)
−8.291 ***
(0.987)
−7.196 ***
(0.557)
−7.230 ***
(0.581)
AR (1)0.0870.0660.0080.0130.0550.058
AR (2)0.1320.1840.1310.1120.2900.286
Hansen test0.4210.7800.3720.6290.8500.872
N240240350350410410
Note: ***, ** and * denote 1%, 5% and 10% significance levels, respectively; t-values are in parentheses; p-values are for AR (1), AR (2) and Hansen test. Source: Authors’ own work.
Table 8. Results of robustness tests.
VariablesModel (12)Model (13)Model (14)Model (15)
L.CM10.118 ***
(0.013)
0.096 ***
(0.013)
L.CM2 0.115 ***
(0.013)
0.090 ***
(0.013)
GT−0.007 ***
(0.002)
−0.008 ***
(0.002)
GT′ −0.162 ***
(0.035)
−0.184 ***
(0.038)
RGDP0.468 ***
(0.161)
0.438 ***
(0.165)
0.608 ***
(0.156)
0.665 ***
(0.182)
P0.341 *
(0.185)
−0.569 ***
(0.183)
0.452 ***
(0.172)
−0.389 *
(0.207)
Ubr−0.016 ***
(0.005)
−0.016 ***
(0.005)
−0.017 ***
(0.005)
−0.016 ***
(0.005)
Ind0.560 ***
(0.182)
0.591 ***
(0.183)
0.638 ***
(0.172)
0.581 ***
(0.201)
Ener0.995 ***
(0.020)
0.999 ***
(0.021)
0.976 ***
(0.020)
1.002 ***
(0.022)
Open0.001
(0.001)
0.001
(0.001)
0.003 ***
(0.001)
0.003 ***
(0.001)
_Cons−8.603 ***
(0.694)
−8.637 ***
(0.718)
−9.810 ***
(0.779)
−9.685 ***
(0.721)
AR (1)0.0130.0210.0110.026
AR (2)0.2610.3010.2270.207
Hansen test0.7710.7510.6150.424
N98098010001000
Note: *** and * denote 1% and 10% significance levels, respectively; t-values are in parentheses; p-values are for AR (1), AR (2) and Hansen test. Source: Authors’ own work.
Table 9. Results of the threshold effect test.
Number of ThresholdsExplained VariablesF-Valuep-ValueThreshold ValueBS Times
10%5%1%
Single Threshold C M 1 32.890.00419.147922.164829.45421000
C M 2 32.890.00519.179923.381230.30171000
Double Threshold C M 1 8.100.58416.044518.309526.41011000
C M 2 8.100.60915.868318.028224.66511000
Three-fold threshold C M 1 8.320.72820.928924.464432.03461000
C M 2 8.320.75321.156924.146630.02741000
Table 10. Results of threshold estimation.
Explained VariablesThreshold Values95% Confidence Interval
Total carbon emissions41.0308[40.9701, 41.0612]
Carbon emission intensity per capita41.0308[40.9701, 41.0612]
Table 11. Threshold model parameter estimation results.
Variable C M 1 C M 2
Regression Coefficientt-ValueRegression Coefficientt-Value
lnGT·I (GR ≤ 41.0308)−0.00848 ***(0.00107)−0.00848 ***(0.00107)
lnGT·I (GR > 41.0308)−0.00574 ***(0.00107)−0.00574 ***(0.00107)
RGDP0.612 ***(0.0471)0.612 ***(0.0471)
P0.672 ***(0.0639)−0.328 ***(0.0639)
Ubr0.00336 *(0.00188)0.00336 *(0.00188)
Ind0.302 ***(0.0435)0.302 ***(0.0435)
Ener1.032 ***(0.00937)1.032 ***(0.00937)
Open0.000108(0.000676)0.000108(0.000676)
_Cons−7.073 ***(0.386)−7.073 ***(0.386)
Note: *** and * denote 1% and 10% significance levels, respectively, and significance levels are marked with robust standard deviation estimates. Source: Authors’ own estimations.
Disclaimer/Publisher’s Note: The statements, opinions and data contained in all publications are solely those of the individual author(s) and contributor(s) and not of MDPI and/or the editor(s). MDPI and/or the editor(s) disclaim responsibility for any injury to people or property resulting from any ideas, methods, instructions or products referred to in the content.

