Article

Provenance Identification of Leaves and Nuts of Bertholletia excelsa Bonpl by Near-Infrared Spectroscopy and Color Parameters for Sustainable Extraction

by
Silvana Nisgoski
1,*,
Joielan Xipaia dos Santos
1,
Helena Cristina Vieira
1,
Tawani Lorena Naide
1,
Rafaela Stange
1,
Washington Duarte Silva da Silva
1,
Deivison Venicio Souza
2,
Natally Celestino Gama
2 and
Márcia Orie de Souza Hamada
2
1
Department of Forest and Technology Engineering, Federal University of Paraná, Curitiba 80210-170, Paraná, Brazil
2
Forest Engineering, Federal University of Pará, Altamira 68440-000, Pará, Brazil
*
Author to whom correspondence should be addressed.
Sustainability 2023, 15(21), 15606; https://doi.org/10.3390/su152115606
Submission received: 19 September 2023 / Revised: 20 October 2023 / Accepted: 2 November 2023 / Published: 3 November 2023
(This article belongs to the Section Sustainable Forestry)

Abstract

:
The Brazil nut tree is considered symbolic of the Brazilian Amazon in function of its great importance, being one of the most significant extractivist products and a subsistence practice of the Indigenous people in many municipalities in Pará state. One of the main problems in different communities is related to the marketing process since it is not possible to distinguish the origin of the nuts and this causes inconvenience. The study evaluated the potential of VIS/NIR spectroscopy to identify the origin of leaves and nuts from Brazil nut trees growing in two indigenous villages, in the Xipaya Indigenous Lands, Pará state. Analysis was performed based on CIEL*a*b* parameters and using VIS (360–740 nm) and near-infrared spectra (1000–2500 nm). The samples were differentiated according to means tests, principal component analysis (PCA), and classification analysis based on k-NN. Color parameters and spectra were similar in both communities. Classification models based on k-NN produced adequate results for the distinction of villages in all evaluated situations, with accuracy of 98.54% for leaves, 89% and 90.91% for nuts with and without shell, respectively. Near infrared can be applied in forests as a technique for previous provenance identification and contribute to the subsistence and sustainable practice of extraction.

1. Introduction

The Brazil nut tree (Bertholletia excelsa Bonpl.) is from the Lecythidaceae family, and is considered symbolic of the Brazilian Amazon in function of its social, ecological and economic importance. Although it is also found in forests in Venezuela, Colombia, Peru, Bolivia, and the Guianas, the densest stands are found in Brazil [1]. It is an endemic species found in upland (terra firme) forest areas. The nuts are one of the most important extractivist products in the Amazon region [2] and are among the main forest products in many municipalities in Pará, such as Altamira. The collection and processing of Brazil nuts economically sustain many communities in the Amazon and, at the same time, promote forest conservation [3].
The Amazonian forests are rich in plant and animal species, as well as in non-timber forest products, which are considered one of the great strategies that best conserve biodiversity [4]. Among the non-timber forest products of the Brazilian Amazon, the Brazil nut is the most well-known and established in domestic and export markets. Its collection is carried out almost exclusively in tropical forests [5,6]. In this sense, it is important to highlight that the use and commercialization of Brazil nuts are responsible for the increase in income generation for rural, urban, and Indigenous populations, as well as riverside communities in almost all regions of northern Brazil.
The influence of collecting nuts from Bertholletia excelsa in a managed population in the Caxiuanã National Forest (Pará) was analyzed by Sousa et al. [7]. In the study, the authors concluded that even with the intense collection of almonds, the population of Brazil nut trees presented a state of dynamic equilibrium, with a high frequency of regenerating and young individuals that are fundamental for the replacement of senescent adults. Combining the possibility of using nuts from Bertholletia excelsa, and the awareness of local communities to conserve the Amazon rainforest allows for the continuity of Brazil nut tree stands in a sustainable way, guaranteeing socio-economic well-being, reconciling with the maintenance and sustainable use of forest products, as well as contributing to the strengthening of their socio-cultural relations.
The Xipaia Territory is located in the Amazon Forest in the municipality of Altamira, State of Pará, known as “Terra do Meio”, and is part of the mosaic of protected areas in the region. Its wealth is not restricted to its enormous natural heritage but is also due to Indigenous cultural traditions. Bearing in mind that extractivism has always been one of the livelihoods of indigenous communities in this region, especially the collection of Brazil nuts, and currently, in addition to being intrinsically and naturally linked to the culture of this people, it is necessary to rethink these factors from the economic and social point of view (survival) of balancing relationships from the perspective of income generation inside and outside the indigenous territories as a whole [8].
One of the main problems in both communities is related to the marketing process since it is not possible to distinguish the origin of the nuts. This causes inconvenience because buyers usually want to differentiate the origin. So, the use of nondestructive techniques, such as colorimetry and near-infrared spectroscopy (NIR), for the discrimination of leaves and nuts can be important. The techniques were chosen because they are fast, noninvasive, and can be applied for qualitative and quantitative analyses. The great advantage is the speed of analysis since there is a large database for comparison, not requiring extensive knowledge of plant anatomy/morphology. Another advantage is that the material can be reused. Some disadvantages include the need for a large database for each analysis and the transference of calibration models between different equipment.
NIR is a fast and nondestructive procedure with satisfactory results in different applications, such as the identification or discrimination of forest species, and calibration for determination of physical, chemical, mechanical, and anatomical characteristics [9,10,11,12]. In relation to seeds and nuts, studies have applied NIR spectroscopy to evaluate viability [13], origin [14], and identification [15]. Also, Teixeira and Sousa [16] reviewed the use of NIR to estimate qualitative and quantitative parameters for a wide range of nuts, describing advantages and limitations of the technique. However, studies using NIR to identify the origin of nuts and seeds in the Amazon Forest are scarce.
Likewise, colorimetry can be used for species discrimination based on leaves or other plant parts. It relies on the definition of the CIE (Commission Internationale de L’Eclairage), based on three parameters: luminosity or clarity, tonality or hue, and saturation or chromaticity. Luminosity is represented by L* and is related to the position on the black-white axis; parameters a* and b* represent the position on the green-red and blue-yellow axes, respectively. Also, these data can be used to calculate the saturation (C*) and hue angle (h) [17].
We highlight that there is a lot of research on Bertholletia excelsa Bonpl, regarding wood and the phytogeography of the species. However, there is still a lack of studies/research focused on leaves and nuts. Because of the importance of the preservation of the Brazil nut tree, this study had the principal objective of verifying the use of VIS/NIR spectroscopy and colorimetry to discriminate the origin of leaves and nuts of Bertholletia excelsa Bonpl, which were collected in two indigenous communities in the municipality of Altamira, Pará state, Brazil, and contribute information for a sustainable process of extractions and commerce. Also, we aim to increase the database of color and VIS/NIR spectra of research groups for future commercial or in-field application.

2. Material and Methods

2.1. Leaf Samples and Characterization

The collection of leaves from Bertholletia excelsa Bonpl. was completed in the Xipaya Indigenous Lands, in the villages Tukamã and Tukayá, located in Altamira, Pará, Brazil. Tukamã is on the left bank of the Iriri River and Tukayá is on the right bank of the Curuá River (Figure 1). The collection was carried out in April 2018; the climate in the region is equatorial type Am and Aw according to the Köppen classification. The average temperature is 26 °C and annual precipitation is 1680 mm.
A total of 30 leaves from Bertholletia excelsa Bonpl. were collected, 15 in Tukamã and 15 in Tukayá, one per tree (spaced 100 m apart). Leaves were obtained from the first bifurcation of the tree, with mean dimensions of 170 × 30 × 1 mm (length, width and thickness). A slingshot was used to shoot rocks into the canopy to knock down green leaves, a more suitable method due to the region and species characteristics like forest density and tree height. Leaves were evaluated and only material with good sanitary conditions, i.e., without any damage by fungus or others physiological status, were selected. They were stored in zip lock bags with silica for moisture content control and were taken to the Wood Anatomy and Quality Laboratory of Federal University of Paraná. The access to the material was registered with the Brazilian Council for Management of Genetic Heritage (CGEN/SISGEN) under number AB1CA7A.
To characterize the morphology of the Brazil nut leaves, the material was diaphanized as described by Kraus and Arduin [18]. The material was clarified by soaking in 10% sodium hydroxide for 48 h. Then, the leaves were immersed in 50% sodium hypochlorite for 15 min and washed with tap water. The samples were stained with 1% safranin for 30 min, dehydrated in a rising ethyl alcohol series (50%, 70%, 90%, 100%) and diaphanized with xylol. For leaf venation analysis, leaf sections with 2 mm thickness were mounted on slides with glass varnish. Images were obtained with a stereomicroscope Zeiss Discovery V12 (Carl Zeiss, Göttingen, Germany) and a digital camera. Leaves were classified according to the Manual of Leaf Architecture of the Leaf Architecture Working Group and the techniques recommended by Obermüller [19].

2.2. Brazil Nut Samples

To test other possibilities of identifying origin, 50 nuts were collected randomly from 15 trees each in Tukamã and Tukayá, the same trees used for leaf collection. The nuts were washed in tap water and dried at room temperature until moisture content stabilization was achieved.

2.3. Soil Samples

To verify the influence of soil parameters, three soil samples were collected in each village with an auger from top layer (depth of 0 to 0.20 m). The material was homogenized, exposed to sun for 2 h, and sent for analysis at the Soil Laboratory of the Embrapa Eastern Amazon research unit (Embrapa Amazônia Oriental, Belém, Brazil), in Pará. Material was evaluated in accordance with laboratory standards, as follows: (i) determination of P, K and Na: extraction with Mehlich 1 solution (H2SO4 0.0125 mol L−1 + HCl 0,05 mol L−1); (ii) determination of Ca, Mg and Al: extraction with KCl 1 mol L−1.

2.4. Color Parameters

Leaf color was determined based on the CIELab (1976) system, with a CM-5 spectrophotometer (Konica Minolta, Tokyo, Japan) using the Spectra Magic NX software (version 2.7), with D65 illuminant, a diffuse xenon lamp that simulates the daytime solar radiation, and observation angle of 10°, with a 3 mm sensor aperture diameter. For each leaf, 10 random readings were performed on the adaxial surface, avoiding the central rib and oxidation points, for a total of 300 readings. Visible spectra were obtained in the range 360–740 nm, and colorimetric parameters of luminosity (L*), green-red chromatic coordinate (a*) and blue-yellow chromatic coordinate (b*) were recorded. Then the chroma (C*) and hue angle (h) were calculated in accordance with C* = (a*2 + b*2)½ and h = arctan (b*/a*), respectively.

2.5. NIR Spectra

NIR spectra were obtained with a Tensor 37 (Bruker Optics, Ettlingen, Germany) spectrometer with an integrating sphere, operating in diffuse reflectance mode in the range 1000–2500 nm, with resolution of 1 nm and 64 scans. The spectra were obtained by placing the samples directly on top of the integrating sphere. For each leaf, 10 spectra were collected directly from the adaxial surface, for a total of 300 spectra. For each Brazil nut, spectra were first collected from samples with their shell and then after the manual removal of the shell. For each nut, 10 spectra were obtained, for a total of 1000 spectra from nuts with shells and 990 from nuts without shell, since nuts from Tukamã were empty. Since the nut surface is irregular, all data were collected in flatter areas in all situations.

2.6. Means Tests

Colorimetric data from the 30 leaves were submitted to the Kolmogorov-Smirnov (K-S) test, to verify the normality, and then the Tukey test, both at 95% probability (α = 0.05). All analysis was conducted in R software (version 3.4.3).

2.7. Principal Component Analysis (PCA)

PCA was performed with the R software, applying the FactoMineR [20] and factoextra packages [21], to determine the group formation in function of origin (Tukamã or Tukayá). The visible spectra of leaves and NIR spectra of leaves and nuts were analyzed by applying the second derivative of Savitzky-Golay, with 3 and 15 smoothing points, respectively.

2.8. Classification Models

To verify the potential to discriminate the origin of samples, the k-nearest neighbors (k-NN) classification algorithm was applied to the NIR spectra of leaves and nuts. The classification and regression (caret) function in R [22] was used, and accuracy and precision were evaluated for each spectrum. This version has a tuning hyperparameter k, which is the number of nearest neighbors. By default, the algorithm uses the Euclidean metric to calculate the distance between the observation and the uniform weight for the nearest neighbors. For model tests, data were divided using stratified random sampling in function of village into learning (70%) and testing (30%) blocks. The k-fold repeated cross-validation method (5-fold cross-validation, repeated ten times) based on stratification and blocking was used to estimate the performance of the classifier. The learning of predictive models was completed through the CARET package interface, a framework available in R language for classification and regression analysis. In the preprocessing phase, all predictors were centered and scaled.

3. Results

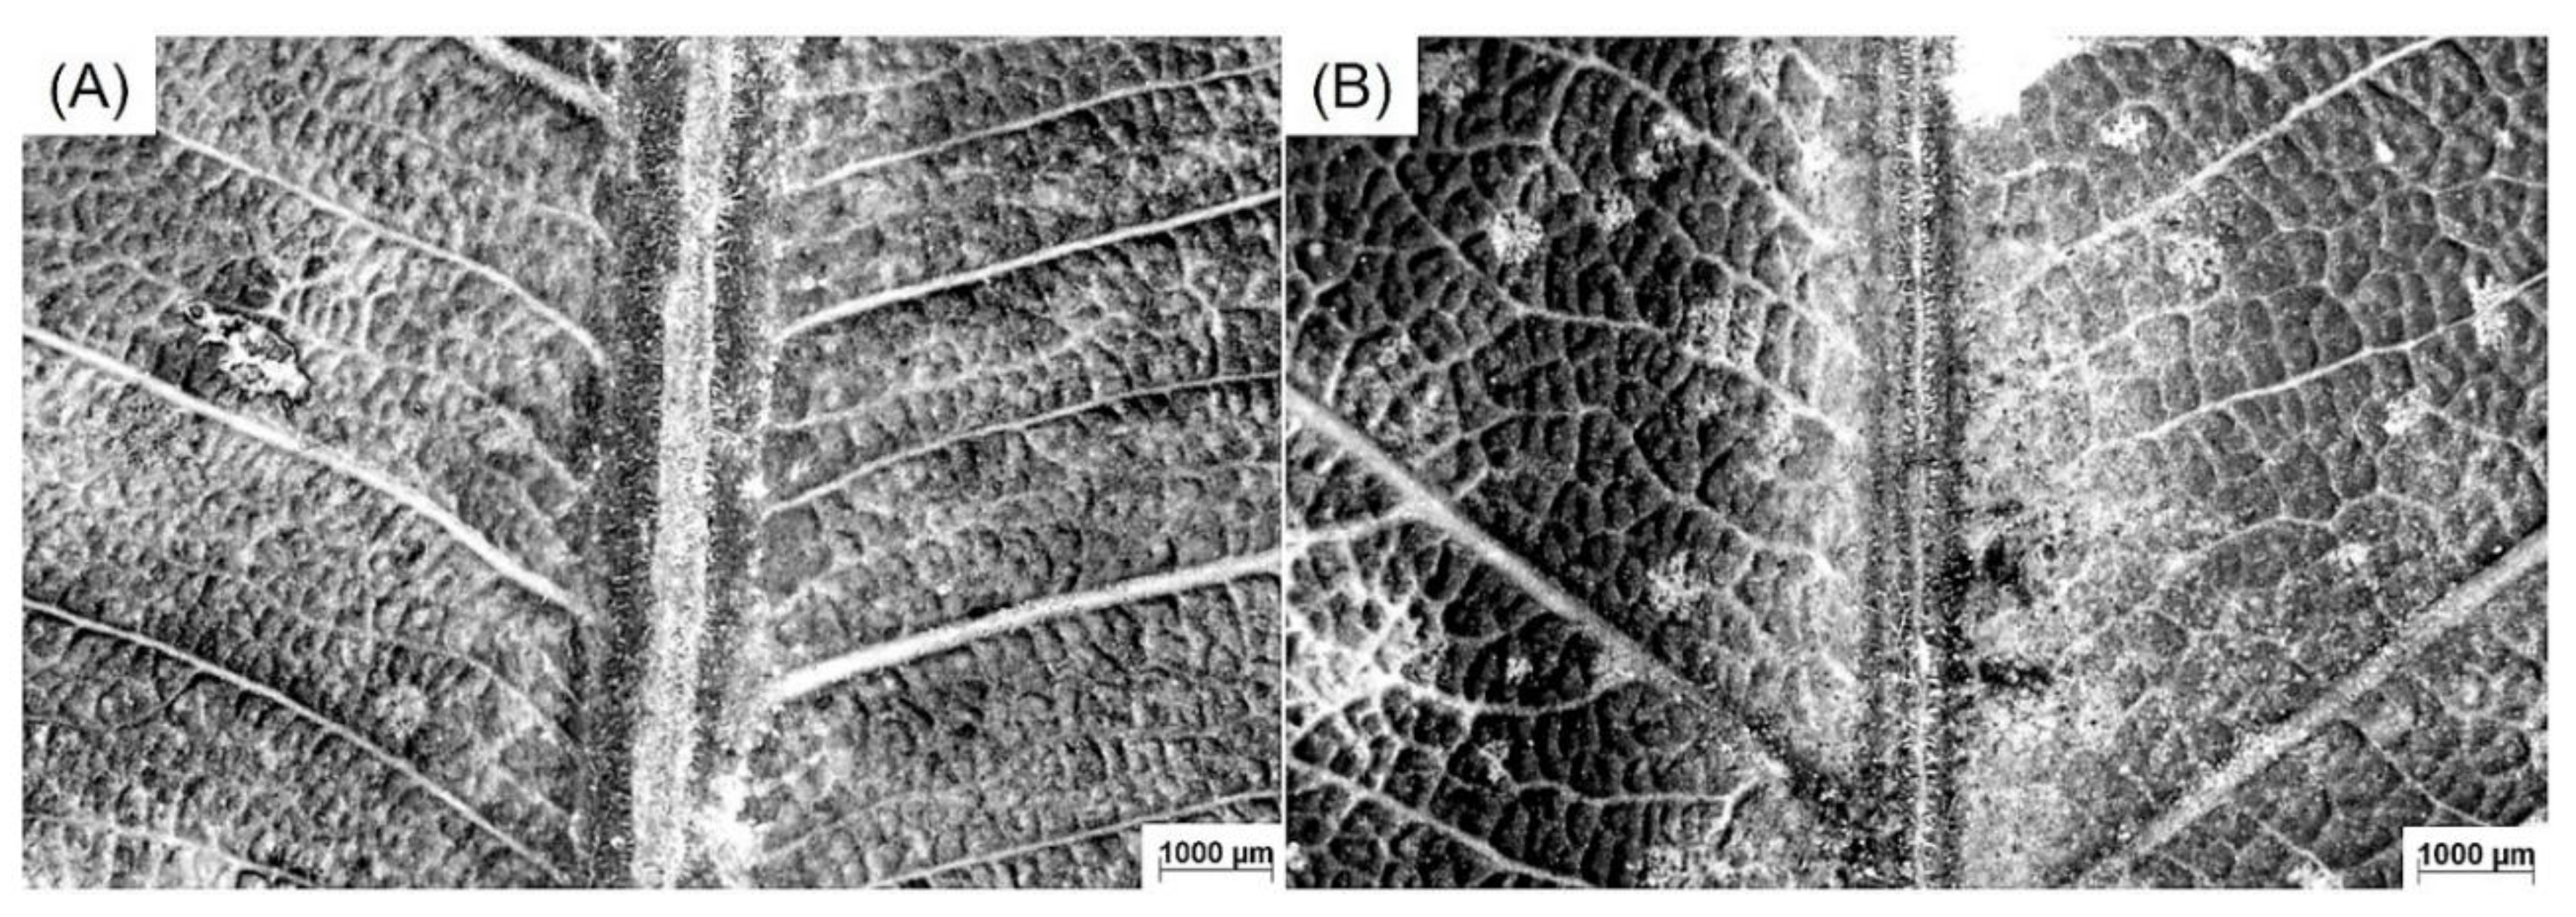
3.1. Leaf Morphology

Leaves from Brazil nut trees from both communities had similar characteristics. Figure 2 illustrates the abaxial surface of leaves from Tukayá (Figure 2A) and Tukamã (Figure 2B).
No differences were found between leaves from the two communities. General characteristics are as follows: leaves were simple and alternate; petiole canaliculate, haired, with marginal insertion, symmetric with 30 cm length and 13 cm width; laminar size mesophyll (variation from 4.5–18.2 mm2), obovate-oblong shape; base convex with acute angle; apex with obtuse angle, cuspidate; all or some margin crenulate, glabra, coriaceous. Vein of 1st category pinnate; vein of 2nd category slightly brochidodromous, uniformly spaced, crescent angle in apex direction, inter-secondary vein present; vein of 3rd category alternate percurrent, sinuous symmetry, ramified in direction to 2nd vein, obtuse angle and decrescent variation; vein of 4th category alternate percurrent and 5th category dichotomic; areoles were moderately developed; last fine leaf vein with two or more ramifications; and marginal vein lobate.

3.2. Soil Composition

The chemical composition of soil was evaluated to corroborate the results from colorimetry and VIS/NIR spectroscopy because of the presence of two rivers, Iriri and Curuá (Figure 1). Contents of P, K, Na, and pH were greater in Tukamã, while Al, Ca, and Ca + Mg were higher in Tukayá (Table 1). Data interpretation indicated the degree of soil weathering, which was more evident in Tukayá.

3.3. Color Data and Visible Spectroscopy

Mean values of colorimetric parameters (Table 2) of leaves indicated similarity, with h being the only parameter with statistical difference between communities.
The visible spectra (Figure 3a) also indicated similarity in Brazil nut leaves between the two indigenous villages. According to the score graph (Figure 3b) from the principal component analysis of second derivative spectra in the range 360–740 nm, PC1 represented 55% and PC2 16% of total data variation, but PCA was not able to differentiate the origin of leaves, i.e., distinguish between those from Tukamã and Tukayá.

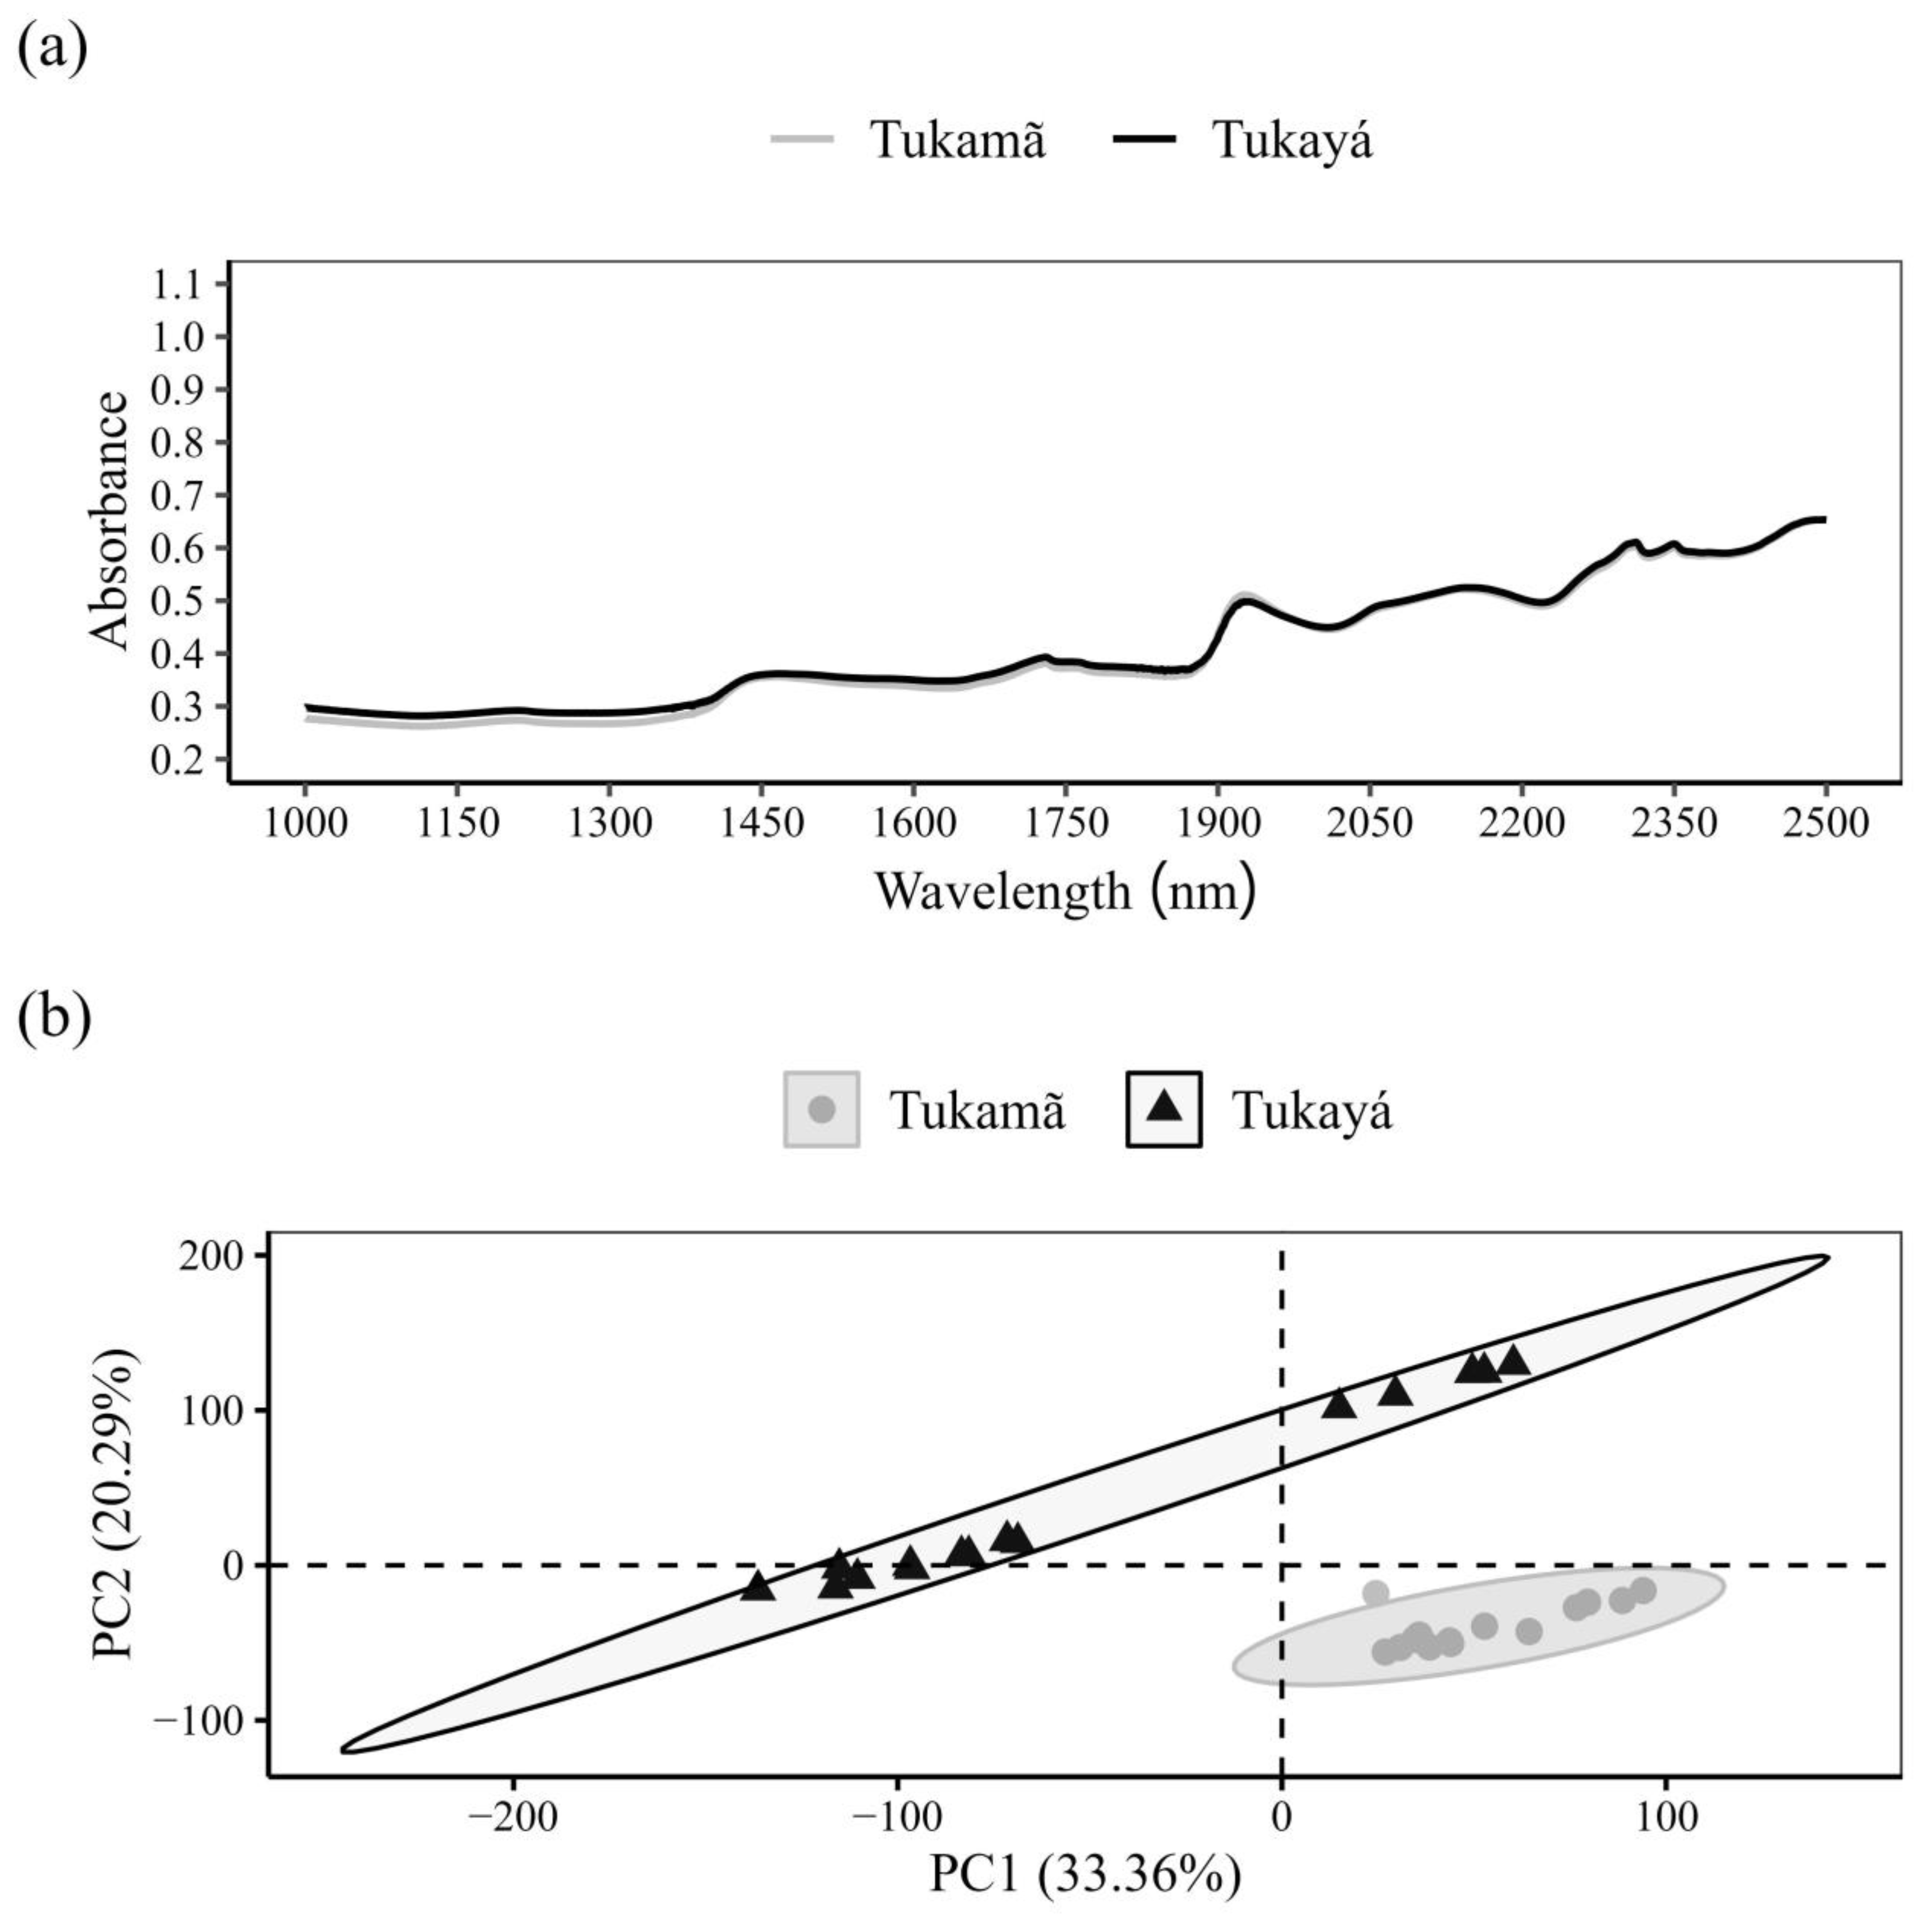
3.4. NIR Spectroscopy–Leaves

Raw NIR spectra (Figure 4a) of leaves also indicated their similarity.
PCA of second derivative NIR spectra (Figure 4b) indicated that PC1 represented 33.36% and PC2 20.90% of total data variation from the two communities, and also indicated the separation of leaves based on origin i.e., Tukamã or Tukayá. Also, leaves from Tukamã had greater similarity, being more grouped in comparison to Tukayá.

3.5. NIR Spectroscopy–Nuts

NIR spectra of nuts with (Figure 5a) and without shell (Figure 5b) were also similar in both communities, as expected. To verify the possibility to identify origin of the Brazil nuts, PCA was carried out with second derivative NIR spectra of nuts with and without shell. In nuts with shell (Figure 5c), many samples were grouped, while without shell (Figure 5d), better separation was found, with samples from Tukayá more grouped, but still some samples were mixed. The grouping results of nuts without shell were opposite those of leaves (Figure 4b), where material from Tukamã was more grouped and Tukayá less grouped.

3.6. Classification Tests

To evaluate the possibility of identifying the origins of the leaves and nuts by near infrared spectroscopy, we tested a k-NN classification model (Table 3) with second derivative spectra.

4. Discussion

4.1. Leaf Morphology and Soil Composition

Leaf morphology, growth characteristics [23], and chloroplast movement [24] can change the optical properties and influence color parameters. Chemical content, pigments, and chlorophyll, related to phenological and physiological functions of plants, can be related to different wavelengths [25,26] and interfere in species identification.
In this study, no differences were found in morphology between leaves from the two communities, but in the classification test, the leaves were the material more indicated to distinction of the origin of Bertholletia excelsa, probably in function of its chemical composition that was not evaluated in this study. Other inferences can be related to soil characteristics that present higher content of K and Na, and lower Al content in Tukamã.
Soil is a determining factor for the architecture and anatomy of leaves, their area and mass, and also adaptive mechanisms such as trichomes and the presence of essential oils [27]. Leaf analysis must consider the availability and mobility of macro and micronutrients in plants, derived from their availability in soil, and also the presence of metals and pH level.
Aluminum is a toxic element to plants, and interferes in absorption of other elements, such as phosphorous, magnesium, calcium and potassium. It is more available in acid environments lower than pH 5.5, commonly known as Al+3 [28]. The presence of aluminum can directly influence the chlorophyll composition because it acts to inhibit potassium, a nutrient that increases nitrogen absorption [29].
Potassium is highly mobile in plants, contributing significantly to various processes, such as enzymatic activation, pH regulation, and photosynthesis [30]. Nitrogen is the most fundamental element for the growth and development of plants, as a constituent of chlorophyll, amino acids, enzymes, hormones, and vitamins [31].
The presence of aluminum can influence the amount and composition of chlorophyll, an organic substance directly detectable by NIR spectroscopy of vegetal tissues. In turn, potassium can be verified in function of its association with organic acids [32]. Thus, the dissimilarity between edaphic characteristics of soils from Tukamã and Tukayá, with highlight to K, Na and Al content, might have influenced the separation of leaves and nuts, but more details are necessary, both in this respect, and in the chemical analysis of leaves and nuts, in order to corroborate observation.

4.2. Color Data and Visible Spectroscopy

The similarity between communities in leaves colorimetric parameters (Table 2) was expected, since individuals of the same species tend to present similar color data, principally in function of chlorophyll content, associated with green color, and anthocyanin, associate with blue color [33]. Differences in colorimetric parameters in the same species have been reported in function of moisture content and growing conditions [34], and a positive correlation between the decrease in chlorophyll content and green-red chromatic coordinate was described in yerba mate [35]. Some distinction in soil composition between Tukamã and Tukayá did not influence this parameter. On the other hand, color parameters within species from the same genus are reported to be associated with individual chemical composition [36].
In relation to visible spectra (Figure 3a), some fine visual separation occurred at wavelengths from 530–570 nm, a region correlated to chlorophyll content [37]. The literature also reports regions at 430 and 445 nm as corresponding to carotenoids, at 531 and 570 nm to xanthophylls, bands at 550–680 nm, and a peak at 700 nm to chlorophyll [38]. Tigabu et al. [15] reported peaks at 613 and 674 nm as relevant in discriminating seeds of Betula pendula and B. pubescens.
The use of visible spectra in a previous analysis (Figure 3b) to verify the grouping of samples in function of origin indicate the confusion of material from Tukayá and Tukamã, with no separation of origin. In this evaluation, differences in soil conditions were not important for material discrimination.

4.3. NIR Spectroscopy

NIR spectra (Figure 4a) of leaves from two communities indicated their similarity. Some fine differences were observed from 1000–1400 nm, region correlated to polysaccharides, lipids, and proteins, components that are all present in cell structure. Bands near 1195 nm can be associated with CH and CH3 groups; wavelengths at 1446–1447 nm are related to CH combination of aromatics; and regions near 1460 and 1490 nm are associated with NH stretching and urea [9,39,40].
On the other hand, the literature describes differences in NIR spectra in function of leaf age, harvesting period, chlorophyll, and nitrogen content, and also physiological characteristics of plants [41,42,43,44]. The similarity in Bertholletia leaves in this study are in accordance with the conclusion of Richardson et al. [45]: that evaluating leaves of Picea rubens Sarg. and Abies balsamea from different mountains and altitudes verified that spectral differences are greater between samples from different species and smaller between samples from different elevations/mountains. Also, Asner et al. [46] confirmed spectral variation in Amazonian species encompassing elevations of 3400 m and soil fertility gradients, describing inter-specific variation in phylogeny-dominated spectra within the given community.
Cavender-Bares et al. [47] evaluated leaf spectra within the genus Quercus, describing that spectral data differentiated populations within a species, and spectral similarity was significantly associated with phylogenetic similarity among species. On the other hand, Borraz-Martinez et al. [48] used NIR spectroscopy to distinguish Prunus dulcis varieties based on young/adult, fresh/dried, and dried powdered leaves, with a combination of first-derivative and mean-centered data along with SNV, describing the study as a first step towards consolidating the use/implementation of the technique for quality control in industry.
The use of second derivative NIR spectra of leaves in a PCA analysis (Figure 4b) indicates grouping formation in function of the communities where samples were collected, and the possibility of applying NIR technique for differentiation of Bertholletia excelsa. For leaves, NIR spectroscopy was also efficient in discriminating varieties of Cryptomeria japonica (L. f.) D. Don [49], Pinus species [36], and various native Amazonian species [9,10].
As expected, NIR spectra of nuts with (Figure 5a) and without shell (Figure 5b) were similar in both communities. Some differences were observed in raw spectra from 2000–2500 nm in nuts with shell, and from 1400–2500 nm in nuts without shell. Other literature describes comparable regions in distinction of seeds from other species. Peaks at 1312, 1915, and 2142 nm were defined as much more important for identification of the seed origin of Picea abies (L.) Karsten, collected in Sweden, Finland, Poland, and Lithuania [14], and peaks at 1458, 1509, 1848, 1944, 2211 and 2336 nm were highly relevant for the discrimination of two Betula species [15].
Promising results of NIR spectrometer have been described in the literature to verify the viability of seeds of Pinus species [13], while the use of second derivative NIR spectra was effective to ascertain age and geographic origin of Torreya grandis seeds [50]. On the other hand, Teixeira et al. [16] described some limitations of the method, such as the need for chemometric tools to extract more important spectral information, influence of moisture, and the lack of validated intra and inter laboratory spectral databases.
A great number of NIR studies based on seeds are related to conifers; for example, the discrimination of Pinus sylvestris based on seeds collected from maternal and paternal parents in three localities in Sweden [51]; the distinction of Larix × eurolepis from Larix decidua and Larix kaempferi seeds describing variations in spectra as a function of moisture, color and contents of fatty acids and proteins [14]; and the discrimination of Picea pinea applying PLS-DA [52], with the objective of selecting material for forest plantations.
Related to comestible seeds and with the objective of quality control, as was this study with the Brazilian nut, some studies confirm the authentication of walnut [53] and agroforestry-grown coffee samples [54] and the discrimination of cacao nibs [55], indicate that the use of NIR spectra is a promising tool.

4.4. Classification Tests

The results of the classification test with NIR spectra (Table 3) for all samples were adequate for the prediction of origin of leaves and nuts from Bertholletia excelsa, with a higher precision for leaves. These results are similar to those obtained by Mees et al. [41], evaluating leaves of Coffea sp. and applying soft independent modeling of class analogy (SIMCA).
We applied k-NN classification with accuracy above 98% for leaves. Evaluating Eucalyptus globulus and E. nitens, Castillo et al. [56] did not observe a significant difference between k-NN classification, SIMCA and PLS-DA, and recommended the use of leaves and NIR spectroscopy for fast classification in forest applications.
The results obtained for nuts were worse than described for other forest seeds. For example, Farhadi et al. [14] reported a precision between 95–99% when evaluating the origin of Picea abies seeds with a classification model developed for orthogonal projection to latent structure-discriminant analysis, and with the same procedure, Tigabu et al. [15] described a precision of 99–100% for identification of Betula species, and Huang et al. [57] described the separation of seven species of pine nuts applying machine based learning on multilayer perceptron (MLP) networks with accuracy close to 99%.
On the other hand, precision results obtained in classifications for nuts are similar to information described by Rojas-Rioseco et al. [58], analyzing seedlings of Araucaria araucana (Mol.) K Koch produced with seeds sampled from 12 locations of the species’ natural distribution in Chile, discriminating the material based on PCA and SIMCA, with accuracy above 88%.
Differences occurred, but NIRS may allow for in situ plant analysis in the future, even with unstable environmental conditions that affect the robustness and repeatability of calibration models built from field-collected samples. Improvements in portable NIRS instruments opened the opportunity for the on-site analysis of plant samples as a rapidly maturing technology [59].

5. Conclusions

Color parameters and spectra were similar in both communities and were not efficient in distinguishing the origin of Bertholletia excelsa leaves. Near infrared was promising in discriminating the leaves and nuts from Tukamã and Tukayá, and second derivative data from leaves had the best performance. Classification models based on k-NN produced adequate results for distinction of villages in all evaluated situations, with accuracy levels of 98.54% for leaves, 89% and 90.91% for nuts with and without shell, respectively.
For industrial practical application to determine origin of Brazil nuts, more data are necessary to expand the database with leaves and nuts from other regions. There are portable instruments that can be acquired by Indigenous association in cooperation with government agencies or industries; these can contribute to the previous classification and improve conscientization of people for a sustainable exploitation of nut trees with a higher commercial value, and also improve indigenous people subsistence. Also, some limitations must be considered and analyzed in future, for example the economic viability of applications of models developed in this research.

Author Contributions

Each author presented relevant contribution to elaboration of the present manuscript as follows: conceptualization, S.N. and J.X.d.S.; formal analysis, S.N., J.X.d.S., H.C.V. and D.V.S.; investigation, M.O.d.S.H.; methodology, J.X.d.S.; writing—original draft, S.N., J.X.d.S., H.C.V. and D.V.S.; writing—review and editing, H.C.V., T.L.N., R.S., W.D.S.d.S. and N.C.G. All authors have read and agreed to the published version of the manuscript.

Funding

Funding was provided by the Fundação Araucária (project 4206), National Council for Scientific and Technological Development (CNPQ–303352/2022-1) and Office to Coordinate Improvement of University Personnel (CAPES, Finance Code 001).

Data Availability Statement

Data are available by request to corresponding author.

Conflicts of Interest

The authors declare no conflict of interest.

References

  1. Scoles, R.; Gribel, R.; Klein, G.N. Crescimento e sobrevivência de castanheira (Bertholletia excelsa Bonpl.) em diferentes condições ambientais na região do rio Trombetas, Oriximiná, Pará. Bol. Mus. Para. Emílio Goeldi Ciências Nat. 2011, 6, 273–293. [Google Scholar] [CrossRef]
  2. IBGE/SIDRA. Produção da Extração vegetal e da Silvicultura. 2020. Available online: http://www.sidra.ibge.gov.br (accessed on 29 May 2020).
  3. Homma, A.K.O. Plant extractivism or plantation: What is the best option for the Amazon. Estud. Avançados 2012, 26, 167–186. [Google Scholar] [CrossRef]
  4. Tonini, H.; Pedrozo, C.Â. Variações anuais na produção de frutos e sementes de Castanheira-do-Brasil (Bertholletia excelsa Bonpl., Lecythidaceae) em florestas nativas de Roraima. Rev. Árvore 2014, 38, 133–144. [Google Scholar] [CrossRef]
  5. Peres, C.A.; Baider, C.; Zuidema, P.A.; Wadt, L.H.; Kainer, K.A.; Gomes-Silva, D.A.P.; Salomāo, R.P.; Simȯes, L.L.; Franciosi, E.R.N.; Valverde, F.C.; et al. Demographic threats to the sustainability of Brazil not exploitation. Science 2003, 302, 2112–2114. [Google Scholar] [CrossRef] [PubMed]
  6. Salomão, R.D.P. Densidade, estrutura e distribuição espacial de castanheira-do-brasil (Bertholletia excelsa H. & B.) em dois platôs de floresta ombrófila densa na Amazônia setentrional brasileira. Bol. Do Mus. Para. Emilio Goeldi Ciências Nat. 2009, 4, 11–25. [Google Scholar]
  7. Sousa, D.G.; De Almeida, S.S.; Do Amaral, D.D. Estrutura de uma população manejada de castanheira (Bertholletia excelsa) na Floresta Nacional de Caxiuanã, Pará. Bol. Do Mus. Para. Emílio Goeldi Ciências Nat. 2014, 9, 353–370. [Google Scholar] [CrossRef]
  8. AIPHX (Associação Indígena Pyjahyry Xipaia). Relatório gerencial consolidado da executora. In Plano Básico Ambiental—Componente Indígena Programa de Atividades Produtivas; JGP: Sao Paolo, Brazil, 2023. [Google Scholar]
  9. Durgante, F.M.; Higuchi, N.; Almeida, A.; Vicentini, A. Species spectral signature: Discriminating closely related plant species in the Amazon with near-infrared leaf-spectroscopy. For. Ecol. Manag. 2013, 291, 240–248. [Google Scholar] [CrossRef]
  10. Lang, C.; Costa, F.R.C.; Camargo, J.L.C.; Durgante, F.M.; Vicentini, A. Near infrared spectroscopy facilitates rapid identification of both young and mature Amazonian tree species. PLoS ONE 2015, 8, 134–521. [Google Scholar] [CrossRef]
  11. Lang, C.; Almeida, D.R.A.; Costa, F.R.C. Discrimination of taxonomic identity at species, genus and family levels using Fourier Transformed Near-Infrared Spectroscopy (FT-NIR). For. Ecol. Manag. 2017, 406, 219–227. [Google Scholar] [CrossRef]
  12. Tsuchikawa, S.; Kobori, H. A review of recent application of near infrared spectroscopy to wood science and technology. J. Wood Sci. 2015, 3, 213–220. [Google Scholar] [CrossRef]
  13. Tigabu, M.; Daneshvar, A.; Jingjing, R.; Wu, P.; Ma, X.; Odén, P.C. Multivariate discriminant analysis of single seed near infrared spectra for sorting dead-filled and viable seeds of three pine species: Does one model fit all species. Forests 2019, 10, 469. [Google Scholar] [CrossRef]
  14. Farhadi, M.; Tigabu, M.; Pietrzykowski, M.; Danusevičius, D.; Odén, P.C. Application of near infrared spectroscopy for authentication of Picea abies seed provenance. New For. 2017, 48, 629–642. [Google Scholar] [CrossRef]
  15. Tigabu, M.; Farhadi, M.; Stener, L.G.; Odén, P.C. Visible + Near Infrared spectroscopy as taxonomic tool for identifying birch species. Silva Fenn. 2018, 52, 9996. [Google Scholar] [CrossRef]
  16. Teixeira, A.M.; Sousa, C. A review on the application of vibrational spectroscopy to the chemistry of nuts. Food Chem. 2019, 277, 713–724. [Google Scholar] [CrossRef] [PubMed]
  17. Camargos, J.A.A.; Gonçalez, J.C.A. A colorimetria aplicada como instrumento na elaboração de uma tabela de cores de madeira. Bras. Florest. 2001, 71, 30–41. [Google Scholar]
  18. Kraus, J.E.; Arduin, M. Manual Básico de Métodos em Morfologia Vegetal; EDUR: Seropédica, Brazil, 1997; 198p. [Google Scholar]
  19. Obermüller, F.A.; Daly, D.C.; Oliveira, E.C.; Souza, H.F.T.P.; Oliveira, H.M.; Souza, L.S.; Silveira, M. Guia Ilustrado e Manual de Arquitetura Foliar Para Espécies Madeireiras da Amazônia Ocidental; GK Noronha: Rio Branco, Brazil, 1999; 101p. [Google Scholar]
  20. Lê, S.; Josse, J.; Husson, F. FactoMineR R: An R Package for Multivariate Analysis. J. Stat. Softw. 2008, 25, 1–18. [Google Scholar] [CrossRef]
  21. Kassambara, A.; Mundt, F. Factoextra: Extract and Visualize the Results of Multivariate Data Analyses. R package version 1.0.5. 2017. Available online: https://cran.r-project.org/package=factoextra (accessed on 15 February 2021).
  22. Kuhn, M.; Wing, J.; Weston, S.; Williams, A.; Keefer, C.; Engelhardt, A.; Benesty, M. Package ‘caret’. 2020. Available online: https://cran.r-project.org/package=caret (accessed on 15 February 2021).
  23. Dartora, N.; De Souza, L.M.; Santana-Filho, A.P.; Iacomini, M.; Valduga, A.T.; Gorin, P.A.; Sassaki, G.L. UPLC-PDA–MS evaluation of bioactive compounds from leaves of Ilex paraguariensis with different growth conditions, treatments and ageing. Food Chem. 2011, 4, 1453–1461. [Google Scholar] [CrossRef]
  24. Davis, P.A.; Caylor, S.; Whippo, C.W.; Hangarter, R.P. Changes in leaf optical properties associated with light-dependent chloroplast movements. Plant Cell Environ. 2011, 34, 2047–2059. [Google Scholar] [CrossRef] [PubMed]
  25. Peters, R.D.; Noble, S.D. Spectrographic measurement of plant pigments from 300 to 800 nm. Remote Sens. Environ. 2014, 148, 119–123. [Google Scholar] [CrossRef]
  26. Kira, O.; Linker, R.; Gitelson, A. Non-destructive estimation of foliar chlorophyll and carotenoid contents: Focus on informative spectral bands. Int. J. Appl. Earth Obs. Geoinf. 2015, 38, 251–260. [Google Scholar] [CrossRef]
  27. Maire, V.; Wright, I.J.; Prentice, I.C.; Batjes, N.H.; Bhaskar, R.; Van Bodegom, P.M.; Reich, P.B. Global effects of soil and climate on leaf photosynthetic traits and rates. Glob. Ecol. Biogeogr. 2015, 6, 706–717. [Google Scholar] [CrossRef]
  28. Bravo, S.; Amorós, J.A.; Pérez-de-los-Reyes, C.; García, F.J.; Moreno, M.M.; Sánchez-Ormeño, M.; Higueras, P. Influence of the soil pH in the uptake and bioaccumulation of heavy metals (Fe, Zn, Cu, Pb and Mn) and other elements (Ca, K, Al, Sr and Ba) in vine leaves, Castilla-La Mancha (Spain). J. Geochem. Explor. 2017, 174, 79–83. [Google Scholar] [CrossRef]
  29. Freitas, F.A.D.; Kopp, M.M.; Sousa, R.O.D.; Zimmer, P.D.; Carvalho, F.I.F.D.; Oliveira, A.C.D. Absorção de P, Mg, Ca e K e tolerância de genótipos de arroz submetidos a estresse por alumínio em sistemas hidropônicos. Ciência Rural. 2006, 1, 72–79. [Google Scholar] [CrossRef]
  30. Oliveira, R.H.; Rosolem, C.A.; Trigueiro, R.M. Importância do fluxo de massa e difusão no suprimento de potássio ao algodoeiro como variável de água e potássio no solo. Rev. Bras. De Ciências Do Solo 2004, 3, 439–445. [Google Scholar] [CrossRef]
  31. Ohyama, T.; Sueyoshi, K. Nitrogen Assimilation in Plants; Signpost, Trivandrum: Kerala, India, 2010; 378p. [Google Scholar]
  32. Yarce, C.J.; Rojas, G. Near infrared spectroscopy for the analysis of macro and micro nutrients in sugarcane leaves. Sugar Ind. 2012, 137, 707–710. [Google Scholar] [CrossRef]
  33. Xue, J.; Fuentes, S.; Poblete-Echeverria, C.; Viejo, C.G.; Tongson, E.; Du, H.; Su, B. Automated chinese medicinal plants classification based on machine learning using leaf morpho-colorimetry, fractal dimension and visible/near infrared spectroscopy. Int. J. Agric. Biol. Eng. 2019, 2, 123–131. [Google Scholar] [CrossRef]
  34. Frizon, C.N.T.; Nisgoski, S. Color Parameters to Predict Moisture and Tannin Content in Yerba Mate Process. Floresta E Ambiente 2020, 2, 2–9. [Google Scholar] [CrossRef]
  35. Cabral-Malheiros, G.; Hecktheuer, L.H.R.; Canto, M.W.D.; Balsamo, G.M. O tempo e o tipo de embalagem sobre a erva-mate tipo chimarrão durante armazenagem em condições ambientais. Ciência Rural. 2010, 3, 654–660. [Google Scholar] [CrossRef]
  36. Nisgoski, S.; Carneiro, M.E.; Lengowski, E.C.; Schardosin, F.Z.; De Muñiz, G.I.B. Potential use of visible and near-infrared spectroscopy for pine species discrimination by examination of needles. South. For. 2015, 4, 243–247. [Google Scholar] [CrossRef]
  37. Gitelson, A.A.; Merzlyak, N.M. Non-destructive assessment of chlorophyll, carotenoid and anthocyanin content in higher plant leaves: Principles and algorithms. In Remote Sensing for Agriculture and the Environment; Peripheral Editions: Athens, Greece, 2004; pp. 78–94. [Google Scholar]
  38. Penuelas, J.; Filella, I. Visible and near infrared reflectance techniques for diagnosing plant physiological status. Trends Plant Sci. 1998, 4, 151–156. [Google Scholar] [CrossRef]
  39. Schenk, J.S.; Workman, J.J., Jr.; Westerhaus, M.O. Application of NIR spectroscopy to agricultural products. In Handbook of Near-Infrared Analysis, 3rd ed.; Burns, D.A., Ciurczak, E.W., Eds.; CRC Press: Boca Raton, FL, USA, 2008; pp. 347–386. [Google Scholar]
  40. Schwanninger, M.; Rodrigues, J.C.; Fackler, K. A review of band assignments in near infrared spectra of wood and wood components. J. Near Infrared Spectrosc. 2011, 19, 287–308. [Google Scholar] [CrossRef]
  41. Mees, C.; Souard, F.; Delporte, C.; Deconinck, E.; Stoffelen, P.; Stévigny, C.; De Braekeleer, K. Identification of coffee leaves using FT-NIR spectroscopy and SIMCA. Talanta 2018, 177, 4–11. [Google Scholar] [CrossRef] [PubMed]
  42. Lohr, D.; Tillmann, P.; Druege, U.; Zerche, S.; Rath, T.; Meinken, E. Non-destructive determination of carbohydrate reserves in leaves of ornamental cuttings by near-infrared spectroscopy (NIRS) as a key indicator for quality assessments. Biosyst. Eng. 2017, 158, 51–63. [Google Scholar] [CrossRef]
  43. Tang, R.; Chen, X.; Li, C. Detection of nitrogen content in rubber leaves using near-infrared (NIR) spectroscopy with correlation-based successive projections algorithm (SPA). Appl. Spectrosc. 2018, 72, 740–749. [Google Scholar] [CrossRef] [PubMed]
  44. Migacz, I.P.; Manfron, J.; Farago, P.V.; Raman, V.; Muñiz, G.I.B.; Nisgoski, S. VIS/NIR spectra and color parameters according to leaf age of some Eucalyptus species: Influence on their classification and discrimination. For. Syst. 2022, 31, e013. [Google Scholar] [CrossRef]
  45. Richardson, A.D.; Reeves, J.B.; Gregoire, T.G. Multivariate analyses of visible/near infrared (VIS/NIR) absorbance spectra reveal underlying spectral differences among dried, ground conifer needle samples from different growth environments. New Phytol. 2003, 161, 291–301. [Google Scholar] [CrossRef]
  46. Asner, G.P.; Martin, R.E.; Carranza-Jimenez, L.; Sinca, F.; Tupayachi, R.; Anderson, C.B.; Martinez, P. Functional and biological diversity of foliar spectra in tree canopies throughout the Andes to Amazon region. New Phytol. 2014, 204, 127–139. [Google Scholar] [CrossRef] [PubMed]
  47. Cavender-Bares, J.; Meireles, J.E.; Couture, J.J.; Kaproth, M.A.; Kingdon, C.C.; Singh, A.; Serbin, S.P.; Center, A.; Zuniga, E.; Townsend, P.A.; et al. Associations of leaf spectra with genetic and phylogenetic variation in oaks: Prospects for remote detection of biodiversity. Remote Sens. 2016, 8, 221. [Google Scholar] [CrossRef]
  48. Borraz-Martínez, S.; Boqué, R.; Simó, J.; Mestre, M.; Gras, A. Development of a methodology to analyze leaves from Prunus dulcis varieties using near infrared spectroscopy. Talanta 2019, 204, 320–328. [Google Scholar] [CrossRef]
  49. Nisgoski, S.; Schardosin, F.Z.; Batista, F.R.R.; De Muñiz, G.I.B.; Carneiro, M.E. Potential use of NIR spectroscopy to identify Cryptomeria japonica varieties from southern Brazil. Wood Sci. Technol. 2016, 1, 71–80. [Google Scholar] [CrossRef]
  50. Xu, L.; Yan, S.M.; Cai, C.B.; Zhong, W.; Yu, X.P. Rapid analysis of geographical origins and age of Torreya grandis seeds by NIR spectroscopy and pattern recognition methods. J. Spectrosc. 2013, 2013, 468509. [Google Scholar] [CrossRef]
  51. Tigabu, M.; Oden, P.C.; Lindgren, D. Identification of seed sources and parents of Pinus sylvestris L. using visible–near infrared reflectance spectra and multivariate analysis. Trees 2005, 19, 468–476. [Google Scholar] [CrossRef]
  52. Loewe, V.; Navarro-Cerrillo, R.M.; García-Olmo, J.; Riccioli, C.; Sánchez-Cuesta, R. Discriminant analysis of Mediterranean pine nuts (Pinus pinea L.) from Chilean plantations by near infrared spectroscopy (NIRS). Food Control. 2017, 73, 634–643. [Google Scholar] [CrossRef]
  53. Amendola, L.; Firmani, P.; Bucci, R.; Marini, F.; Biancolillo, A. Authentication of Sorrento walnuts by NIR spectroscopy coupled with different chemometric classification strategies. Appl. Sci. 2020, 10, 4003. [Google Scholar] [CrossRef]
  54. Manuel, M.N.B.; Silva, A.C.; Lopes, G.S.; Ribeiro, L.P.D. One-class classification of special agroforestry Brazilian coffee using NIR spectrometry and chemometric tools. Food Chem. 2022, 366, 130480. [Google Scholar] [CrossRef] [PubMed]
  55. Castro, W.; De-la-Torre, M.; Avila-George, H.; Torres-Jimenez, J.; Guivin, A.; Acevedo-Juárez, B. Amazonian cacao-clone nibs discrimination using NIR spectroscopy coupled to naïve Bayes classifier and a new waveband selection approach. Spectrochim. Acta Part A Mol. Biomol. Spectrosc. 2022, 270, 120815. [Google Scholar] [CrossRef] [PubMed]
  56. Castillo, R.; Contreras, D.; Freer, J.; Juiz, J.; Valenzuela, S. Supervised pattern recognition techniques for classification of Eucalyptus species from leaves NIR spectra. J. Chil. Chem. Soc. 2008, 53, 1709–1713. [Google Scholar] [CrossRef]
  57. Huang, B.; Liu, J.; Jiao, J.; Lu, J.; Lv, D.; Mao, J.; Zhao, Y.; Zhang, Y. Applications of machine learning in pine nuts classification. Sci. Rep. 2022, 12, 8799. [Google Scholar] [CrossRef]
  58. Rojas-Rioseco, M.; Castillo, R.P.; Gonzalez-Campos, J.; Ipinza, R.; Sanhueza, M.I.; Hasbún, R. Phylogeographic origin authentication of Araucaria araucana (Mol.) K Koch seedlings through the application of spectroscopy techniques in different infrared ranges and chemometric methods. New For. 2023, 54, 467–489. [Google Scholar] [CrossRef]
  59. Wang, Y.; Xiang, J.; Tang, Y.; Chen, W.; Xu, Y. A review of the application of near-infrared spectroscopy (NIRS) in forestry. Appl. Spectrosc. Rev. 2022, 57, 300–317. [Google Scholar] [CrossRef]
Figure 1. Map of Xipaya Indigenous Lands, showing the location of Tukamã and Tukayá.
Sustainability 15 15606 g001
Figure 2. Example of Brazil nut tree leaf venation from the indigenous villages Tukayá (A) and Tukamã (B).
Sustainability 15 15606 g002
Figure 3. (a) Mean visible reflectance spectra for Bertholletia excelsa leaves from two communities. (b) PCA score graph with second derivative visible spectra of Bertholletia excelsa leaves from two communities.
Sustainability 15 15606 g003
Figure 4. (a) Mean NIR spectra of Bertholletia excelsa leaves from two communities. (b) PCA score graph with mean second derivative NIR spectra of Bertholletia excelsa leaves from Tukamã and Tukayá.
Sustainability 15 15606 g004
Figure 5. Mean second derivative NIR spectra of Bertholletia excelsa nuts from Tukamã and Tukayá, with (a) and without shell (b). PCA score graph with mean second derivative NIR spectra of Bertholletia excelsa nuts from Tukamã and Tukayá with (c) and without shell (d).
Sustainability 15 15606 g005
Table 1. Soil composition from Tukamã and Tukayá.
CommunityDeepPKNaAlCaCa + MgpH
(cm)(mg/dm3)(cmol/dm3)
Tukamã0–208110170.80.20.64.73
Tukayá0–2064141.60.40.74.54
Table 2. Mean values and standard deviations of colorimetric parameters of Bertholletia excelsa leaves from two communities.
CommunityL*a*b*C*h
Mean SDMeanSDMeanSDMeanSDMeanSD
Tukamã32.17 a3.832.31 a0.988.43 a3.008.85 a10.3672.06 a10.47
Tukayá33.50 a4.221.62 a0.929.76 a3.019.95 a11.2679.14 b7.20
L* = luminosity; a* = green-red chromatic coordinate; b* = blue-yellow chromatic coordinate; C* = chroma; h = hue angle; SD = standard deviation. Means with the same letter in the column do not differ statistically by the Tukey test at 5% probability.
Table 3. Accuracy and precision of k-NN classification models based on second derivative NIR spectra of Bertholletia excelsa leaves and nuts from Tukamã and Tukayá.
Sample ModelAccuracyPrecision
Leaves98.45%98.53%
Nuts with shell89.00%89.00%
Nuts without shell90.91%91.16%
Disclaimer/Publisher’s Note: The statements, opinions and data contained in all publications are solely those of the individual author(s) and contributor(s) and not of MDPI and/or the editor(s). MDPI and/or the editor(s) disclaim responsibility for any injury to people or property resulting from any ideas, methods, instructions or products referred to in the content.

