1. Introduction
In the face of a deteriorating ecological environment, global companies have recently begun to implement green supply chain management in response to increasingly stringent environmental regulations and a growing public demand for green products [
1,
2]. In response, consumers are becoming more and more environmentally conscious and are looking for products with a certain degree of greenness instead of ordinary products. In order to be invincible in the fierce competition in the market, manufacturing enterprises actively carry out green product research and development to enhance the greenness of their product. Retail enterprises sell green products to meet the environmental needs of consumers [
3,
4,
5]. The continuous and efficient development of green products promotes the progress and development of society, and its development cannot be achieved without the joint efforts of manufacturers and retailers, both of which are actively exploring how to achieve a balance between their respective cost–benefit and environmental performance in the supply chain of green product manufacturing.
Supply chain collaboration has been a hot research issue in the field of supply chains at home and abroad, and the classic collaboration methods include quantity discounts [
6,
7], price compensation [
8], cooperative advertising [
9], revenue sharing [
10,
11,
12] etc. In real life, cost-sharing contracts and revenue-sharing contracts exist widely [
13,
14]. For example, Volkswagen and Ford share R&D costs for electric cars and autonomous driving; mobile phone manufacturers share revenues with retailers (e.g., Indian dealers sell an iPhone X at a profit margin of 4.5% (which drops to 1% to 2% with a discount card), and Samsung Xiaomi offers a profit margin of 12% to 15%. Both contracts have been extensively studied by scholars [
15,
16,
17]. Some scholars have also compared the cost-sharing contract as well as the revenue-sharing contract with other market behaviors [
18,
19]. Among them, although either cost-sharing or benefit-sharing contracts can lead to perfect coordination in supply chains, there is a lack of green supply chain research that integrates cost-sharing and revenue-sharing.
Since the interests of the manufacturer and retailer depend not only on the actions taken by themselves, but also on the actions taken by the other party, both parties need to respond to the actions of the other party according to their own best interests, which creates a game between the manufacturer and retailer. On this basis, in order to achieve the sustainable development of the supply chain, this paper constructs a game model based on cooperative advertising in supply chain collaboration, investigates a green supply chain that simultaneously considers the integration of advertising investment, cost-sharing, and revenue sharing, and explores the strategic choices between manufacturer and retailer under different supply chain coordination mechanisms. In this paper, comparison with the coordination mechanism model are proposed, firstly, similar to the general research, the manufacturer is considered to determine the wholesale price and the greenness of the products with the goal of revenue maximization, and the retailer determines their own order quantities and advertising investment levels and sell the products according to the wholesale price, greenness and market demand provided by the manufacturers; thus, this is a manufacturer-led and retailer-followed Stackelberg game model; secondly, three game models are constructed, namely, cost-sharing only, revenue-sharing only and cost-sharing and revenue-sharing fusion, to explore the coordination ability of supply chain members in the case of different coordination mechanisms, and to achieve the maximization of the profit coordination of supply chain members through different coordination mechanisms. Finally, the changes in members’ earnings under different coordination mechanisms are compared and analyzed.
The academic contributions of this paper are as follows. First, this paper verifies the coordination ability of a single coordination mechanism in a green supply chain that considers the greenness of products and investment in advertising and promotion and showed that supply chain coordination can be effectively promoted within a certain coordination coefficient to improve the greenness of products. Second, we investigate a coordination mechanism that integrates cost-sharing and benefit-sharing, in which the manufacturer shares the cost of retailers’ advertising and promotion, and the retailers share their portion of the benefits to the manufacturers to share part of their revenue, reaching a two-way green effort. The rest of the paper is organized as follows.
2. Literature Review
The literature relevant to the research in this paper includes cost-sharing contracts for advertising investment, revenue-sharing contracts, and cost-sharing and revenue-sharing contracts. The following literature review will look at these three areas.
2.1. Cost-Sharing Contract for Advertising Investment
With the concern of all sectors of society on environmental issues, green supply chain management has become a key area of academic research [
2,
5,
20,
21]. However, it is not enough to rely only on the green efforts of the manufacturer and retailer as the main body of the direct consumer market, its publicity and other efforts will often directly affect the consumer’s purchasing behavior; this effort is called the retailer’s green market efforts [
22]. Therefore, the development of a green supply chain needs to rely on the joint efforts of manufacturers and retailers.
Advertising by the retailer has been widely used. Shi et al. found theoretical analysis shows that advertising investment can substantially increase the product greening level and manufacturer’s profit [
23]. A study by Zhang et al., found that if neither company invested in green advertising, both companies had the lowest profits, while when both companies invested in green advertising, both companies had the highest profits [
24]. The above literature suggests that members making green advertising investments can create higher value for supply chain members. In order to incentivize green inputs, cost-sharing has become one of the important incentives. Ghosh and Shah examine retailer cost-sharing contracts versus cost-sharing contracts under retailer–manufacturer bargaining and explore the effects of the two types of cost-sharing contracts on product green levels, prices and profits [
2]. Xu et al. establishes a two-level supply chain consisting of a manufacturer and a retailer and analyses the effects of cost-sharing contracts and wholesale price contracts on the level of greenness and the profitability of the supply chain [
25]. Although all the above studies have analyzed the coordinating effect of cost-sharing contracts on green supply chains, all of them have considered only retailers’ sharing of upstream R&D costs, and fewer studies have considered sharing retailers’ advertising and promotion costs.
2.2. Revenue-Sharing Contract
Researchers have conducted some studies on revenue sharing contract models for supply chain management [
10,
11,
26]. Mondal and Giri’s research suggests that a retailer-led revenue share in addition to increased greening of products can be a win–win for both manufacturers and retailers [
27]. Hu et al. propose a new order penalty and rebate contract in which the supplier gives the manufacturer a variable incentive related to the final delivery quantity [
28]. This is then combined with a revenue sharing contract to coordinate the supply chain. By redistributing profits in a rational way, a win–win situation is achieved. Peng et al. propose revenue sharing for carbon emission reduction allowances, which can effectively coordinate the supply chain in terms of total profits and carbon emission reduction levels [
29]. Yao et al. study revenue sharing contracts for supply chain coordination consisting of one manufacturer and two competing retailers and find that providing revenue sharing in the contract is more efficient than a price-only [
11]. Song and Gao developed a green supply chain game model with two types of revenue sharing contracts, retailer-led and bargaining, and compared the results with those of a centralized and decentralized decision-making model, showing that revenue sharing contracts can be effective in improving the greenness of products and the profitability of the overall supply chain [
30]. Sluis and De, explore how revenue sharing contracts can be more effective in coordinating revenue distribution and improving supply chain efficiency than traditional coordination mechanisms [
31]. The Zhou et al. study shows greater product greenness in the case of cooperation based on revenue-sharing contracts [
32]. The above study shows that revenue sharing pacts can improve the overall coordination of the supply chain. At the same time, the signing of a revenue-sharing contract leads to an overall increase in the level of social welfare. In the supply chain, enterprises should be encouraged to sign contracts that can achieve the purpose of improving social welfare to realize the sustainable development of the supply chain.
2.3. Cost-Sharing and Revenue-Sharing Contract
The above analyses show that a single cost-sharing contract and a benefit-sharing contract will promote the coordination of a green supply chain and improve the overall profit level of the supply chain, which is agreed by most scholars [
13,
16,
27,
32]. However, there are fewer studies describing the combination of multiple coordination contracts. Taleizadeh et al. explores the impact of wholesale price contracts, cost-sharing contracts and buy-back contracts on carbon emission reduction [
33]. Raj et al. analyze the decentralized supply chain setting using five different contract types, namely wholesale price, linear two-part tariff, greening-cost-sharing, revenue sharing, and revenue and greening-cost-sharing contracts [
34]. Li et al. investigates the impact of revenue-sharing and cost-sharing contracts offered by a retailer on emission reduction efforts and firms’ profitability. However, retailers not only share the costs of green R&D, but also their own revenues, further reducing the conditions under which coordination mechanisms can be reached [
13]. A study modelled the supply chain of shared logistics services under a revenue-sharing or cost-sharing contract; however, no integration study was conducted [
16]. The above analyses show that revenue-sharing pacts can improve the efficiency of the supply chain and increase the benefits for both manufacturer and retailer, and that a single cost-sharing pact and a revenue-sharing pact play an important role in coordinating the interests of supply chain members. However, there is a paucity of literature that considers both covenants simultaneously, as shown in the literature [
16], where both covenants are assumed by the retailer, making the covenant difficult to achieve. Therefore, this paper explores a two-way cost-sharing and revenue-sharing contract game model in a green supply chain.
Based on the above investigation, most of the supply chain coordination studies consider a single coordination mechanism, however, in reality, the status of multiple coordination mechanism integration research is also becoming more and more important, at present, most of the related studies for retailers not only share the green manufacturing costs but also share their own benefits, making it difficult to achieve the tolerance and coordination mechanism. Therefore, according to
Table 1, the research content of this paper is as follows: (1) Explore the impact of a single coordination mechanism on product greenness and advertising investment intensity of the supply chain, and analyze the coordination scope and capacity of the coordination mechanism; (2) Analyze the trend of coordination mechanism coefficients on product greenness, investment advertising intensity and profits of supply chain members; (3) Further fusion study of cost-sharing and revenue-sharing contract is conducted to explore its coordination ability with the green supply chain.
3. Model Description and Assumptions
The secondary green supply chain considered in this paper consists of a manufacturer and a retailer. Both the manufacturer and the retailer are risk neutral. There are two types of products in the market, i.e., regular products and green products, and the market demand is determined by both the greenness of the product and the price of the product, i.e., when a consumer buys a green product, he/she needs to consider the price of the product and the greenness of the product. The fact is that consumers prefer “cheap and good” products, so it is assumed that consumers tend to buy products with high greenness and low price [
3,
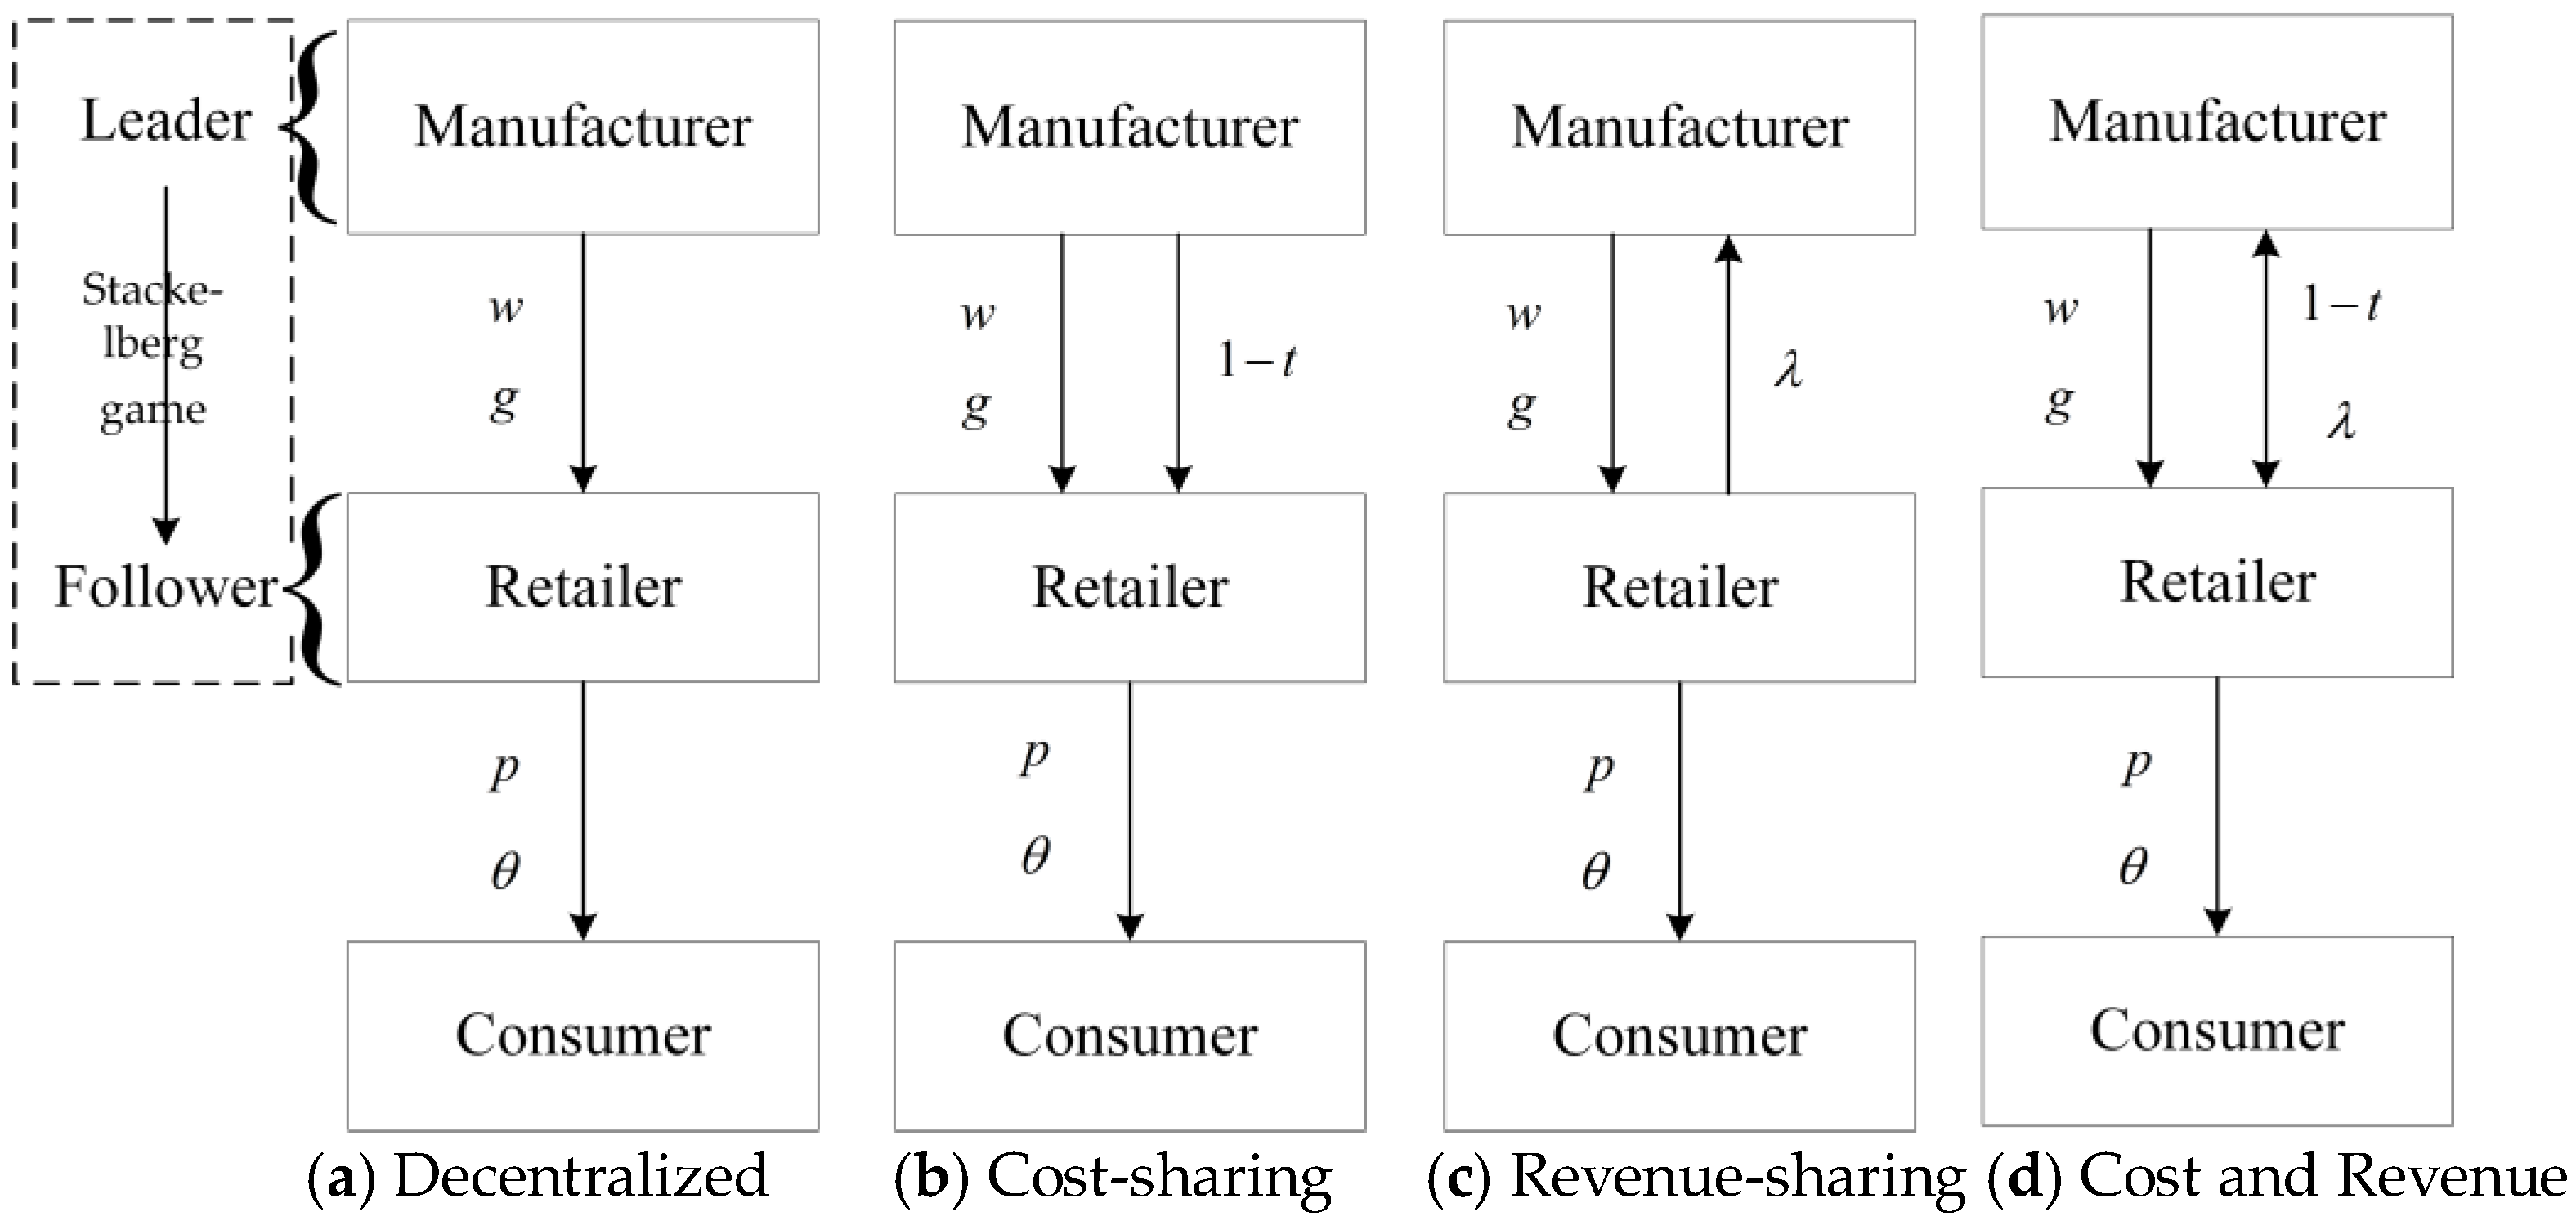
5], i.e., customers choosing products related to this comparison will, in the case of the same quality, be more willing to choose low-priced products, while in the case of the same price, are more willing to choose higher quality products, which is in line with real society. Three game models are considered, including the decentralized decision-making game model, the cost-sharing coordination mechanism model and the revenue-sharing coordination mechanism model, all of which are traded according to the Stackelberg game.
The decision-making process of the supply chain nodal companies are shown in
Figure 1. The supplier, as the leader, based on its own situation and aiming at profit maximization, establishes the wholesale price
and the level of green R&D
, and its green R&D cost is
. Subsequently, the retailer, as a follower, sets the order quantity and retail price
according to the wholesale price
and market demand
, and also determines the level of advertising and promotion
, and its advertising and promotion cost is
. The retailer pays the supplier, and the supplier supplies the retailer
, who sells the product at the fixed retail price and recoups the money
. Under the cost-sharing model, supplier shares a certain percentage of the cost of advertising investment; under the revenue-sharing model, retailer shares a percentage of green investment costs; under the cost-sharing and revenue-sharing model, mechanisms for integrating retailer’s sharing of a percentage of the cost of green investments with supplier’s sharing of a percentage of the cost of advertising investments.
Based on the above description, the symbolic descriptions in the text are shown in
Table 2, with the basic assumptions:
- (1)
In order to improve the greenness of products, it is necessary to increase the investment in research and development (R&D) and improve the level of technology. Referring to [
2,
33], R&D results are quadratically related to R&D investment costs. And assuming that, the R&D costs are all borne by the manufacturer, the cost of R&D to produce green products is
,
is the R&D impact factor, and
reflects the final greenness of the product. In practice, the level of product greenness is usually reflected by the features that reflect the green design of the product, such as energy-efficiency labelling, carbon labelling, and the content of hazardous substances, and the degree of recyclability of product parts [
12].
- (2)
Consumer awareness directly determines market demand. If consumers do not have green awareness, then green products will be squeezed out of the market by ordinary products. Therefore, in order to increase consumers’ green awareness, retailers must increase green marketing costs and invest more advertising expenses. Referring to [
2,
23,
24], advertising investment intensity is quadratically related to input cost. And assuming that, the cost of advertising investment is fully borne by the retailer, the cost of advertising investment is
,
is the R&D influencing factor, and
reflects the advertising intensity invested by the retailer.
- (3)
According to the linear demand function model [
35,
36], which is often cited in green supply chains, the market demand is a linear function of the product’s greenness level and retail price. Therefore, the market demand function for a green product is
. Consumer demand for the product is positively correlated with the potential market size
, the greenness of the product
and the intensity of investment in advertising
, and negatively correlated with the retail price
, where
,
and
are the sensitivity of consumers to the price of the product, the greenness of the product, and the investment in advertising, which suggests that consumers prefer “good value for money” products and tend to buy products with high greenness and low prices. This indicates that consumers like “good value for money” products and tend to buy products with high greenness and low price.
- (4)
and are the unit operating costs of manufacturers and retailers, respectively, and is a constant.
Table 2.
Symbolic descriptions.
Table 2.
Symbolic descriptions.
| Symbol | Description |
|---|
| The market demand for the green product |
| Potential market demand |
| Green product cost impact factor |
| Investment advertising cost impact factor |
| Consumer sensitivity to product price |
| Consumer sensitivity to advertising |
| Consumer sensitivity to product greenness |
| Cost-sharing factor |
| Revenue sharing factor |
| Manufacturer’s unit cost of producing the product |
| Unit cost of products sold by retailers |
| Decision variable |
| Retail price |
| Wholesale price |
| Advertising investment intensity |
| Greenness of products |
On this basis, this paper firstly investigates the two-stage green product manufacturing supply chain of manufacturers and retailers, and establishes a benchmark game model, the decentralized decision-making model. And it further explores the coordination of a two-stage green product manufacturing supply chain between manufacturers and retailers using cost-sharing contracts and benefit-sharing contracts. Secondly, an integration study of the two coordination mechanisms was conducted.
4. Decentralized Decision Game Model
In order to compare with the coordination game model of subsidies, this paper first introduces the benchmark game model, the decentralized decision-making game model. The idea of the decentralized decision-making game model is that manufacturers and retailers make their own decisions based on their own costs to maximize their own interests, rather than putting the interests of the supply chain as a whole first. However, the results of the decisions are mutually influential. In this paper, we consider the Stackelberg game with the manufacturer as the leader. Firstly, the manufacturer determines the wholesale price of the product and the greenness of the product based on the cost of production, and secondly, the retailer decides the optimal retail price of the product and the intensity of the investment in advertisement for profit maximization.
The retailer’s revenue function is:
The revenue function for the supplier is:
According to the basic theory of the Stackelberg game model, we obtain the optimal
,
,
and
, see
Appendix A.1 for the proof process.
By bringing the optimal solution into the revenue function, the optimal revenue function of the manufacturer and retailer is
5. Coordinated Decision-Making
Firstly, contractual coordination can solve the problems of trust crisis and uneven distribution of benefits among supply chain enterprises. The contractual coordination of the supply chain can also strengthen the cooperation and communication among member enterprises, and reduce the adverse effects caused by information asymmetry, thus reducing the “double marginalization effect” caused by the decision-making goal of supply chain member enterprises to maximize their own interests, and then achieve the coordinated development of the supply chain.
5.1. Cost-Sharing Coordination Mechanism
When supply chain members carry out green product eco-design and since green information cannot be effectively transmitted, this paper considers retailers taking advertising investment to promote and expand sales. It is assumed that manufacturers and retailers share the cost of advertising investment to reduce the investment risk, incentivize retailers to promote green products, and promote the suppliers’ willingness to increase the production of green products, so as to achieve the sustainable development of the supply chain. This paper establishes a cost-sharing game model, in which the proportion of suppliers sharing the advertising investment cost is , .
The retailer’s revenue function is:
The revenue function for the supplier is:
According to the basic theory of the Stackelberg game model, we obtain the optimal
,
,
and
, see
Appendix A.2 for the proof process.
By bringing the optimal solution into the revenue function, the optimal revenue function of the manufacturer and retailer is:
Proposition 1. When , the greenness of the product, the number of orders, and the manufacturer’s revenue rise as the cost-sharing coefficient increases and vice versa; when , the retailer’s revenue increases with the cost-sharing coefficient; and the intensity of investment in advertising consistently tends to decrease as the cost-sharing coefficient increases. Where and .
From Proposition 1, when manufacturer and retailer agree on a cost-sharing coordination mechanism, a certain degree of investment in advertising cost-sharing promotes the revenue enhancement of supply chain members. Under cost-sharing, the retailer is willing to invest in higher advertising campaigns to attract more consumers, thereby increasing potential market demand and order quantity, and creating higher revenues for supply chain members. It also helps to improve consumer rights and access to greener products for sustainable and healthy development.
5.2. Revenue Sharing Coordination Mechanism
On the basis of the above, decentralized decision-making game model and cost-sharing game model, make the supply chain members reach further cooperation. At the same time improving the overall supply chain revenue, also causes the suppliers and retailers’ respective revenue to be not less than the revenue under the decentralized decision-making game model. Therefore, the use of the revenue sharing contract for coordination of incentives to retailers is from the perspective of maximizing the overall interests of the supply chain to determine the order quantity, the supplier at a lower wholesale price of the product wholesale to the retailer, the retailer and then the profit from the sale of the product to a certain percentage of the profit to share with the supplier. The retailer then shares a certain percentage of the profits from the sale of the product with the supplier. This is denoted by the percentage of sharing that the retailer receives from the sales revenue, and the percentage of sharing that the supplier receives is , where .
The supplier’s revenue function is:
The revenue function for the retailer is:
According to the basic theory of the Stackelberg game model, we obtain the optimal
,
,
and
, see
Appendix A.3 for the proof process.
By bringing the optimal solution into the revenue function, the optimal revenue function of the manufacturer and retailer is:
Proposition 2.
As the revenue sharing coefficient increases when , the manufacturer’s revenue, product greenness, retail price, and market demand all tend to increase, and vice versa; when , the retailer’s revenue and the intensity of advertising investment tend to increase, and , and vice versa.
From Proposition 2, it can be seen that, at a certain level of revenue sharing, manufacturers obtain higher revenue, so as to invest in the production of greener products. From the production cost and green R&D cost considerations, the manufacturer raises the wholesale price of the product; for the retailer, obtaining greener products, they are willing to invest in more advertising and promotion costs, so as to attract more consumers and increase the sales volume of the product to obtain a higher revenue and based on the wholesale price and advertising cost makes them increase the retail price. However, consumers are not only looking for good quality, but also consider the price of the product, which leads to lower consumption when the price exceeds consumer’s psychological expectation, making the retailer’s revenue and the intensity of investment in advertising decrease. Therefore, whenever a moderate coordination mechanism is adopted, it is always beneficial for supply chain members to achieve Pareto optimization.
5.3. Research on Optimal Coordination Mechanism Selection
Based on the above decentralized decision-making, cost-sharing coordination mechanism and revenue-sharing coordination mechanism game models, this section firstly compares and analyses the profit thresholds of supply chain members adopting coordination mechanisms from the perspective of profit, i.e., individual reasonableness is satisfied. Secondly, the product greenness and investment advertising intensity under different coordination mechanisms are comparatively analyzed.
Proposition 3. Under the cost-sharing coordination mechanism, the relationship between the optimal profits of the supply chain members is as follows:
- (1)
When , it follows that
;
- (2)
When , it follows that . As shown in Figure 2.
As can be seen from Proposition 3, when the supply chain considers sharing the investment advertising costs for the retailer, when the sharing coefficient exceeds a certain percentage, at least one party’s revenue is damaged, making it difficult to achieve win–win cooperation, as shown in
Figure 2, when
or
, there is always one party’s revenue out of the retailer and the manufacturer lower than when the coordination mechanism is not used, so it is difficult to achieve cooperation, which results in both parties withdrawing from the cooperation. In reality, the supplier can choose the coordination mechanism with reference to the degree of change in their own profits, and then make the optimal choice after weighing the pros and cons.
Through the analysis of corollary 1, it can be seen that when the sharing coefficient is in a certain range, the manufacturer and retailer, respectively, from their own revenue maximization perspective, choose the coordination mechanism and then there is a win–win cooperation cost-sharing coefficient range.
Corollary 1.
Compare and analyze the cost-sharing coordination mechanism and decentralized decision-making, and make and
hold simultaneously when
is satisfied with individual rationality, i.e., when the cost-sharing coordination mechanism is used to create higher value for supply chain members.
Proof. Same as proposition 3. □
As shown by Corollary 1, when the cost-sharing coefficient is in a certain range, i.e., the manufacturer shares part of the advertised investment cost, it can effectively increase the revenue of the supply chain members, and both parties will choose the agency model, which is a conclusion that is consistent with the reality, and thus favors the sustainable and efficient development of the supply chain.
Proposition 4.
Under the revenue sharing coordination mechanism, the relationship between the optimal profits of the supply chain members are as follows.
- (1)
When
, it follows that
;
- (2)
Whatever the value of , always holds. As shown in Figure 3.
Corollary 2.
Compare and analyze the revenue-sharing coordination mechanism and decentralized decision-making, and make and hold simultaneously when is satisfied with individual rationality, i.e., when the revenue-sharing coordination mechanism is used to create higher value for supply chain members.
Proof. Same as proposition 4. □
The analysis is similar to Proposition 3 and Corollary 1 and will not be repeated here.
Proposition 5. Under the condition that individual rationality is satisfied, the product greenness and advertising investment intensity under the condition that the revenue sharing coordination mechanism is adopted are better than those without the coordination mechanism at any time; when considering the cost-sharing coordination mechanism, the product greenness and advertising investment intensity under the coordination mechanism are better than those without the coordination mechanism. As shown in Figure 4 and Figure 5.
From Proposition 5, based on Corollary 1 and Corollary 2 above, in the case where the supply chain members satisfy individual rationality and the manufacturer considers cost-sharing, the retailer is willing to increase the intensity of the advertisement campaign to a certain extent so as to attract more consumers, and when the orders increase, the manufacturer is incentivized to increase the greenness of the product to a certain extent. This creates higher revenues for supply chain members. When retailers consider sharing a portion of the revenue, the manufacturer increases the greenness of the product appropriately to attract consumers’ attention; however, after retailers share a portion of the revenue, they choose to reduce the intensity of some of the advertising investment to reduce their losses, thus creating higher revenue for the supply chain.
6. Expanding the Model
Based on the above analysis, under the condition of satisfying individual rationality, the cost-sharing coordination mechanism and the revenue sharing coordination mechanism can achieve effective coordination and create larger benefits for members. Then, how about a coupling study of cost-sharing and benefit sharing? In this supply chain, the supplier gives advertised green investment to improve the greenness of the product while reducing the group loss of consumers due to lower greenness, so the retailer has the incentive to stimulate the supplier to improve the greenness of the product and share part of the revenue with them. Similarly, when the retailer invests in advertising green products to increase product awareness, the demand for the products tend to increase, which motivates manufacturers to stimulate the retailer to increase the intensity of their advertising campaigns to share some of the cost of the advertising investment.
The supplier’s revenue function is:
The revenue function for the retailer is:
According to the basic theory of the Stackelberg game model, we obtain the optimal
,
,
and
, see
Appendix A.5 for the proof process.
By bringing the optimal solution into the revenue function, the optimal revenue function of the manufacturer and retailer is:
7. Numerical Analysis
In this paper, the applicability of the modelling results is illustrated by using BOE as an example. In this section, numerical analyses are conducted to verify the equilibrium solutions and propositions of the above model. Firstly, the changes of supply chain members’ profits under the coordination mechanism of cost-sharing and revenue sharing are explored. The comparative analysis yields a profit threshold that satisfies individual rationality; second, the changes in product greenness under different coordination mechanisms are analyzed; finally, the model is extended to consider the coupled cost-sharing and revenue-sharing coordination mechanism, which demonstrates the robustness of the coordination mechanism and is more conducive to achieving a win–win situation for the enterprises. These values are consistent with the proofs that satisfy the above propositions, which can ensure that the optimal values are relevant. The specific parameters assigned are shown in
Table 3.
As can be seen from
Figure 6 and
Figure 7, when the two coordination mechanisms work together, their effects on supply chain members are complementary. As shown in
Figure 6, when only the cost-sharing coordination mechanism is considered, if the manufacturer participates in the cooperation, the sharing coefficient
must be ensured; however, under the joint coordination mechanism, when
, supplemented by appropriate benefit sharing, the suppliers can still be willing to cooperate, which can create higher benefits for the supply chain members and achieve the sustainable development of the supply chain. From
Figure 7, it can be seen that when the revenue sharing coefficient exceeds a certain range, retailers are reluctant to enter into cooperation from their own interests; however, if appropriate, advertising cost-sharing retailers will be promoted to enter into cooperation, which is conducive to achieving win–win cooperation. Therefore, it can be seen that the two joint coordination mechanisms can create higher benefits for supply chain members and are more conducive to the sustainable and efficient development of the supply chain.
As can be seen in
Figure 6 and
Figure 7, when the cost-sharing and benefit-sharing coefficients are within a certain range, it promotes the willingness of at least one of the retailers or manufacturers to enter into cooperation. The analysis shows that when in a certain range, the manufacturer and the retailer choose the coordination mechanism from the perspective of maximizing their own revenue, respectively, so is there a range of cost-sharing and benefit-sharing coefficients for win–win cooperation?
From
Figure 8, it can be seen that the range of the manufacturer to reach cooperation is better than the range of the retailer to reach cooperation, therefore, when the coefficient range of the joint coordination mechanism is to meet the range of the manufacturer to reach cooperation, then the coordination mechanism meets the individual reasonableness, and promotes the members to reach cooperation, and achieve a win–win situation. Otherwise, when the range of the coefficient of reaching cooperation exceeds the range of the manufacturer’s reaching cooperation, there exists the situation where the members’ benefits are damaged, which does not satisfy the basis of cooperation, is not conducive to reaching cooperation, is not conducive to the sustainable and efficient development of the supply chain, and fails to create higher value for the members of the supply chain.
In the case of satisfying individual rationality, the joint coordination mechanism creates higher benefits for supply chain members and achieves sustainable and efficient development of the supply chain. On the basis of the above analysis, it can be seen that the greenness of products under the joint coordination mechanism is better than considering a single coordination mechanism and not considering the coordination mechanism, as shown in
Figure 9. And from the perspective of consumers, a higher degree of green products can be obtained, which is conducive to the improvement of the environment.
Based on the above analyses of profit and product greenness, the joint coordination mechanism of cost-sharing and benefit sharing is more conducive to members’ cooperation and mutual promotion under the condition of individual rationality, which creates higher profit for supply chain members and provides consumers with greener and healthier products and realizes the sustainable development of the supply chain.
8. Discussion
In the face of a deteriorating ecological environment, global companies have recently begun to implement green supply chain management in response to increasingly stringent environmental regulations and a growing public demand for green products [
1,
2]. In response, consumers are becoming more and more environmentally conscious and are looking for products with a certain degree of greenness instead of ordinary products. In order to be invincible in the fierce competition in the market, manufacturing enterprises actively carry out green product research and development to enhance the greenness of their products; retail enterprises sell green products to meet the environmental needs of consumers [
3,
4,
5].
This paper takes a two-level green manufacturing supply chain dominated by manufacturers and retailers as the research object and uses the Stackelberg game to study the impact of product greenness and marketing efforts on green manufacturing supply chain decisions when product greenness and marketing efforts jointly affect demand. Manufacturers use marketing cost-sharing contracts to coordinate green manufacturing supply chains; retailers use revenue-sharing contracts to coordinate green manufacturing supply chains. Modelling, comparative analysis and numerical simulations have enabled the research team to highlight some new implications in theory and practice: (1) When the cost-sharing coefficient and the benefit-sharing coefficient satisfy a certain range of conditions, supply chain members that consider a single coordination mechanism outperform supply chains that do not consider a coordination mechanism, finding studies [
2,
25,
29,
30] that are consistent and provide the required empirical evidence; (2) As suggested by [
11,
23], the use of different coordination mechanisms will have a certain impact on the optimal decision-making of members in a green supply chain; (3) As the theme of the times is developing [
16,
34], in the research on the integration of coordination mechanisms, the coordination ability of supply chain members is stronger under the condition of satisfying individual rationality. The following sub-sections aim to relate the results of the above discussion to some theoretical implications, to provide a better understanding of the topic and to open up new avenues of research.
- (1)
When the cost-sharing coefficient and benefit-sharing coefficient satisfy a certain range of conditions, the supply chain members considering a single coordination mechanism will be better than the supply chain with no coordination mechanism. Based on the research findings: Manufacturers can design a reasonable cost-sharing ratio based on the advertising investment cost-sharing contract model in the article, i.e., manufacturers share the R&D costs of retailers, which can alleviate the pressure on downstream enterprises’ publicity funds and motivate retailers to increase publicity to achieve a win–win situation; at the same time, retailers can design a reasonable revenue-sharing ratio based on the revenue-sharing contract in the article, i.e., manufacturers share the R&D costs of retailers. At the same time, retailers can design a reasonable revenue-sharing ratio based on the revenue-sharing contract in the article, i.e., the manufacturer shares part of the retailer’s revenue, which promotes the manufacturer to improve the green level of the product in order to achieve a win–win situation for both parties;
- (2)
As the cost-sharing coefficient of contract gradually increases, the greenness of the products produced by manufacturers and the intensity level of the advertisements invested by retailers both show a tendency of increasing and then decreasing. As the coefficient of benefit-sharing contract gradually increases, the greenness of products produced by manufacturers tends to increase, and the intensity level of retailers’ investment advertisements shows a tendency of increasing and then decreasing.
- (3)
In the research on the integration of cost-sharing and revenue-sharing coordination mechanism, the coordination ability of supply chain members is stronger to create higher revenue for supply chain members, and the greenness of products and the intensity of advertising investment are more advantageous under the condition of satisfying individual rationality. In the context of individual rationality, the integration of revenue-sharing and cost-sharing is applied, which creates higher value for the supply chain members from the perspective of the supply chain members, and from the perspective of the consumers, who purchase the products with a higher degree of greenness, thus realizing a sustainable and healthy development of society.
9. Conclusions, Limitations and Further Research
This paper takes a two-level green manufacturing supply chain dominated by manufacturers and retailers as the research object and uses the Stackelberg game to study the impact of product greenness and marketing efforts on green manufacturing supply chain decisions when product greenness and marketing efforts jointly affect demand. Manufacturers use marketing cost-sharing contracts to coordinate green manufacturing supply chains; retailers use revenue-sharing contracts to coordinate green manufacturing supply chains.
As mentioned in the previous section, the development of the research has allowed us to identify a number of theoretical and practical implications. From a theoretical perspective, we show the impact of cost-sharing and benefit-sharing contracts on the decision-making of green supply chain members. In particular, the cost-sharing and benefit-sharing integration and coordination mechanism promotes new research streams on stakeholder engagement and social innovation and entrepreneurship. Interestingly, the numerical analysis also highlights how the fused coordination mechanism promotes transaction cost theory and the benefits of supply chain members’ cooperation, which is well represented in this paper. In conclusion, this study can provide managers, CEOs and future entrepreneurs with some decision-making rationale for cost-sharing and benefit-sharing convergence probes in their business processes, enabling them to increase their competitive advantage while pursuing sustainable development goals.
Like all research, our study has some limitations. First, this paper analyses the impact of coordination mechanisms on supply chain members only from the benefit perspective, which lays the foundation for subsequent studies from the risk perspective and member default; second, future literature reviews could examine the impact of risk assessment and disclosure levels of supply chain members on supply chain finance under different supply chain member alliances. Finally, further research should quantitatively assess whether cooperative agreements can contribute to the growth of economic, environmental and corporate social value by monitoring specific indicators.
In view of the limitations of the above description, future research directions can be carried out in the following aspects: firstly, this paper only considers the second-level green supply chain, but the real supply chain has higher complexity, such as the length, the degree of crossover, etc., and the literature [
35,
36,
37]. Further research on the multilevel green supply chain can be performed in the future. Secondly, the robustness of the decision-making variables is also an important issue that the decision-making members pay attention to, such as literature [
38,
39,
40]. Robust optimization methods are further introduced into the supply chain game model to provide certain support for the decision-making of supply chain members. Finally, the rapid development of the digital economy, and the combination of blockchain technology and the green supply chain has become the focus and hotspot of the moment [
35,
36,
41]. Blockchain technology can be further introduced into the green production process of the green supply chain in the future to improve production transparency and traceability of the production process [
42,
43].


