1. Introduction
The lower troposphere of temperate zones is often rich in airborne pollen, this is particularly true in Italy due to the remarkable plant biodiversity that characterizes this territory. In every season we find blooms of anemophilous species whose pollen and spores, often allergenic, are released in large quantities and are dispersed in the air. This phenomenon is significantly reduced only in the coldest winter periods. Throughout the developed world, pollinosis, i.e., pollen allergies, are continuously increasing and are increasing more in urban areas also due to the synergistic effect, on human health, between the allergens present in pollen grains and atmospheric pollution [
1,
2,
3,
4,
5,
6].
Allergic diseases affect over a billion people worldwide [
7] and the role of pollen in the pathogenesis of these diseases is now well established. In fact allergic diseases, such as asthma and rhinitis, affect from 5 to 30% of the inhabitants of industrialized countries [
8]. To date, however, it is not fully understood the mechanism of the interaction between pollen allergens and air pollutants and further research will be needed to clarify the process by which biological pollutants can cause symptoms in exposed population.
Pollen and allergies are a recurring theme every spring. In fact, every year, in the different seasons, periodic environmental alarms are raised, such as high levels of PM
10 in winter or ozone in summer. Nevertheless in Italy the allergenic pollen season is spread from January (Cupressaceae) to November (
Ambrosia), (see ahead
Table 1).
In recent years, the recorded cases of pollen allergies in urban centers of Italy and Europe have been increasing [
5,
8]. This evidence cannot be explained only by genetic factors but the trend of allergenic pollen concentrations in the air must be investigated which, linked to green management and rapid urbanization, increases the number of people exposed to air pollution.
In recent years, the interest of scientific research for the monitoring of pollen, spores and other bioaerosols has increased due to the growing awareness of the importance of respiratory diseases. Furthermore, the role of climate change on the future worldwide distribution of bioaerosols and consequently on human health has influenced the growth of interest in this topic.
A review conducted in Scopus has in fact highlighted that the number of publications containing terms such as “pollen allergies” and “pollen predictions” is constantly increasing [
9].
It is therefore increasingly clear that aerobiological monitoring is an integral part of the assessment of air quality, in line with a significant number of epidemiological studies which show how the interaction between air pollutants and allergens can increase the risk of disease and the aggravation of symptoms [
10].
Aerobiology research has been working for years for the monitoring and assessment of air quality linked to pollutants of anthropogenic origin, and at the same time also carries out the analysis and evaluation of allergenic pollen sampled by Aerobiological Monitoring Networks.
The issues of interest to the scientific community and citizens are many and strongly linked to each other, in addition to the relationship between pollen and human health, the relationship between pollen and climate change will be deepened in the near future and a more modern, and informed, design will be supported. The aim must not be simply the reduction of allergic reactions, but more generally to contribute to the citizen’s well-being and awareness growth.
The purpose of this study was to evaluate the presence of monotonic trends of air concentration of the main allergenic taxa in the city of Rome from 2003 to 2019: Asteraceae (a family that include the
Ambrosia and
Artemisia genera), Betulaceae (main genera:
Alnus and
Betula), Corylaceae (which includes the genera
Carpinus,
Corylus and
Ostrya), Cupressaceae/Taxaceae (counted together in aerobiological monitoring), Poaceae (which includes many herbaceous allergenic plants widespread in Italy), Oleaceae (main genera:
Fraxinus and
Olea), Urticaceae (main genera:
Parietaria and
Urtica) and the
Alternaria spore [
11,
12,
13,
14,
15,
16,
17] and chapter S1 in
Supplementary Materials.
The assessment of a possible presence of an increasing or decreasing trend of specific allergenic taxa can provide a useful tool for interpreting symptoms in atopic subjects.
2. Materials and Methods
This paper compares homogeneous pollen concentration time series of data collected in Rome and describes the status and trend of the main allergenic taxa present in the study area during the years from 2003 to 2019 [
18,
19,
20,
21,
22].
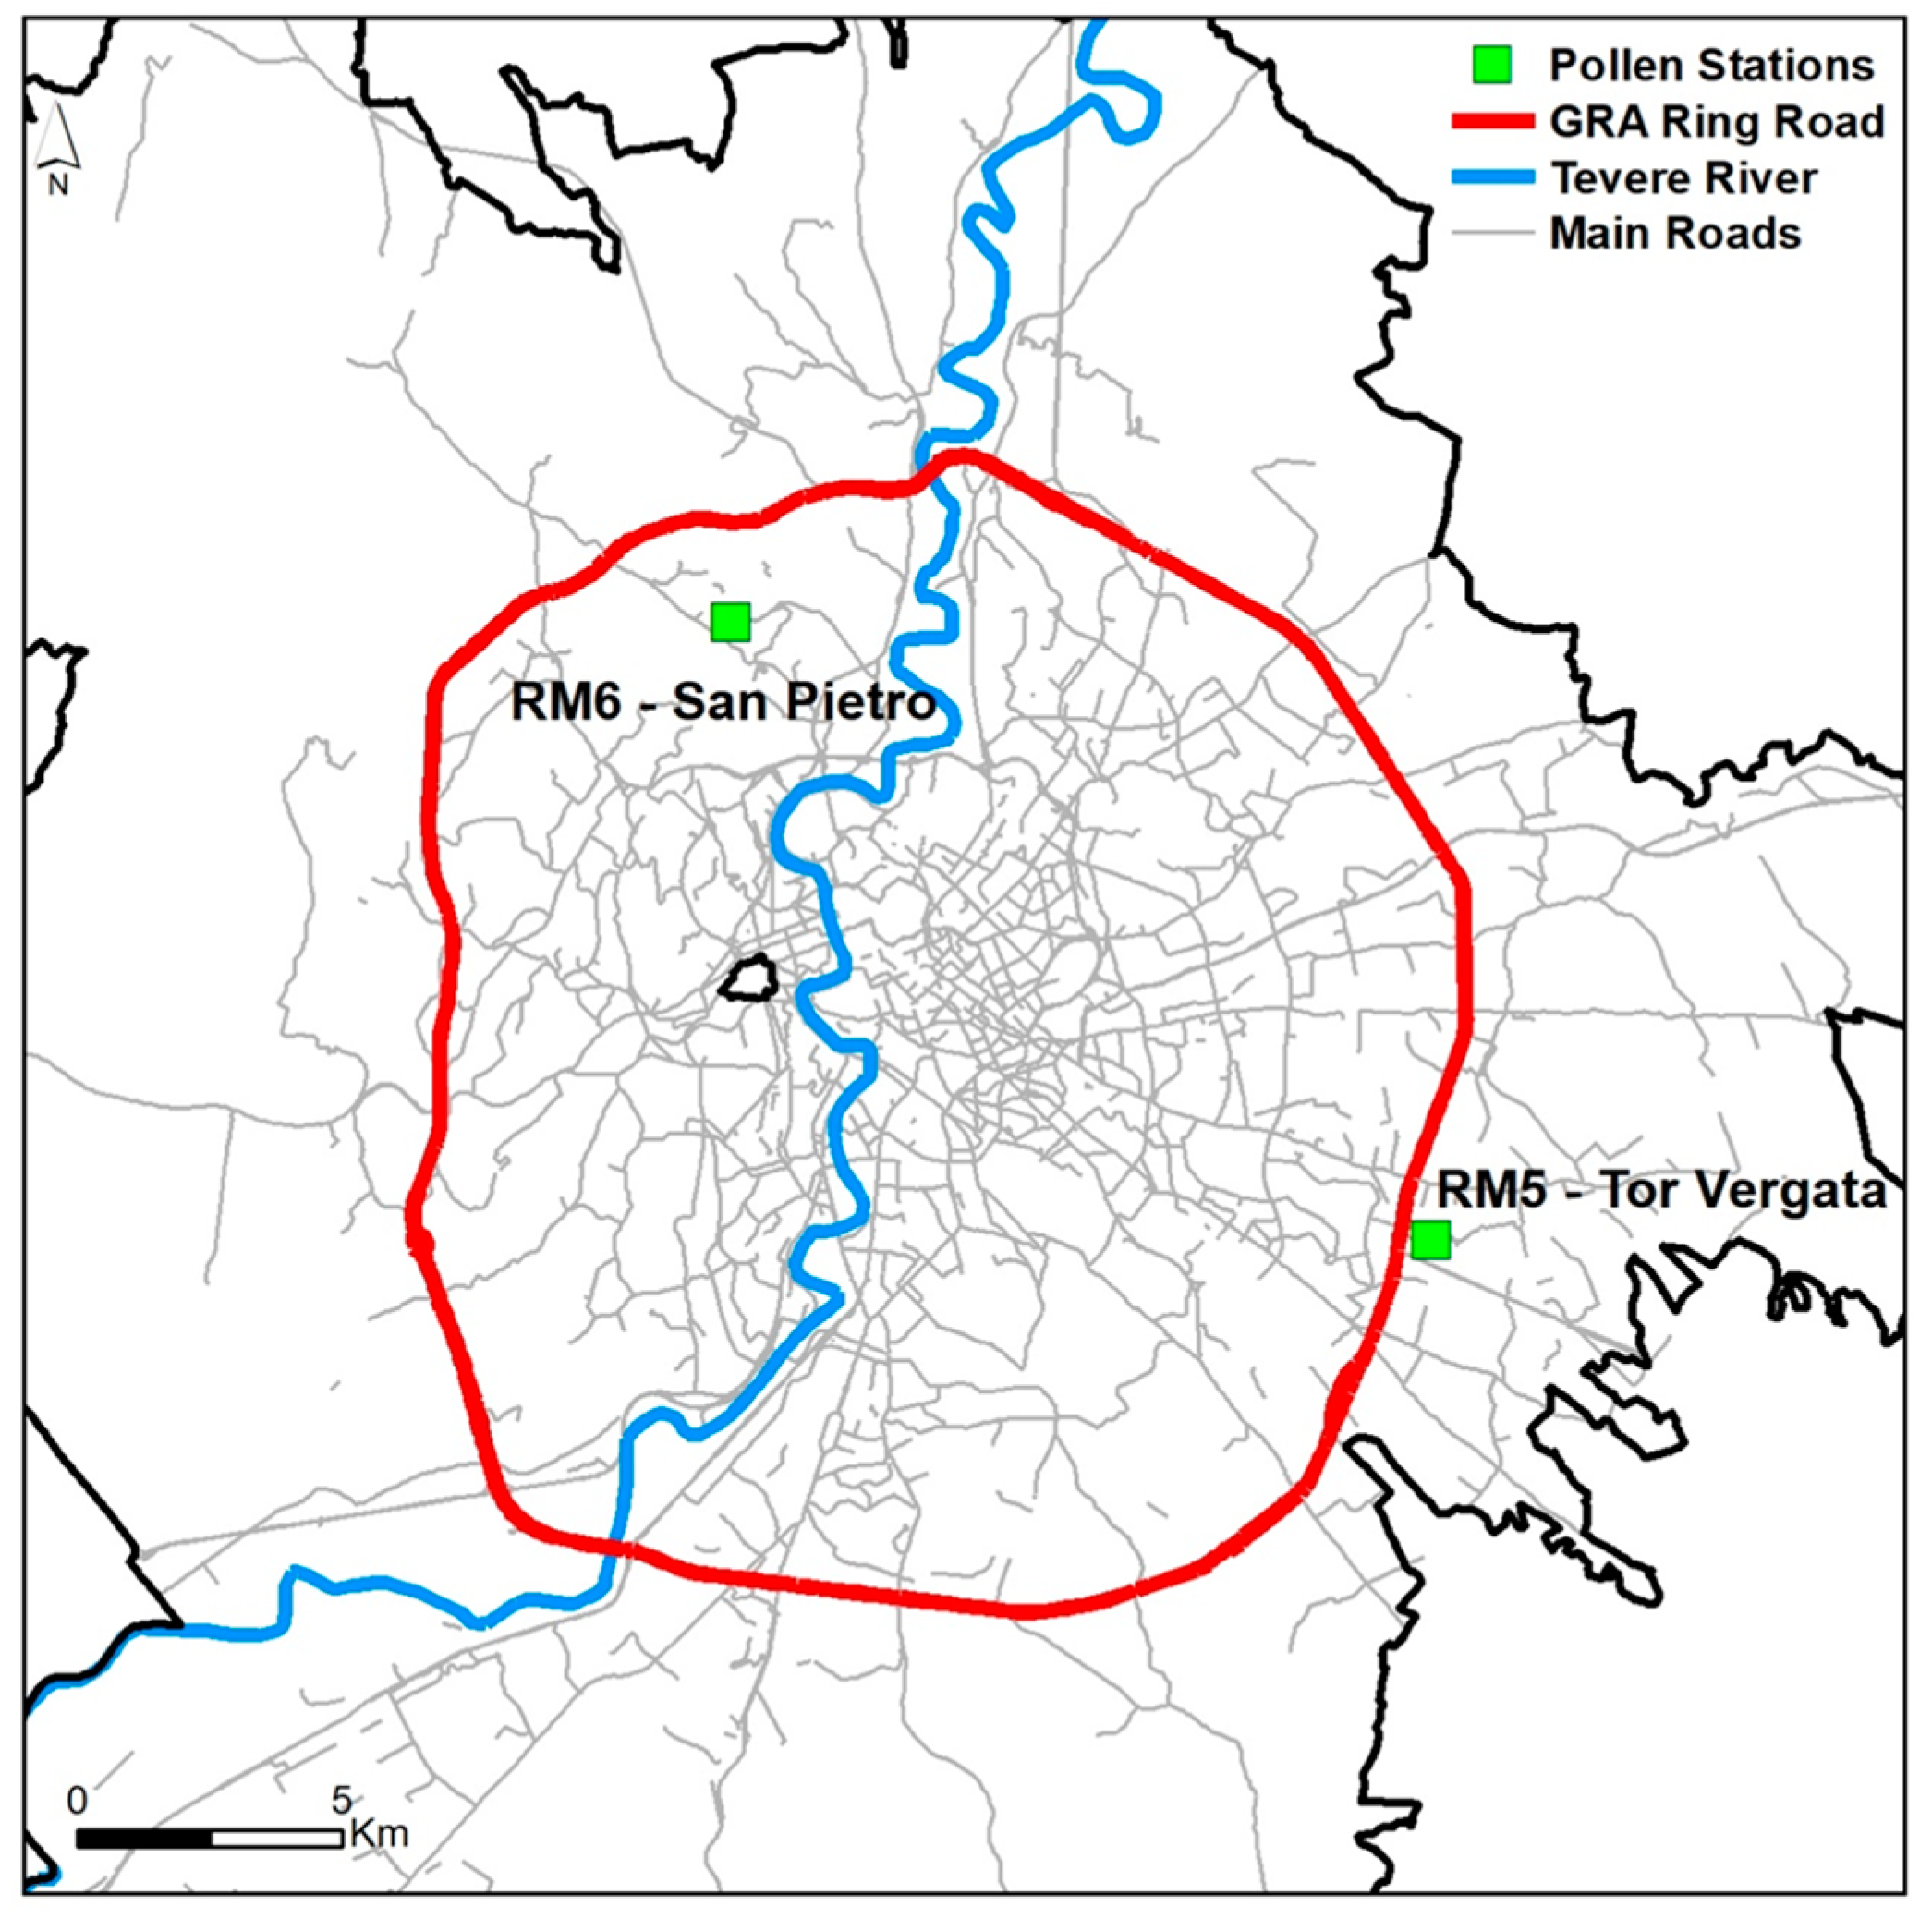
Pollen samples were collected and measured in two sampling sites by the Aerobiological monitoring center of Tor Vergata (see
Figure 1).
The spatial and temporal comparability of the data obtained in the two sites was calculated through the Pearson correlation analysis of daily concentrations.
Temporal trends of pollen and spores were realized using the Seasonal Kendall test in R software (R version 4.1.3, developed by R Core Team) [
23,
24].
Statistical analysis allowed to highlight the trends in the levels of allergenic species and how the distribution of peaks changes over time in order to link them to meteorological parameters and the flowering calendar.
The seasonally adjusted Kendall test is a non-parametric statistical hypothesis test aimed to evaluate the existence of a trend or an increasing or decreasing monotonous trend given a sufficiently large sample of data.
The first version of the test proposed by Mann in 1945 [
25] extended the analysis of the significance of the Kendall τ correlation coefficient [
26]—a test developed to evaluate the association between any two variables regardless of the distribution of the data—if one of the variables was time.
The Mann-Kendall test was modified to take into account the effects due to seasonality; the latter test is known as Seasonal Kendall Test (SK) or Kendall test corrected for seasonality [
27,
28].
It has been shown that among the various parametric and non-parametric tests available for trend analysis, the SK is among those that obtain the best performance, compared to other tests, evaluated through the use of fictitious time series [
29].
It is able to predict the existence of a statistically significant trend by keeping the error percentage below the predetermined value, and at the same time, to identify weak statistically significant trends where actually present in the fictitious series. As this is a non-parametric test, it is independent of the hypothesis of normality of the data. This method is robust in case of anomalous (outliers) and missing data and characterized by a relatively simple implementation [
30]. Furthermore, when applied to historical series of air pollution data, identifying and removing the seasonal component (seasonal adjustment) can improve the estimation of background trends, reducing the uncertainty associated with the estimate [
31].
In any case, trend analysis cannot disregard the availability of sufficiently long time series, in order to reduce the influence of years with atypical weather conditions that can mask an existent trend.
It has been shown that the uncertainty in determining the existence of a statistically significant trend in a series of air quality data increases exponentially with decreasing length of the series. To be able to appreciate very small decreasing or increasing trends, it is necessary to have datasets that are approximately 15 years long. With shorter series the trend becomes appreciable if it is more significant but the series must be at least seven years long. The normalization of data for the effects of meteorology allows to reduce the uncertainty associated with the estimate and therefore to appreciate the existence of a trend of the same order of magnitude starting from relatively less extensive data series [
32].
2.1. The Monitoring Stations
The pollen and spore concentration data for Rome were provided by the Aerobiological Monitoring Center of the Tor Vergata University of Rome (Station code: RM5).
The Tor Vergata Aerobiological Monitoring Center began its activity in 1996. The volumetric sampler VPPS 2000, located approximately 15 m above the ground on the roof of the Faculty of Mathematical, Physical and Natural Sciences, was installed a few years after the purchase of the meteorological station of the Botanical Garden (1991).
At the same time, a cognitive study of the flora of the Campus territory was carried out, before its transformation.
Soon the activity of the monitoring center was made available to the doctors of the university and of the city.
In 1999 the Center installed another monitoring station, 18 m above the ground on the roof of the S. Pietro Fatebenefratelli Hospital research center (Station code: RM6) in the northern zone of Rome.
Around the two stations (see
Figure 2) the vegetational picture is heterogeneous: evergreen and deciduous sclerophyllous woods on the right bank of the Tiber River, semi-natural meadows towards the eastern part of the city, up to deciduous broadleaf woods on the Alban hills and the Simbruini mountains [
33].
2.2. Instrumental Description
For the pollen monitoring a volumetric sampler-type Hirst [
34], recommended by the International Biological Program [
35], Model 2000 VPPS Lanzoni [
36], was used.
The Hirst device samples ambient air by a volumetric suction system, particles contained in the sampled air are deposited by impaction on a sampling surface and then examined with an optical microscope in order to identify and count the pollen and fungal spores per area.
The data acquisition was made following the procedure described in the UNI EN Standard 16868:2019 [
37] and reported in the Management and quality manual of the R.I.M.A. Italian Monitoring Network in Aerobiology (Manuale di gestione e qualità della Rete Italiana di Monitoraggio in Aerobiologia) [
38].
The pollen and spores data of the considered taxa were expressed as daily concentration in Pollen/m
3 (P/m
3) or Spore/m
3 [
39].
The Hirst device samples ambient air by a volumetric low-volume system [10 L/min] and pollen grains are collected on a moving acceptor surface. Samples are identified and counted by optical microscopy [
37,
40,
41,
42,
43].
3. Results and Discussion
3.1. Pollen Time Series in Rome
A first assessment that can be extrapolated from the analysis of the data from 2003 to 2019 concerns the predominant allergenic taxa in the study area. In this sense, both considered monitoring stations showed the analyzed taxa in the same order of presence even if with different quantity, due to the specific characteristics of the sampling sites.
The allergenic taxon presenting the highest average concentration in the air in Rome area is Cupressaceae/Taxaceae (whose pollen grains are counted together) with, respectively for stations RM5 and RM6, 36% and 63% of the average total concentration for the entire period. Second, for average air concentration, Urticaceae with, respectively for stations RM5 and RM6, 27% and 18% of the total; third taxon, for average presence, Poaceae with, respectively for stations RM5 and RM6, 16% and 8% of the total; fourth taxon, for average presence, Oleaceae with, respectively for stations RM5 and RM6, 10% and 5% of the total, followed by Corylaceae, Betulaceae and, lastly, Asteraceae with less than 1% at both stations (see the pie charts in
Figure 3).
The simple graphic evaluation of the time series is the first step in the evaluation of the possible variations over time of the concentrations of a pollutant in the air (see
Figure 4). What can be deduced from this representation is that the concentration levels are clearly based on the different pollen seasons [
44,
45], characteristic of each taxon, which are repeated regularly in the considered years (2003–2019).
For all the taxa, the temporal correspondence between the peak concentrations recorded in the sampling stations throughout the period is very good, which indicates that the two sampling sites respond to the same meteorological and climatic conditions. On the other hand, some evident differences emerge in the recorded concentration values, this can be explained by the botanical biodiversity that characterizes the neighbourhoods of the two sampling points [
46].
From the mere evaluation of these time series, however, it is not possible to understand whether, in the period considered, the concentration has significant trend, but only obtain indications on the phase correlation between the concentration values detected over time. The calculation of the correlation matrix between the variables observed for the period 2003–2019 (expressed as Pearson’s coefficient of the pairs of daily averages) revealed that all the taxa showed statistically significant correlations (p < 0.001) between the two sampling sites (Tor Vergata Center, RM5 and S. Pietro Hospital RM6), this indicates a good spatial representativeness for the urban area of Rome.
In contrast, the different taxa, both in the same station and between the two sampling sites, showed a minimal correlation, with the exception of the pairs: Cupressaceae/Taxaceae—Betulaceae; Corylaceae—Urticaceae; Poaceae—Oleaceae and Oleaceae—Urticaceae. This result can be mainly attributed to the different extension and timing of the pollen seasons, outside of which the emissions of pollen grains into the air tends to zero. The pairs of taxa showing a greater correlation in daily values are those with more overlapping pollen seasons (see
Table 2), where atmospheric stability variations represent a significant driver of concentrations in the air as for other atmospheric contaminants.
It is important to remember that, in aerobiology, there is no universally recognized definition of pollen season and the different calculation criteria used to obtain the start and end dates of a season (and consequently its duration) can influence the results [
44].
In this work, when we talk about the season or sporulation pollen of a taxon, we are referring to the start and end dates calculated according to Jäger et al. [
11], i.e., the most widely used criterion in Italian monitoring stations: pollen (or sporulation) season starts the first day with a count greater than 1% of the Annual Pollen Integral and it ends when 95% of the Annual Pollen Integral is attained.
3.2. Pollen Trends in Rome
In order to represent the aerobiological data in a homogeneous and comparable way in space and time, as for the other parameters describing air quality, indicators shared and adopted by the entire monitoring network are required.
In the activities of information to the public about the results of aerobiological monitoring, in the absence of national or European regulatory references, production indicators, such as Annual Pollen Integral and sporulation integral, are adopted as indicators of the presence in air of allergenic pollen.
Annual Pollen Integral of a Taxon (APIn) is the annual sum of the daily concentrations of airborne pollen recorded for a given pollen taxon. The Annual Pollen Integral is a parameter that depends on the quantity of airborne pollen of the taxon considered in the monitoring area, on the duration and intensity of the pollen season. The unit of measurement of the Annual Pollen Integral is Pollen * day/m3.
Annual Spore Integral (ASIn) is the annual sum of the daily concentrations of the airborne spores register for a given plant or fungal taxon. The Annual Integral is a parameter of which depends on the quantity of airborne spores of the taxon considered in the monitoring area, on the duration and on the pollen season. The unit of measurement of the integral of annual sporulation is Spore * day/m
3 [
47].
Generally, the simple observation of the variations of the Annual Pollen or Spore Integral [
48] does not allow to evaluate with certainty the existence of significant variations of the concentrations over time (see
Figure 5).
Scientific works on the trend of pollen indicators are generally addressed to the anticipation or postponement of phenological indicators (start or end of the pollen season) [
49,
50]. However, production indicators are just as important for evaluating the effects of airborne allergenic pollens on human health. In this sense the evaluation of the seasonal or annual integrals, representing these as average values, does not represent the best tool for understanding the impact on the respiration of atopic subjects. As for pollutants of anthropic origin, for a more accurate evaluation of the temporal variations of the concentrations it seems useful to rely on the concentrations with the shorter available mediation period, which is currently, for pollen and spores, the daily average concentration.
If treated with adequate aggregation criteria, pollen daily concentration data can be processed like air quality data, calculating the Temporal trends of the main allergenic pollen sampled in Rome, using the Seasonal Kendall test.
For the period from 2003–2019 we considered 7 pollen families and the
Alternaria spore and, in this period, the analysis of concentration trends showed a slight but statistically significant increase of Betulaceae in the RM6 station (0.01 <
p ≤ 0.05), a statistically significant decrease in both stations for Asteraceae (
p ≤ 0.001 for the RM5 station, 0.001 <
p ≤ 0.01 for the RM6 station) and Cupressaceae/Taxaceae (0.01 <
p ≤ 0.05 for the RM5 station,
p ≤ 0.001 for the RM6 station); a statistically significant decrease of Corylaceae (0.01 <
p ≤ 0.05) and Oleaceae (
p ≤ 0.001) in the RM6 station. For the considered period, Poaceae and Urticaceae were stable in both stations while the
Alternaria spore showed a strong and statistically significant decrease in both stations (
p ≤ 0.001, see
Table 2).
This approach allows to reveal significant trends in the pollen concentration levels recorded during the years (see, in
Figure 6, the Kendall trend test results for pollen and
Alternaria in Rome obtained with the open-source R package OpenAir for the period 2003–2019). These trends would not otherwise be evaluated by simply observing the changes in the Annual Pollen Integral, APIn.
4. Conclusions
Pollen grains and spores are part of the airborne particulate matter and the aerobiological monitoring networks, in this sense, are peculiar speciation networks for particulate matter and, as for anthropogenic pollutants, it is important to evaluate the temporal variations of the concentrations with a short mediation period. The choice to process an inadequate parameter can, in fact, hide the existence of a statistically significant trend which does exist.
In this article series of daily concentration from 2003 to 2019 of eight allergenic taxa (seven botanical families and the Alternaria spore) were analyzed with a significant importance for human health.
For the considered period, the allergenic taxon presenting the highest average concentration in the air in the study area was Cupressaceae/Taxaceae, followed by Urticaceae and Poaceae.
From the statistical analysis, carried out using the Kendall test corrected for seasonality, it emerged that, in most cases, the two stations present in the examined area show a consistent trend. This result indicates that the observed trend is not due to local phenomena but to a general trend of the examined territory. The elaborations carried out have also highlighted that the flowering calendar influence the concentration levels of the families considered over the years [
51].
In particular, significant decreasing trends, in both stations, were observed for Asteraceae, Cupressaceae/Taxaceae and the Alternaria spore. A significant decreasing trend for Corylaceae and Oleaceae was observed in the RM6 station and only a significant increasing trend, for Betulaceae, still in the RM6 station.
These results are offered as supplementary tools for a more complete assessment of air quality and its effects on human health in an urban environment.
The biological particulate, indeed, contributes to the mass concentration of PM10 and it is useful to estimate daily pollen concentration as for the other natural abiological contributions. The combined assessment of the biological and abiological component of atmospheric pollution can make a useful contribution to improving the knowledge of air quality for the protection of human health.
Supplementary Materials
The following supporting information can be downloaded at:
https://www.mdpi.com/article/10.3390/su15076150/s1. Chapter S1: Allergenic pollen and spore taxa in this study; Table S1: Pearson correlation coefficient for pollen and Alternaria in Rome (2003–2019).; Figure S1: Pearson correlation plot for pollen and Alternaria in Rome (2003–2019).
Author Contributions
Conceptualization, A.D.M.d.B., R.G., M.A.B. and A.T.; data curation, A.D.M.d.B., R.G., M.A.B. and A.T.; formal analysis A.D.M.d.B., R.G., M.A.B. and A.T.; investigation, A.D.M.d.B., R.G., M.A.B., D.D.F., A.M. and A.T.; methodology, A.D.M.d.B., R.G., M.A.B. and A.T.; supervision: A.D.M.d.B.; validation, A.D.M.d.B., A.T.; visualization: A.D.M.d.B., R.G., M.A.B., D.D.F., A.M. and A.T.; writing—original draft preparation A.D.M.d.B., R.G., M.A.B. and A.T.; writing—review and editing, A.D.M.d.B., A.T.; visualization: A.D.M.d.B., R.G., M.A.B., D.D.F., A.M. and A.T. All authors have read and agreed to the published version of the manuscript.
Funding
This research received no external funding.
Institutional Review Board Statement
Not applicable.
Informed Consent Statement
Not applicable.
Data Availability Statement
Not applicable.
Conflicts of Interest
The authors declare no conflict of interest.
References
- World Health Organization. Regional Office for Europe. (2003). Phenology and Human Health: Allergic Disorders: Report on a WHO Meeting Rome, Italy, 16–17 January 2003. Copenhagen: WHO Regional Office for Europe. Available online: https://apps.who.int/iris/handle/10665/107479 (accessed on 29 December 2022).
- Pfaar, O.; Bastl, K.; Berger, U.; Buters, J.; Calderon, M.A.; Clot, B.; Darsow, U.; Demoly, P.; Durham, S.R.; Galán, C.; et al. Defining pollen exposure times for clinical trials of allergen immunotherapy for pollen-induced rhinoconjunctivitis—An EAACI position paper. Allergy 2017, 72, 713–722. [Google Scholar] [CrossRef] [Green Version]
- Pyrhönen, K.; Kulmala, P. Occurrence of pollen season at the end of the first trimester predicts clinical atopic diseases in the offspring: A Finnish population-based study. Int. J. Hyg. Environ. Heal. 2020, 225, 113452. [Google Scholar] [CrossRef]
- Glick, S.; Gehrig, R.; Eeftens, M. Multi-decade changes in pollen season onset, duration, and intensity: A concern for public health? Sci. Total Environ. 2021, 781, 146382. [Google Scholar] [CrossRef] [PubMed]
- D’Amato, G.; Cecchi, L.; Bonini, S.; Nunes, C.; Annesi-Maesano, I.; Behrendt, H.; Liccardi, G.; Popov, T.; Van Cauwenberge, P. Allergenic pollen and pollen allergy in Europe. Allergy 2007, 62, 976–990. [Google Scholar] [CrossRef] [PubMed]
- Bucchianico, A.D.M.D.; Brighetti, M.A.; Cattani, G.; Costa, C.; Cusano, M.; De Gironimo, V.; Froio, F.; Gaddi, R.; Pelosi, S.; Sfika, I.; et al. Combined effects of air pollution and allergens in the city of Rome. Urban For. Urban Green. 2018, 37, 13–23. [Google Scholar] [CrossRef]
- EAACI, Global Atlas of Allergy, European Academy of Allergy and Clinical Immunology. 2014. Available online: www.eaaci.org (accessed on 2 April 2023).
- Sofiev, M.; Bergmann, K.C. Allergenic Pollen—A Review of the Production, Release, Distribution and Health Impacts; Springer: Berlin, Germany, 2013. [Google Scholar]
- Maya-Manzano, J.M.; Smith, M.; Markey, E.; Clancy, J.H.; Sodeau, J.; O’connor, D.J. Recent developments in monitoring and modelling airborne pollen, a review. Grana 2020, 60, 1–19. [Google Scholar] [CrossRef]
- Lam, H.C.; Jarvis, D.; Fuertes, E. Interactive effects of allergens and air pollution on respiratory health: A systematic review. Sci. Total Environ. 2020, 757, 143924. [Google Scholar] [CrossRef]
- APG. An update of the Angiosperm Phylogeny Group classification for the orders and families of flowering plants: APG II. Bot. J. Linn. Soc. 2003, 141, 399–402. [Google Scholar] [CrossRef] [Green Version]
- APG. An update of the Angiosperm Phylogeny Group classification for the orders and families of flowering plants: APG IV. Bot. J. Linn. Soc. 2016, 181, 2–3. [Google Scholar]
- Travaglini, A.; Brighetti, M.A.; Arsieni, A.; Vinciguerra, F. Atlante del Polline delle Principali Specie Allergeniche d’Italia; Il Raggio Verde: Lecce, Italy, 2014. [Google Scholar]
- Rodríguez-Rajo, F.J.; Grewling, L.; Stach, A.; Smith, M. Factors involved in the phenological mechanism of Alnus flowering in Central Europe. Ann. Agric. Environ. Med. 2009, 16, 277–284. [Google Scholar]
- Picornell, A.; Buters, J.; Rojo, J.; Traidl-Hoffmann, C.; Damialis, A.; Menzel, A.; Bergmann, K.; Werchan, M.; Schmidt-Weber, C.; Oteros, J. Predicting the start, peak and end of the Betula pollen season in Bavaria, Germany. Sci. Total Environ. 2019, 690, 1299–1309. [Google Scholar] [CrossRef]
- Muzalyova, A.; Brunner, J.O.; Traidl-Hoffmann, C.; Damialis, A. Forecasting Betula and Poaceae airborne pollen concentrations on a 3-hourly resolution in Augsburg, Germany: Toward automatically generated, real-time predictions. Aerobiologia 2021, 37, 425–446. [Google Scholar] [CrossRef]
- Galán, C.; García-Mozo, H.; Cariñanos, P.; Alcázar, P.; Domínguez-Vilches, E. The role of temperature in the onset of the Olea europaea L. pollen season in southwestern Spain. Int. J. Biometeorol. 2001, 45, 8–12. [Google Scholar] [CrossRef]
- Jäger, S.; Nilsson, S.; Berggren, B.; Pessi, A.-M.; Helander, M.; Ramfjord, H. Trends of some airborne tree pollen in the Nordic countries and Austria, 1980–1993. Grana 1996, 35, 171–178. [Google Scholar] [CrossRef] [Green Version]
- Clot, B. Trends in airborne pollen: An overview of 21 years of data in Neuchâtel (Switzerland). Aerobiologia 2003, 19, 227–234. [Google Scholar] [CrossRef]
- Emberlin, J.; Jaeger, S.; Domínguez-Vilches, E.; Soldevilla, C.G.; Hodal, L.; Mandrioli, P.; Lehtimäki, A.R.; Savage, M.; Spieksma, F.T.; Bartlett, C. Temporal and geographical variations in grass pollen seasons in areas of west0ern Europe: An analysis of season dates at sites of the European pollen information system. Aerobiologia 2000, 16, 373–379. [Google Scholar] [CrossRef]
- Makra, L.; Matyasovszky, I.; Deák, J. Trends in the characteristics of allergenic pollen circulation in central Europe based on the example of Szeged, Hungary. Atmos. Environ. 2011, 45, 6010–6018. [Google Scholar] [CrossRef]
- Cristofolini, F.; Anelli, P.; Billi, B.M.; Bocchi, C.; Borney, M.F.; Bucher, E.; Cassoni, F.; Coli, S.; De Gironimo, V.; Gottardini, E.; et al. Temporal trends in airborne pollen seasonality: Evidence from the Italian POLLnet network data. Aerobiologia 2019, 36, 63–70. [Google Scholar] [CrossRef]
- Carslaw, D.C.; Ropkins, K. Openair—An R package for air quality data analysis. Environ. Model. Softw. 2012, 27, 52–61. [Google Scholar]
- R Core Team. R: A Language and Environment for Statistical Computing; R Foundation for Statistical Computing: Vienna, Austria, 2013; ISBN 3-900051-07-0. Available online: http://www.R-project.org/ (accessed on 2 April 2023).
- Mann, H.B. Non-parametric test against trend. Econometrica 1945, 13, 245–259. [Google Scholar] [CrossRef]
- Kendall, M.G. A New Measure of Rank Correlation. Biometrika 1938, 30, 81. [Google Scholar] [CrossRef]
- Cattani, G.; Di Menno di Bucchianico, A.; Dina, D.; Inglessis, M.; Notaro, C.; Settimo, G.; Viviano, G.; Marconi, A. Evaluation of the temporal variation of air quality in Rome, Italy from 1999 to 2008. Ann. Ist. Super Sanità 2010, 46, 242–253. [Google Scholar]
- Hirsch, R.M.; Slack, L.R. A nonparametric trend test for seasonal data with serial dependence. Water Resour. Res. 1984, 20, 727–732. [Google Scholar] [CrossRef] [Green Version]
- Cunha, M.; Ribeiro, H.; Costa, P.; Abreu, I. A comparative study of vineyard phenology and pollen metrics extracted from airborne pollen time series. Aerobiologia 2014, 31, 45–56. [Google Scholar] [CrossRef]
- Hess, A.; Iyera, H.; MalmbGardner, W. Linear trend analysis: A comparison of methods 2000. Atmos. Environ. 2001, 35, 5211–5222. [Google Scholar] [CrossRef]
- Anttila, P.; Tuovinen, J.P. Trends of primary and secondary pollutant concentrations in Finland in 1994–2007. Atmos. En-Vironment 2010, 44, 30–41. [Google Scholar] [CrossRef]
- Hoogerbrugge, R.; Denier van der Gon, H.A.C.; Van Zanten, M.C.; Matthijesen, J. Trends in Particulate Matter, Bihlthoven, Nether-Lands Research Program on Particulate Matter, Report 500099014. 2010. Available online: https://www.pbl.nl/sites/default/files/downloads/500099014_0.pdf (accessed on 29 December 2022).
- Caiola, M.G.; Mazzitelli, A.; Capucci, E.; Travaglini, A. Monitoring pollinosis and airborne pollen in a Rome university. Aerobiologia 2002, 18, 267–275. [Google Scholar] [CrossRef]
- Hirst, J.M. Changes in atmospheric spore content: Diurnal periodicity and the effects of weather. Trans. Br. Micol. Soc. 1952, 36, 375–393. [Google Scholar] [CrossRef]
- Benninghoff, W.S.; Edmonds, R.L. Ecological Systems Approaches to Aerobiology. I. Identification of Component Elements and Their Functional Relationships. International Biological Program; University of Michigan: Ann Arbor, MI, USA, 1972. [Google Scholar]
- Mandrioli, P. Metodica di campionamento e conteggio dei granuli pollinici e delle spore fungine aerodisperse. In Il Monitoraggio Aerobiologico in Emilia Romagna; Regione Emilia Romagna, Unità Sanitaria Locale: Ferrara, Italy, 1994; Volume 30, pp. 9–19. [Google Scholar]
- UNI EN 16868:2019; Ambient Air—Sampting and Anaiysis of Airborne Pollen Grains and Fungal Spores for Networks Related to Allergy—Volumetric Hirst Method. UNI EN: Milan, Italy, 2019.
- Travaglini, A.; Albertini, R.; Zieger, E.; Brighetti, M.A.; Ugolotti, M.; Torrigiani, T. (Eds.) Manuale di Gestione e Qualità della Rete Italiana di Monitoraggio in Aerobiologia R.I.M.A.®; Tipografia LEGO: Bologna, Italy, 2009; ISBN 978-88-900277-1-0. [Google Scholar]
- Mandrioli, P.; Comtois, P.; Levizzani, V. Methods in Aerobiology; Pitagora Editrice: Bologna, Italy, 1998. [Google Scholar]
- ISPRA, POLLnet—Linee Guida per il Monitoraggio Aerobiologico, Manuali e Linee Guida 151/2017, ISPRA, Rome, Italy, ISBN 978-88-448-0820-4. Available online: https://www.isprambiente.gov.it/files2017/pubblicazioni/manuali-linee-guida/445364_Manuale_linee_guida_151_17.pdf (accessed on 29 December 2022).
- Hirst, J.M. An automatic volumetric spore trap. Ann. Appl. Biol. 1952, 36, 257–265. [Google Scholar] [CrossRef]
- Caulton, E.; Lacey, M.E.; Allitt, U.; Crosby, R.; Emberlin, J.; Hirst, J.M. Airborne Pollens and Spores: A Guide to Trapping and Counting; The British Aerobiology Federation: Harpenden, UK, 1995. [Google Scholar]
- UNI 11 108:2 004; Air Quality; Method for Sampling and Counting Airborne Pollen Grains and Fungal Spores Italy. UNI: Milan, Italy, 2004.
- Jato, V.; Rodríguez-Rajo, F.J.; Alcázar, P.; De Nuntiis, P.; Galán, C.; Mandrioli, P. May the definition of pollen season influence aerobiological results? Aerobiologia 2006, 22, 13–25. [Google Scholar] [CrossRef] [Green Version]
- Bastl, K.; Kmenta, M.; Berger, U.E. Defining Pollen Seasons: Background and Recommendations. Curr. Allergy Asthma Rep. 2018, 18, 73. [Google Scholar] [CrossRef] [Green Version]
- Alessandro, T. Aerobiological Biodiversity in the Metropolitan City of Rome. Int. J. Environ. Sci. Nat. Resour. 2022, 30, 1–7. [Google Scholar] [CrossRef]
- Galán, C.; Ariatti, A.; Bonini, M.; Clot, B.; Crouzy, B.; Dahl, A.; Fernandez-González, D.; Frenguelli, G.; Gehrig, R.; Isard, S.; et al. Recommended terminology for aerobiological studies. Aerobiologia 2017, 33, 293–295. [Google Scholar] [CrossRef]
- Ziello, C.; Sparks, T.; Estrella, N.; Belmonte, J.; Bergmann, K.C.; Bucher, E.; Brighetti, M.A.; Damialis, A.; Detandt, M.; Galán, C.; et al. Changes to Airborne Pollen Counts across Europe. PLoS ONE 2012, 7, e34076. [Google Scholar] [CrossRef] [PubMed]
- Marchesi, S. Trend analysis of aerobiological indicators associated with allergenic pollens in Emilia-Romagna, Northern Italy. Aerobiologia 2019, 36, 37–43. [Google Scholar] [CrossRef]
- Marchesi, S. Alternaria spores in Emilia-Romagna, Northern Italy: Current diffusion and trends. Aerobiologia 2019, 36, 31–36. [Google Scholar] [CrossRef]
- Di Menno di Bucchianico, A.; Gaddi, R.; Cattani, G.; Brini, S.; Bucher, E.; Rossi, M.; Corona, M.; Pellegrini, E.; Scopano, E.; Bartiromo, M.; et al. Stato e trend dei principali pollini allergenici in Italia (2003–2019), ISPRA Report 338/2021, ISBN 978-88-448-1037-5. Available online: https://www.isprambiente.gov.it/it/pubblicazioni/rapporti/stato-e-trend-dei-principali-pollini-allergenici-in-italia-2003-2019 (accessed on 29 December 2022).
| Disclaimer/Publisher’s Note: The statements, opinions and data contained in all publications are solely those of the individual author(s) and contributor(s) and not of MDPI and/or the editor(s). MDPI and/or the editor(s) disclaim responsibility for any injury to people or property resulting from any ideas, methods, instructions or products referred to in the content. |
© 2023 by the authors. Licensee MDPI, Basel, Switzerland. This article is an open access article distributed under the terms and conditions of the Creative Commons Attribution (CC BY) license (https://creativecommons.org/licenses/by/4.0/).


 ,
, 


