Article

Forecasting and Coupled Coordination Analysis of Supply and Demand for Sustainable Talent in Chinese Agriculture

1
School of Economics and Management, Northeast Forestry University, Harbin 150036, China
2
School of Management, Bohai College of Hebei Agricultural University, Cangzhou 061108, China
3
Institute for Global Environmental Strategies (IGES), Kanagawa 240-0115, Japan
*
Authors to whom correspondence should be addressed.
Sustainability 2023, 15(9), 7127; https://doi.org/10.3390/su15097127
Submission received: 5 April 2023 / Revised: 22 April 2023 / Accepted: 23 April 2023 / Published: 24 April 2023

Abstract

:
In recent years, China has achieved notable results with its poverty alleviation program, the focus of which is shifting toward the comprehensive promotion of rural revitalization. The role played by sustainable human resources in agriculture is becoming increasingly prominent. In this context, China’s sustainable talent in agriculture is used as the research object, and a neural network analysis method is applied to construct a prediction model of sustainable agricultural talent to forecast its supply and demand. The prediction aims to provide a scientific basis for the strategic planning of talent development for rural revitalization. Based on the forecast results by region and province, we analyzed the level of coordinated development of talent supply and demand to provide a reference for the coordinated development of supply and demand of sustainable talent in agriculture in China. The results showed that a large sustainable agricultural talent demand gap exists in China. The overall talent supply and demand coupling coordination level is low; we found significant differences among different regions and provinces, characterized by decreasing order of the northeast, central, west, and east. According to the socio-economic development level, agricultural economic foundation, and other factors, we divided the provinces into six types for analysis. To promote the coordinated development of sustainable human agricultural resources, talent policy support at the national level is required to reduce the loss of human resources to other countries; at the regional level, the talent environment for rural revitalization should be optimized to increase the attraction of talent. At the provincial level, agricultural and forestry education resources should be created to increase the supply of sustainable agricultural talent.

1. Introduction

Recently, the focus of China’s efforts on agriculture, rural areas, and farmers has shifted from poverty alleviation to the comprehensive promotion of rural revitalization. The implementation of this rural revitalization strategy was an important decision by the 19th National Congress of the Communist Party of China and is a necessary task to achieve socialist modernization and promote the comprehensive development of agriculture and rural areas. In the recent 20th National Congress, the rural revitalization strategy was recognized as an important foundation for high-quality development.
From past development experience, we understand that to revitalize rural areas, human resource support is essential. The transition of agricultural production from traditional agriculture to modern agriculture is the core of rural revitalization, and it is also the premise and foundation for the successful implementation of rural revitalization [1]. In the process of accelerating the modernization of agriculture and contributing the “Chinese model” to the world of agriculture, talents have an irreplaceable role. General Secretary Xi Jinping also stated that “development is the first priority, talent is the first resource, and innovation is the first driving force”. With the tension between economic development and the ecological environment intensifying, the concept of sustainable development has completed the continuous enrichment from philosophy to connotation and gradually become a systematic way of thinking [2]. The connotation of sustainable talents emphasizes “all-rounded people“ rather than merely one-dimensional technical talents [3]. It requires talents to be able to recognize the inextricable and complex relationships among economy, society, resources, and environment, to build up an interdisciplinary knowledge background and way of thinking, to be good at integrating all elements, and to promote sustainable development of things with dynamic development ideas. Sustainability is an important feature of agricultural modernization; the two are complementary and mutually reinforcing [4]. In other words, if agricultural modernization cannot achieve sustainable development, then it cannot be called qualified modernization; if sustainable agricultural development leaves agricultural modernization, then it cannot achieve sustainability well. Therefore, as the key link between traditional and modern agriculture, sustainable talent in agriculture is the backbone of promoting the rural revitalization strategy.
As agricultural reform advances, the demand for sustainable talent continues to grow. An important prerequisite for talent-based support is achieving talent matching and coordination [5]. Recently, under the guidance of national talent policy formulation and practical measures taken by departments at all levels, sustainable human resources development in agriculture has achieved various milestones [6]. However, from the perspective of the general environment, the supply and demand of talent in the process of revitalizing rural areas are still problematic; talent loss, insufficient supply, or skill mismatch remain problems [7]. Against this background, the trend of supply and demand of sustainable agricultural talent in China must be analyzed, and the imbalances must be explored to promote the effective and coordinated development of talent supply and demand and promote the implementation of the rural revitalization strategy.

2. Literature Review

2.1. Talent Forecasting Research

Scientific and reliable trend analysis of talent supply and demand is achieved with the assistance of forecasting theory. At present, many scholars have studied various types of talent forecasting. Some scholars have forecasted the total number of human resources in a specific region [8,9]; some scholars have predicted specific types of talent according to the nature of the work, such as the forecast of party and government talents [10], professional and technical talents [11], and highly skilled talent [12,13]; and some scholars have forecasted the human resources in a certain industry [14,15,16], such as smart cars, coal, vocational education, electronic information services [17,18], cross-cultural journalism and communication [19], sports [20,21,22], and medical care [23]. The forecasting methods used in the research process are becoming increasingly abundant. In general, they can be divided into two categories: qualitative [24] and quantitative [25], with the latter being used more frequently. The main quantitative methods include correlation regression, the gray system method, the backpropagation (BP) neural network, and combinations of multiple methods for forecasting. Each type of forecasting method has different advantages and application contexts. BP neural networks are able to effectively deal with linear and nonlinear mapping relationships between variables through the backpropagation of information and are remarkably superior in prediction [26].

2.2. Talent Supply and Demand Research

The research on the supply and demand of talent is essentially a talent management study. With the development of the knowledge-based economy, the importance of human resources management has become increasingly prominent [27,28], which can be defined as “the process by which an organization anticipates and meets its talent needs” [29]. Researchers have developed a rich body of information on issues related to the field of talent management, providing important guidance for achieving talent alignment. Positive subjective employee perceptions [30,31] and an appropriate corporate development climate [32] contribute to an increase in talent supply; industry and social trends provide important guides for analyzing changes in talent demand [33,34]. Researchers have directly investigated the talent coordination management problem, such as Erin et al., who developed a theoretical analysis framework for the talent skill mismatch problem in supply chain management [5]. Ruse and Huang analyzed the talent mobility and talent curve problems, respectively [35,36].
Although talent management has long been of interest to practitioners, and academic research in this field has been fruitful, few scholars have studied sustainable talent management in agriculture. Based on the above analysis, the main contributions and innovations of this study are summarized as follows:
(1)
Considering the 31 provinces (cities) in mainland China as the study object, we used a BP neural network model to predict the supply and demand situation of talent in the decisive node of the rural revitalization strategy in 2035;
(2)
We used the coupled coordination degree model to measure the level of talent supply and demand trends in each province (city) in China to provide a basis for improving this level in agriculture;
(3)
We delineated the types of talent supply and demand trends in each province (city) in China and analyzed the specific supply and demand conflicts in each region, thereby providing a reference for sustainable talent training in agriculture.

3. Materials and Methods

3.1. Data Material

For the BP neural network, we needed to determine the output and input factors. First, we determined the output factor. Our purpose in this study was to predict the future trends in talent supply and demand and to analyze the level of coordination between them on this basis. So, the neural network model contained two output factors: talent supply and talent demand. Our accounting methods and bases of the two factors were as follows:
Based on the concept of talent supply and demand, we determined the idea of sustainable talent supply and demand measurement in agriculture. Talent supply is the sum of human resources that can be immediately put into production, service, and other activities in a certain time period. Generally, talent is mainly supplied by two sources: (1) the human resources produced by the education and training activities of relevant institutions or organizations. At present, the training programs of various types of educational activities have implemented the concept of sustainability in the education process, and in this case, the training is completed to achieve a sustainable talent supply. (2) People with the ability to engage in professional and technical work in other channels. Talent demand is the number of people required to meet the production and consumption needs in a certain time period and is determined by the labor market. Therefore, it can be measured by the current number of jobs. Because the available statistics do not directly reflect the total amount of talent supply and demand at the moment, we drew upon accounting concepts of talent supply and demand in existing studies [37]. We measured the amount of talent supply and demand from the input–output perspective according to the following method:
Current year’s talent supply = number of students graduating from higher agricultural and forestry colleges and universities + last year’s state-owned enterprises and institutions professional and technical personnel.
Current year’s talent demand = (agricultural professionals of state-owned enterprises and institutions/number of employees in state-owned units) × number of employees in primary industry.
The primary industry here is based on the division in China’s National Economic Classification, which is a general term for agriculture, forestry, animal husbandry, and fishery.
The largest proportion of sustainable talent in agriculture is selected from state-owned enterprises and institutions [37], so we used these data to represent the supply from other sources in supply accounting. We accounted for the supply and demand as theoretical extremes. The use of the theory of extreme values can compensate for incomplete data, and, as one of the main methods used for solving optimal control problems in management, it can reflect the conditions and requirements for the development of an orderly structure of a system to a higher level.
Second, we determined the input factors. As special capital, the supply and demand of talent are influenced by various aspects. Many studies have focused on the factors influencing talent supply and demand. If all the influencing factors are used as input factors to build a neural network model, the network dimensions would be redundant, the computational burden of the network would be high, and the speed and stability of network convergence would be reduced. Therefore, including all factors in a prediction model is neither necessary nor possible [38]. Therefore, to ensure the simplicity and operability of the prediction model and in combination with existing studies, we introduced the regional economic development level [39,40] and the rural economic level [41] as input factors for modeling. Both have influential effects on talent supply and demand, which we measured by the regional GDP and net income per rural household indicators, respectively.
The data involved in the study included the number of students graduating from higher agricultural and forestry institutions in each region (China Education Statistical Yearbook), the number of agricultural technicians in state-owned enterprises and institutions in each region (China Science and Technology Statistical Yearbook), the number of employees in state-owned units in each region (China Labor Statistical Yearbook), the number of employees in the primary industry in each region (provincial and municipal statistical yearbooks), and the GDP of each region, number of employees in state-owned units in each region (China Labor Statistical Yearbook), number of employees in primary industries in each region (provincial and municipal statistical yearbooks), gross domestic product in each region (China Statistical Yearbook), and per capita net income of rural households (China Rural Statistical Yearbook). The data ranged from 2000 to 2019, and we estimated the data by linear interpolation for individual years where some data were missing.

3.2. Method

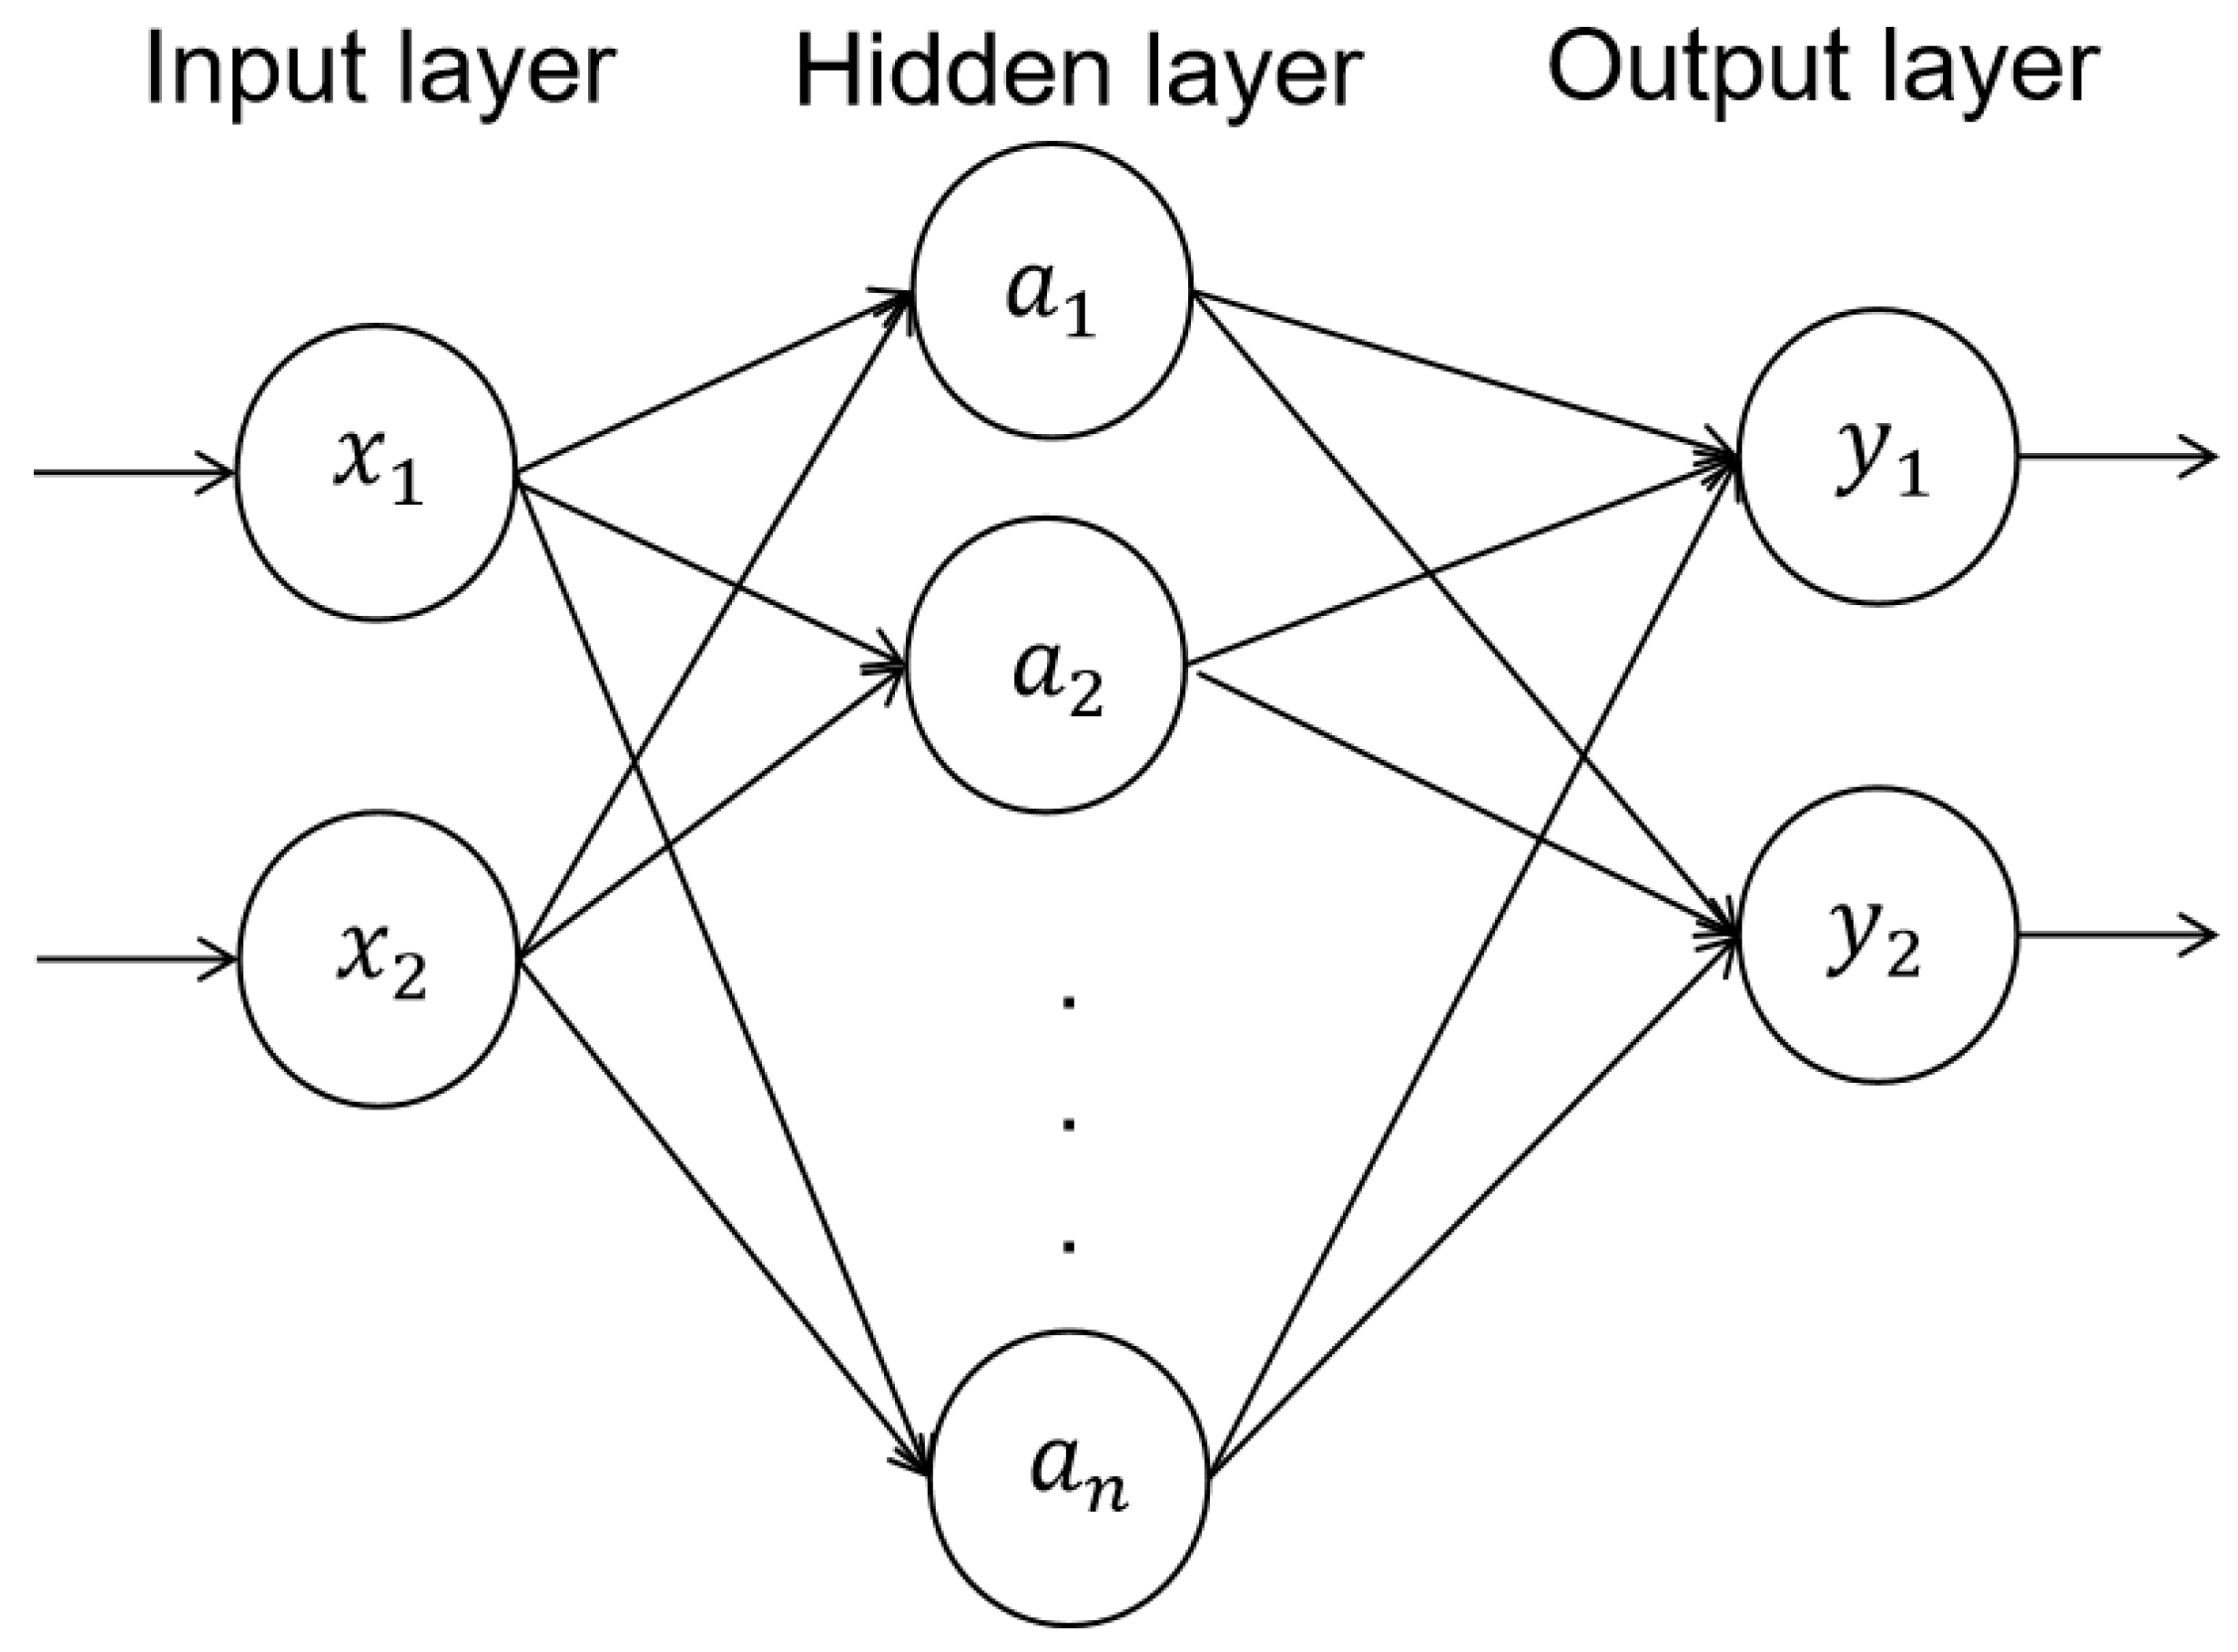
3.2.1. BP Neural Network Model

A BP neural network is a multilayer neural network with a structure consisting of input, hidden, and output layers. The number of neurons in the input and output layers is determined by the number of explanatory and interpreted variables, respectively. In particular, the settings related to the implicit layer are more flexible. The implicit layer can be used or not, according to the actual problem. If implicit layers are chosen, the number of layers and neurons in each layer can also be chosen differently. Because a three-layer feedforward network can approximate any nonlinear function, a single implicit layer is generally chosen to build a three-layer BP neural network structure. The number of neurons is determined by actual debugging. Both the implicit and output layers of the network need to set the activation function, and the value of each layer is obtained from the calculation of the activation function of the combination of the weights of the upper layer values. The network training process consists of forward and backward propagation, where forward propagation occurs from the input layer through the implicit layer to the output layer to determine the actual output value, and backward propagation adjusts the combination of weights between the layers according to the error between the actual output and the target output according to the δ -learning rule. The weight adjustment for the δ -learning rule is shown in Equation (1).
Δ W = η r X = η ( t i f ( W j T X ) ) f ( W j T X ) X
η is the learning rate, r is the learning signal, X is the corresponding input, t i is the target output, f is the activation function, and W j T is the weight.
In the three-layer BP neural network, let the input vector of layer 0 be X = ( x 1 , x 2 , , x m ) T , the output vector of the hidden layer of layer 1 be S = ( s 1 , s 2 , , s n ) T , and the output vector of layer 2 be Y = ( y 1 , y 2 , , y m ) T , then the output of the n th neuron of the hidden layer species is shown in Equation (2).
v n = f 1 ( m = 1 M ω m n x m b n )   ( n = 1 , 2 , , N )
In Equation (2), v n is the output value of each node; ω m n is the weight between node m and node n ; b n is the threshold value of node n , and f 1 is the activation function of the hidden layer. The output of the j th given neuron of the output layer is shown in Equation (3).
y j = f 2 ( n = 1 N ω n j v n θ j )   ( j = 1 , 2 , , J )
In Equation (3), y j is the output value of each node; ω n j is the weight between node n and node j , θ j is the threshold value of node j , and f 2 is the output layer activation function. There are various types of activation function forms, and the function form with a better fitting effect should be selected after several experiments.
We divided the collected data into 31 groups by province, and we wrote the network program code to train the BP neural network. We used the values from 2000 to 2016 from the 31 sets of data as the training set samples and the values from 2017 to 2019 as the testing set samples. By testing different activation functions in the implicit and output layers, we selected the most suitable network according to the fitting and prediction effects. We chose the coefficient of determination ( R 2 ) to measure the model fitting effect, where a larger R 2 indicates a better fitting effect. We selected the mean relative error (MRE), root mean square error (RMSE) and mean absolute error (MAE) to evaluate the model prediction accuracy, where the smaller the MRE, RMSE and MAE, the higher the model accuracy [42].
The fitting process of the talent supply and demand model for the 31 provinces required continuous debugging to determine the final model. The BP neural network structure that we used is shown in Figure 1.
In the input layer, input neurons x1 and x2 correspond to the regional GDP and rural household net income per capita factors, respectively. The setting of the number of neurons in the hidden layer influences the model results, and the number of neurons in the hidden layer is chosen differently in different regions of the BP neural network model. The output layers y1 and y2 correspond to the talent supply and talent demand, respectively.
In fitting talent supply and demand, we selected the activation function with a better fitting and forecasting effect for predictions according to the debugging results. In the network model that we determined, the activation function of the implicit layer was the normalized radial basis function radbasn, and the activation function of the output layer was the linear function purelin, except for the implied layer of individual provinces, for which we adopted the transfer function logsig.

3.2.2. Coupling Coordination Model

“Coupling” refers to the phenomenon in which two or more elements or systems interact with each other. The coupling degree is often used to measure the strength of the interaction between elements or systems [16]. According to the concept of coupling degrees, we quantitatively evaluated the level of relationship between the supply and demand of sustainable agricultural talent. Using the coupling degree model, we obtained the coupling degree function of supply and demand for sustainable talent in agriculture as follows:
C = f ( x ) × g ( x ) ( f ( x ) + g ( x ) 2 ) 2
In Equation (4), C is the coupling degree, and its value ranges from 0 to 1. f ( x ) and g ( x ) are the normalized values of supply and demand of sustainable agricultural talents after de-quantization treatment, respectively.
In the coupling model, a larger C value indicates stronger interactions and stronger connections between elements. However, the coupling degree value C alone cannot be used to determine the total level of development and synergy between systems. This is because when the level of development of both systems is poor, the systems may form a low level of coupling coordination, presenting a level of coupling that is difficult to distinguish from a high level of coupling. Based on this, to further explore the degree of coordination between the supply and demand of sustainable human resources in agriculture, we introduced a coordination degree model, which was a combination of the coupling degree and coordination degree. Coupled coordination can help to determine whether the level of development involves a high level of mutual promotion (benign high coupling) or a low level of mutual constraint (poor high coupling) [43], thus ensuring the correctness and validity of the results of the evaluation of the level of development and coordination of the system. The calculation formula is shown in Equations (5) and (6).
T = α f ( x ) + β g ( x )
D = C × T
In Equations (5) and (6), T is the comprehensive coordination evaluation index of talent supply and demand, which is expressed by the weighted average of the standardized index values of talent supply system and demand; α and β are the weights of the talent supply system and demand system, respectively, and α + β = 1. The specific value depends on the relative importance of the two. In this study, the relationship between the supply and demand of sustainable agricultural talents was equal, so α and β took the same value of 0.5. D is the degree of coupling coordination between the supply and demand of talents, which ranges from 0 to 1, where the larger the value, the higher the level of coupling coordination.
According to the literature, we determined and graded the level of coupled and coordinated development of supply and demand of sustainable agricultural talents according to the uniform distribution function, and the classification criteria and results are shown in Table 1.

4. Results

4.1. Comparative Analysis with Multiple Regression (MR) Method

Previous talent forecasting models have mostly been constructed using multiple regression methods. To compare the prediction accuracy of the two methods, we fitted a sustainable agriculture talent supply and demand model using multiple regression. From Table 2, it can be obtained that the multiple regression model has lower R2, larger RMSE, MAR and MRE compared with the BP neural network model, and the prediction accuracy of the multiple regression model is much less than that of the BP neural network model.

4.2. Prediction Results Based on BP Neural Network

4.2.1. Prediction Accuracy of BP Neural Network Model

To verify the prediction accuracy of the BP neural network, the network accuracy evaluation indexes of 31 provinces (cities) are calculated as shown in Table 3 and Table 4.
The larger the R 2 and the smaller the mean relative error (MRE) of the BP neural network, the better the network fit and the higher the prediction accuracy. Collating the training results of the 31 provincial (municipal) networks, we found that the training results were more stable across provinces. Table 3 and Table 4 show that the fit of the BP neural network models in the 31 provinces was good, with high R 2 values that were above 0.9. The network training prediction accuracy in most provinces was high, and the MRE was small, which did not exceed 30%, indicating that the network had good adaptability for the prediction of human resources supply in most provinces.
However, some provinces had poor models in the BP network fitting results. Although the R 2 of talent supply prediction in Shanxi province and talent demand prediction in Zhejiang province reached above 0.9 after multiple debugging, the minimum MRE of the prediction results on the test set was 34.18% and 37.6%, respectively, and the prediction accuracy was low. The reason for this may be that the factors influencing the supply or demand of sustainable agricultural talent in the regions are complex, and the selected indicators did not meet the requirements for constructing a talent supply and demand model with a better learning and prediction effect.

4.2.2. Results of the Forecast of Supply and Demand for Sustainable Talent in Agriculture

The strategic plan for rural revitalization states that by 2035, decisive progress will be made in rural revitalization and the modernization of agriculture and rural areas. As one of the fundamental factors in strengthening and enriching agriculture, the problem of coordinating the supply and demand of sustainable talent in agriculture must be solved. Therefore, based on the growth rate of GDP and net per capita income of rural residents in each province in previous years, and combined with the economic growth targets set in previous years, we calculated GDP growth and rural residents’ income at an average annual rate of 5.5% to forecast the supply and demand of talents in 2035. We fed the data into the trained BP neural network in each province to obtain the predictions of the supply and demand of sustainable agricultural talent in each province. The models have been trained several times before prediction to achieve the prediction fit. Among them, due to the poor prediction effect of the model in Shanxi and Zhejiang, the reference role of the obtained supply and demand prediction values is limited, so we only predicted the supply and demand of human resources in the remaining 29 provinces. The prediction results are shown in Table 5.

4.3. Coupled Coordination Analysis of Talent Supply and Demand Based on Predicted Values

4.3.1. Integral Analysis

We used the coupling coordination degree model to calculate the coupling coordination degree of supply and demand of sustainable human agricultural resources in 29 provinces (cities and districts) in China in 2035. The specific distribution results are shown in Figure 2.
Combining the forecasted supply and demand values and the results of the coupling coordination degree, we found that the coupling coordination relationship between supply and demand of sustainable agricultural talent in China had not entered the coordinated stage and had the following overall characteristics: First, the total supply was not meeting the total demand, except in Beijing, Tianjin, and six other provinces (cities and regions); other provinces had different sizes of the talent gap. Second, the overall level of coupling coordination was low, with 60% of provinces being categorized as a dysfunctional grade and only 15% of the coordinated provinces being graded as good or above. The average coupling coordination was 0.424, which is on the verge of the dysfunctional recession grade, indicating that the interaction between talent supply and demand was insufficient.

4.3.2. Regional Analysis

We divided the 31 provinces (cities and districts) in mainland China into eastern, central, western, and northeastern regions according to the economic regional division criteria of the National Bureau of Statistics. The four regions showed different levels of talent supply and demand coupling coordination, being ranked in descending order as northeast, central, west, and east. The development type of the northeastern and central regions was barely coordinated, with coupling coordination degrees of 0.532 and 0.523, respectively; that of the western region was 0.422, which is on the verge of disorder and decline. The eastern region has the lowest coupling coordination degree of 0.371, which is substantially worse than the national average (0.424), being categorized as the mild disorder and decline type. The development strategies, educational inputs, talent policies, and location effects of different regions in China affect the level of coupled and coordinated development of sustainable talent supply and demand in agriculture [44]. Based on this, we analyzed the characteristics of China’s sustainable agricultural talent supply and demand from a regional perspective by combining the predicted values and the coupled coordination degree.
From the forecast results, we found that the future coordination coupling level in the northeast region will be barely coordinated, remaining in a situation where the supply is less than the demand. Combining the current situation of sustainable talent development in agriculture in the northeast, the main reasons for the mismatch between supply and demand in the future are analyzed as follows. First, the demand for sustainable human resources in agriculture has been rising each year, and the demand is growing faster than the supply. The northeast region is an important agricultural base in China; in the Heilongjiang region, for example, the proportion of primary industry has experienced a trend of first decreasing and then increasing. After 2010, except for 2014, the proportion of primary industry continued to increase, the level of agricultural commercialization increased, the demand for sustainable agricultural talent substantially increased, and the changes in supply were unsynchronized, leading to incongruity. Second, considering the low level of regional economic development, the total economic volume is insufficient to attract talent, which in turn affects the sustainable supply of talent in agriculture. Talent policy is an essential method for the region to increase talent supply, and its dependence on regional economic support requires an adequate supply of capital. In terms of GDP, the sum of GDP created by the three northeastern provinces is less than that of a single province in the eastern region, which has seriously restricted the implementation of a northeast talent introduction program. Third, the regional talent development environment is insufficient to meet talent development expectations, so human resources cannot be retained. In terms of the number of regional agriculture and forestry graduates, the northeast region ranks among the top and has a strong capacity for sustainable talent cultivation in agriculture. These graduates are laborers with knowledge and skills, and their career development expectations are in line with the rule of material interests. However, in terms of historical income levels, the northeast is less than the national average, hindering the retention of sustainable agricultural talent and inevitably leading to the uneven supply and demand of talent.
From the forecast results, the future coordination coupling level in the central region will be barely coordinated, and the supply will not meet the demand in the aggregate. Combined with the current situation of sustainable agricultural talent development in the central region, we analyzed the main reasons for the future inconsistencies in supply and demand. First, the agricultural and forestry science and technology personnel training is insufficient, and the supply is far from meeting the demand. The central region in China is a densely populated area with good natural resource conditions, has a long history of agricultural development, has substantially contributed to ensuring food security, and has an enormous demand for sustainable human agricultural resources [45]. In contrast, only a few key construction institutions are located in central China, and the layout structure is not reasonable, resulting in many people in central China losing the opportunity to receive higher education, which creates unfavorable conditions for training. The same is true for sustainable talent in agriculture. Taking the 2018 data as an example, the total number of graduates from agricultural and forestry colleges and universities only accounted for 22.5% of the national share, which is a large gap with the regional population accounting for 26.4% of the national population, inhibiting the growth of the supply of sustainable talent in agriculture. Second, the region has some geographical constraints. The low cost of talent migration in the central region and the serious regional loss of trained workers have led to a reduction in the supply of human resources. Migration costs include direct costs, institutional costs associated with mobility, and opportunity costs. The central region is geographically contiguous and geographically similar to the east. In this context, the direct monetary and institutional costs of sustainable talent migration in agriculture are lower, and the opportunity costs decrease as talent knowledge and capabilities increase. So, the central region talent leaves for the developed cities in the east, which have excellent working conditions and a prosperous environment, leading to a large demand gap.
From the prediction results, we found that the future coordination coupling level of the western region will be on the verge of a disordered recession, and the future coordination level of talent supply and demand coupling will still have more room for progress. Combined with the current situation of sustainable agricultural talent development in the western region, the future emergence of a mismatch between supply and demand will be mainly focused on the supply of talent. At present, the western region is experiencing problems such as the loss of labor force, serious shortage of talent, and ineffective use of talent resources. Due to the geographical closure and traditional concept restrictions, people in the western region do not understand the concepts of market, efficiency, and innovation, and they lack the ability to adapt to the external world. The national policy response has lagged; therefore, many opportunities to participate in the domestic and even international markets, which would provide comparative advantages, have been missed. Against this background, the supply of sustainable talent for agriculture will be insufficient, and the level of coupling between supply and demand for talent will be low.
From the forecast results, we found that the future level of coordinated coupling in the eastern region will be a mildly dysfunctional recession. The supply and demand of sustainable agricultural talent in the eastern region will be remarkably different from those of other regions: the supply will not meet the total demand in total, and a gap will exist in the supply of sustainable agricultural talent in some cities. Combined with the current situation of sustainable talent development in agriculture in the eastern region, we analyzed the main reasons for the mismatch between supply and demand in the future: The economic development level of the eastern coastal region is the highest; the region is of other regions on the road to the modernization of agriculture and rural areas, and its new agricultural position is rapidly developing and showing high efficiency and effectiveness. The central region has a demand for sustainable human agricultural resources, and the main increase will be in demand for applied and high-level composite sustainable agricultural talents. However, the results of the above regional analysis showed that the eastern region has talent competitiveness and attractiveness that is incomparable to those of other regions due to its policy system, regional environment, and education level. The influx of a large number of sustainable agricultural workers has created a structural imbalance of an excess supply of talent and an insufficient supply of high-end agricultural sustainable talent in individual provinces [37]. Additionally, the less developed eastern regions face problems similar to those of the central regions, resulting in high demand and insufficient supply of sustainable agricultural talent. In the process of mutual and self-varying supply and demand for sustainable agricultural talent, a total supply and demand imbalance formed as a whole in the eastern region.

4.3.3. Provincial Analysis

The prediction results showed that the level of coupling and coordination between the supply and demand of sustainable agricultural talent would widely vary among the provinces and cities in China. We could classify the provinces into the following six types according to their economic development level, agricultural fundamentals, and other characteristics. A radar diagram representing the six types of relationships is shown in Figure 3.
The first type included five provinces, Shandong, Sichuan, Henan, Hunan, and Jiangsu, whose coupling coordination level could be considered coordinated. This type of province is characterized by a high level of regional economic development and agricultural economic foundation, a high gross domestic product, and high rural resident income [46]. These provinces have not only superior agricultural production and living conditions and a perfect agricultural infrastructure but also relatively abundant agricultural and forestry education resources, as well as a high level of coordination between talent supply and demand. In particular, the provinces of Henan, Sichuan, and Shandong have basically achieved the coordinated development of sustainable talent supply and demand in agriculture.
The second type included four provinces, Hebei, Heilongjiang, Jilin, and Anhui, with coupling coordination levels in the range of barely coordinated to primary coordination. This type of province is characterized by the same high-quality agricultural economic base and educational resources. Although facing barriers in terms of socio-economic development, they are basically free from dysfunctional development and have reached the primary stage of coordinated development.
The third type included two provinces, Yunnan and Inner Mongolia, where the coupling coordination degree level is within the range of the coordination type, being categorized as intermediate coordination and barely coordinated, respectively. These provinces are both large agricultural resource provinces and do not have advantages in terms of educational resources and economic development environment; however, with the siphon effect within the western region, the supply of talent has increased, and the coupling of supply and demand for sustainable agricultural talents has improved.
The fourth type included six provinces, Beijing, Shanghai, Tianjin, Guangdong, Hubei, and Fujian, with coupling coordination levels in the range of dissonance. These provinces are characterized by a high level of regional social development and abundant higher education resources but a low level of coupled coordination between talent supply and demand. Although these areas can attract a large number of people to form the supply, the demand for sustainable agricultural talent is saturated due to the weakening of regional agricultural production functions and other reasons. Some provinces even have a supply that exceeds demand, which limits the coordinated development of talent supply and demand.
The fifth type included seven provinces, Guizhou, Ningxia, Qinghai, Tibet, Hainan, Xinjiang, and Gansu, which had a coupling coordination level in the range of dissonance. These provinces are characterized by lagging regional agricultural economic development and relatively weak higher education resources, especially in agriculture and forestry education. Talent attraction is weak, as is its own supply capacity, hindering the ability to meet the sustainable talent demand in agriculture. The degree of coupling coordination is low overall, with the provinces showing different degrees of imbalance in talent supply and demand.
The sixth type included five provinces: Liaoning, Shaanxi, Chongqing, Jiangxi, and Guangxi. These provinces are characterized by stable regional and agricultural economic development and have higher education resources; however, the supply and demand of sustainable agricultural talents are mismatched, being on the verge of mildly dysfunctional coupling and coordination. These regions generally have a poor capacity to cultivate agricultural and forestry human resources. Although the general educational resources are sufficient, the number of graduates from higher agricultural and forestry colleges and universities is rather low, so the supply base of sustainable agricultural talent is inadequate. In addition, two provinces, Jiangxi and Guangxi, are experiencing a saturation of talent demand. We found a difference between these provinces and the fourth type of province, which was caused by a decreasing talent demand, which was lower than the supply.

5. Discussion

5.1. Characteristics of the Trend of Talent Supply and Demand

Currently, there are few studies that directly address the issue of sustainable talent supply and demand in agriculture. The results of existing studies on agricultural talent show that China’s talent supply and demand coupling coordination is low, with significant regional differences and uneven clustering, which is basically consistent with the predicted trend in this paper.
We used a BP neural network model to predict the supply and demand of sustainable agricultural talent in 2035 using panel data from 29 provinces (cities and districts) in mainland China from 2000 to 2019. According to the forecast results and coupling coordination degree model, we analyzed the characteristics of the coupling coordination level between the supply and demand of sustainable human resources in agriculture from multiple perspectives. Compared with existing research, the contents that could be used as a supplement are as follows:
(1)
The forecast results of the number of talent supply and demand showed that the total number of agricultural science and technology workers in China in 2035 will be insufficient to meet the demand. At the national level, compared with the 2018 calculations, the demand gap for agricultural talent in the country will decrease to 282.35 × 10⁴ people. Except for the four provinces (cities) of Guangxi, Jiangxi, Tianjin, and Shanghai, in all other provinces, the supply will not meet demand.
(2)
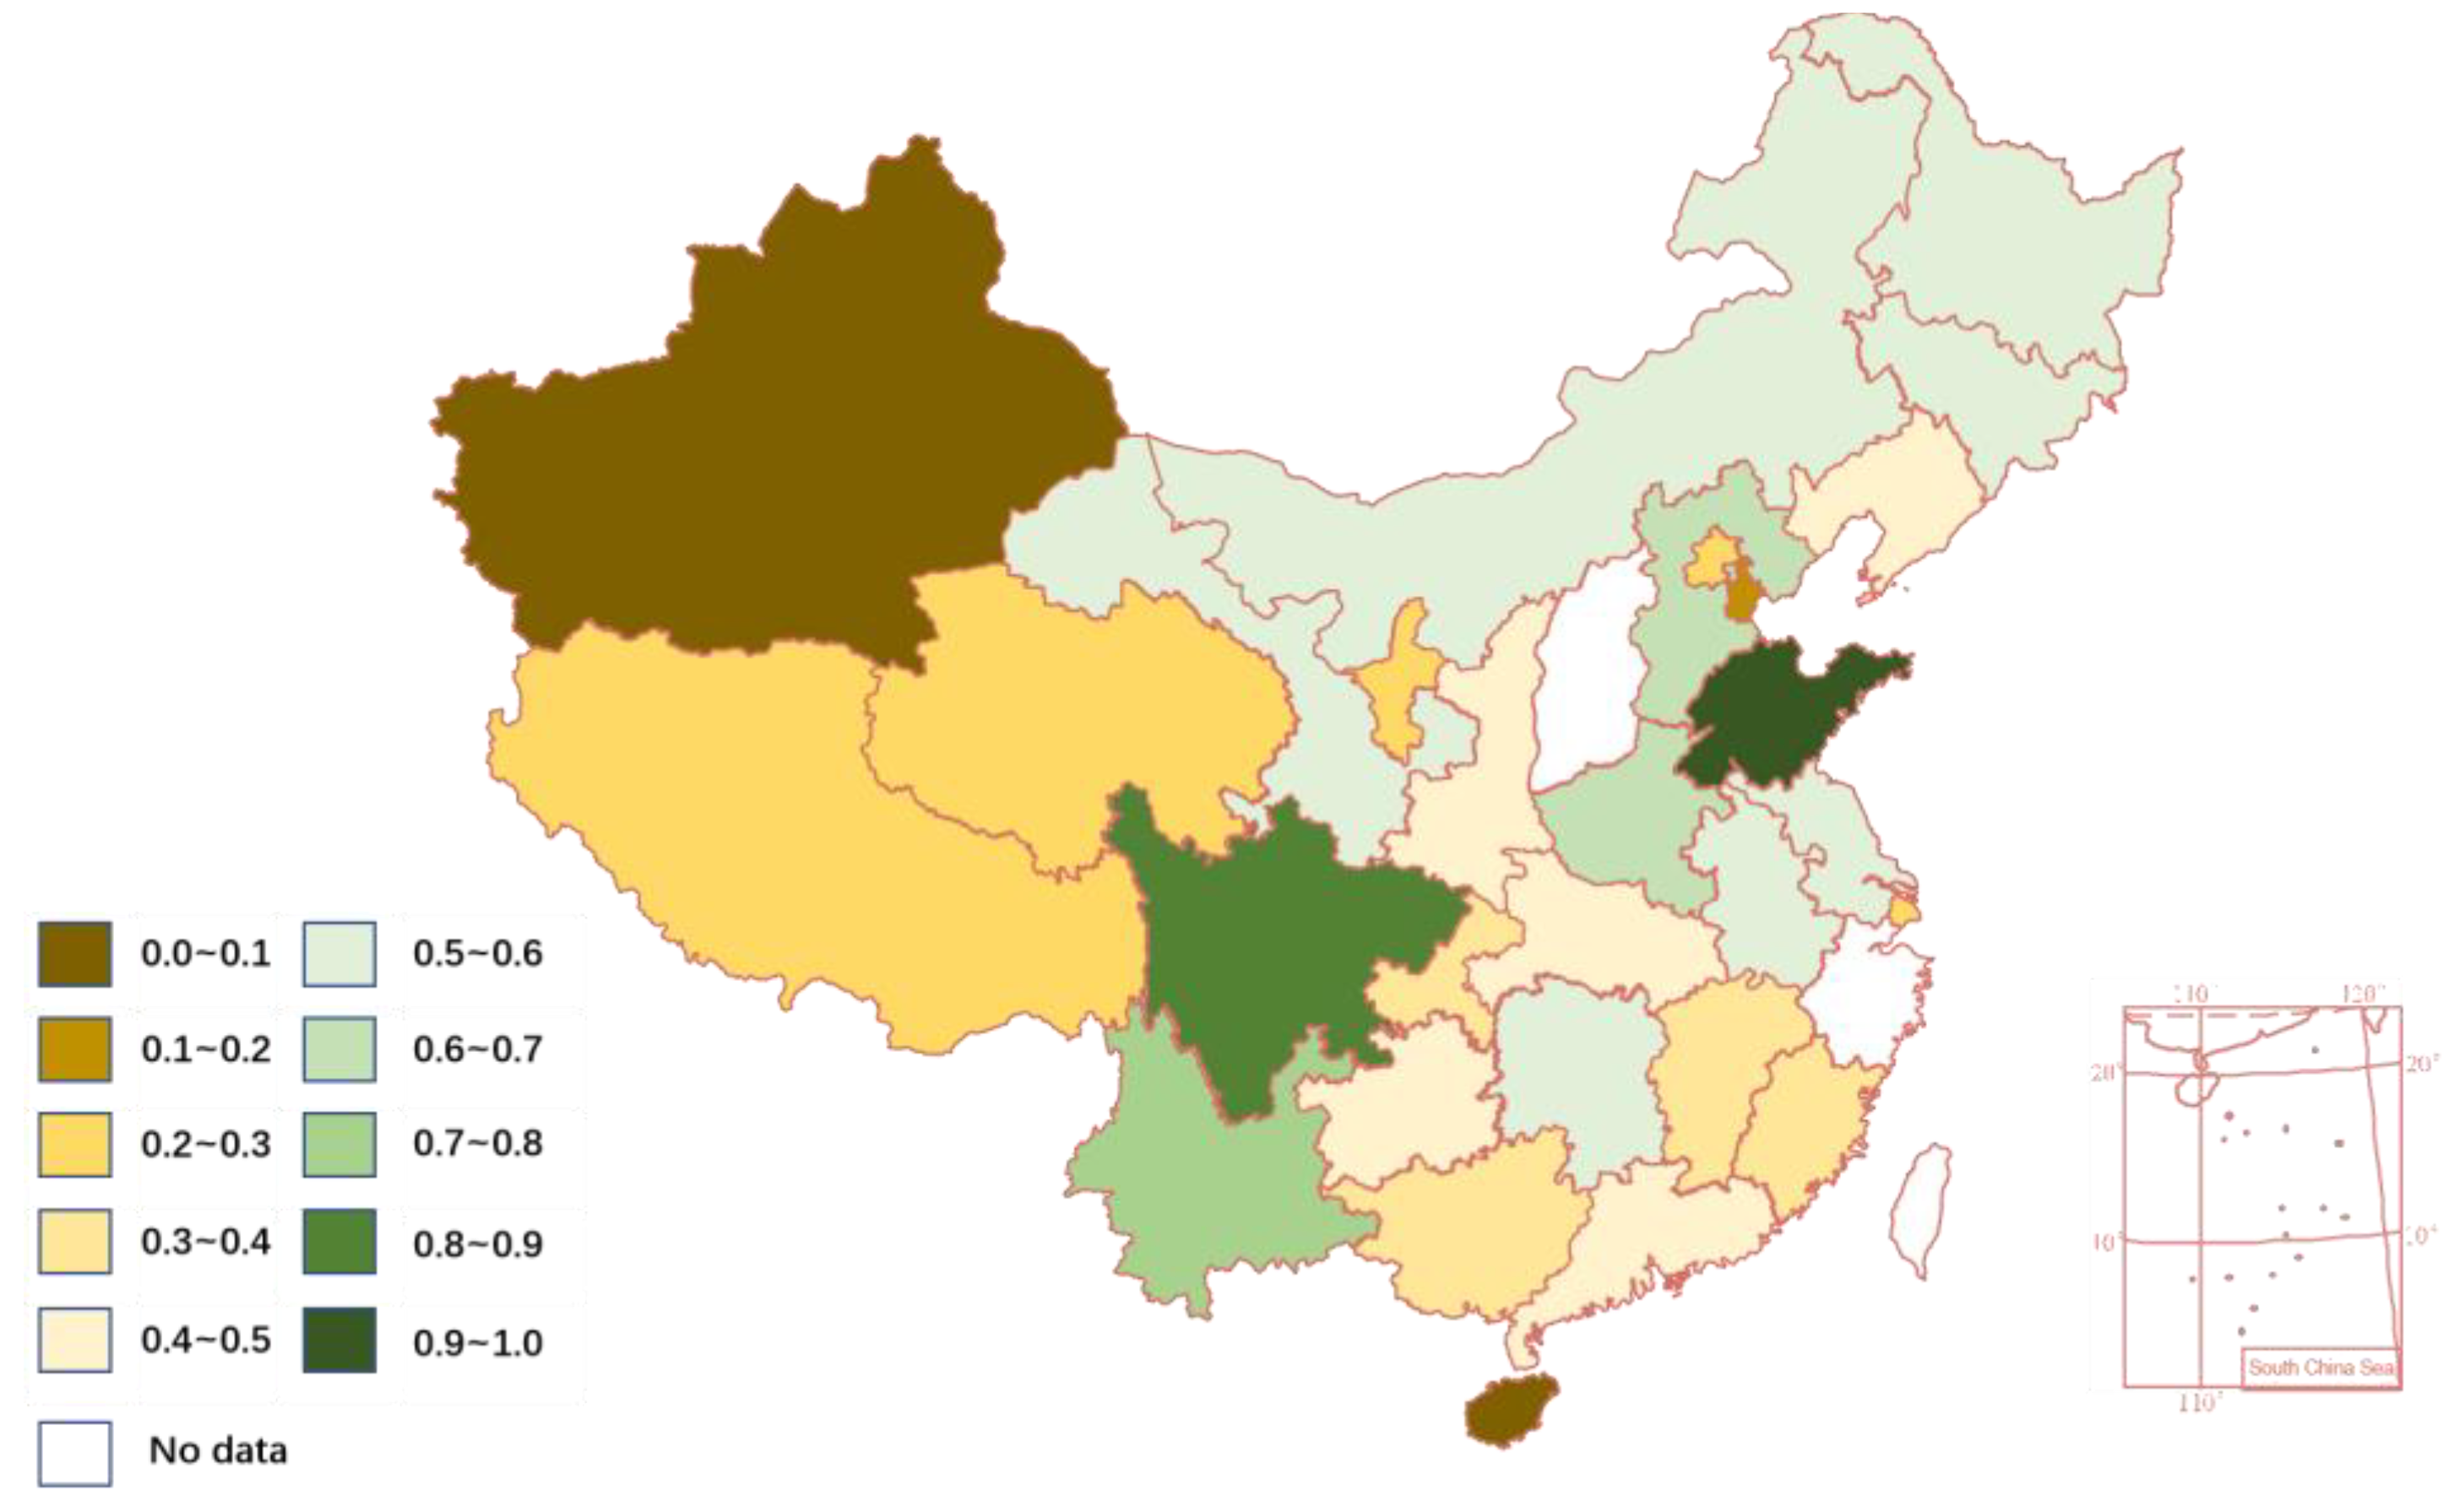
The prediction of the coupling coordination degree showed that the overall supply–demand coordination level of the supply and demand of China’s agricultural sustainable talent will be low by 2035, with the average value of the coupling coordination degree of 0.424, which is on the verge of a disordered recession. We found significant differences in regional characteristics, which showed that the level of regional talent supply and demand coupling coordination gradually decreases in the descending order of northeast, central, west, and east regions, none of which will have a good coupling coordination level.
(3)
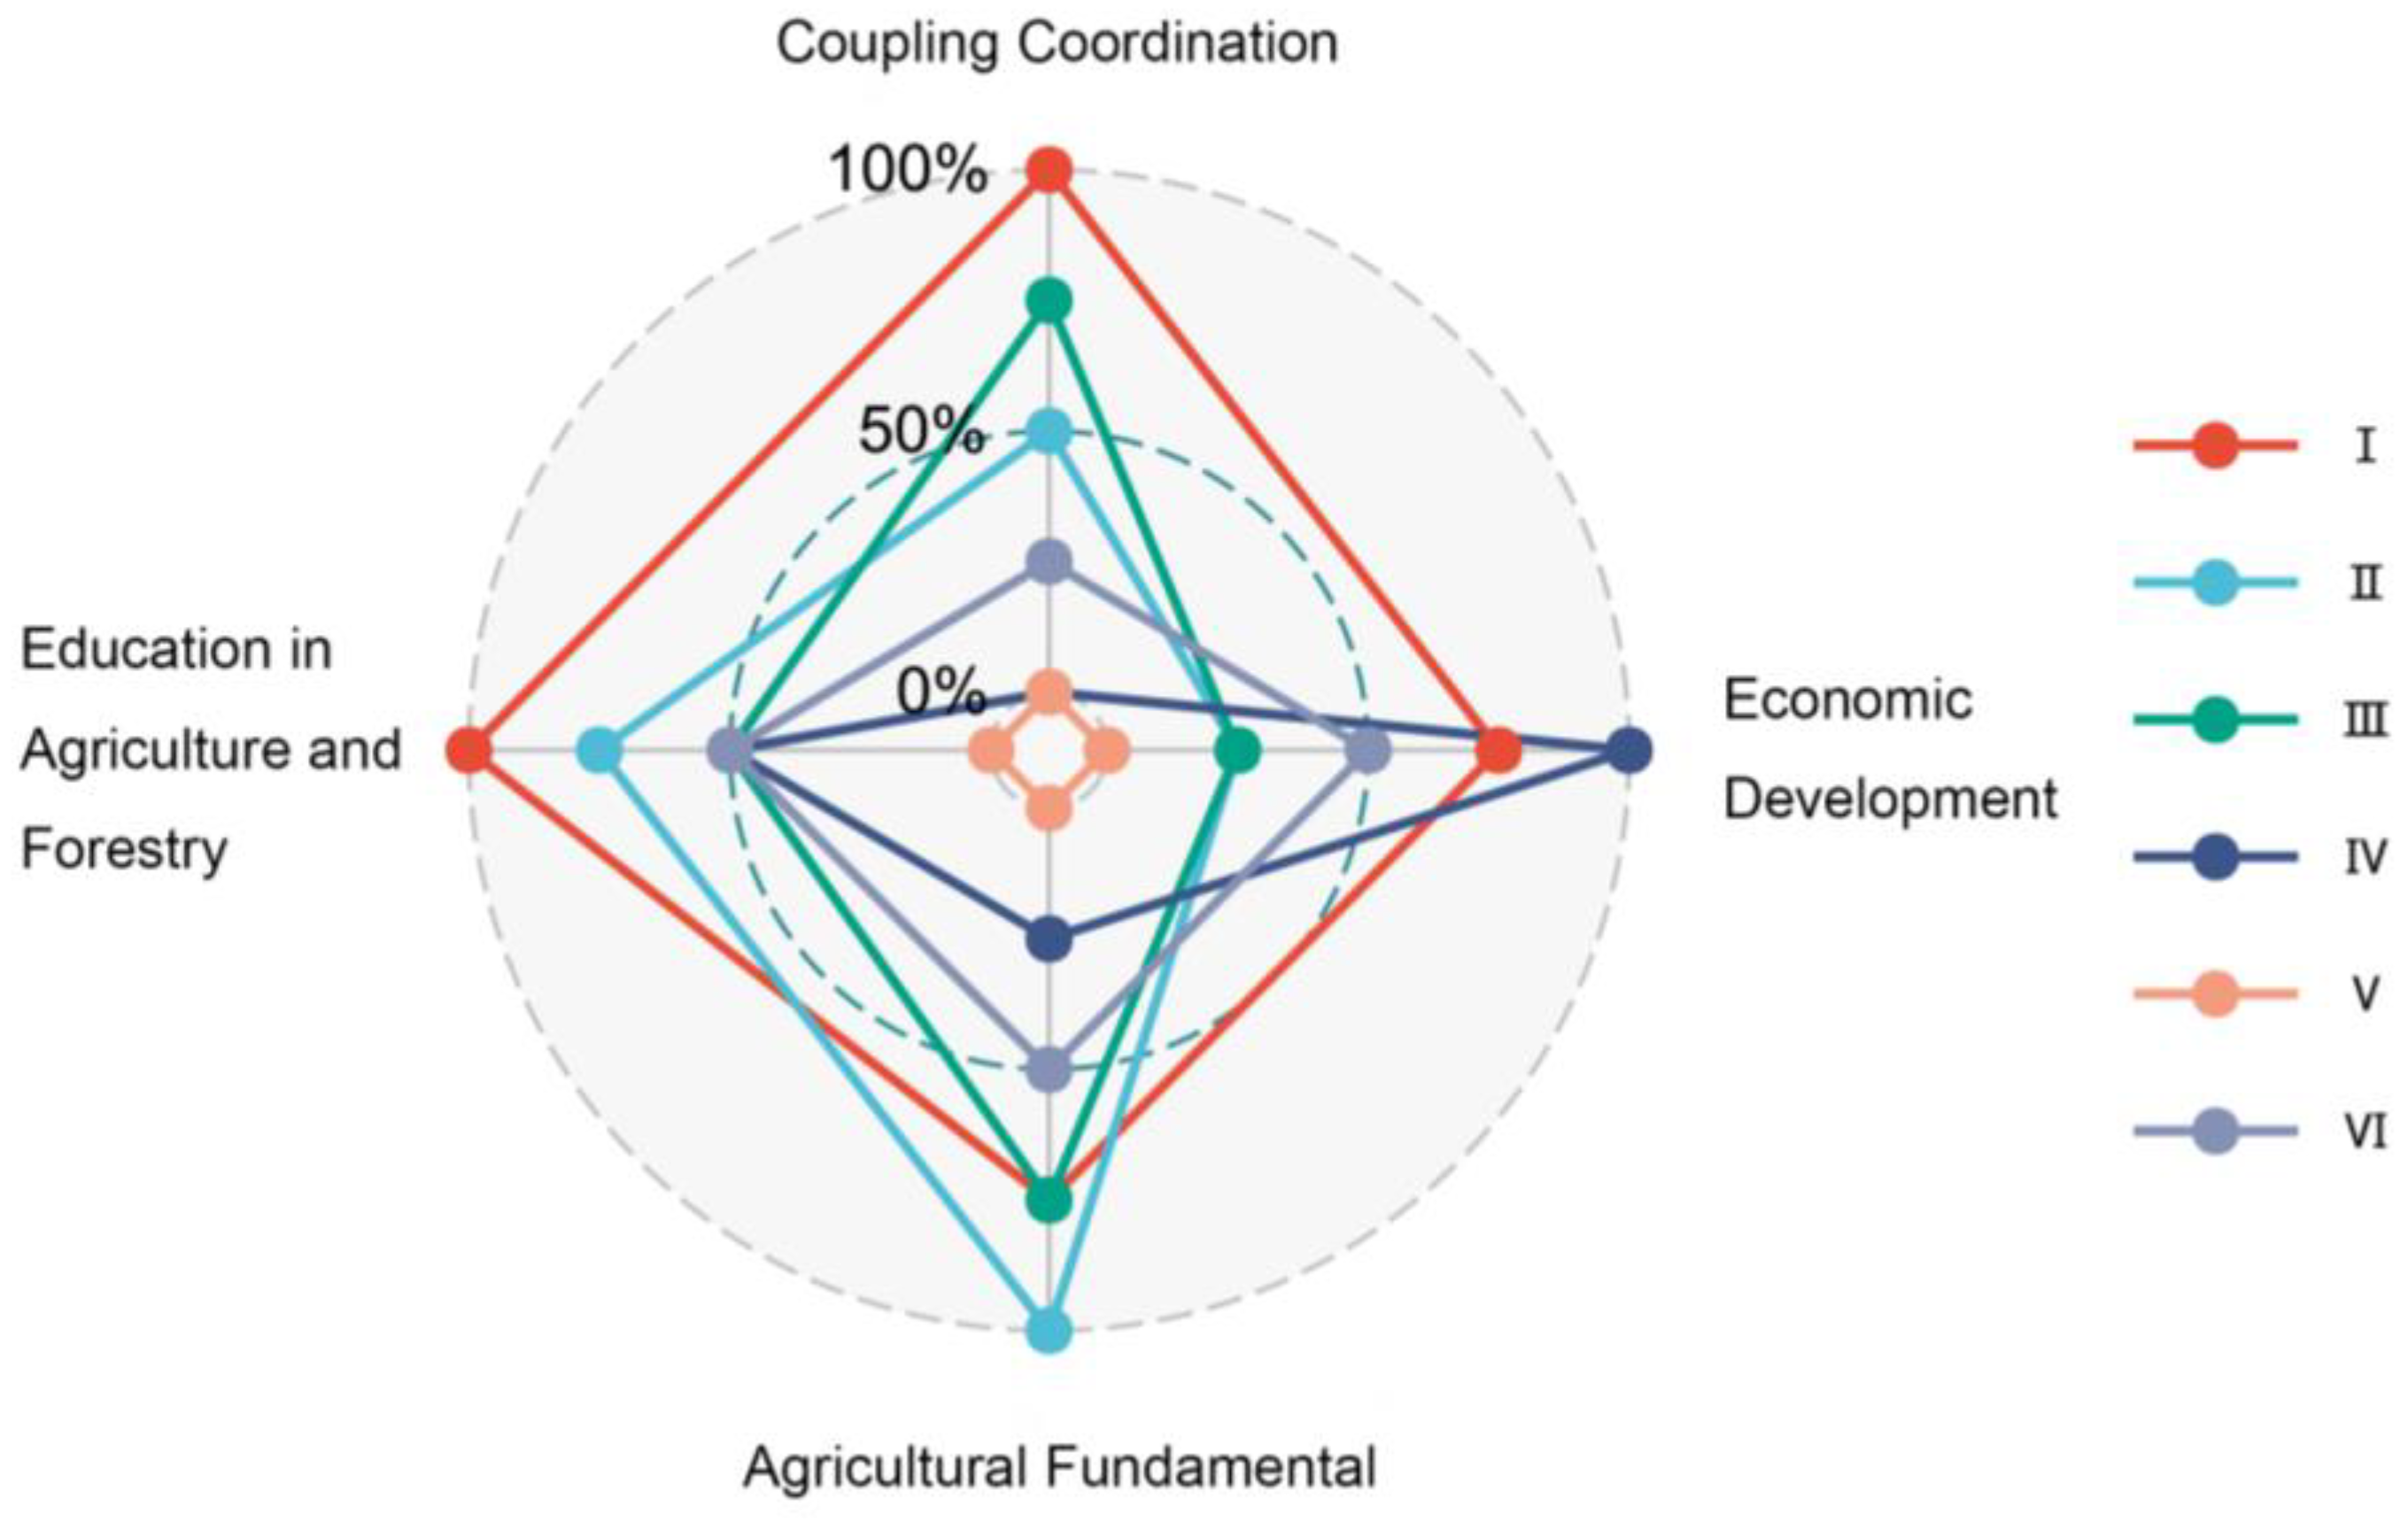
We divided the development of talent supply and demand in 29 provinces (cities and districts) into six types. Our division of each type was based on factors such as the level of socio-economic development of each province (municipality or district), agricultural economic base, agricultural education resources, and the predicted results of coupling and coordination level. The division of provinces into these types provides a reference for provinces (cities and districts) to develop corresponding policies to achieve coordinated development of talent supply and demand.

5.2. Implication

Increasing talent policy support to reduce the loss of human resources should be the focus of promoting sustainable and coordinated talent development in agriculture at the national level. The talent supply is strongly influenced by capital-driven factors, and regions with high levels of economic development and per capita income tend to be able to retain more talent. From the regional analysis, we found that all regions, except the eastern region, are facing different degrees of human resources loss. From the perspective of the overall development of the country, each region has a different location function, which also determines the variability in the regional economic development level. Regions that blindly pursue the maximization of locational benefits to attract more talent will instead damage the overall development of the national economy and the fundamental interests of the people of the country [47]. In this context, policy support at the national level is particularly important. Under the strategies of western development, northeastern revitalization, and the rise of central China, the problem of sustainable talent loss in agriculture in each region has been alleviated, and the level of coordinated development of sustainable talent supply and demand in agriculture has been improved. In the future, at the national level, policy support should continue to be increased to strengthen the implementation of strategies to stabilize the level of coordination between the supply and demand of sustainable human resources in agriculture.
Investing in optimizing the talent environment for rural revitalization to increase talent attraction should be the focus of promoting sustainable and coordinated talent development in agriculture at the regional level. The retention of talent and the role of talent largely depend on the talent environment [48]. From the talent coupling coordination analysis, we found that each region has a certain ability to cultivate talent in agriculture and forestry science and technology, but the general problem is that human resources cannot be retained. Therefore, the key to solving this dilemma lies in improving the talent environment for rural revitalization. While actively seeking national policy support, each region should strengthen the ties among various departments in the region to create a favorable talent environment to revitalize rural areas. For example, each region can build a unified regional agricultural sustainable talent market system, establish a long-term cooperation mechanism for regional talent development, and implement other measures through the sharing of agricultural science and technology achievements and resources in the region. At the same time, the region should fully provide sustainable agricultural talent with a favorable development platform and space, gather more innovative resources, maximize the role of talents, and use them to retain talent to achieve coordination between the supply and demand of agriculturally sustainable talents.
Building agricultural and forestry education resources to increase the supply of sustainable agricultural talent should be emphasized in promoting the coordinated development of sustainable agricultural talent at the provincial level. Graduates from higher agricultural and forestry institutions are an important source of sustainable talent supply in agriculture. Shortages in agricultural human resources supply due to the lack of graduates from agricultural and forestry universities are occurring in several regions or provinces. To coordinate the supply and demand of sustainable agricultural talent, provinces should pay sufficient attention to the cultivation of agricultural and forestry talents in universities. Provinces, municipalities, and their universities should take the construction of new agricultural science as the lead to promote agricultural and forestry education, broaden the boundaries of traditional agricultural disciplines, establish more agriculture-related disciplines, and increase the number of trained agricultural and forestry personnel to provide a quantitative basis for sustainable agricultural talents. The provinces should continue to deepen the reform of higher education to achieve the goal of talent training, pay attention to the internal development of agricultural and forestry education, and improve the quality of agricultural and forestry talent education to effectively ensure agricultural and forestry graduates become a sustainable agricultural talent, and provide a quality basis for sustainable human agricultural resources.

6. Conclusions

We used a BP neural network model to forecast the supply, demand quantity, and development trend of sustainable talent in agriculture and then analyzed the overall, regional, and provincial areas using a coupled coordination model. Our findings provide a basis for governments to formulate competitive talent policies and talent development plans and enrich the literature on industrial talent forecasting at the meso level.
However, our study has many shortcomings. First, to meet the requirements of the econometric model, we selected only two input factors to predict talent supply and demand. Therefore, the model can be optimized in future studies by considering more influencing factors, such as agricultural industry structure and economic development characteristics, to predict and analyze the supply and demand of agricultural talent in different regions. Second, accurately measuring the quantity of supply and demand is challenging due to the difficulty of obtaining data. We used the calculation method in the literature to collect data from each province (city and district) for the study. In the future, researchers will quantify the talent supply and demand based on more refined and reasonable calculation methods or use microdata to refine indicators to achieve more detailed and targeted forecasting of agricultural talent types. Third, we conservatively set the economic development level and rural residents’ income growth rate of each region and forecasted only for 2035 to analyze the spatial differences in supply and demand of human agricultural resources. In the future, researchers can perform high-precision and multi-time-point forecasts, analyze the law of the evolution of spatial and temporal differences, and explore methods of allocating resources in each region based on the level of economic development and rural residents’ income forecasts in different provinces. In addition, the prediction and management of innovative rural talent, practical talent, and other human resources for rural revitalization will be our focus in our next study.

Author Contributions

Conceptualization, S.W. and X.T.; Investigation, H.W.; Methodology, S.W. and C.L.; Writing—original draft, S.W. and Q.S.; Writing—review & editing, S.W. and Z.W. All authors have read and agreed to the published version of the manuscript.

Funding

This research was funded by the National Social Science Fund of China, funding number BIA190199.

Institutional Review Board Statement

Not applicable.

Informed Consent Statement

Not applicable.

Data Availability Statement

Not applicable.

Acknowledgments

We thank the openbiox community and the Hiplot team (https://hiplot.com.cn, accessed on 22 April 2023) for providing technical assistance and valuable tools for data analysis and visualization.

Conflicts of Interest

The authors declare no conflict of interest.

References

  1. Zhang, Z.X.; Li, Y.J.; Elahi, E.; Wang, Y.M. Comprehensive Evaluation of Agricultural Modernization Levels. Sustainability 2022, 14, 17. [Google Scholar] [CrossRef]
  2. Salas-Zapata, W.A.; Ortiz-Munoz, S.M. Analysis of meanings of the concept of sustainability. Sustain. Dev. 2019, 27, 153–161. [Google Scholar] [CrossRef]
  3. Acevedo-Duque, A.; Prado-Sabido, T.; Garcia-Salirrosas, E.E.; Mantilla, M.M.F.; Calmet, V.G.V.; Palomino, N.V.; Armas, H.M.A. Postgraduate Trends in the Training of Human Talent for Sustainable Development. Sustainability 2022, 14, 18. [Google Scholar] [CrossRef]
  4. Knickel, K.; Ashkenazy, A.; Chebach, T.C.; Parrot, N. Agricultural modernization and sustainable agriculture: Contradictions and complementarities. Int. J. Agric. Sustain. 2017, 15, 575–592. [Google Scholar] [CrossRef]
  5. Makarius, E.E.; Srinivasan, M. Addressing skills mismatch: Utilizing talent supply chain management to enhance collaboration between companies and talent suppliers. Bus. Horiz. 2017, 60, 495–505. [Google Scholar] [CrossRef]
  6. Bian, W. Don’t let the “talent shortage” restrict rural revitalization. People’s Trib. 2019, 1, 76–77. [Google Scholar]
  7. Zhang, L. Stimulating the cohesive power of talents in rural revitalization. People’s Trib. 2022, 1, 34–37. [Google Scholar]
  8. Shi, J.; Pan, F. Forecast analysis of talent demand in major leading industries in Jiangsu Province. Mod. Bus. Trade Ind. 2009, 21, 117–118. [Google Scholar]
  9. Bai, M.; Li, J.; Guo, S.; Huo, X.; Shi, P. Analysis of Total Talent Demand and Talent Demand Structure Forecast in Handan City. J. Handan Polytech. Coll. 2010, 23, 19–24. [Google Scholar]
  10. Zhang, L.; Xiao, Y. Anshun city “13th Five-Year” period talent resources demand forecast analysis. J. Anshun Univ. 2017, 19, 110–114. [Google Scholar]
  11. Yan, S. Demand Forecast for Professional and Technical Talents in Henan Province from 2010–2020—Based on Equidimensional Gray Recurrence GM(1,1) Model. Product. Res. 2011, 10, 129–130, 133. [Google Scholar]
  12. Hu, F.; Lu, L.; Huang, B.; Zhou, W. Research on talent demand forecasting for high-tech industries in Jiangsu Province—Based on improved metabolic GM(1,1) model. Sci. Technol. Manag. Res. 2018, 38, 57–62. [Google Scholar]
  13. He, W.; Xian, G.; Chen, K. Forecast of demand for highly skilled personnel and suggestions for countermeasures. J. Vocat. Educ. 2015, 27, 14–18. [Google Scholar]
  14. Liu, Z.; Song, H.; Hao, H.; Zhao, F. Research on the forecast of talent demand in China’s intelligent networked vehicle industry. Sci. Technol. Manag. Res. 2022, 42, 129–137. [Google Scholar]
  15. Tan, K.; Wang, W.; Zhang, L.; Liang, Y. Talent demand forecasting in coal industry based on multiple regression-gray forecast combination method. Coal Eng. 2019, 51, 151–154. [Google Scholar]
  16. Zhen, H.; Chao, L. Vocational education planning requires optimization of talent demand forecasting. Mod. Educ. Manag. 2021, 1, 85–91. [Google Scholar]
  17. Yu, C.Y.; Wang, P.T. The forecast model of system reconstructability analysis. Kybernetes 2004, 33, 1016–1019. [Google Scholar] [CrossRef]
  18. Sun, C.; Lu, Y.X. Prediction of Information Talent Demand Based on the Grayscale Prediction Model and the BP Neural Network. Mob. Inf. Syst. 2022, 2022, 9. [Google Scholar] [CrossRef]
  19. Shen, G. AI-enabled talent training for the cross-cultural news communication talent. Technol. Forecast. Soc. Chang. 2022, 185, 122031. [Google Scholar] [CrossRef]
  20. Vaeyens, R.; Gullich, A.; Warr, C.R.; Philippaerts, R. Talent identification and promotion programmes of Olympic athletes. J. Sport. Sci. 2009, 27, 1367–1380. [Google Scholar] [CrossRef]
  21. Siener, M.; Faber, I.; Hohmann, A. Prognostic Validity of Statistical Prediction Methods Used for Talent Identification in Youth Tennis Players Based on Motor Abilities. Appl. Sci. 2021, 11, 22. [Google Scholar] [CrossRef]
  22. Schorer, J.; Rienhoff, R.; Fischer, L.; Baker, J. Long-Term Prognostic Validity of Talent Selections: Comparing National and Regional Coaches, Laypersons and Novices. Front. Psychol. 2017, 8, 8. [Google Scholar] [CrossRef] [PubMed]
  23. Xiao, B.; Chankong, V. A System Dynamics Model for Predicting Supply and Demand of Medical Education Talents in China. Eurasia J. Math. Sci. Technol. Educ. 2017, 13, 5033–5047. [Google Scholar] [CrossRef]
  24. Ottaviani, M.; Sorensen, P.N. The strategy of professional forecasting. J. Financ. Econ. 2006, 81, 441–466. [Google Scholar] [CrossRef]
  25. Vinogradov, E.S. The years 2013 and 2020 will see an increase in the birthrate of talents. Vopr. Psikhologii 2013, 1, 172. [Google Scholar]
  26. Zhang, J.; Pan, G. Comparison and application of multiple linear regression and BP neural network prediction models. J. Kunming Univ. Sci. Technol. 2013, 38, 61–67. [Google Scholar]
  27. Cappelli, P. Talent management for the twenty-first century. Harv. Bus. Rev. 2008, 86, 74. [Google Scholar]
  28. Pagan-Castano, E.; Ballester-Miquel, J.C.; Sanchez-Garcia, J.; Guijarro-Garcia, M. What’s next in talent management? J. Bus. Res. 2022, 141, 528–535. [Google Scholar] [CrossRef]
  29. Cappelli, P.; Keller, J.R. Talent Management: Conceptual Approaches and Practical Challenges. In Annual Review of Organizational Psychology and Organizational Behavior; Morgeson, F.P., Ed.; Annual Reviews: San Mateo, CA, USA, 2014; Volume 1, pp. 305–331. [Google Scholar]
  30. Malik, A.; Budhwar, P.; Mohan, H.; Srikanth, N.R. Employee experience—The missing link for engaging employees: Insights from an MNE’s AI-based HR ecosystem. Hum. Resour. Manag. 2023, 62, 97–115. [Google Scholar] [CrossRef]
  31. Jibril, I.A.; Yesiltas, M. Employee Satisfaction, Talent Management Practices and Sustainable Competitive Advantage in the Northern Cyprus Hotel Industry. Sustainability 2022, 14, 18. [Google Scholar] [CrossRef]
  32. Datta, S.; Budhwar, P.; Agarwal, U.A.; Bhargava, S. Impact of HRM practices on innovative behaviour: Mediating role of talent development climate in Indian firms. Int. J. Hum. Resour. Manag. 2021, 34, 1071–1096. [Google Scholar] [CrossRef]
  33. Wei, F.F.; Feng, N.P.; Zhang, K.H. Innovation Capability and Innovation Talents: Evidence from China Based on a Quantile Regression Approach. Sustainability 2017, 9, 15. [Google Scholar] [CrossRef]
  34. Brannstrom, C.; Ewers, M.; Schwarz, P. Will peak talent arrive before peak oil or peak demand?: Exploring whether career choices of highly skilled workers will accelerate the transition to renewable energy. Energy Res. Soc. Sci. 2022, 93, 102834. [Google Scholar] [CrossRef]
  35. Ruse, D.H.; Jansen, K.E. Stay in Front of the Talent Curve. Res.-Technol. Manag. 2008, 51, 38–43. [Google Scholar] [CrossRef]
  36. Xu, H.; Yu, Z.W.; Yang, J.Y.; Xiong, H.; Zhu, H.S. Dynamic Talent Flow Analysis with Deep Sequence Prediction Modeling. IEEE Trans. Knowl. Data Eng. 2019, 31, 1926–1939. [Google Scholar] [CrossRef]
  37. Hu, R.; Shen, Z.; Bin, P. Analysis of Spatial and Temporal Differences in the Coordinated Development of Supply and Demand of Agricultural Science and Technology Talents in China—Based on Inter-Provincial Panel Data from 1999–2018. J. Huazhong Agric. Univ. (Soc. Sci. Ed.) 2022, 2, 67–79. [Google Scholar]
  38. Li, P.; Zhang, Q. Progress and problem analysis of domestic talent demand forecasting research. Contemp. Econ. Manag. 2014, 36, 72–80. [Google Scholar]
  39. Liu, N.; Zhao, S.; Liu, Z. Analysis of the Current Situation and Supply Forecast of Highly Skilled Personnel in China. Chongqing High. Educ. Res. 2021, 9, 69–81. [Google Scholar]
  40. Qin, W.; Lu, H.; Wu, D.; Zhong, G.; Lei, X. Research on the sustainable development of rural economy in the post-poverty eradication era: An example of industrial talent supply in the Wuling Mountain contiguous special hardship area. China Univ. Sci. Technol. 2020, 12, 26–29. [Google Scholar]
  41. Xiao, M.; Zhu, X.; Jiang, L. An empirical study on institutional changes in China’s rural economy and farmers’ income growth--based on inter-provincial dynamic panel data analysis from 1978 to 2009. Spec. Zone Econ. 2011, 10, 157–158. [Google Scholar]
  42. Dou, Z.X.; Sun, Y.M.; Zhang, Y.; Wang, T.; Wu, C.L.; Fan, S.Q. Regional Manufacturing Industry Demand Forecasting: A Deep Learning Approach. Appl. Sci. 2021, 11, 15. [Google Scholar] [CrossRef]
  43. Yu, H.; Wang, Q.; Zhang, B.; Liu, J. Study on the spatial differentiation and driving mechanism of the coupled and coordinated development of tourism supply and demand in China. Sci. Geogr. Sin. 2020, 40, 1889–1898. [Google Scholar]
  44. Li, Y.; Tang, B. A Study on the Coupled and Coordinated Relationship between the Level of Economic Development and the Supply of Highly Skilled Talents—Based on Panel Data of 30 Provinces in China from 2009–2018. Chin. Vocat. Tech. Educ. 2021, 3, 82–90. [Google Scholar]
  45. Jiang, Z.; Zhou, J.; Zhao, Y. Study on the spatial-temporal coupling and coordination of agricultural economic-social-ecological modernization in the central region in the context of rural revitalization. Chin. J. Agric. Resour. Reg. Plan. 2021, 42, 99–108. [Google Scholar]
  46. Zhang, H.Q.; Deng, T.; Wang, M.; Chen, X.D. Content Analysis of Talent Policy on Promoting Sustainable Development of Talent: Taking Sichuan Province as an Example. Sustainability 2019, 11, 17. [Google Scholar] [CrossRef]
  47. Shi, P. Four elements of revitalizing Northeast China’s economy: Structure—system-capital–talent. Northeast. Asia Forum 2006, 4, 3–8. [Google Scholar]
  48. Sun, B.; Liu, S.; Peng, B.; Ge, C. Research on the influence of regional soft environment factors on the trans-regional flow of talents. Stud. Sci. Sci. 2022, 40, 642. [Google Scholar]
Figure 1. Talent supply and demand BP neural network structure diagram.
Sustainability 15 07127 g001
Figure 2. Talent supply and demand coupling coordination degree distribution.
Sustainability 15 07127 g002
Figure 3. Type Classification-Radar Chart.
Sustainability 15 07127 g003
Table 1. Judgment criteria and grade classification of coupling coordination.
Coupling Coordination ValueCoupling Coordination
Dysregulation type(0.0,0.1]Extreme
(0.1,0.2]Severe
(0.2,0.3]Moderate
(0.3,0.4]Mild
(0.4,0.5]Minimal
Coordination type(0.5,0.6]Barely
(0.6,0.7]Primary
(0.7,0.8]Intermediate
(0.8,0.9]Fine
(0.9,1.0]Excellent
Table 2. Average results of different prediction models.
Model for Talent SupplyModel for Talent Demand
R2MRERMSEMAER2MRERMSEMAE
MR0.867048.48%9158.45846122.70820.6180107.16%235,344.4509171,466.3740
BP0.96696.02%2085.8052 1799.1338 0.96487.06%5901.03745032.1477
Table 3. Precision evaluation index of prediction model for sustainable talent supply in agriculture.
ProvinceR2MRERMSEMAE
Anhui0.99257.64%1809.9881 1497.4374
Beijing0.97790.84%140.2992 122.8203
Fujian0.98404.84%1425.1985 1122.4000
Gansu0.99409.17%3661.5764 3273.9592
Guangdong0.99373.99%2352.9245 1882.6233
Guangxi0.97841.20%494.8791 456.2267
Guizhou0.92936.64%2200.0122 1850.1072
Hainan0.900811.93%636.5040 582.9783
Hebei0.926020.07%7402.7157 7302.1035
Henan0.91137.55%5676.1032 5389.3005
Heilongjiang0.97470.87%1528.1878 1189.4735
Hubei0.97104.24%627.3599 558.0283
Hunan0.99542.05%892.2284 831.6557
Jilin0.98682.24%1545.3291 1467.1403
Jiangsu0.91192.44%1705.6175 1205.8908
Chongqing0.99991.74%350.6784 343.2629
Jiangxi0.96299.21%3009.4767 2639.4182
Liaoning0.96573.17%925.0973 904.7407
Inner Mongolia0.99340.96%792.4498 733.4176
Ningxia0.98365.80%541.9013 534.2458
Qinghai0.92533.62%374.6752 338.6451
Shandong0.97540.89%1343.4907 1002.7994
Shanxi0.945434.18%13,361.4570 11,074.4363
Shannxi0.99847.98%3262.4883 2630.8968
Shanghai0.99880.49%101.6068 81.2867
Sichuan0.99961.56%3012.3147 2396.4588
Tianjin0.973512.37%819.0201 708.2146
Xizang0.99259.92%1318.3319 1072.3317
Xinjiang0.94263.66%775.1670 505.2930
Yunnan0.93234.34%2257.2778 1820.3598
Zhejiang0.95871.01%315.6060 255.1959
Table 4. Precision evaluation index of prediction model for sustainable talent demand in agriculture.
ProvinceR2MRERMSEMAE
Anhui0.93820.26%530.5336 441.1364
Beijing0.95794.33%3724.1059 2207.9578
Fujian0.95015.96%2974.6463 2779.2911
Gansu0.98576.07%8665.0024 8153.6109
Guangdong0.97946.85%3981.4268 3014.6739
Guangxi0.92196.85%410.0409 392.9548
Guizhou0.99949.79%6309.0646 5303.4137
Hainan0.94218.69%1329.5297 1204.2641
Hebei0.99658.71%10,553.5347 10,366.2958
Henan0.95778.84%22,716.5530 18,174.5613
Heilongjiang0.94971.61%8127.2854 6295.2821
Hubei0.98741.65%1639.9482 1426.1926
Hunan0.990714.03%26,517.1747 21,745.4140
Jilin0.99944.96%4692.0084 4467.4866
Jiangsu0.99689.68%7102.5269 7041.5436
Chongqing0.92723.26%1353.0836 1054.5020
Jiangxi0.97447.74%1671.6131 1302.6064
Liaoning0.90024.51%4532.4298 4385.0381
Inner Mongolia0.96818.16%17,364.9567 13,872.5596
Ningxia0.93529.36%2631.4265 2353.1633
Qinghai0.9470 5.48%1122.3559 1060.2031
Shandong0.98731.49%5231.2118 4063.3923
Shanxi0.95982.49%2404.9609 1887.7355
Shannxi0.9920 4.95%5173.2912 4386.7012
Shanghai0.93486.66%118.8461 107.8327
Sichuan0.93461.84%5727.0725 4490.0666
Tianjin0.98847.87%193.4425 162.9894
Xizang0.9520 3.20%854.9315 694.2801
Xinjiang0.99849.58%6941.0100 6835.0215
Yunnan0.99786.39%17,925.8741 15,930.1900
Zhejiang0.959237.60%412.2740 396.2194
Table 5. Projected supply and demand for sustainable talent in agriculture.
ProvinceSupply of Sustainable Talent in AgricultureDemand for Sustainable Talent in Agriculture
Anhui26,493 149,211
Beijing8495 23,891
Fujian16,105 35,554
Gansu21,460 193,429
Guangdong30,839 33,677
Guangxi18,729 5533
Guizhou24,084 63,690
Hainan4665 22,420
Hebei37,774 196,002
Henan38,623 237,663
Heilongjiang52,136 55,480
Hubei25,825 58,382
Hunan28,793 179,824
Jilin38,621 87,116
Jiangxi24,847 10,570
Liaoning32,148 61,230
Inner Mongolia26,758 110,708
Ningxia10,089 18,309
Qinghai8932 17,837
Shandong63,958 819,986
Shannxi26,910 86,439
Shanghai6773 1522
Sichuan49,920 504,696
Tianjin5972 5768
Xizang6675 14,391
Xinjiang45,473 48,783
Yunnan41,871 378,726
Chongqing14,130 62,002
Jiangsu33,161 110,948
Disclaimer/Publisher’s Note: The statements, opinions and data contained in all publications are solely those of the individual author(s) and contributor(s) and not of MDPI and/or the editor(s). MDPI and/or the editor(s) disclaim responsibility for any injury to people or property resulting from any ideas, methods, instructions or products referred to in the content.

