Article

Influence of Climate Change on the Probability of Chloride-Induced Corrosion Initiation for RC Bridge Decks Made of Geopolymer Concrete

by
Lamya Amleh
1,*,
Mostafa Hassan
1 and
Luaay Hussein
2
1
Department of Civil Engineering, Toronto Metropolitan University, Toronto, ON M5B 2K3, Canada
2
J.S. Held Consulting Firm, Etobicoke, ON M9W 6L9, Canada
*
Author to whom correspondence should be addressed.
Sustainability 2024, 16(18), 8200; https://doi.org/10.3390/su16188200
Submission received: 25 July 2024 / Revised: 3 September 2024 / Accepted: 11 September 2024 / Published: 20 September 2024
(This article belongs to the Section Air, Climate Change and Sustainability)

Abstract

:
Climate change poses a significant threat to the durability of reinforced concrete (RC) bridges, which are particularly vulnerable to chloride-induced corrosion of steel reinforcements. The main problem for the current research is the increase in the projected maximum temperature values, especially for the high emission scenario in the future because of climate change, applied to the upper part of the RC bridge deck made of geopolymer concrete (GPC) composed of 50% fly ash and 50% slag. This will reduce the corrosion initiation time and the safety and durability of the RC bridge deck structure. Despite extensive research on chloride-induced corrosion, there is a scientific gap in understanding how future climate variations will influence the rate of corrosion in RC bridges. Specifically, comprehensive studies assessing the effect of maximum temperature on the probability of the corrosion initiation process in RC bridge decks made of GPC exposed to chloride environments are lacking. This study used the Monte Carlo simulation method to assess the probability of corrosion initiation (PCI) under various future climate scenarios for Toronto City, Canada. This research examines the impact of the maximum temperature and relative humidity on the diffusion coefficient of chloride ions in concrete. It assesses the PCI for different concrete cover thicknesses in RC decks made of geopolymer concrete composed of 50% fly ash and 50% slag over specified periods, dealing with the sensitivity analysis for this parameter among different parameters defined in the performance function. The results indicate a substantial increase in the PCI for a 40 mm concrete cover compared with a 50 mm cover in various years. Furthermore, maximum temperatures ranging from 40 °C to 45 °C significantly increase the PCI compared with temperatures between 25 °C and 35 °C for a 50 mm concrete cover. Finally, polynomial functions have been deduced to investigate the reliability index and PCI as a function of various coefficients of variations for mean concrete covers made of GPC at various maximum temperature values in different years. These findings provide important information for the design and maintenance of RC structures, ensuring their longevity in the face of climate change.

1. Introduction

Reinforced concrete (RC) bridges are essential components of transportation infrastructure that provide safe and efficient mobility for people and goods. However, these structures are subjected to various environmental and operational factors that may cause deterioration and reduce service life. One of the most common critical threats they face is chloride-induced corrosion of steel reinforcement, a process that can significantly compromise structural integrity and longevity.
Chloride-induced corrosion is an electrochemical process that requires an anode, a cathode, a metallic path for electron transfer, and an electrolytic path for ion transfer [1,2,3]. Chloride ions can penetrate the concrete cover through various mechanisms, such as diffusion, absorption, permeation, and dispersion [4,5]. Initially, the reinforcing steel bars (rebars) are protected from corrosion due to the high alkalinity of the concrete (pH of 12.5–13.5), which forms a protective layer around the steel [6,7]. However, when chlorides reach the steel surface, they disrupt this protective layer, exposing the steel to corrosive elements. Once the passive film is disrupted, the steel starts corroding in the presence of oxygen and moisture. As the steel corrodes, it expands and generates pressures that can crack and damage the concrete, exacerbating the problem. The effect of corrosion due to chloride is more severe in unsaturated concrete than in saturated concrete, according to Han et al. [8].
The dual-stage corrosion model proposed by Tuutti [9] breaks down this phenomenon into initiation and propagation phases, each of which is influenced by environmental conditions and concrete properties [9,10]. The consequences of corrosion are severe, such as weakened structural integrity due to a reduced steel cross-sectional area, diminished steel ductility, and compromised concrete quality [11,12,13,14,15]. Ramani and Zhang [16] studied the impact of climate change on the long-term reliability of RC structures subjected to chloride ingress. Moreover, de Medeiros-Junior et al. [17] reported that temperature and relative humidity changes due to climate change led to a reduction in the service life of RC structures located in a marine environment. Gao and Wang [18] developed a probabilistic model addressing the service life of RC structures in coastal regions, considering global warming and sea level rise in terms of corrosion initiation, corrosion propagation, and whole service life stages.
To counter these effects, several strategies are recommended, such as using a low water-to-cement ratio to produce less permeable concrete, incorporating supplementary materials such as fly ash, and ensuring adequate concrete cover over the reinforcement [19,20]. However, an emerging challenge is climate change, which exacerbates the risks associated with chloride-induced corrosion. The Intergovernmental Panel on Climate Change (IPCC) highlighted that changing climate conditions, particularly rising temperatures and varying humidity levels, are likely to accelerate chloride penetration, further threatening the durability of RC structures [21,22,23,24,25,26,27,28]. In Canada, infrastructure has deteriorated because of the severe climate and lack of maintenance, which forced the Canadian government to spend 300 billion Canadian dollars to bring the distressed infrastructure up to an acceptable level, according to Ali and Mirza [29]. A real example of extensive corrosion deterioration caused by the application of extensive chloride concentration on the top surface of the RC bridge deck during the winter season is the Gardiner Expressway, located in Toronto City, Canada. It is a critical piece of transportation infrastructure, providing access to downtown Toronto from the surrounding suburbs of the Greater Toronto area. Approximately 140,000 vehicles pass through it daily on weekdays. Corrosion is visibly apparent in different RC members, especially in the bottom parts of RC decks, as shown in Figure 1.
This study specifically aims to assess the impact of climate change on the probability of chloride-induced corrosion in RC bridge decks made of geopolymer concrete (GPC). The primary objective is to understand how increased temperatures and humidity levels under different climate scenarios can accelerate corrosion initiation. This research fills a critical gap by quantifying the long-term effects of climate change on RC structures, with a focus on the resistance of GPC to chloride ingress. By utilizing different representative concentration pathways (RCPs), such as RCP2.6 (low emission) and RCP8.5 (high emission), this research projects annual maximum temperatures for Toronto City and models the influence of climate change on chloride ingress into concrete structures. The IPCC’s 2014 Fifth Assessment Report (AR5) utilized representative concentration pathways (RCPs) to project future climate scenarios based on greenhouse gas emissions [30].
The scientific novelty of this work lies in its dual focus: advancing construction materials science and contributing to sustainable development goals. From a materials science perspective, the integration of advanced climate models with chloride ingress simulations provides a novel method for assessing the long-term performance of GPC, a material known for its environmental benefits and potential durability. Unlike previous studies, which often assume a constant chloride diffusion coefficient, this research considers the variability of the diffusion coefficient under different climate scenarios. Previous studies, such as those by Saassouh and Lounis [31], have often assumed a constant chloride diffusion coefficient in concrete over time, which may not accurately reflect real conditions. This research considers the variability of the diffusion coefficient based on exposure conditions and concrete properties. In addition, the effect of temperature on the diffusion coefficient is analyzed for different emission scenarios. Furthermore, the relative humidity is assumed to be constant over time in this research, which affects the diffusion coefficient by influencing the moisture content and porosity of the concrete.
Geopolymer concrete has gained recognition for its advanced properties and sustainability. It is used in various applications, including bridge decks, marine structures, and the petrochemical industry. GPC offers improved strength and durability while being environmentally friendly and contributing to waste management [32,33,34,35,36,37]. Wasim et al. [38] demonstrated that, compared with foam concrete, simulated patch repair with GPC exhibited better resistance to chloride attack. However, GPC also has disadvantages, such as high construction costs, high shrinkage, and high brittleness. The sources of materials used in the GPC are fly ash, ground granulated blast furnace slag (GGBS), metakaolin, and silica fume, which are rich in silica and alumina oxides. The binding characteristics of a geopolymer depend on the generation of a 3D amorphous aluminosilicate network. The presence of the initial calcium source drives the coexistence of both calcium–silicate hydrate and geopolymeric gel, according to Yip et al. [39]. Fly ash-based GPC is the most common type of concrete used in construction projects because of its low carbon emissions, reduced impact of global warming on the environment, extended service life of RC structures, and noticeable savings in life cycle costs [40]. According to Meesala et al. [41], a GPC made of class F fly ash has high durability and strength. GGBS is also used for producing GPC mixtures because of its high aluminosilicate content. Furthermore, adding GGBS to concrete has many advantages, including high workability and compressive strength [42,43]. The GPC mixture used in this research for the RC bridge deck consists of 50% fly ash and 50% ground granulated blast furnace slag. Recent research on GPC using a 50% FA and 50% SG mixture has shown promising results in creating sustainable and environmentally friendly building materials. However, including slag tends to reduce the workability of the concrete and increase its shrinkage strain. These findings indicate that using a balanced proportion of FA and slag can optimize the performance of GPC [44,45]. In addition, GPC demonstrates superior resistance to high temperatures compared with ordinary Portland cement (OPC) concrete, as Manzoor et al. [46] reported that in GPC subjected to high temperatures, the residual compressive strength increases from 150 °C to 350 °C owing to geopolymerization reactions. However, the compressive strength decreases above 400 °C because of the formation of microcracks.
Recent studies have explored innovative approaches to enhance the properties of GPC, such as the use of crushed recycled glass for alkali-activated fly ash-based GPC, which improves its capacity and sustainability [47]. Other studies have focused on the mechanical performance of GPC by incorporating micro silica fume and waste steel lathe scraps, which results in enhanced durability and strength [48]. Additionally, the production of perlite-based aerated geopolymers using hydrogen peroxide has been investigated for its potential use in energy-efficient buildings, offering eco-friendly solutions [49]. These studies underscore the versatility and potential of GPC in various engineering applications, highlighting its relevance in modern sustainable construction practices.
This study makes significant contributions by evaluating the resilience of infrastructure under climatic stresses, with a specific focus on chloride-induced corrosion in GPC using advanced modeling techniques. By implementing Monte Carlo simulations to assess chloride ingress under varying climate conditions, this research provides valuable insights for developing more sustainable and durable building materials. Moreover, addressing the impact of climate change on concrete infrastructure aligns with the broader objectives of sustainable development. Climate-resilient construction practices contribute to sustainability goals by enhancing the durability of infrastructure, reducing maintenance costs, and minimizing the environmental footprint of construction materials. The findings emphasize the importance of adopting GPC for RC bridge decks in regions vulnerable to climate change, thereby contributing to global efforts in sustainable urban infrastructure development.

2. Materials and Methods

2.1. Materials

Geopolymer concrete is a sustainable alternative to OPC concrete, offering several advantages in terms of durability, environmental impact, and mechanical performance. GPC is made from industrial byproducts such as fly ash and ground granulated blast furnace slag, which are rich in silica and alumina oxides.
  • Concrete composition: The GPC mixture used in this study consists of 50% FA and 50% SG. This specific combination was chosen because it provides an optimal balance of mechanical and durability properties, which are essential for resisting chloride-induced corrosion. The inclusion of FA contributes to the long-term strength of concrete, whereas SG imparts high early strength and durability, which are critical for the structural performance of bridge decks exposed to varying temperature and humidity conditions. This combination also aligns with sustainable construction practices by utilizing industrial byproducts, thereby reducing the carbon footprint and supporting environmental sustainability goals. The material properties used are as follows:
  • Chloride concentration: The mean chloride concentration applied on the top part of the RC deck is 6 kg/m3, which follows a lognormal distribution with a coefficient of variation of 30%.
  • Concrete cover depth: Various concrete cover mean thicknesses are considered in the study, including 30 mm, 40 mm, 50 mm, and 60 mm.
  • Chloride threshold level (Cth): The chloride threshold level, which represents the concentration at which corrosion of the reinforcing steel begins, is set at 0.7 kg/m3. This threshold level also follows a lognormal distribution with a coefficient of variation of 20%.
  • Chloride diffusion coefficient (D): The apparent chloride diffusion coefficient for the specific GPC used in the study is 2.38 × 10⁻¹² m2/s, with an age factor of 0.604.
  • Temperature and humidity: The impact of varying maximum temperatures (from 25 °C to 45 °C) and relative humidity levels (70% and 75%) on the probability of corrosion initiation.

2.2. Methods

This methodology offers a comprehensive, data-driven, and statistically robust framework to determine and predict the impact of climatic changes on the structural integrity of reinforced concrete structures, with a specific focus on Toronto’s urban environment. This study uses a Monte Carlo simulation (MCS) method to determine the probability of corrosion initiation (PCI) for reinforced concrete structures under different RCPs, which reflects potential future greenhouse gas emission scenarios and converges upon the envisioned climatic trajectory for the projected maximum temperature in the future for Toronto City. Two distinct RCPs (RCP2.6 and RCP8.5) and a mean chloride concentration of 6 kg/m3 following a lognormal distribution were applied on the top part of the RC deck made of GPC. The PCI will be conducted across different timelines via the following steps:
  • Data collection and calculation: This study collected data on the projected maximum temperature for Toronto City and the relative humidity. The chloride diffusion coefficient over time and the chloride concentration data were determined through detailed calculations.
  • Monte Carlo simulation model development: The MCS method is a key component of this study and is used to predict the PCI in RC structures under various environmental scenarios. This probabilistic approach is ideal for modeling complex systems with inherent uncertainties by simulating a wide range of possible outcomes based on input data.
  • Key variables: The simulation incorporates variables such as the maximum temperature, relative humidity, concrete cover thickness, chloride concentration, and chloride diffusion coefficient. These variables are treated as random inputs to reflect the natural variability and uncertainty of real-world conditions. Each variable follows a specific statistical distribution, ensuring that the simulations capture a realistic range of potential scenarios.
  • Simulation process and iteration: The MCS process is conducted to generate random samples from the input distributions. The model will then calculate the predicted PCI for each sample, and the simulation will repeat this process 100,000 times to generate an accurate result, ultimately enabling a comprehensive investigation of potential outcomes.
  • Analytical evaluation: The results of the MCS are analyzed to determine the PCI for each scenario. The analysis will include statistical measures such as the mean, standard deviation, coefficient of variation, and distribution for each random variable.
  • Prediction and comparison: Finally, polynomial functions would be deduced via the least squares method between the data points plotted on the x-axis and y-axis to predict the PCI and the reliability index as a function of various coefficients of variation for mean concrete covers of 40 mm and 50 mm used in RC deck made of GPC exposed to maximum temperature values of 30 °C and 40 °C applied on the top part of the deck. In addition, the mean chloride diffusion coefficient corresponds to the RC bridge deck made of GPC consisting of 50% FA and 50% SG. A comparative study was conducted to assess the impact of maximum temperature values applied on the top part of two RC decks, made of GPC and normal concrete, on the PCI to choose the optimum material for RC decks with less PCI (almost zero values of PCI) in different years.

3. Results

3.1. Calculation of the Chloride Diffusion Coefficient over Time

Understanding the progression of chloride diffusion in concrete is critical for predicting the service life of concrete structures exposed to chloride environments. The chloride diffusion coefficient (D) is a measure that reflects how quickly chloride ions can move through concrete and directly influences the initiation of corrosion in reinforced concrete. This coefficient may change because of factors such as concrete aging, environmental conditions, and the ongoing hydration of cement. Therefore, it is essential to consider the nonsteady-state condition and the variable nature of D over time.
Ordinary Portland cement is the most commonly used construction material worldwide and reacts with water through hydration. In contrast, GPC is a newer material made from industrial byproducts, such as fly ash or slag, activated by alkaline solutions. These fundamental differences in composition and curing processes significantly influence chloride ion penetration. The diffusion of chloride ions in both OPC and GPC can generally be described by Fick’s second law for variable diffusion coefficients, as shown in Equation (1).
c t = D t   2 c x 2  
where c is the chloride concentration, t is the time, x is the depth from the surface, and D(t) is the chloride diffusion coefficient, which is dependent on time and material properties. The chloride diffusion coefficient over time can be calculated via Equation (2).
D t = D o   × t o t m  
In this study, (m) represents the age factor, (Do) denotes the apparent chloride diffusion coefficient, (t) is the exposure time in years, and (to) is the reference time, corresponding to 28 days (equivalent to 0.0767 years). The values for m and Do were derived from the experimental research by Tennakoon et al. [50]. Specifically, for the GPC mix composed of 50% FA and 50% SG, the age factor m is 0.604, while for ordinary OPC concrete, it is 0.192. The apparent chloride diffusion coefficients were reported as Do = 2.38 × 10⁻¹² m2/s for the GPC mix with 50% FA and 50% SG and Do = 6.70 × 10⁻¹² m2/s for OPC concrete.
Research conducted by Tennakoon et al. [50] indicated that the age factor for GPC ranges between 0.40 and 0.60, suggesting that aging enhances the resistance to chloride diffusion more in geopolymer concrete. As GPC ages, it develops a more interconnected structural network and forms additional reaction products, such as hydrotalcite, which refine the pore structure of the binder [51,52]. These changes lead to a more pronounced reduction in chloride diffusion than that of OPC, which, despite refining its pore structure through aging, produces fewer chloride-binding products [53,54,55]. A combination of optimal percentages of FA and SG in reinforced concrete resulted in increased strength, reduced porosity, and a more compact matrix, as indicated by Sasui et al. [56]. The optimal mixture of FA and SG, particularly a 50/50 ratio, has been found to yield the best performance in terms of the lowest chloride diffusion coefficient, indicating the superior microstructure and enhanced durability of GPC. The primary advantage of using GPC with 50% FA and 50% SG is its significantly longer time to rebar corrosion initiation than OPC does. This enhanced durability is attributed to the superior protective qualities of SG in GPC, which offers better resistance to corrosion in high chloride environments than OPC concrete does.
Figure 2 shows the chloride diffusion coefficients, D(t), over time for the GPC (with a composition of 50% FA and 50% SG) and OPC concrete. The figure clearly shows that the D(t) for GPC is consistently lower than that for OPC concrete. This difference highlights the superior chloride resistance of GPC, making it a more suitable option for structures exposed to chloride-rich environments, as it would offer better protection against chloride-induced corrosion of reinforcements.

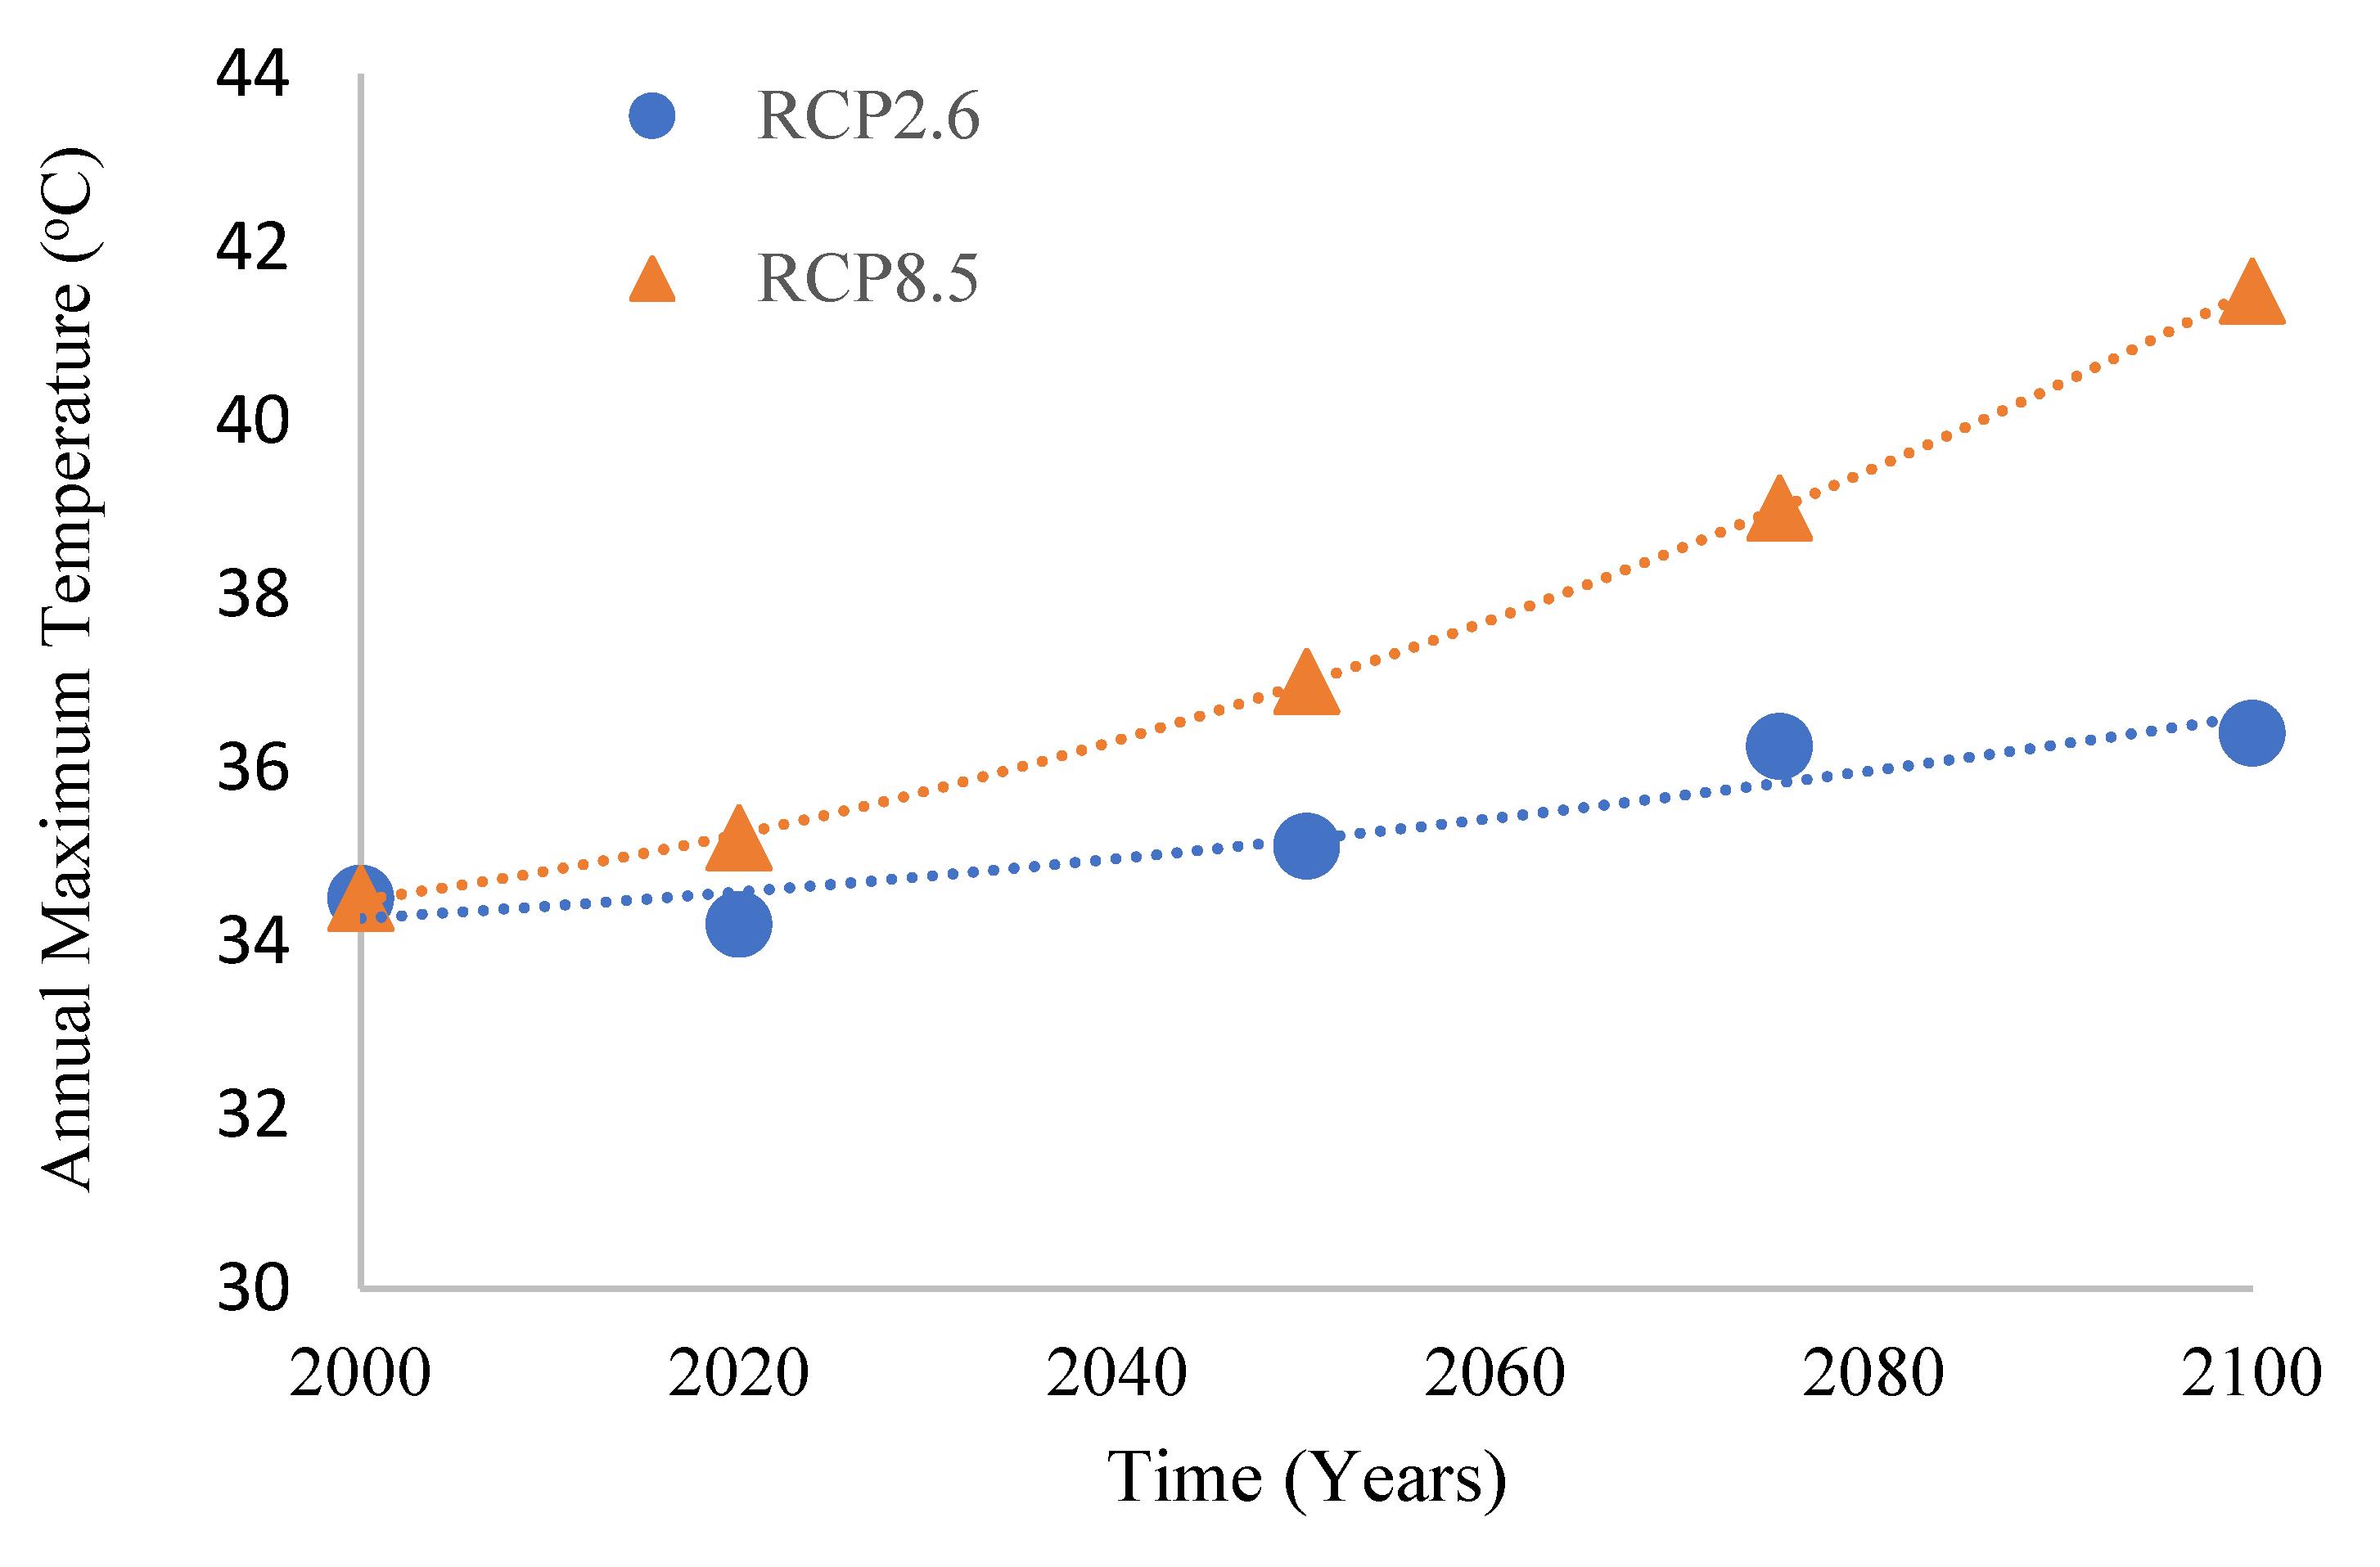
3.2. Temperature Projections for Toronto City across Various RCPs

Canada’s weather and climate vary significantly by province and season. Toronto has a continental climate with warm summers and winters marked by heavier precipitation. Historical data from 1943–2020 show that the annual maximum temperature in Toronto has increased linearly, as shown in Figure 3. This trend suggests that summer heat will continue to rise in the future.
The Canada Changing Climate Report (CCCR) [57] has conducted a comprehensive analysis to project the future annual maximum temperature for Toronto City, which is located at 43.7417° N, 79.3733° W. These studies focus on several RCPs, particularly RCP2.6 and RCP8.5, which are emission scenarios that represent potential future pathways for greenhouse gas concentrations. The CCCR [57] forecasts indicate that by the end of the century in 2100, the average peak temperature in Toronto will reach 36.4 °C under the RCP2.6 scenario and markedly increase to 41.7 °C under the RCP8.5 scenario. While subject to the inherent uncertainties of climate modeling, these projections illustrate the potential for increased heat events. Figure 4 represents these climate predictions.

3.3. Chloride-Induced Corrosion Initiation: Performance Function

The MCS method is used, as outlined in Section 2.2 in this study, because of its precision and adaptability in assessing the likelihood of carbonation and chloride-induced corrosion due to its accuracy and flexibility [31,58,59,60]. Recognized for solving problems by simulating random variables, the method generates a large set of samples, ensuring an accurate probability distribution for the phenomenon under consideration [61,62,63,64].
Chloride Ingress Modeling: Chloride ingress into reinforced concrete highway bridges, mainly due to deicing salts, involves multiple transport mechanisms, including capillary absorption in partially saturated concrete and ionic diffusion in saturated concrete [65]. In modeling chloride transport to the reinforcing steel, the model adopts a modified form of Fick’s second law, accounting for ionic diffusion with several key assumptions: exclusion of capillary flow and chloride binding, the use of Crank’s solution for a plane sheet to address plane isotropic concrete structures (one-dimensional diffusion), and the assumption of constant diffusion coefficients and surface chloride concentrations. In addition, the initial chloride concentration within the concrete is considered negligible. However, some assumptions, such as a constant diffusion coefficient, may not hold because of various factors: the nonhomogeneous nature of concrete, variance in moisture levels, and time-dependent changes in chloride binding within cement hydrates.
Once the chlorides have penetrated the concrete cover and reached the reinforcement and their concentration is above the “threshold level”, corrosion initiation is imminent. Diffusion can be assumed to be the governing transport mechanism [66] for predicting the ingress of chlorides into a concrete member exposed to the periodic application of deicing salts. Using Fick’s second law of diffusion, the chloride concentration profile is determined, assuming homogeneous and isotropic behavior in the concrete.
The concentration of chlorides at the depth of the reinforcement can be calculated via Equation (3), which also considers the thickness of the concrete above the steel [31,67]. For this model, the rate at which chlorides move through the concrete is known as the chloride diffusion coefficient (D(t)), as expressed in Equation (2).
C x , t = C o 1 erf x 2 D ( t ) × t  
where Co is the chloride concentration at the concrete surface (kg/m3) and where x is the depth of the concrete cover (m).
Performance Function Description: The performance function is derived by calculating the difference between a term equivalent to a resistance and a term equivalent to the load effect. The term “resistance” refers to the chloride threshold level (Cth), which defines the resistance of the concrete cover to corrosion-induced cracking. The term “load effect” defines the chloride concentration at the steel level (Cx,t) or the corrosion-induced stresses that lead to cracking. The parameter Cx,t is a function of several variables, including the concrete cover depth (x), time (t), corrected diffusion coefficient Dc(t), and chloride concentration (Co). Considering these variables, the performance function for corrosion initiation can be formulated as shown in Equation (4). Corrosion occurs when the chloride concentration exceeds the threshold, as shown in Equation (4).
g(Co, x, Cth) = Cth − Cx,t (Co, Dc(t), x, t)
where the conditions are as follows:
g(Co, x, Cth) = 0 (limit state);
g(Co, x, Cth) > 0 (uncorroded state);
g(Co, x, Cth) < 0 (corrosion state)
Final Formulation: The corrosion initiation performance function involves three random variables: the concrete cover (x), surface chloride concentration (Co), and chloride threshold (Cth). The corrected diffusion coefficient Dc is considered to change over time because of temperature and relative humidity effects, leading to Equation (5).
g C o ,     x , C t h = C t h C o 1 erf x 2 D c t × t
where Cth is the chloride threshold (kg/m3); Co is the chloride concentration applied on the surface of the concrete (kg/m3); x is the concrete cover thickness (m); Dc(t) is the corrected chloride diffusion coefficient, including the effects of temperature, maturation time of the concrete, and relative humidity (m2/s); and t is time (in years).

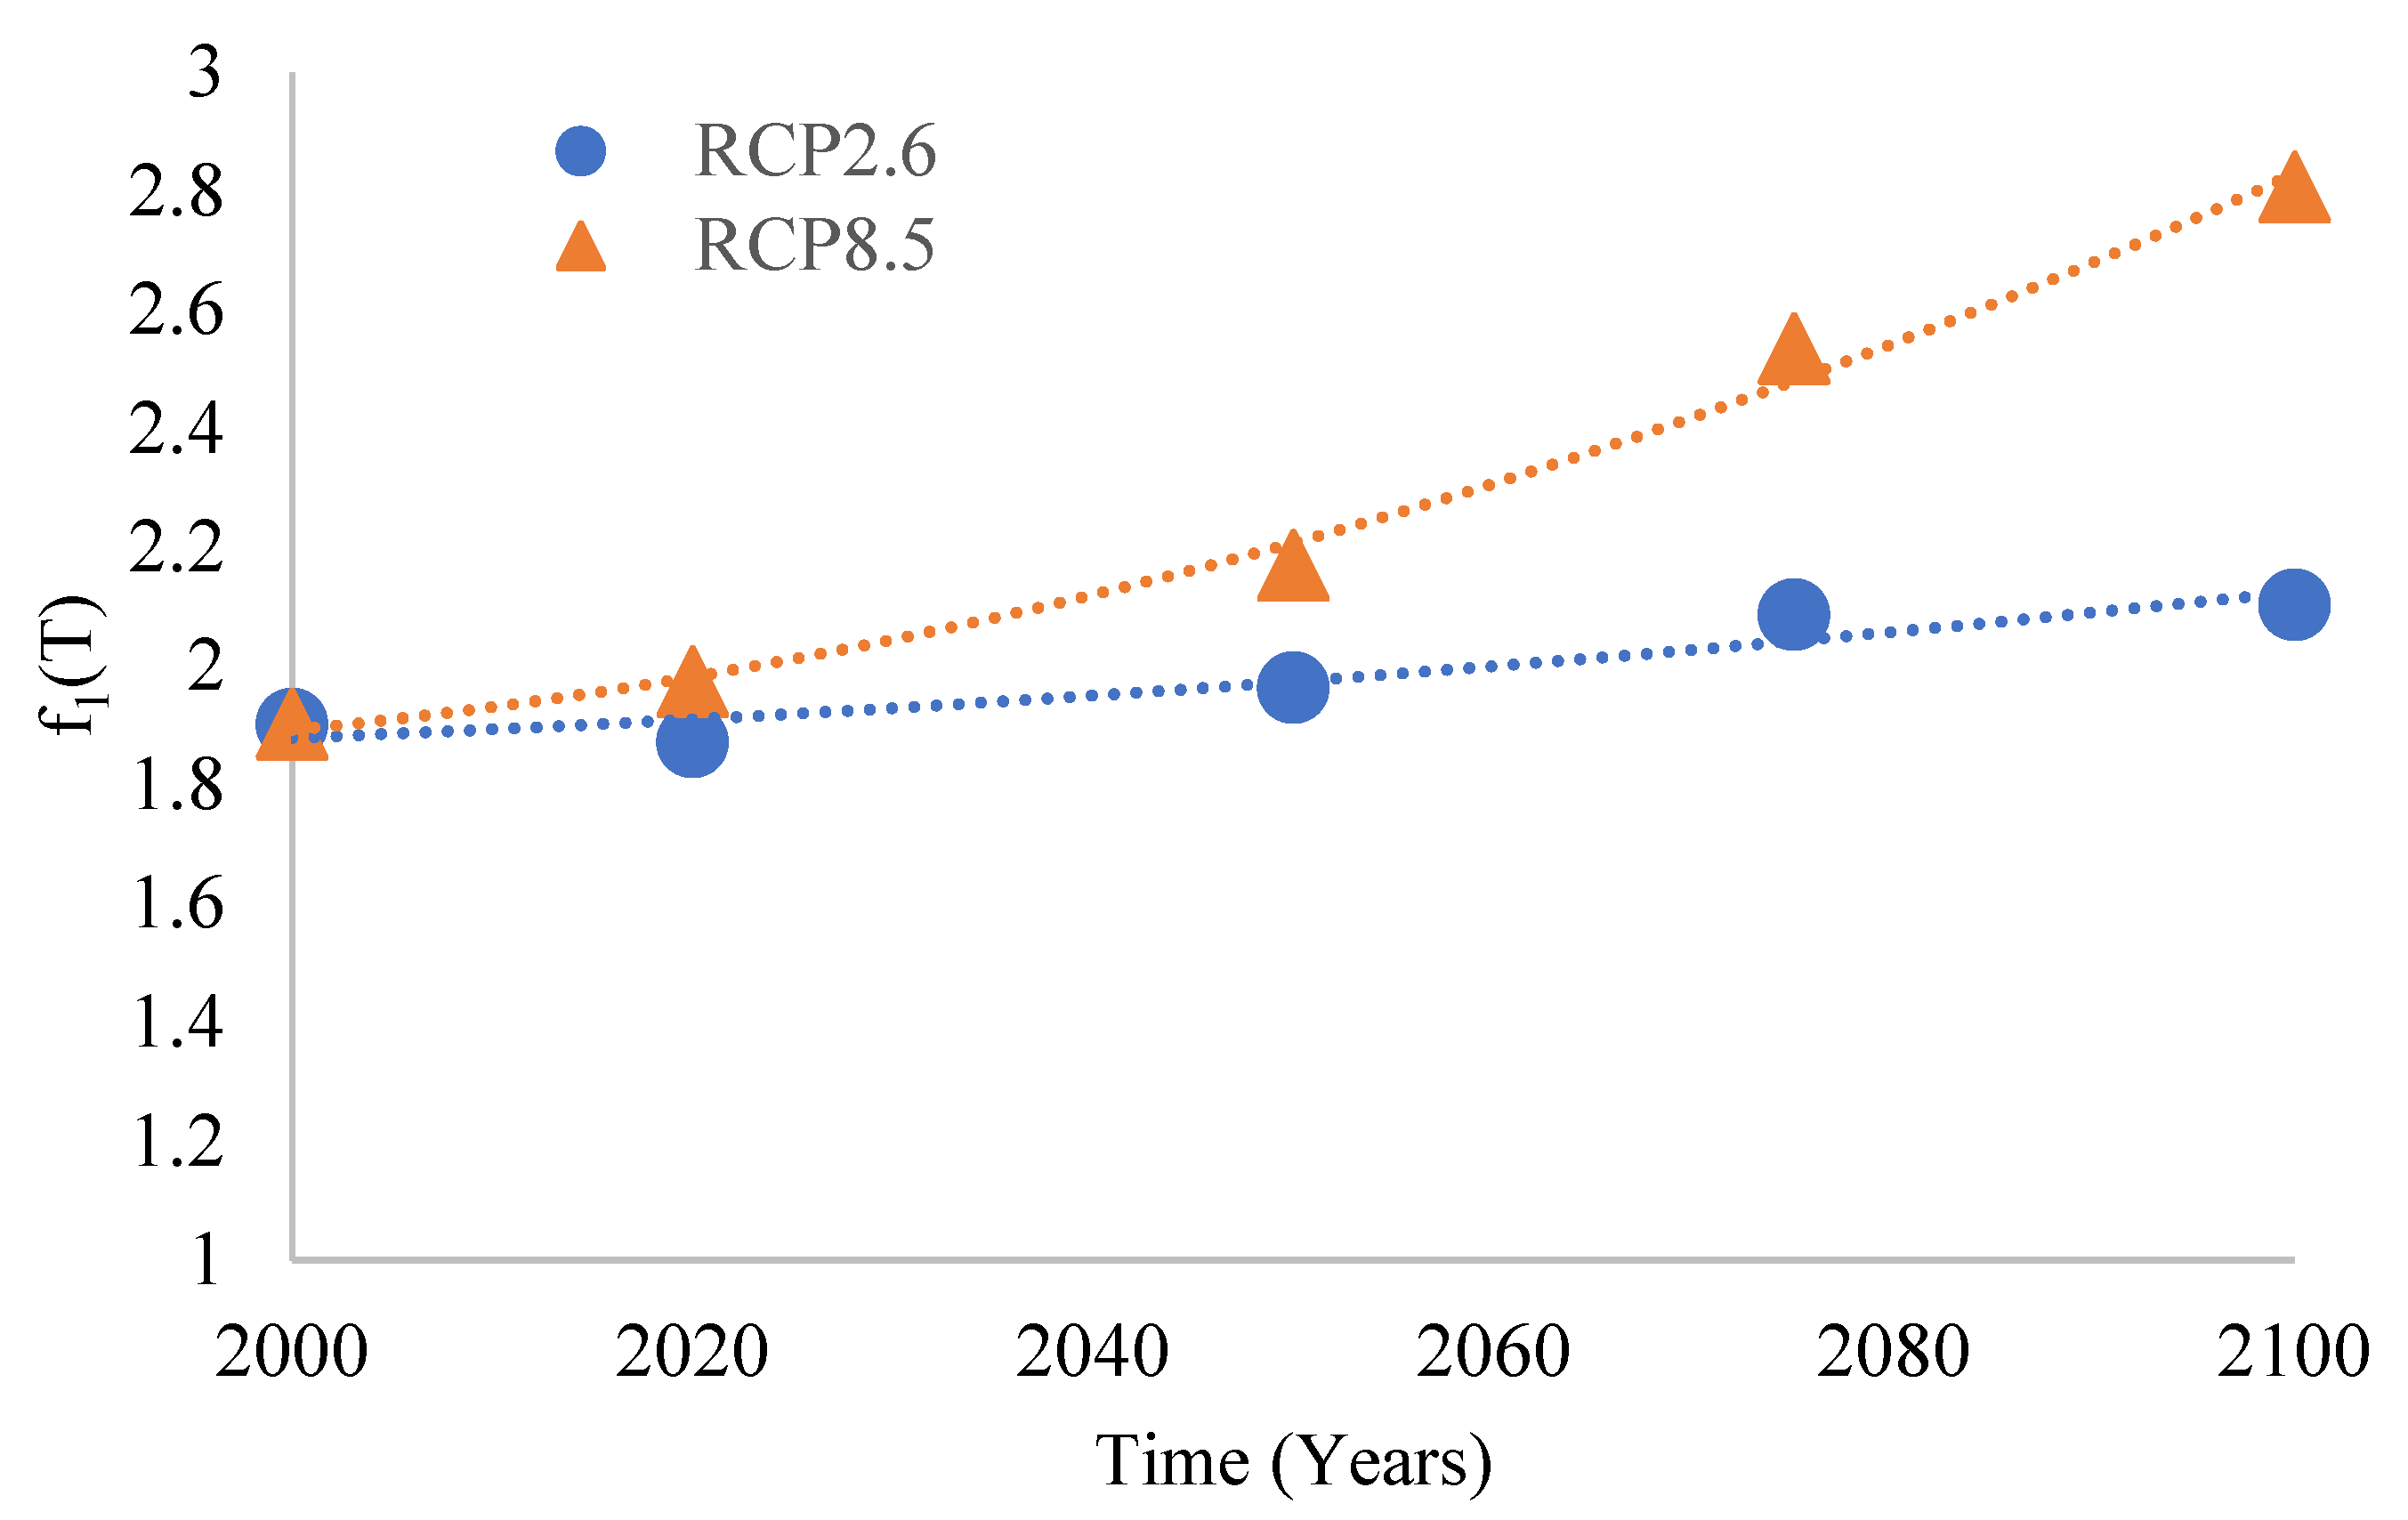
3.4. Determination of the Corrected Chloride Diffusion Coefficient (Dc(t))

In assessing the durability of reinforced concrete, the corrected chloride diffusion coefficient (Dc (t)) is a dynamic measure that adapts the chloride diffusion coefficient (D(t)) to account for environmental factors, such as temperature fluctuations, concrete, maturation time, and variations in relative humidity. This relationship is illustrated in Equation (6), as referenced by Saetta et al. [27].
D c ( t ) = D t × f 1 T × f 2 t e × f 3 R H
where D(t) (m2/s) is the chloride diffusion coefficient, Dc(t) (m2/s) is the corrected chloride diffusion coefficient that changes over time, f1(T) is the factor that represents the influence of temperature according to Arrhenius’ law [68,69,70], as clarified in Equation (7), f2(te) is the factor that represents the influence of the equivalent maturation time, as illustrated in Equation (8), and f3(RH) is the factor that represents the influence of relative humidity, as shown in Equation (9).
f 1 T = Exp E a R 1 T 1 1 T 2  
f 2 t e = ξ + 1 ξ 28 t e 1 2
f 3 R H = 1 + 1 R H 4 1 R H c 4 1
where T1 is the reference temperature (296 K), T2 (K) is the target temperature, and Ea is the activation energy of diffusion (kJ/mol) influenced by the water-to-cement ratio of the concrete, in this study, the water-to-cement ratio of 0.4 was utilized with an associated activation energy of 41.8 kJ/mol according to Page et al. [71]. R is the gas constant (8.314 × 10⁻³ kJ/mol), and te represents the actual time of exposure to chloride (days), according to Saetta et al. [27]. ξ is a factor indicating how much diffusivity decreases over time, ranging from 0 to 1. According to Saetta et al. [27], the ξ parameter is assumed to be near 1 for concrete with a low water-to-cement ratio. RHc, as defined by Bazant and Najjar [72], is assumed to be 75%, while RH denotes the current pore relative humidity.
Temperature influences on the diffusion coefficient: The factors for temperature are based on the Arrhenius equation, as shown in Equation (7), which highlights the exponential relationship between temperature and its factors over time. The significance of this relationship is presented in Figure 5, which plots temperature factor variations against future years under RCP2.6 and RCP8.5, with RCP8.5 showing the greatest temperature influence.
The impact of the annual maximum temperature ranging from 35 °C to 45 °C, which represents the high emission scenario (RCP8.5) for the annual maximum temperature in 2100 for Toronto City, on the probability of chloride-induced corrosion initiation was evaluated in this research for RC bridge decks made of GPC. Furthermore, the influence of the annual maximum temperature ranging from 25 °C to 34 °C, which represents the low emission scenario (RCP2.6) for the maximum temperature in 2100 for Toronto City on the PCI, was deduced for the same type of concrete as mentioned previously. Furthermore, the factors of the maximum temperature (see Figure 6) were obtained versus the corresponding maximum temperature via Equation (7), which is reflected in the chloride diffusion coefficient for a GPC at a certain time.
Relative humidity impact: The factor that represents the effect of relative humidity on the corrected diffusion coefficients is shown in Figure 7. Once the relative humidity (%) reaches a value of less than 50%, its corresponding factors decrease substantially compared with values within the 55–100% range. The relative humidity factor is calculated using Equation (9) based on the corresponding relative humidity values shown in Figure 7. This research used standard relative humidity values of 70% and 75% to evaluate their effects on the probability of chloride-induced corrosion initiation in RC bridge decks made of GPC consisting of 50% FA and 50% SG.
Application and Validation: This theoretical framework is applied to a concrete bridge deck with input parameters derived from field data [31]. Table 1 summarizes these parameters, providing insights into the mean values, their corresponding coefficient values, and each parameter’s distribution.
Table 1 shows that all the parameters used in predicting the PCI due to chlorides follow a lognormal distribution. Using a lognormal distribution for the input parameters allows the application of a closed-form solution, as described by Nowak [73], to compute the reliability index (β). This index is vital for evaluating the corrosion risk and is determined via Equation (10). Specifically, by expressing the limit state function as g = R/Q − 1, β can be determined as follows:
β = ln μ R μ Q × 1 + C O V Q 2 1 + C O V R 2 ln 1 + C O V Q 2 1 + C O V R 2  
where COVR and COVQ are the coefficients of variation for the resistance and load values, respectively.
In general, the log-normal mean (μln) and log-normal standard deviation (σln) are calculated from the normal mean and standard deviation via the formulas provided by Benjamin and Cornell [74], as expressed in Equations (11) and (12). These calculations offer a theoretical basis for estimating the dataset’s lognormal distribution, which might not perfectly match the actual data due to natural deviations from the idealized model.
μ l n = Ln μ 0.5 × σ l n 2
σ l n = L n σ μ 2 + 1   0.5   = L n C O V 2 + 1 0.5  
where Ln is the natural logarithm to the base (e), and the coefficient of variation COV = σ/μ.

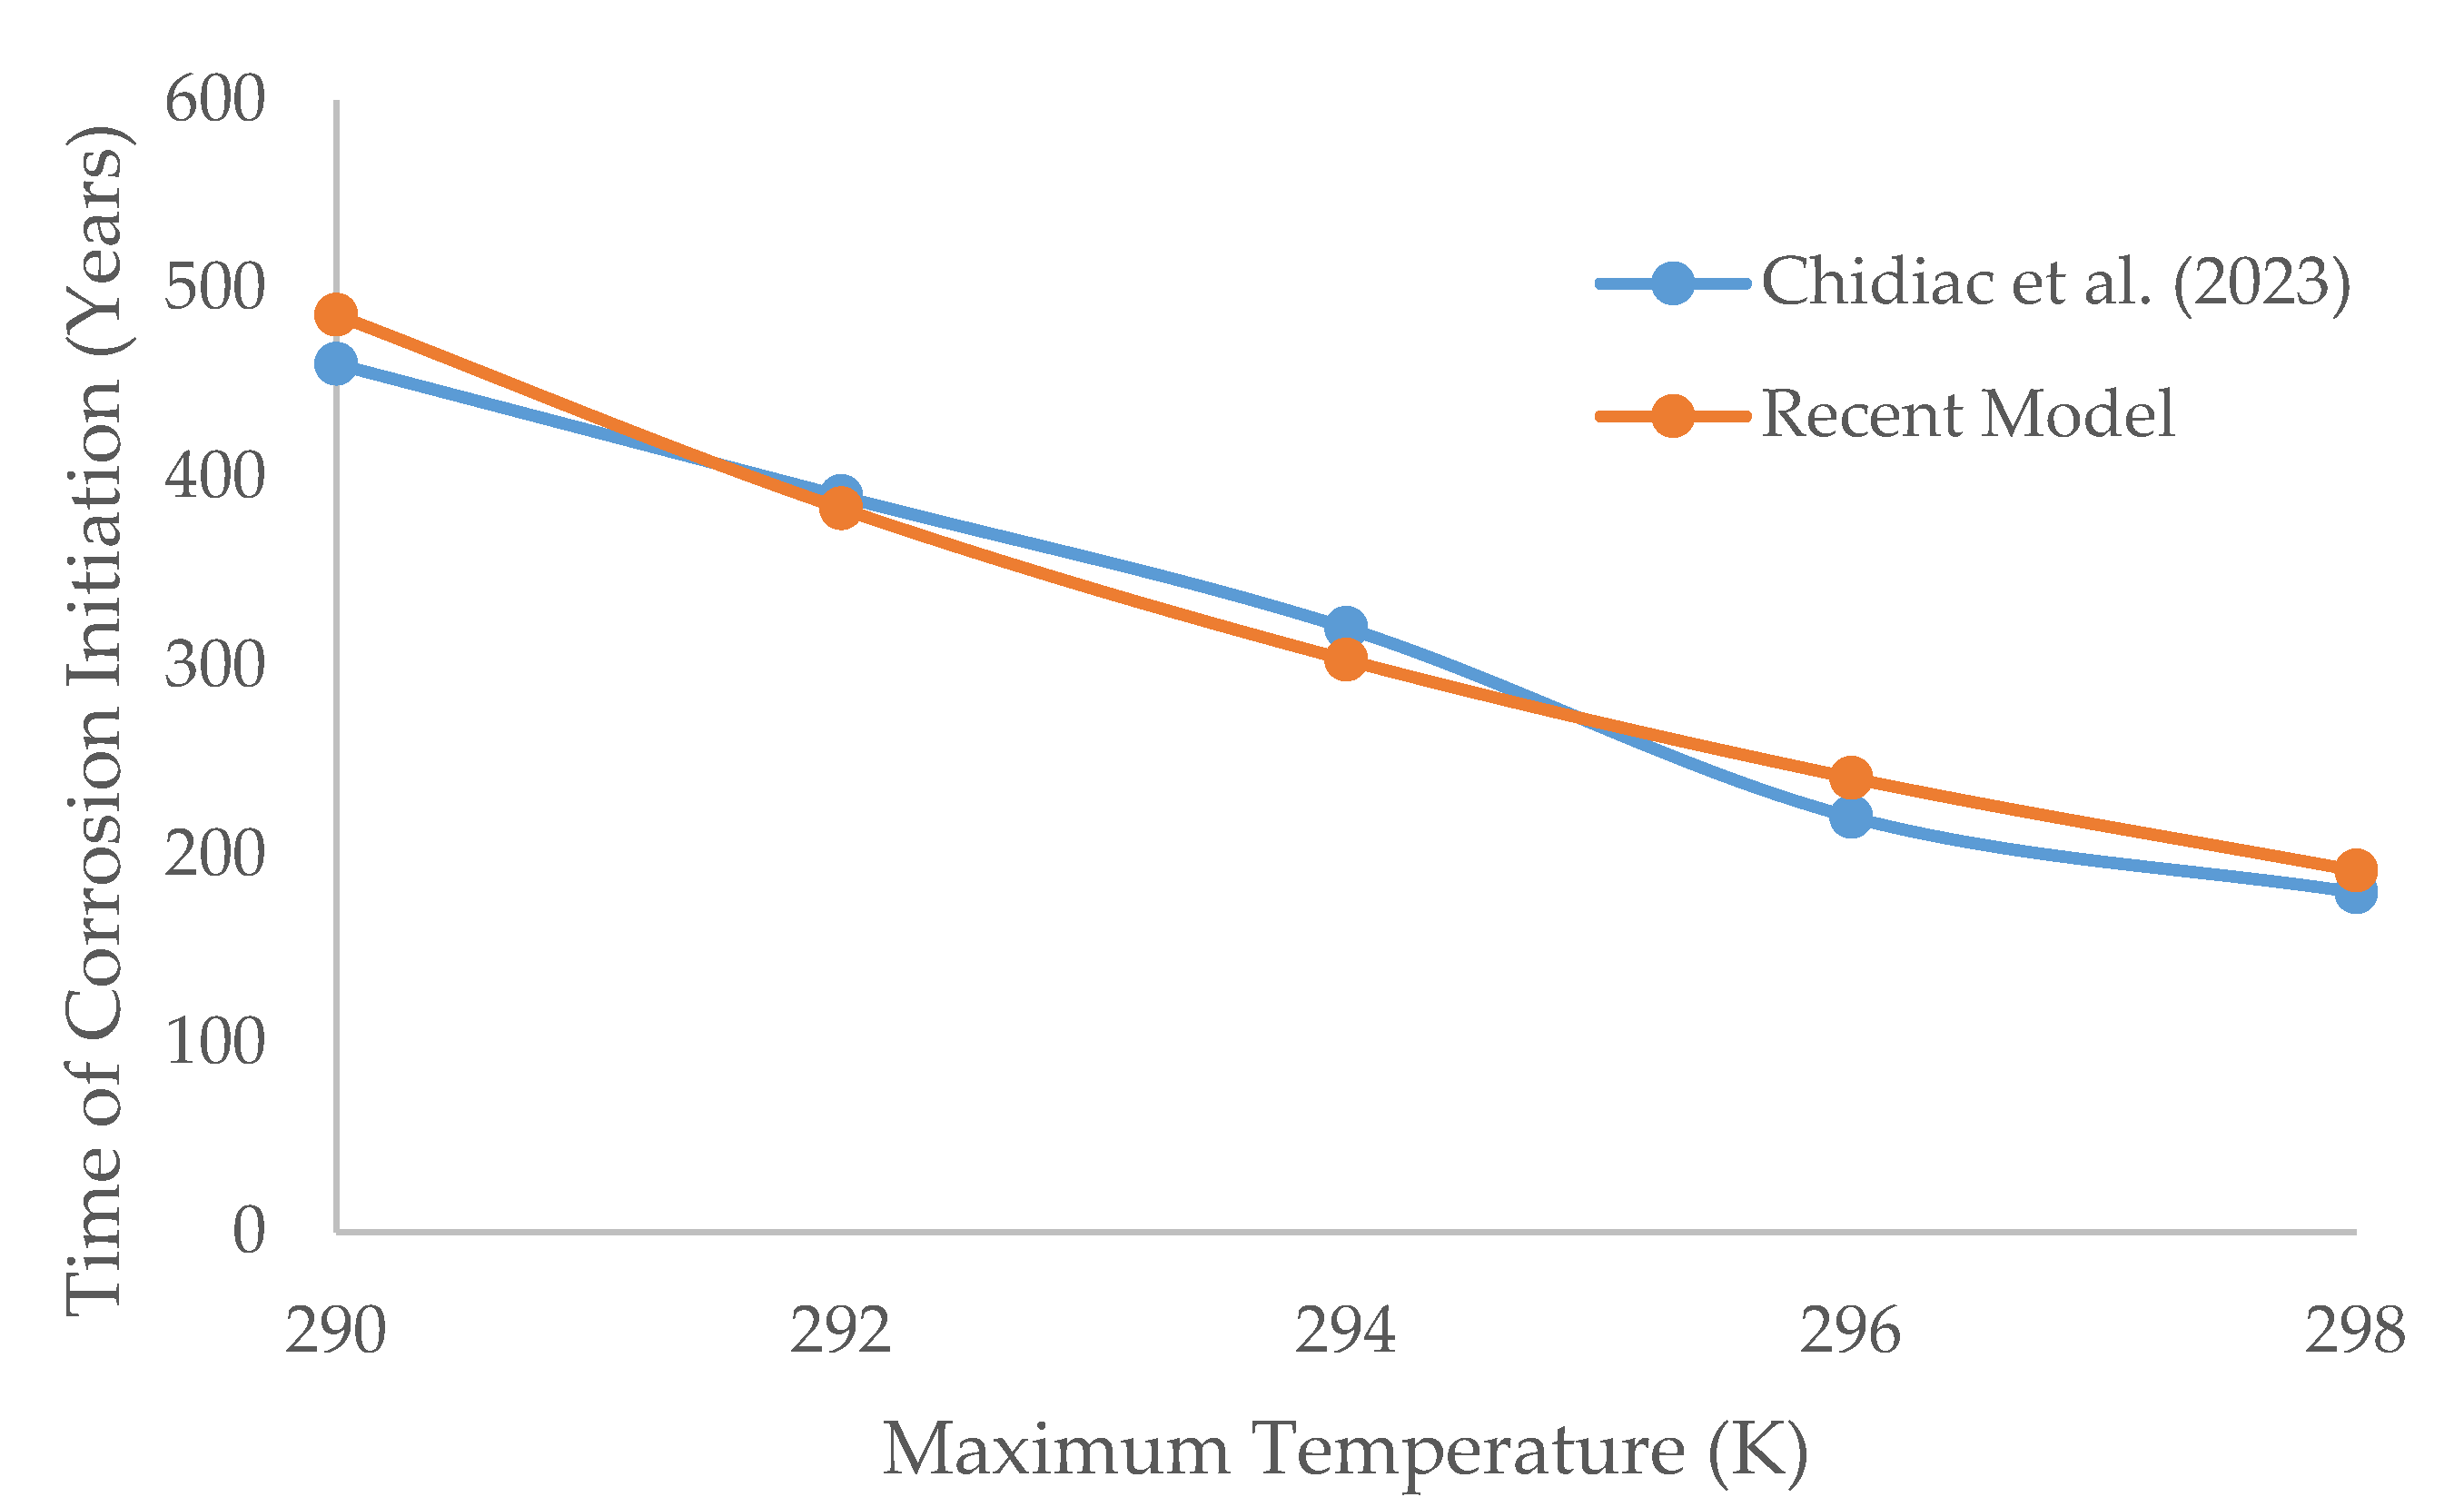
3.5. Validation of the Probabilistic Chloride-Induced Corrosion Initiation Model

This study extends the probabilistic modeling approach developed by Saassouh and Lounis [31] to assess the likelihood of corrosion initiation for RC bridge deck members subjected to deicing salts. Saassouh and Lounis [31] applied the MCS technique to project the probability of corrosion versus various time intervals, considering key random variables such as the concrete cover (d), chloride diffusion coefficient (D), chloride concentration (Cs), and chloride threshold (Cth), which all followed lognormal distributions, as mentioned in Table 1. Their analysis indicated that after 23 years and 10 months, the PCI reached approximately 45%. The current model is validated through a rigorous comparison with the outcomes reported by Saassouh and Lounis [31] for an RC bridge deck, as detailed in Table 1 and shown in Figure 8a. By conducting an extensive MCS with 100,000 simulations, we ascertained that our model’s predictions are in solid agreement with those reported by Saassouh and Lounis [31], thereby reaffirming the robustness of the probabilistic methods employed in evaluating the durability of RC structures under chloride attack. The time-varying probability of corrosion is evaluated over 50 years for the RC bridge deck made of high-performance concrete, as shown in Figure 8b. Moreover, the mean and coefficient of variation for the chloride diffusion coefficient (D) for the high-performance concrete RC bridge deck are 6.342 × 10⁻¹³ m2/s and 25%, respectively, following a log-normal distribution according to Lounis et al. [75]. Moreover, Lounis et al. [75] reported that the PCI at 30 years was 17%. In this research, the PCI was determined via an MCS for the same RC bridge deck made of high-performance concrete. The probability of corrosion initiation is 16%, which corresponds to the same PCI values reported by Lounis et al. These concurrences validate our model as a reliable tool for predicting chloride-induced corrosion in RC structures.
The time of corrosion initiation for a GPC consisting of 50% FA and 50% SG versus temperatures ranging from 290 K to 298 K was validated in this research for a concrete cover thickness of 50 mm, as shown in Equation (13). This equation illustrates the effect of the maximum temperature factor f(t) on the chloride diffusion coefficient of the GPC mixture. The results indicate that the corrosion initiation times predicted by the current model closely align with those obtained by Chidiac et al. [76] for the same type of GPC across various maximum temperatures, as depicted in Figure 9. The percentage error in the corrosion initiation time (Ti) between the current model and Chidiac et al.’s model remains within an acceptable range.
Equation (13) demonstrates the robustness of the current model in predicting the time of corrosion initiation, validated against an existing model for GPC mixes containing 50% FA and 50% SG with a concrete cover thickness of 50 mm. These findings confirm that the current model reliably estimates the time to corrosion initiation, yielding results that are closely comparable to those of Chidiac et al. [76], with minimal acceptable errors across different data points.
T i = x 2 4 × D o   × ( 0.0767 ) m × f   ( t ) × e r f 1 1 C t h C o 2 × 365 × 24 × 60 × 60   1 1 m
where: Do is the apparent chloride diffusion coefficient for the specific type of GPC used (m2/s), m is the age factor dependent on the type of GPC used, f(t) is the factor of the maximum temperature calculated using Equation (7), as mentioned previously, and, Ti is the time to chloride-induced corrosion initiation (years).

4. Discussion of Results

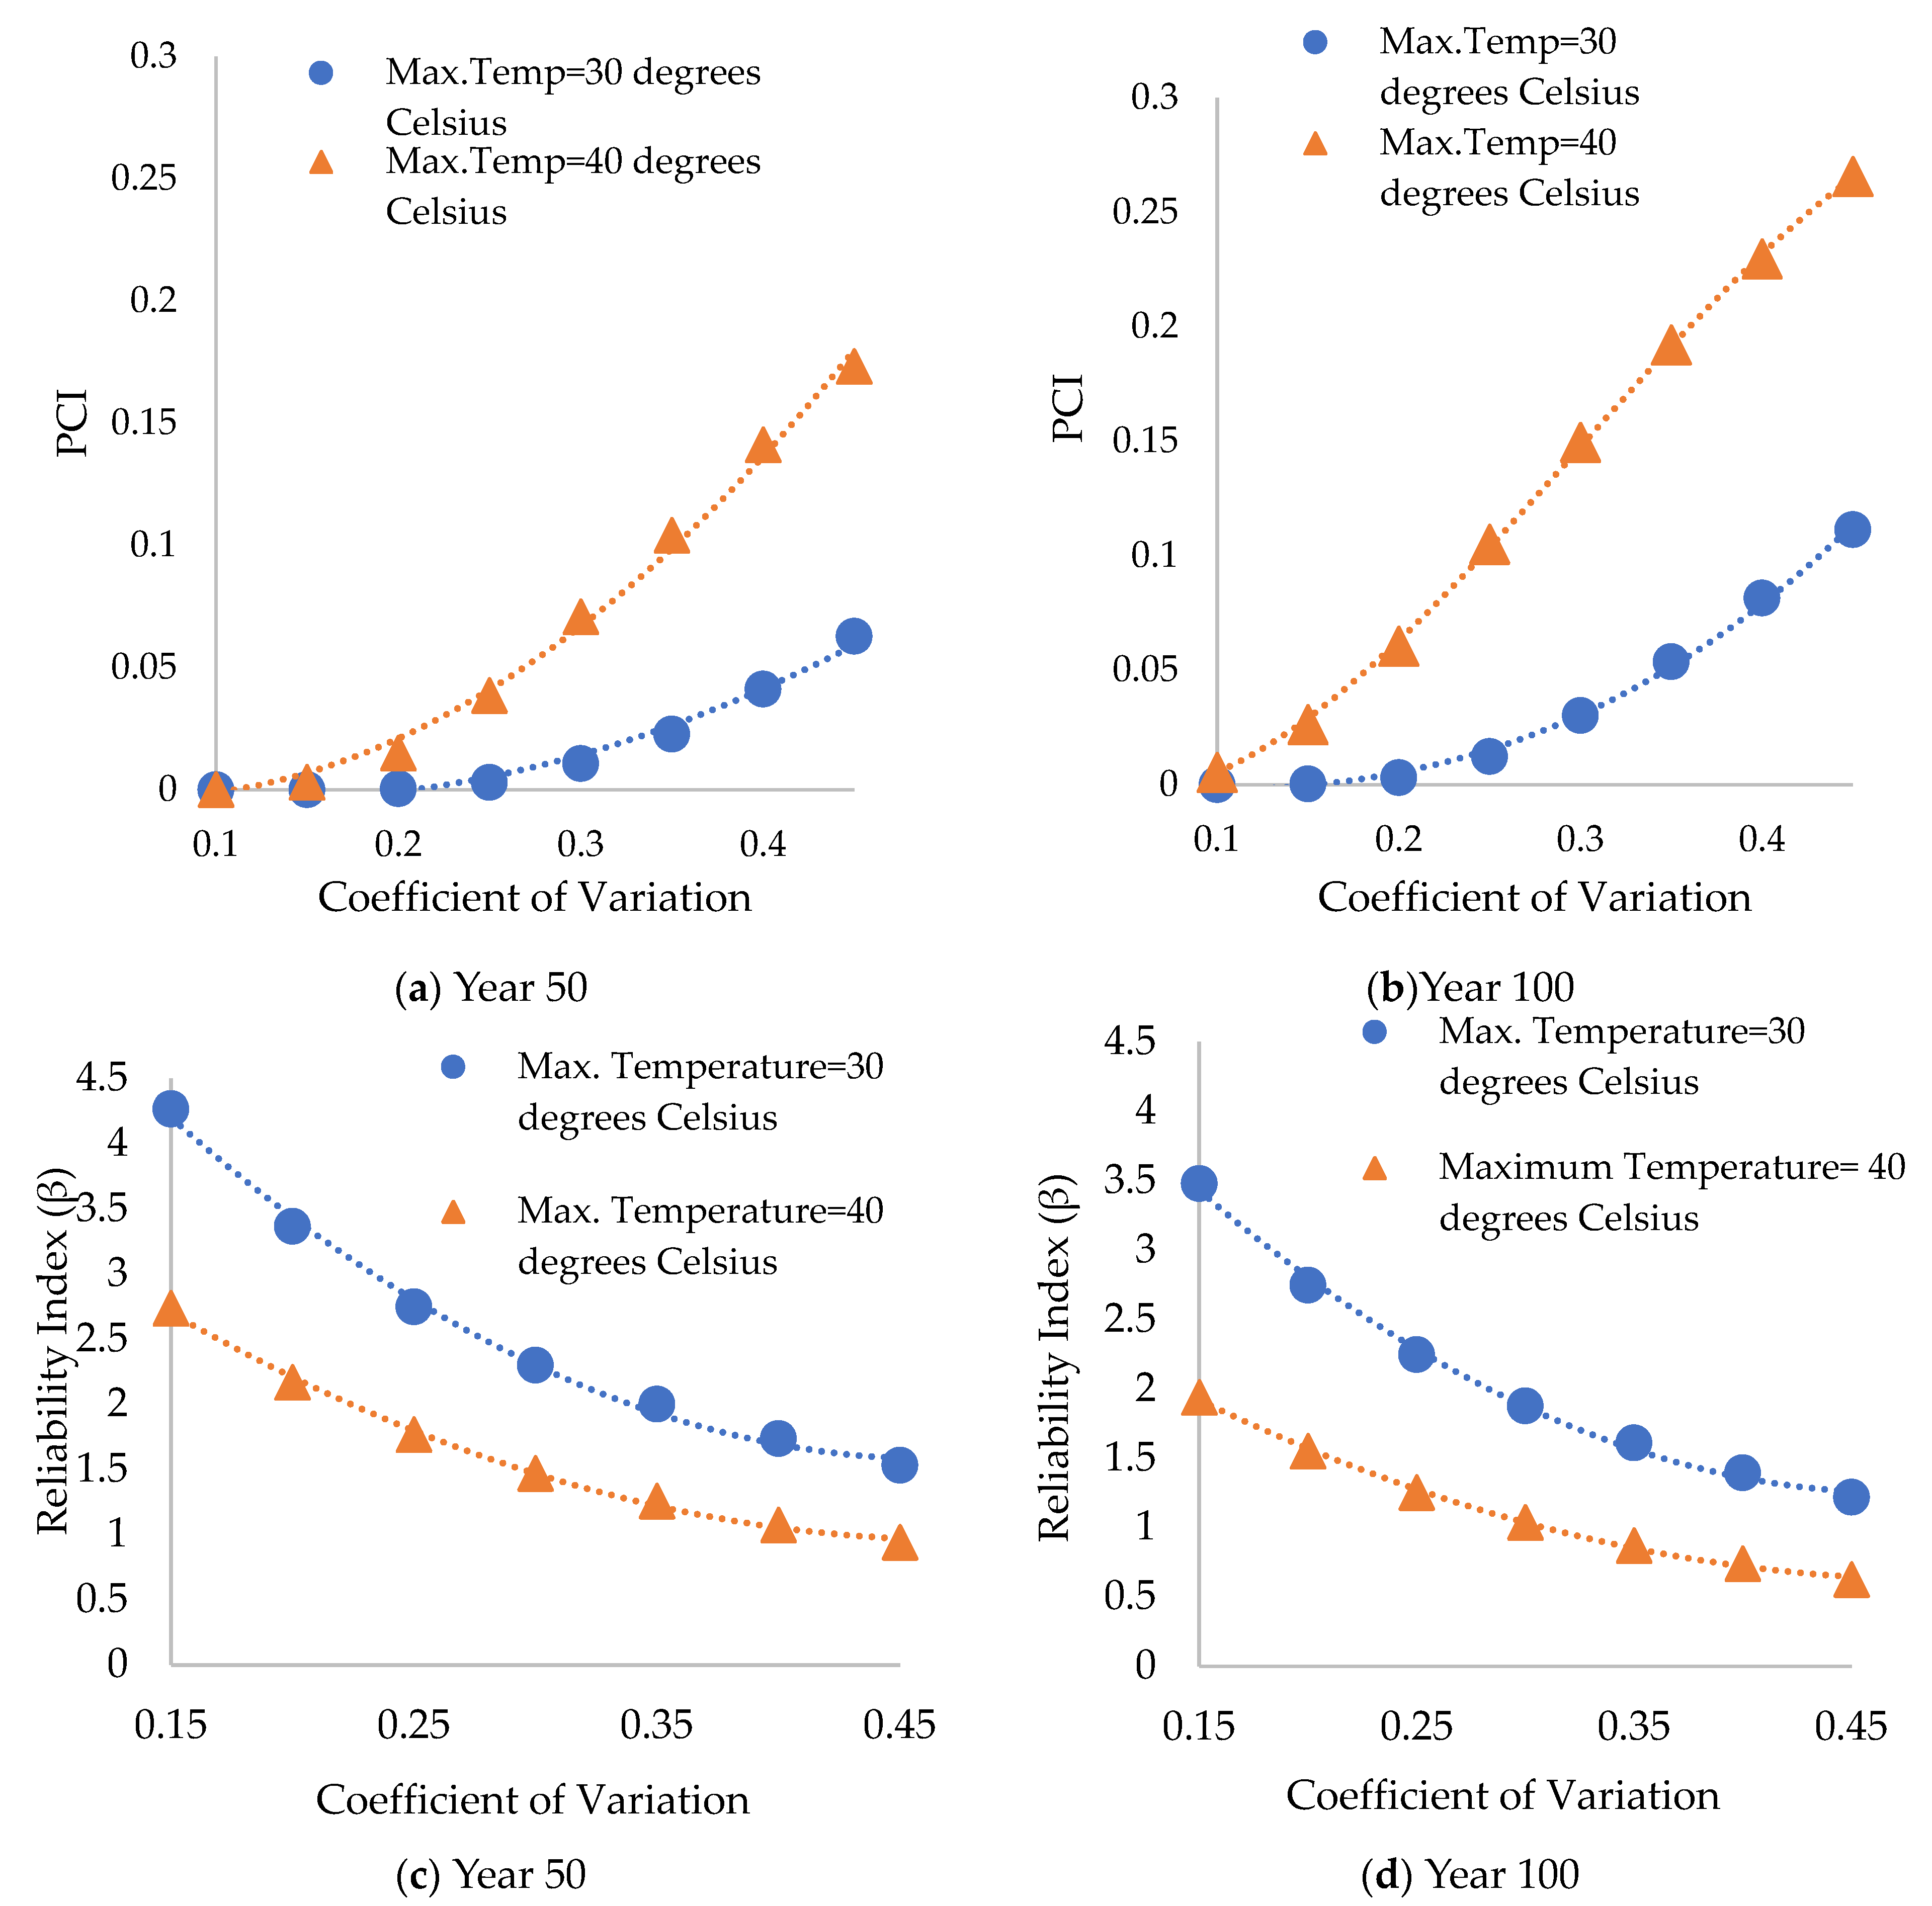
4.1. Impact of Various Coefficients of Variation for Various Concrete Cover Mean Depths on the PCI for RC Bridge Decks Made of GPC (50% FA and 50% SG)

Using a comprehensive MCS (see Section 2.2), this study analyzes the onset of chloride-induced corrosion initiation under various conditions. This included multiple concrete covers ranging from 30 to 60 mm. Moreover, the probabilistic model used in this scenario does not consider the impact of climate change, such as the maximum temperature and relative humidity, on the chloride diffusion coefficient. These simulations aimed to compare the probabilities of corrosion initiation (PCIs) under various concrete cover scenarios, including 30, 40, 50, and 60 mm, across various coefficients of variation ranging from 10% to 45% for each concrete cover and the mean chloride concentration (Co), which was held constant at 6 kg/m3 (with a coefficient of variation of 30%) to address uncertainty according to [77,78,79], as shown in Table 2. Moreover, Weyers et al. [80] delineated the corrosive environments that affect bridge decks by assigning them to four distinct classifications based on the concentration of chloride present on surfaces: light, moderate, heavy, and severe exposure. The statistical mean values of the concrete covers mentioned previously were assumed to follow a lognormal distribution function. In comparison, the chloride threshold (Cth) was established at 0.7 kg/m3 following a lognormal distribution (i.e., it varies from 0.038% to 1.17% of the weight of the binder in the GPC mixture according to Chidiac et al. [76]) (see Table 2).
By varying the variation coefficient of the concrete cover depth only (keeping the other parameters the same as those mentioned in Table 2) in the sensitivity analysis, its impact on the corrosion probability at 50 and 100 years is evaluated via the MCS, as described in Section 2.2., as shown in Figure 10. Figure 10 shows a sharp increase in the PCI, especially for concrete cover depths of 30 mm and 40 mm, when the coefficient of variation of the concrete cover depth varies from 10% to 45% in year 50 and year 100. However, the PCI values are almost constant and equal to zero and show negligible increases in the PCI for the concrete cover depths of 50 mm and 60 mm across various coefficients of variation ranging from 10% to 45% of the concrete cover depths of 50 mm and 60 mm in years 50 and 100, as shown in Figure 10. Furthermore, it was deduced that the use of concrete cover depths of 30 mm and 40 mm for RC bridge decks made of GPC consisting of 50% FA and 50% SG would lead to a high PCI in future years. Therefore, concrete covers greater than 50 mm are recommended for RC bridge decks made of GPC (50% FA and 50% SG), which leads to a low PCI due to the impact of climate change in various future years.
Key observations:
  • A concrete cover of 30 mm and 40 mm used in the RC bridge deck made of GPC (50% FA and 50% SG) led to a sharp increase in the PCI when the coefficient of variation changed from 10% to 45% for both the 30 mm and 40 mm CVs.
  • As the CV increased beyond 50 mm for the RC bridge deck made of GPC, there was a marked reduction in the PCI across various coefficients of variation for a mean CV of 50 mm, confirming the protective effect of a thicker concrete layer that can resist the impact of climate change.
This analysis highlights the significance of various concrete cover thicknesses in influencing the corresponding probabilities of chloride-induced corrosion initiation, especially for various coefficients of variation for various concrete covers, to assess whether the CV has a low significant impact on the PCI across various coefficients of variation for the specified CV. The results provide essential information for construction practices, especially in regions prone to chloride exposure.

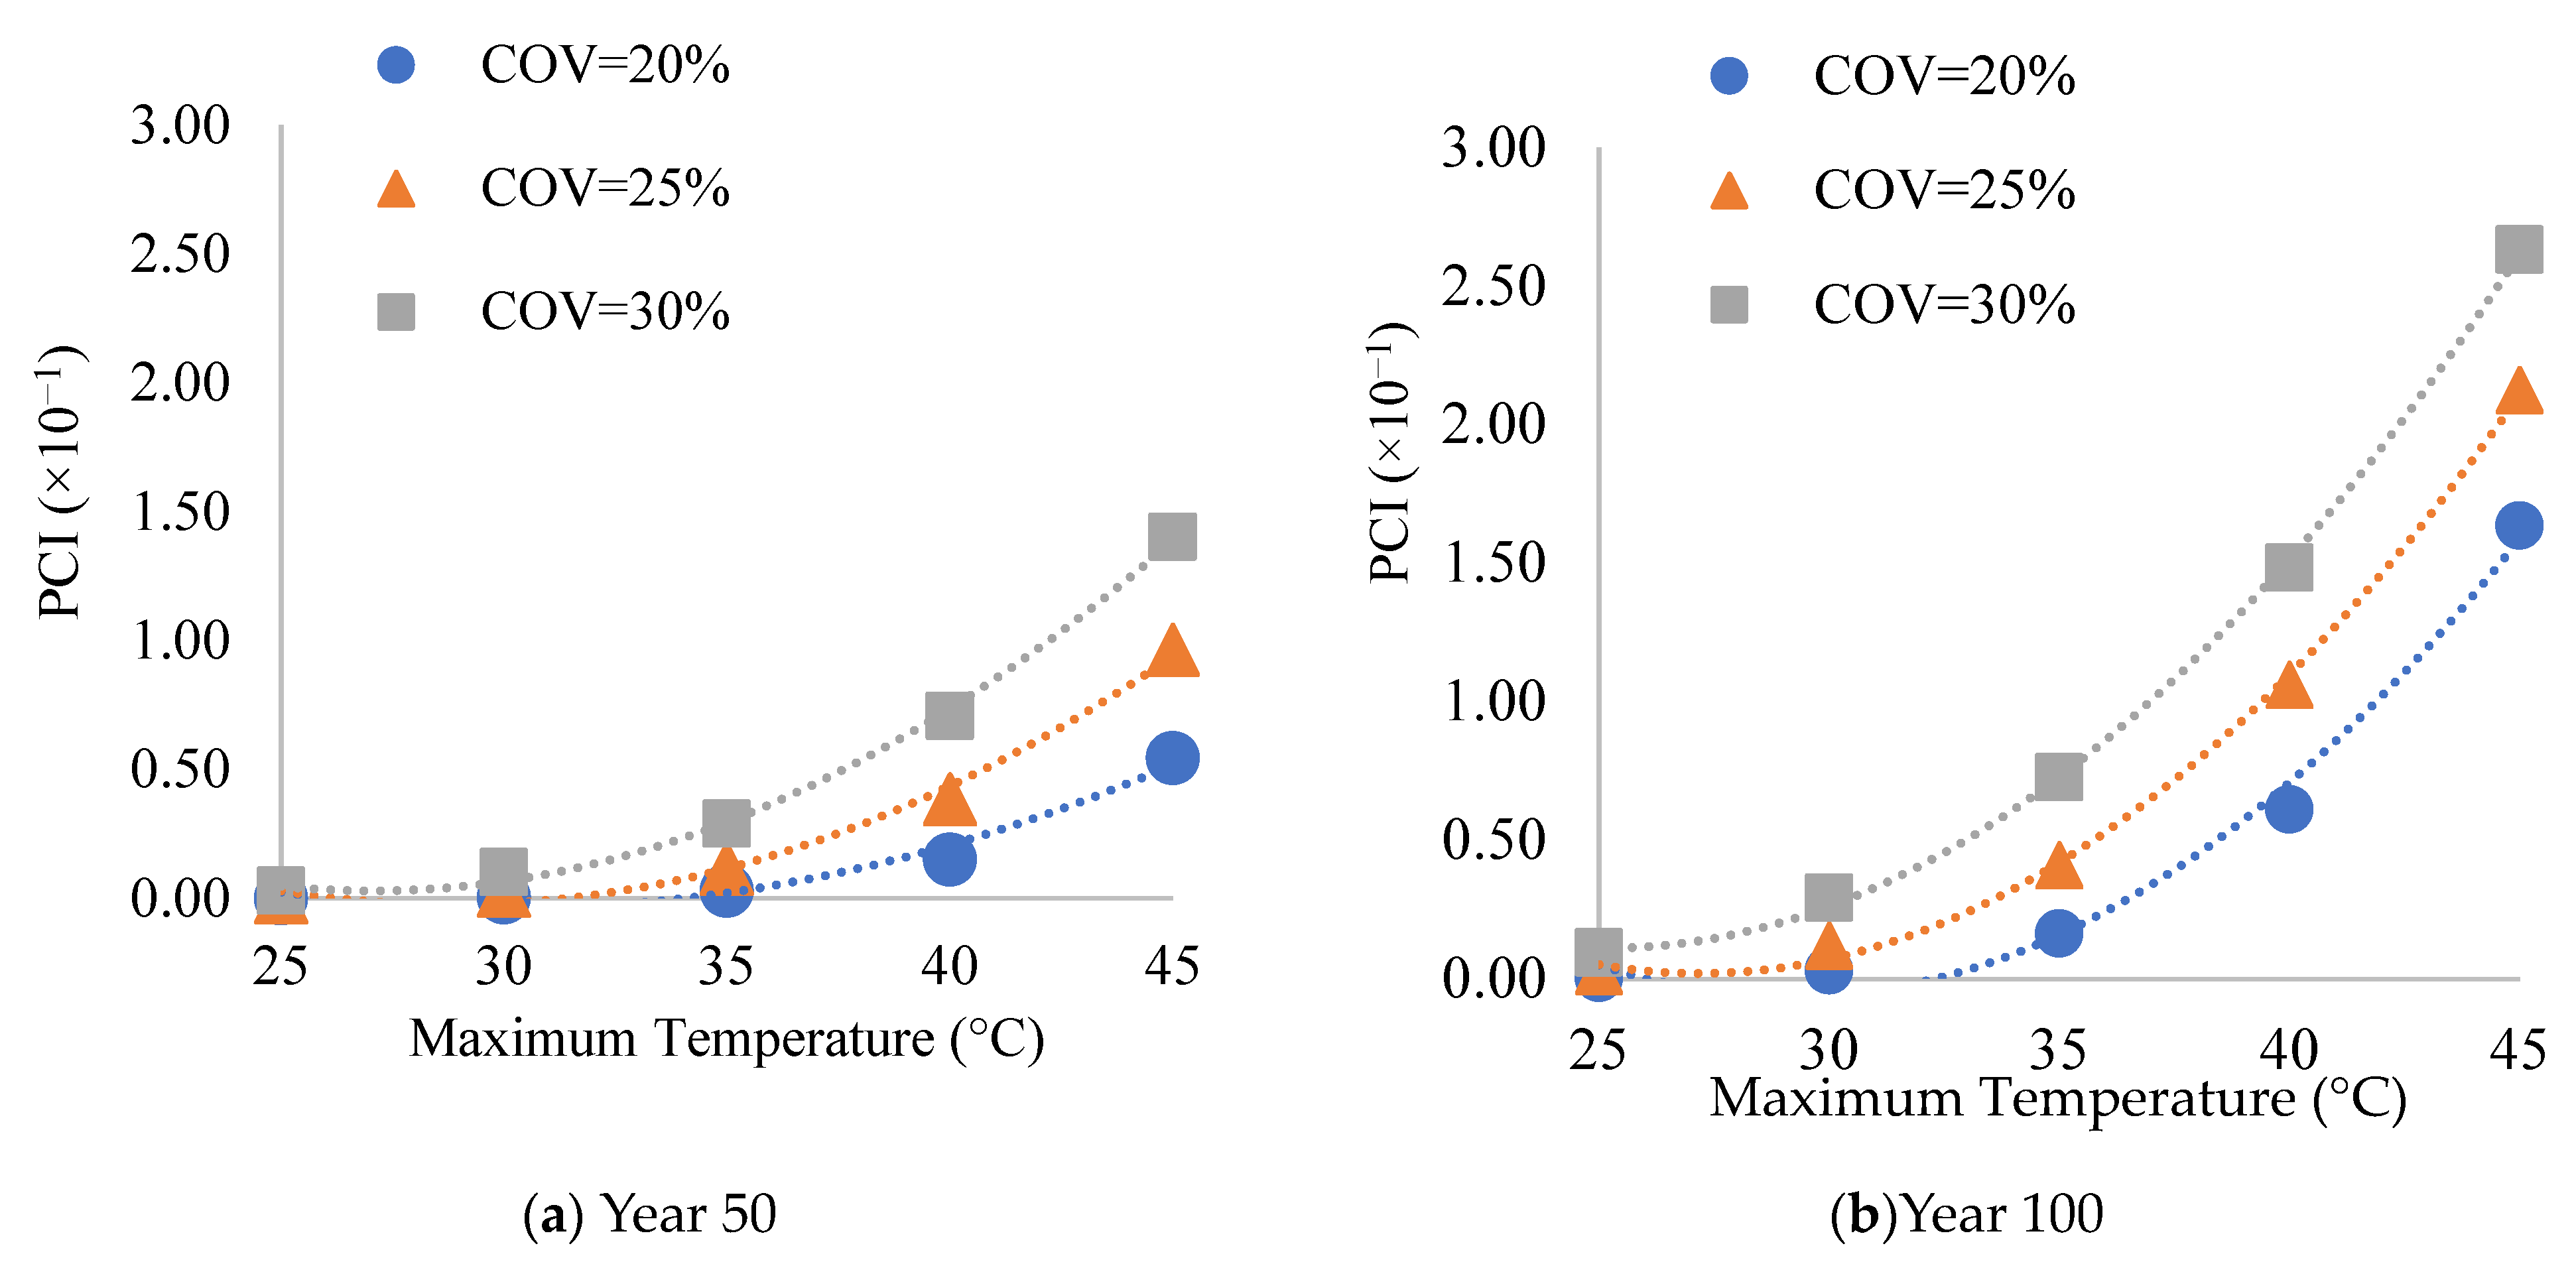
4.2. Impact of Maximum Temperature and Relative Humidity on the PCI across Diverse Concrete Covers Used in RC Bridge Decks Made of GPC

When both temperature and relative humidity are considered together, the results highlight the synergistic effect of these factors on chloride ingress and the PCI. The impact of maximum temperatures of 30 °C and 40 °C on the PCI was determined using the MCS method for each random variable defined in the limit state function for corrosion initiation due to the application of a chloride concentration with a mean value of 6 kg/m3 applied on the top part for the RC bridge deck made of GPC. Moreover, it was assumed that the RC bridge deck has a concrete cover mean value of 40 mm following a lognormal distribution with various coefficients of variation ranging from 10% to 45% for the concrete cover mean, based on sensitivity analysis, in various years, as shown in Figure 11. Furthermore, the impact of a maximum temperature of 40 °C on the chloride diffusion coefficient significantly increased the PCI from 0.03 to 0.33 and from 0.17 to 0.45 when the coefficients of variation changed from 10% to 45% for a concrete cover with a mean value of 40 mm, as shown in Figure 11a,b in years 50 and 100, respectively. In addition, the values of the reliability index (β) at various maximum temperatures when the coefficients of variation changed from 10% to 45% for a concrete cover with a mean value of 40 mm were obtained, as shown in Figure 11c,d for year 50 and year 100, respectively.
The relationship between the PCI values and the corresponding coefficient of variation is nonlinear, as illustrated in Figure 11a,b. This nonlinearity is evident from the distribution of data points along both the x-axis and y-axis. Additionally, Figure 11c,d demonstrates that the relationship between the reliability index values and the corresponding coefficient of variation also exhibits a nonlinear pattern. Polynomial functions were obtained between the PCI values and coefficients of variation ranging from 10% to 45% for a concrete cover with a mean value of 40 mm at different maximum temperatures of 30 °C and 40 °C in different years, as shown in Table 3. Table 4 shows the polynomial functions that were deduced between the RI values and the coefficients of variation ranging from 10% to 45% for a concrete cover with a mean value of 40 mm at different maximum temperatures of 30 °C and 40 °C in various years.
The impact of a maximum temperature of 40 °C on the chloride diffusion coefficient significantly increased the PCI values from 0.00014 to 0.17 and from 0.005 to 0.27 when the coefficients of variation changed from 10% to 45% for a concrete cover with a mean value of 50 mm in years 50 and 100, respectively, as shown in Figure 12a,b. Additionally, the values of the reliability index (β) at various maximum temperatures when the coefficients of variation changed from 10% to 45% for a concrete cover with a mean value of 50 mm are shown in Figure 12c,d for year 50 and year 100, respectively. Finally, the impact of the concrete cover with a mean value of 50 mm had a significantly lower impact on the PCI than that of the concrete cover with a mean value of 40 mm across various coefficients of variation for the mean concrete cover values for an RC bridge deck made of GPC consisting of 50% FA and 50% SG when the impact of the maximum temperature of 40 °C on the chloride diffusion coefficients in different years was considered.
Polynomial functions were deduced between the PCI values and the coefficients of variation ranging from 10% to 45% for a concrete cover with a mean value of 50 mm at different maximum temperatures, as shown in Table 5. Table 6 displays the polynomial equations that were deduced between the RI values and the coefficients of variation ranging from 10% to 45% for a concrete cover with a mean value of 50 mm at different maximum temperatures in various years.
The impact of maximum temperatures ranging from 25 °C to 45 °C on the PCI was investigated in this research for an RC bridge deck made of GPC consisting of 50% FA and 50% SG as a full substitution with the total amount of cement used in the concrete mix for the RC bridge deck. The PCI was developed using the MCS method described in Section 2.2 for each random variable defined in the limit state function for the corrosion initiation stage due to the application of a chloride concentration with a mean value of 6 kg/m3 on the top part of the RC bridge deck. Moreover, it was assumed that the RC bridge deck has a concrete cover mean value of 50 mm following a lognormal distribution with various coefficients of variation, including 20%, 25%, and 30% for the same mean of the concrete cover mentioned previously, based on sensitivity analysis. Figure 13 shows that the impact of a maximum temperature ranging from 25 °C to 35 °C (low emission scenario, RCP2.6) has a very low impact on the PCI across various coefficients of variation for a concrete cover mean value of 50 mm in different years. However, the influence of the maximum temperature ranging from 40 °C to 45 °C (high emission scenario, RCP8.5) has a significant effect on the PCI values across various coefficients of variation for a concrete cover mean value of 50 mm (see Figure 13) in year 50 and year 100. Finally, it was deduced that the effect of a maximum temperature of 45 °C has a severe effect on the PCI value as the coefficient of variation reaches 30% or above for a mean concrete cover of 50 mm made of GPC (50% FA and 50% SG) in both years 50 and 100 (see Figure 13).
The impact of relative humidity on the PCI for an RC bridge deck made of GPC consisting of 50% FA and 50% SG with a CV mean of 50 mm across various coefficients of variation for the same concrete cover was investigated in this research. Moreover, the influence of various relative humidities, including RH = 70% and RH = 75%, only on the PCI at 50 and 100 years (as shown in Figure 14) for the RC bridge deck made of GPC is almost constant and is equal to zero versus various coefficients of variation for a concrete cover with a mean of 50 mm (following lognormal distribution). Finally, the impact of various relative humidities on the PCI is negligible (almost equal to zero) compared with the significant impact of the maximum temperature on the PCI for the same concrete cover with a mean of 50 mm, which has various coefficients of variation in different future years.

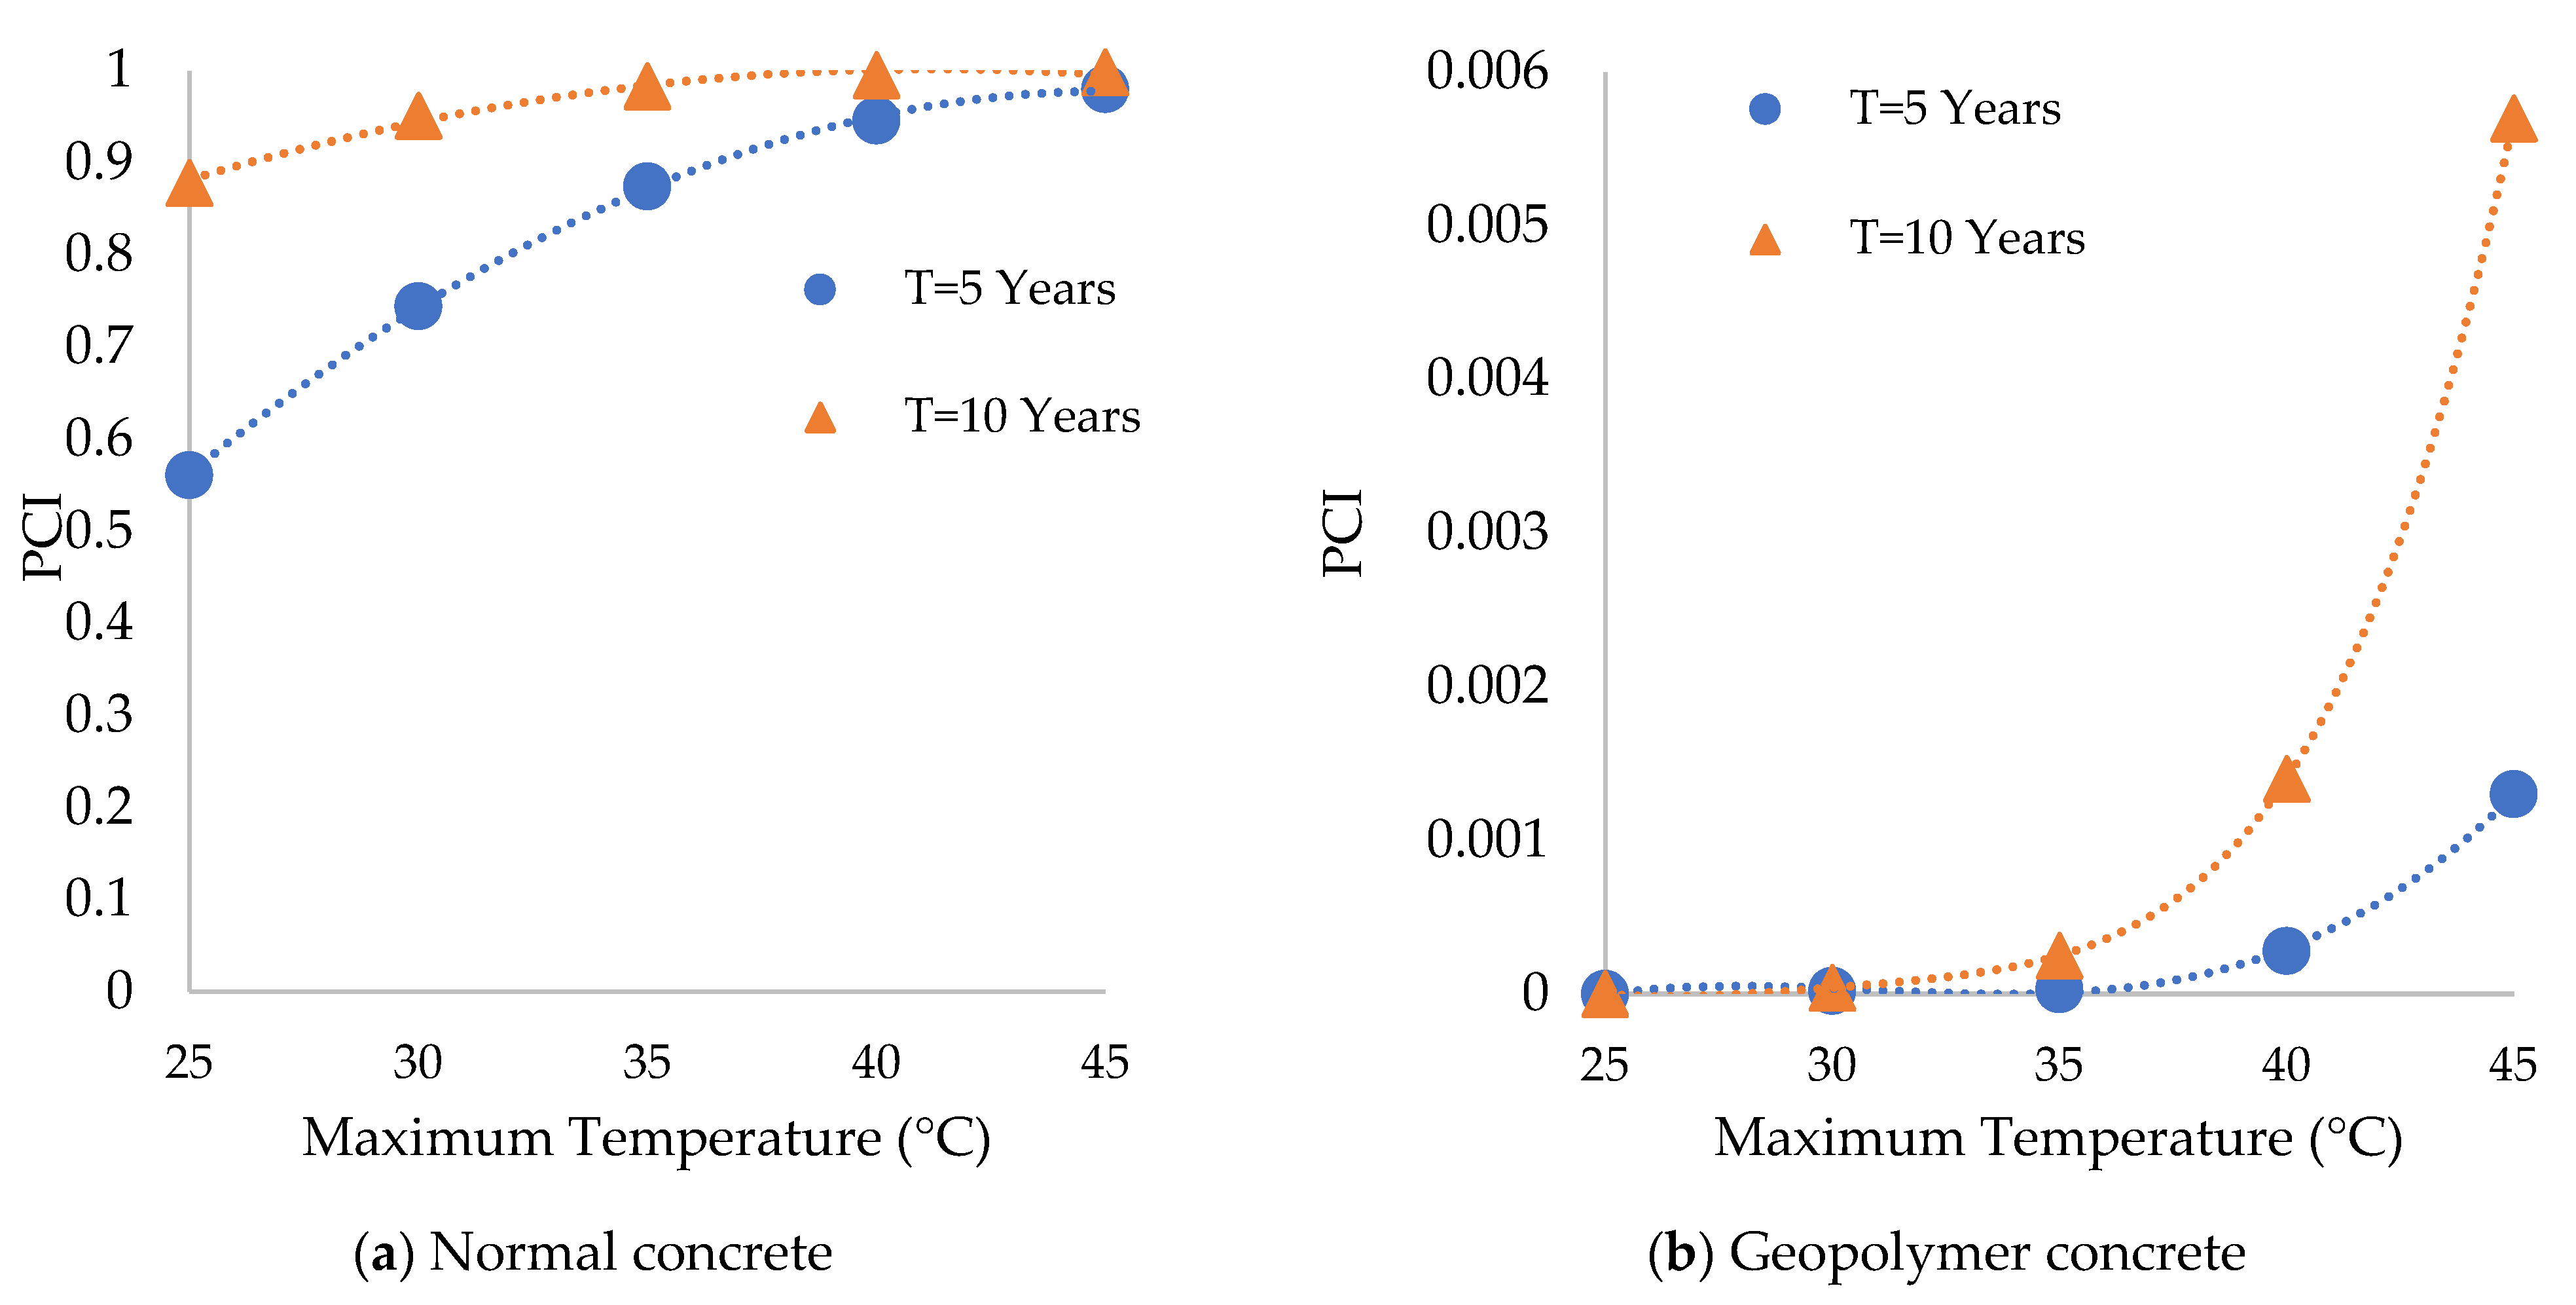
4.3. Comparison Study between the Impacts of Two Types of RC Bridge Decks Subjected to Various Mean Maximum Temperature Levels on the PCI

As detailed earlier, GPC offers superior resistance to chloride ingress due to its dense microstructure. However, the diffusion rate of chloride ions increases with temperature. The impact of maximum temperatures ranging from 25 °C to 45 °C on the PCI was investigated in this research for two RC bridge decks: the first deck was made of GPC consisting of 50% FA and 50% SG, and the second deck was made of normal concrete used in the concrete mix for the RC bridge decks. The PCI was developed using the MCS method for each random variable defined in the limit state function for the corrosion initiation stage by applying a chloride concentration with a mean value of 6 kg/m3 to the top part of the RC bridge deck. Moreover, it was assumed that the RC bridge deck has a mean concrete cover value of 50 mm, following a lognormal distribution with a coefficient of variation of 25%. Figure 15a shows that the impact of the maximum temperature ranging from 25 °C to 45 °C has a significant effect on the PCI values for the RC deck made of normal concrete in years 5 and 10. However, the influence of a maximum temperature ranging from 25 °C to 45 °C had a low impact on the PCI (which was approximately equal to zero across various mean maximum temperatures), as shown in Figure 15b for RC decks made of GPC (50% FA and 50% SG) in different years. Finally, for the top part of the RC bridge deck, which has a mean concrete cover value of 50 mm and is exposed to a mean chloride concentration of 6 kg/m3, using GPC consisting of 50% FA and 50% SG instead of normal concrete for the RC bridge deck decreases the probability of chloride-induced corrosion initiation across various mean maximum temperature values compared with that of normal concrete in various years.

5. Conclusions

This study investigated the impact of the maximum temperature because of climate change on the probability of chloride-induced corrosion initiation in RC bridge decks made of GPC. By utilizing MCSs across various representative concentration pathways (RCPs), this research provides critical insights into the consequences of rising temperatures and humidity variations on the structural integrity of RC bridges in Toronto. These findings emphasize the importance of material choice and structural design in mitigating the adverse effects of climate change. The key findings from the analysis include the following:
  • Concrete cover impact: RC bridge decks with 30 mm and 40 mm concrete covers made of GPC composed of 50% FA and 50% SG present a high risk of chloride-induced corrosion initiation when exposed to 6 kg/m3 chloride. Increasing the concrete cover to greater than 50 mm significantly reduces the PCI, highlighting the protective effect of a thicker concrete layer against climate change impacts.
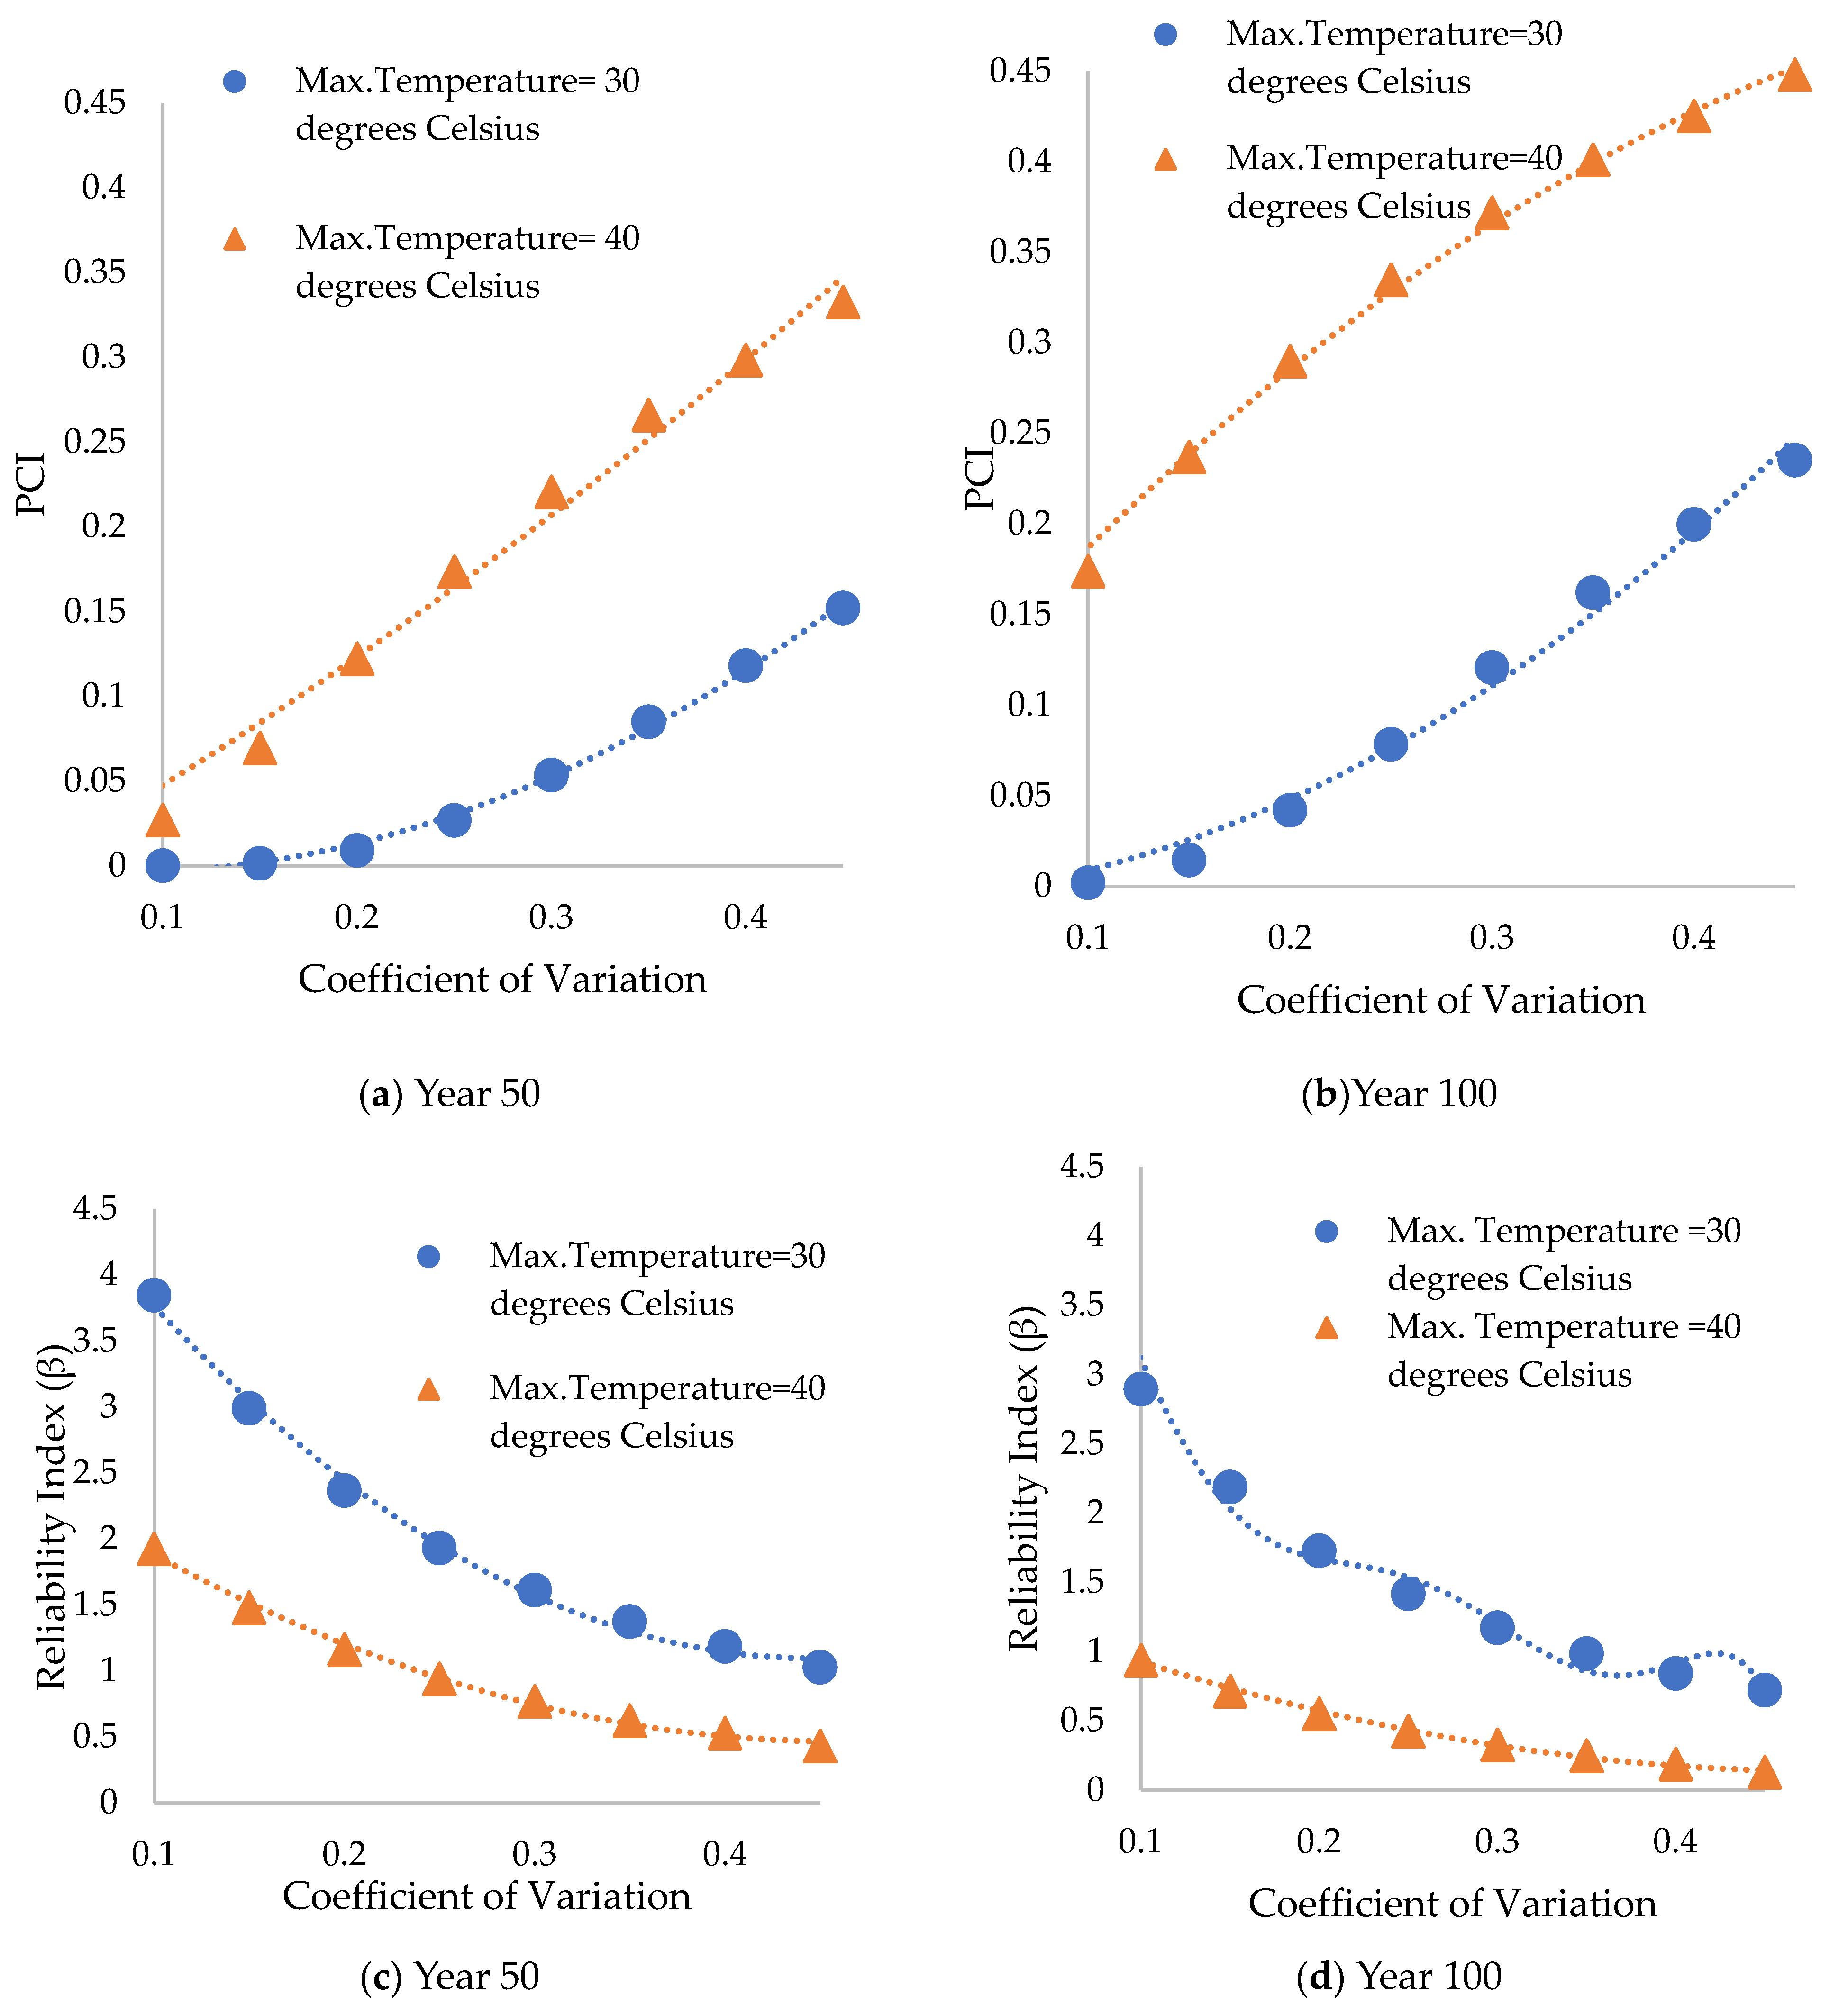
  • Temperature influence: The study demonstrated that maximum temperatures ranging from 40 °C to 45 °C, representing a high-emission scenario (RCP8.5), sharply increased the PCI values compared with temperatures between 25 °C and 35 °C (low-emission scenario, RCP2.6). For a concrete cover of 50 mm, the high-temperature scenario has a severe impact on the PCI, especially when the coefficient of variation for the concrete cover exceeds 30%. The impact of a maximum temperature of 40 °C on the chloride diffusion coefficient significantly increased the PCI from 3% to 33% and from 17% to 45% when the coefficients of variation changed from 10% to 45% for a mean concrete cover of 40 mm in years 50 and 100, respectively. Similarly, the PCI values also increased significantly from 0.014% to 17% and from 0.5% to 27% when the coefficients of variation changed from 10% to 45% for a mean concrete cover value of 50 mm in years 50 and 100, respectively.
  • Geopolymer Concrete Benefits: This research confirmed that the use of GPC composed of 50% FA and 50% SG significantly inhibited chloride-induced corrosion initiation compared with that of normal concrete at various maximum temperatures. These findings underscore the potential of GPC as a sustainable and durable alternative to traditional Portland cement concrete.
  • Relative humidity impact: The influence of relative humidity on the PCI is negligible compared with the significant impact of the maximum temperature. RH values of 70% and 75% have minimal effects on the PCI for a concrete cover of 50 mm.
  • Polynomial equations: This study provides polynomial equations for predicting the PCI and reliability index (RI) across various coefficients of variation for concrete covers of 40 mm and 50 mm at different maximum temperatures. These equations serve as valuable tools for assessing the risk of chloride-induced corrosion under various climate conditions.
Based on these findings, this study recommends increasing the concrete cover to at least 50 mm for new and existing RC bridge decks made of GPC in Toronto. This measure will increase the resistance of RC structures to the effects of rising maximum temperatures and chloride penetration in the future. Additionally, the adoption of GPC in construction practices should be considered to improve the sustainability and durability of urban infrastructure.
Future research should explore long-term field studies and the development of new materials to further enhance the resilience of infrastructure to climate change. Additionally, investigating the combined effects of other environmental stressors, such as freeze-thaw cycles and sulfate attack, on chloride-induced corrosion in GPC will provide a more comprehensive understanding of durability challenges and solutions.
This research highlights using geopolymer concrete composed of 50% fly ash and 50% slag in the concrete mix as a sustainable (eco-friendly) material instead of using ordinary Portland cement concrete for the RC bridge deck subjected to the impact of projected maximum temperature in the future for Toronto City. This manuscript contributes significantly by its achieved goals towards the aims of this prestigious journal. This research serves as a wake-up call for engineers, urban planners, and policymakers in Toronto and beyond. There is an urgent need to recalibrate construction standards, material choices, and maintenance regimes in alignment with insights from such studies. The intersection of climate change, material science, and urban infrastructure demands a multidisciplinary approach, and this manuscript contributes significantly to this ongoing journey.

Author Contributions

Conceptualization, L.A. and M.H.; methodology, L.A. and M.H.; validation, M.H. and L.A.; formal analysis, M.H.; investigation, M.H.; resources, L.A.; data curation, M.H. and L.H.; writing—original draft preparation, M.H.; writing—review and editing, L.A. and L.H.; visualization, L.A.; supervision, L.A.; project administration, L.A. and L.H.; funding acquisition, L.A. All authors have read and agreed to the published version of the manuscript.

Funding

This project was funded by the National Research Council of Canada under the Methodologies and Guidelines for Design and Evaluation of Highway Bridge in a Changing Climate Project managed by NRC (121491807RP0457).

Data Availability Statement

The authors confirm that the data supporting the findings of this study are available within the article. However, additional data can be provided upon reasonable request.

Conflicts of Interest

The authors declare that they have no conflicts of interest. The funders had no role in the design of the study; in the collection, analyses, or interpretation of data; in the writing of the manuscript; or in the decision to publish the results.

References

  1. Uhlig, H. Corrosion, and Corrosion Control; John Wiley & Sons Inc.: Hoboken, NJ, USA, 1963; Volume 67. [Google Scholar] [CrossRef]
  2. Hansson, C.M. An introduction to corrosion of engineering materials. In Corrosion of Steel in Concrete; Elsevier: Amsterdam, The Netherlands, 2016. [Google Scholar] [CrossRef]
  3. Revie, R.W.; Uhlig, H.H. Corrosion, and Corrosion Control: An Introduction to Corrosion Science and Engineering; John Wiley & Sons: Hoboken, NJ, USA, 2008; ISBN 9780470277270. [Google Scholar] [CrossRef]
  4. Mehta, P.K.; Monteiro, P.J.M. Concrete Microstructure, Properties and Materials; McGraw Hill Professional: New York, NY, USA, 2006; Volume 10, pp. 177–178. [Google Scholar]
  5. Qu, F.; Zhang, J.; Liu, G.; Zhao, S. Experimental Study on Chloride Ion Diffusion in Concrete Affected by Exposure Conditions. Materials 2022, 15, 2917. [Google Scholar] [CrossRef] [PubMed]
  6. Bier, T.; Kropp, J.; Hilsdorf, H. Formation of silica gel during carbonation of cementitious systems containing slag cement. In Proceedings of the 3rd International Conference Fly Ash, Silica Fume, Slag and Natural Pozzolans in Concrete, Trondheim, Norway, 18–23 June 1989; American Concrete Institute: Farmington Hills, MI, USA, 1989. [Google Scholar]
  7. Balestra, C.E.T.; Reichert, T.A.; Pansera, W.A.; Savaris, G. Evaluation of chloride ion penetration through concrete surface electrical resistivity of field naturally degraded structures present in marine environment. Constr. Build. Mater. 2020, 230, 116979. [Google Scholar] [CrossRef]
  8. Han, B.; Song, Z.; Zhang, J.; Xie, H.; Yan, W.; Liu, Y.; Yu, J. Coupled Effect of Chloride Corrosion and Repeated Uniaxial Compressive Loading on Unsaturated Concrete. Materials 2023, 16, 2947. [Google Scholar] [CrossRef] [PubMed]
  9. Tuutti, K. Corrosion of Steel in Concrete. Ph.D. Thesis, Division of Building Materials, Swedish Cement and Concrete Research Institute, Stockholm, Sweden, 1982; p. 469. [Google Scholar]
  10. López, W.; González, J. Influence of the degree of pore saturation on the resistivity of concrete and the corrosion rate of steel reinforcement. Cem. Concr. Res. 1993, 23, 368–376. [Google Scholar] [CrossRef]
  11. Andrade, C.; Alonso, C. Durability design based on models for corrosion rates. In The Modelling of Microstructure and Its Potential for Studying Transport Properties and Durability; Springer: Dordrecht, The Netherlands, 1996; pp. 473–492. [Google Scholar]
  12. Al-Sulaimani, G.J.; Kaleemullah, M.; Basunbul, I.A.; Rasheeduzzafar. Influence of Corrosion and Cracking on Bond Behavior and Strength of Reinforced Concrete Members. ACI Struct. J. 1990, 87, 220–231. [Google Scholar] [CrossRef]
  13. Cabrera, J.G.; Ghoddoussi, P. The Effect of Reinforcement Corrosion on the Strength of the Steel/Concrete Bond. In Proceedings of the International Conference Bond in Concrete from Research to Practice: Proceedings Topics, Riga, Latvia, 15–17 October 1992; CEB: Mumbai, India, 2001; pp. 11–24. [Google Scholar]
  14. Amleh, L.; Mirza, S. Corrosion Influence on Bond between Steel and Concrete. ACI Struct. J. 1999, 96, 415–423. [Google Scholar] [CrossRef]
  15. Amleh, L.; Ghosh, A. Modeling the effect of corrosion on bond strength at the steel–concrete interface with finite-element analysis. Can. J. Civ. Eng. 2006, 33, 673–682. [Google Scholar] [CrossRef]
  16. Ramani, V.; Zhang, L. Impacts of climate change on long-term reliability of reinforced concrete structures due to chloride ingress. Constr. Build. Mater. 2022, 354, 129091. [Google Scholar] [CrossRef]
  17. De Medeiros-Junior, R.A.; de Lima, M.G.; de Medeiros, M.H.F. Service life of concrete structures considering the effects of temperature and relative humidity on chloride transport. Environ. Dev. Sustain. 2014, 17, 1103–1119. [Google Scholar] [CrossRef]
  18. Gao, X.-J.; Wang, X.-Y. Impacts of Global Warming and Sea Level Rise on Service Life of Chloride-Exposed Concrete Structures. Sustainability 2017, 9, 460. [Google Scholar] [CrossRef]
  19. Lothenbach, B.; Scrivener, K.; Hooton, R. Supplementary cementitious materials. Cem. Concr. Res. 2011, 41, 1244–1256. [Google Scholar] [CrossRef]
  20. Thomas, M.; Hooton, R.; Scott, A.; Zibara, H. The effect of supplementary cementitious materials on chloride binding in hardened cement paste. Cem. Concr. Res. 2012, 42, 1–7. [Google Scholar] [CrossRef]
  21. Core Writing Team; Pachauri, R.K.; Reisinger, A. (Eds.) IPCC, (2007): Climate Change 2007: Synthesis Report, Contribution of Working Groups I, II, and III to the Fourth Assessment Report of the Intergovernmental Panel on Climate Change; IPCC: Geneva, Switzerland, 2007; ISBN 92-9169-122-4. Available online: https://www.ipcc.ch/site/assets/uploads/2018/02/ar4_syr_full_report.pdf (accessed on 31 August 2023).
  22. Andrade, C.; Castillo, A. Evolution of reinforcement corrosion due to climatic variations. Mater. Corros. 2003, 54, 379–386. [Google Scholar] [CrossRef]
  23. Yuan, Y.; Jiang, J. Prediction of temperature response in concrete in a natural climate environment. Constr. Build. Mater. 2011, 25, 3159–3167. [Google Scholar] [CrossRef]
  24. Models for Environmental Actions on Concrete Structures: DuraCrete, Probabilistic Performance Based Durability Design of Concrete Structures, 1st ed. The European Union-Brite EuRam III; Europe. 1999. Available online: https://lib.ugent.be/catalog/rug01:001386858 (accessed on 24 July 2024).
  25. Bastidas-Arteaga, E.; Chateauneuf, A.; Sánchez-Silva, M.; Bressolette, P.; Schoefs, F. Influence of weather and global warming in chloride ingress into concrete: A stochastic approach. Struct. Saf. 2010, 32, 238–249. [Google Scholar] [CrossRef]
  26. Yuan, Q.; Shi, C.; De Schutter, G.; Audenaert, K. Effect of temperature on the transport of chloride ions in concrete. In Concrete Repair, Rehabilitation and Retrofitting II; CRC Press: Boca Raton, FL, USA, 2008; pp. 159–160. [Google Scholar]
  27. Saetta, A.V.; Scotta, R.V.; Vitaliani, R.V. Analysis of chloride diffusion into partially saturated concrete. ACI Mater. J. 1993, 90, 441–451. [Google Scholar]
  28. Zhang, J.; Gao, Y.; Han, Y. Interior Humidity of Concrete under Dry-Wet Cycles. J. Mater. Civ. Eng. 2012, 24, 289–298. [Google Scholar] [CrossRef]
  29. Ali, M.S.; and Mirza, M.S. Impact of Climate Change on Civil Infrastructure—A State-of-the-Art Review. In Proceedings of the EIC Climate Change Technology Conference 2015, Montreal, QC, Canada, 25–27 May 2015. [Google Scholar]
  30. Core Writing Team; Pachauri, R.K.; Meyer, L. (Eds.) IPCC 2014: Climate Change 2014: Synthesis Report, Contribution of Working Groups I, II, and III to the Fifth Assessment Report of the Intergovernmental Panel on Climate Change; IPCC: Geneva, Switzerland, 2015; Available online: https://epic.awi.de/id/eprint/37530/1/IPCC_AR5_SYR_Final.pdf (accessed on 31 August 2023)ISBN 978-92-9169-143-2.
  31. Saassouh, B.; Lounis, Z. Probabilistic modeling of chloride-induced corrosion in concrete structures using first- and second-order reliability methods. Cem. Concr. Compos. 2012, 34, 1082–1093. [Google Scholar] [CrossRef]
  32. Singh, N.; Middendorf, B. Geopolymers as an alternative to Portland cement: An overview. Constr. Build. Mater. 2020, 237, 117455. [Google Scholar] [CrossRef]
  33. Kakria, K.; Thirumalini, S.; Secco, M.; Priya, T.S. A novel approach for the development of sustainable hybridized geopolymer mortar from waste printed circuit boards. Resour. Conserv. Recycl. 2020, 163, 105066. [Google Scholar] [CrossRef]
  34. Shah, S.N.; Mo, K.H.; Yap, S.P.; Yang, J.; Ling, T.-C. Lightweight foamed concrete as a promising avenue for incorporating waste materials: A review. Resour. Conserv. Recycl. 2020, 164, 105103. [Google Scholar] [CrossRef]
  35. Amran, Y.M.; Alyousef, R.; Alabduljabbar, H.; El-Zeadani, M. Clean production and properties of geopolymer concrete; A review. J. Clean. Prod. 2020, 251, 119679. [Google Scholar] [CrossRef]
  36. Xu, G.; Shi, X. Characteristics and applications of fly ash as a sustainable construction material: A state-of-the-art review. Resour. Conserv. Recycl. 2018, 136, 95–109. [Google Scholar] [CrossRef]
  37. Rajamane, N.P.; Nataraja, M.C.; Jeyalakshmi, R.; Nithiyanantham, S. Greener durable concretes through geopolymerisation of blast furnace slag. Mater. Res. Express 2015, 2, 055502. [Google Scholar] [CrossRef]
  38. Wasim, M.; Roychand, R.; Barnes, R.T.; Talevski, J.; Law, D.; Li, J.; Saberian, M. Performance of Reinforced Foam and Geopolymer Concretes against Prolonged Exposures to Chloride in a Normal Environment. Materials 2023, 16, 149. [Google Scholar] [CrossRef] [PubMed]
  39. Yip, C.K.; Lukey, G.C.; Van Deventer, J.S.J. The coexistence of geopolymeric gel and calcium silicate hydrate at the early stage of alkaline activation. Cem. Concr. Res. 2005, 35, 1688–1697. [Google Scholar] [CrossRef]
  40. Amran, M.; Debbarma, S.; Ozbakkaloglu, T. Fly ash-based eco-friendly geopolymer concrete: A critical review of the long-term durability properties. Constr. Build. Mater. 2021, 270, 121857. [Google Scholar] [CrossRef]
  41. Meesala, C.R.; Verma, N.K.; Kumar, S. Critical review on fly-ash based geopolymer concrete. Struct. Concr. 2019, 21, 1013–1028. [Google Scholar] [CrossRef]
  42. Oyebisi, S.; Olutoge, F.; Kathirvel, P.; Oyaotuderekumor, I.; Lawanson, D.; Nwani, J.; Ede, A.; Kaze, R. Sustainability assessment of geopolymer concrete synthesized by slag and corncob ash. Case Stud. Constr. Mater. 2022, 17, e01665. [Google Scholar] [CrossRef]
  43. Shehata, N.; Mohamed, O.; Sayed, E.T.; Abdelkareem, M.A.; Olabi, A. Geopolymer concrete as green building materials: Recent applications, sustainable development and circular economy potentials. Sci. Total. Environ. 2022, 836, 155577. [Google Scholar] [CrossRef]
  44. Sherwani, A.F.H.; Younis, K.H.; Arndt, R.W.; Pilakoutas, K. Performance of Self-Compacted Geopolymer Concrete Containing Fly Ash and Slag as Binders. Sustainability 2022, 14, 15063. [Google Scholar] [CrossRef]
  45. Nagaraju, T.V.; Bahrami, A.; Azab, M.; Naskar, S. Development of sustainable high-performance geopolymer concrete and mortar using agricultural biomass—A strength performance and sustainability analysis. Front. Mater. 2023, 10, 1128095. [Google Scholar] [CrossRef]
  46. Manzoor, T.; Bhat, J.A.; Shah, A.H. Performance of geopolymer concrete at elevated temperature—A critical review. Constr. Build. Mater. 2024, 420, 135578. [Google Scholar] [CrossRef]
  47. Özkılıç, Y.O.; Çelik, A.I.; Tunç, U.; Karalar, M.; Deifalla, A.; Alomayri, T.; Althoey, F. The use of crushed recycled glass for alkali activated fly ash based geopolymer concrete and prediction of its capacity. J. Mater. Res. Technol. 2023, 24, 8267–8281. [Google Scholar] [CrossRef]
  48. Çelik, A.I.; Özkılıç, Y.O.; Bahrami, A.; Hakeem, I.Y. Mechanical performance of geopolymer concrete with micro silica fume and waste steel lathe scraps. Case Stud. Constr. Mater. 2023, 19, e02548. [Google Scholar] [CrossRef]
  49. Acar, M.C.; Çelik, A.I.; Kayabaşı, R.; Şener, A.; Özdöner, N.; Özkılıç, Y.O. Production of perlite-based-aerated geopolymer using hydrogen peroxide as eco-friendly material for energy-efficient buildings. J. Mater. Res. Technol. 2023, 24, 81–99. [Google Scholar] [CrossRef]
  50. Tennakoon, C.; Shayan, A.; Sanjayan, J.G.; Xu, A. Chloride ingress and steel corrosion in geopolymer concrete based on long term tests. Mater. Des. 2017, 116, 287–299. [Google Scholar] [CrossRef]
  51. Kayali, O.; Khan, M.; Ahmed, M.S. The role of hydrotalcite in chloride binding and corrosion protection in concretes with ground granulated blast furnace slag. Cem. Concr. Compos. 2012, 34, 936–945. [Google Scholar] [CrossRef]
  52. Provis, J.L.; Myers, R.J.; White, C.E.; Rose, V.; van Deventer, J.S. X-ray microtomography shows pore structure and tortuosity in alkali-activated binders. Cem. Concr. Res. 2012, 42, 855–864. [Google Scholar] [CrossRef]
  53. Odler, I. Hydration, setting, and hardening of Portland cement. In Lea’s Chemistry of Cement and Concrete; Elsevier: Amsterdam, The Netherlands, 1998; pp. 241–291. [Google Scholar]
  54. Neville, A.M. Durability of concrete. In Properties of Concrete, 5th ed.; Prentice Hall: Hoboken, NJ, USA, 1996; pp. 1350–1450. [Google Scholar]
  55. Leng, F.; Feng, N.; Lu, X. An experimental study on the properties of resistance to diffusion of chloride ions of fly ash and blast furnace slag concrete. Cem. Concr. Res. 2000, 30, 989–992. [Google Scholar] [CrossRef]
  56. Sasui, S.; Kim, G.; Nam, J.; Koyama, T.; Chansomsak, S. Strength and Microstructure of Class-C Fly Ash and GGBS Blend Geopolymer Activated in NaOH & NaOH+ Na2SiO3. Materials 2020, 13, 59. [Google Scholar] [CrossRef]
  57. Bush, E.; Lemmen, D.S. (Eds.) Canada Changing Climate Report; Government of Canada: Ottawa, ON, Canada, 2019.
  58. Alinaghimaddah, S.; Shayanfar, M.A.; Bagha, M.G. Effect of distance from the sea on reinforced concrete chloride corrosion probability. AUT J. Civ. Eng. 2020, 4, 199–208. [Google Scholar] [CrossRef]
  59. Hasan, M.; Amleh, L.; Othman, H. Effect of different cement content and water cement ratio on carbonation depth and probability of carbonation induced corrosion for concrete. Cem. Wapno Beton 2022, 27, 126–143. [Google Scholar] [CrossRef]
  60. Hassan, M.; Amleh, L. Influence of Climate Change on Probability of Carbonation-Induced Corrosion Initiation. Period. Polytech. Civ. Eng. 2023, 68, 57–67. [Google Scholar] [CrossRef]
  61. Kroese, D.P.; Brereton, T.; Taimre, T.; Botev, Z.I. Why the Monte Carlo method is so important today. WIREs Comput. Stat. 2014, 6, 386–392. [Google Scholar] [CrossRef]
  62. Choi, S.K.; Grandhi, R.V.; Canfield, R.A. Reliability-Based Structural Design; Springer: New York, NY, USA, 2007. [Google Scholar]
  63. Sobol, I.M. A Primer for the Monte Carlo Method; CRC Press: Boca Raton, FL, USA, 1994. [Google Scholar]
  64. Kalos, M.H.; Whitlock, P.A. Monte Carlo Methods, 2nd ed.; John Wiley and Sons: New York, NY, USA, 2008. [Google Scholar]
  65. Neville, A. Chloride attack of reinforced concrete: An overview. Mater. Struct. 1995, 28, 63–70. [Google Scholar] [CrossRef]
  66. Cady, P.; Weyers, R. Chloride Penetration and the Deterioration of Concrete Bridge Decks. Cem. Concr. Aggregates 1983, 5, 81–87. [Google Scholar] [CrossRef]
  67. Costa, A.; Appleton, J. Chloride penetration into concrete in marine environment—Part I: Main parameters affecting chloride penetration. Mater. Struct. 1999, 32, 252–259. [Google Scholar] [CrossRef]
  68. Tongaria, K.; Mandal, S.; Mohan, D. A Review on Carbonation of Concrete and Its Prediction Modelling. J. Environ. Nanotechnol. 2018, 7, 75–90. [Google Scholar] [CrossRef]
  69. Baccay, M.A.; Otsuki, N.; Nishida, T.; Maruyama, S. Influence of Cement Type and Temperature on the Rate of Corrosion of Steel in Concrete Exposed to Carbonation. Corrosion 2006, 62, 811–821. [Google Scholar] [CrossRef]
  70. DuraCrete. Statistical quantification of the variables in the limit state functions. Contract BRPR-CT95-0132. Project BE95-1347/R9. 2000. Available online: https://www.scirp.org/reference/referencespapers?referenceid=766310 (accessed on 24 July 2024).
  71. Page, C.; Short, N.; El Tarras, A. Diffusion of chloride ions in hardened cement pastes. Cem. Concr. Res. 1981, 11, 395–406. [Google Scholar] [CrossRef]
  72. Bažant, Z.; Najjar, L. Drying of concrete as a nonlinear diffusion problem. Cem. Concr. Res. 1971, 1, 461–473. [Google Scholar] [CrossRef]
  73. Nowak, A.S. Calibration of LRFD Bridge Design Code. National Cooperative Highway Research Program; NCHRP Report 368; Transportation Research Board: Washington, DC, USA, 1999. [Google Scholar]
  74. Benjamin, J.R.; and Cornell, C.A. Probability, Statistics, and Decision for Civil Engineers; McGraw-Hill: New York, NY, USA, 1970. [Google Scholar]
  75. Lounis, Z.; Saassouh, B.; Zhang, J. Probability-Based Modeling of Chloride-Induced Corrosion in Concrete Structures Including Parameters Correlation. In Proceedings of the Applications of Statistics and Probability in Civil Engineering, NRCC-53612 1206-1212, Zurich, Switzerland, 1–4 August 2011; National Research Council Canada: Ottawa, ON, Canada, 2011. [Google Scholar]
  76. Chidiac, T.J.; Ukrainczyk, N.; Prentice, D.P.; Provis, J.L. Probabilistic Service Life Prediction of Alkali Activated Concretes Exposed to Chloride Induced Corrosion. J. Adv. Concr. Technol. 2023, 21, 1020–1035. [Google Scholar] [CrossRef]
  77. Bentz, E.C. Probabilistic Modeling of Service Life for Structures Subjected to Chlorides. ACI Mater. J. 2003, 100, 391–397. [Google Scholar] [CrossRef]
  78. Berke, N.S.; Hicks, M.C. Predicting Chloride Profiles in Concrete. Corrosion 1994, 50, 234–239. [Google Scholar] [CrossRef]
  79. Amey, S.; Johnson, D.; Miltenberger, M.; Farzam, K. Predicting the Service Life of Concrete Marine Structures: An Environmental Methodology. ACI Struct. J. 1998, 95, 205–214. [Google Scholar] [CrossRef]
  80. Weyers, R.; Prowell, B.; Sprinkel, M.; Vorster, M. Concrete bridge protection, repair, and rehabilitation relative to reinforcement corrosion: A methods application manual. Contract 1993, 100, 103. [Google Scholar]
Figure 1. Corrosion of the steel rebars at (a) the top surface of the deck and (b) the underside of the RC bridge deck, Gardiner Expressway, Toronto.
Sustainability 16 08200 g001
Figure 2. Chloride diffusion coefficient values over time for GPC and OPC concrete.
Sustainability 16 08200 g002
Figure 3. Historical annual maximum temperature data for Toronto City.
Sustainability 16 08200 g003
Figure 4. Projection of the annual mean maximum temperature for Toronto under RCP2.6 and RCP8.5 [57].
Sustainability 16 08200 g004
Figure 5. Factors influencing the maximum temperature over time for different RCPs in Toronto.
Sustainability 16 08200 g005
Figure 6. Relationships between the maximum temperature factors and the corresponding temperatures.
Sustainability 16 08200 g006
Figure 7. Relative humidity factors used in the probabilistic corrosion initiation model and their corresponding relative humidity percentages.
Sustainability 16 08200 g007
Figure 8. Validation of chloride-induced corrosion initiation probabilities for RC bridge decks made of different types of concrete via Monte Carlo simulations [31,75].
Sustainability 16 08200 g008
Figure 9. Validation of corrosion initiation times for GPC (50% FA and 50% SG) at various maximum temperatures compared with other findings [76].
Sustainability 16 08200 g009
Figure 10. Probability of chloride-induced corrosion initiation across different coefficients of variation for various concrete cover thicknesses.
Sustainability 16 08200 g010aSustainability 16 08200 g010b
Figure 11. Impact of maximum temperatures on the PCI for RC bridge decks with a 40 mm concrete cover across various coefficients of variation.
Sustainability 16 08200 g011
Figure 12. Impact of maximum temperatures on the PCI for RC bridge decks with a 50 mm concrete cover across various coefficients of variation.
Sustainability 16 08200 g012
Figure 13. Impact of maximum temperature on the PCI for RC bridge decks made of GPC (50% FA and 50% SG) with a 50 mm concrete cover.
Sustainability 16 08200 g013
Figure 14. Impact of relative humidity on the PCI for RC bridge decks made of GPC (50% FA and 50% SG) with a 50 mm concrete cover.
Sustainability 16 08200 g014
Figure 15. Comparison of the impact of maximum temperatures on the PCI for RC bridge decks made of GPC (50% FA and 50% SG) and normal concrete with a 50 mm concrete cover.
Sustainability 16 08200 g015
Table 1. Summary of the input parameters for the probabilistic model.
Random VariablesMean Value (μ)Coefficient of
Variation (COV)
Distribution
Chloride Concentration (Co) (kg/m3)630%Log-normal
Concrete Cover (x) (mm)7020%
Chloride threshold (Cth) (kg/m3)0.720%
Table 2. Summary of the input parameters for the probabilistic chloride-induced corrosion initiation model.
ParametersMeanCOV (%)Distribution
Cth (kg/m3)0.720%Lognormal
Co (kg/m3)630%Lognormal
D (t) (m2/s)4.75 × 10−14 (50 years)
3.13 × 10⁻¹⁴ (100 years)
---------Deterministic
Table 3. Polynomial equations for the prediction of the PCI for an RC bridge deck made of GPC (50% FA and 50% SG) at different maximum temperatures.
YearMaximum Temperature = 30 °CMaximum Temperature = 40 °C
50PCI = (1.1449 × (COV)2) − 0.1767 × (COV) + 0.0027
(R2 = 0.997)
PCI = −5.9616 × (COV)3 + 4.4211 × (COV)2 − 0.0488 × (COV) − 0.0015
(R2 = 0.999)
100PCI = 1.1526 × (COV)2 + 0.0475 × (COV) − 0.0074
(R2 = 0.991)
PCI = −0.9164 × (COV)2 + 1.2608 × (COV) + 0.0701
(R2 = 0.994)
where PCI is the PCI, and COV is the coefficient of variation, which varies from 0.1 to 0.45.
Table 4. Polynomial equations for the prediction of the RI for an RC bridge deck made of GPC (50% FA and 50% SG) at different maximum temperatures.
YearMaximum Temperature = 30 °CMaximum Temperature = 40 °C
50RI = 22.291 × (COV)2 − 19.89 × (COV) + 5.5324
(R2 = 0.996)
RI = 10.963 × (COV)2 − 10.077 × (COV) + 2.7814
(R2 = 0.996)
100RI = −82,090 × (COV)6 + 125,211 × (COV)5 − 74,471 × (COV)4 + 21,684 × (COV)3 − 3142.4 × (COV)2 + 191.07 × (COV) + 0.0197
(R2 = 0.990)
RI = 5.2241 × (COV)2 − 5.1182 × (COV) + 1.3879
(R2 = 0.997)
where RI is the reliability index and COV is the coefficient of variation, which varies from 0.1 to 0.45.
Table 5. Polynomial equations were used for the prediction of the PCI for an RC bridge deck made of GPC with a mean concrete cover of 50 mm at different maximum temperatures.
YearMaximum Temperature = 30 °CMaximum Temperature = 40 °C
50PCI = (1.404 × (COV)3) − (0.3555 × (COV)2) + (0.0168 × COV) + 0.0001
(R2 = 0.999)
PCI = (−1.1234 × (COV)3) + (1.942 × (COV)2) − (0.2629 × (COV)) + 0.0038
(R2 = 0.997)
100PCI = (0.9463 × (COV)2) − 0.1907 × (COV) + 0.0047
(R2 = 0.994)
PCI = (−4.5795 × (COV)3) + (4.1012 × (COV)2) − (0.3346 × (COV)) + 0.0024
(R2 = 0.999)
Table 6. Polynomial equations were used for the prediction of the RI for an RC bridge deck made of GPC with a mean concrete cover of 50 mm at different maximum temperatures.
YearMaximum Temperature = 30 °CMaximum Temperature = 40 °C
50RI = 26.349 × (COV)2 − 24.529 × (COV) + 7.2879
(R2 = 0.996)
RI = 16.364 × (COV)2 − 15.594 × (COV) + 4.673
(R2 = 0.997)
100RI = 21.037 × (COV)2 − 19.855 × (COV) + 5.9356
(R2 = 0.997)
RI = 10.974 × (COV)2 − 10.831 × (COV) + 3.2975
(R2 = 0.998)
Disclaimer/Publisher’s Note: The statements, opinions and data contained in all publications are solely those of the individual author(s) and contributor(s) and not of MDPI and/or the editor(s). MDPI and/or the editor(s) disclaim responsibility for any injury to people or property resulting from any ideas, methods, instructions or products referred to in the content.

