Article

A Cybernetics Approach and Autoregressive Distributed Lag Econometric Exploration of Romania’s Circular Economy

Department of Economic Informatics and Cybernetics, Bucharest University of Economic Studies, 0105552 Bucharest, Romania
*
Author to whom correspondence should be addressed.
Sustainability 2024, 16(18), 8248; https://doi.org/10.3390/su16188248
Submission received: 1 August 2024 / Revised: 19 September 2024 / Accepted: 20 September 2024 / Published: 22 September 2024

Abstract

:
The purpose of this study, which adopts a cybernetics systems approach, is to analyze the circular economy landscape in Romania. It investigates the role of circular economy practices in the country’s endeavors to combat climate change and minimize its environmental footprint. Using data spanning from 2000 to 2022, we applied the autoregressive distributed lag (ARDL) model to examine the interdependence between C O 2 emissions and key factors, such as GDP per capita, the recycling rate of municipal waste, and the generation of municipal waste per capita. Our findings suggest that the implementation of sustainable development strategies in Romania has successfully decoupled economic growth from environmental sustainability. This study introduces novelty by approaching the ARDL analysis through the integration of circular economy principles into a cybernetics system. This perspective contributes to informed decision making and the establishment of efficient tactical, operational, and strategic directions. Our results indicate that, in the long run, both the recycling rate of municipal waste and the generation of municipal waste per capita positively influence C O 2 emissions, while GDP per capita has a negative impact. Variance decomposition and impulse response functions were employed to assess the explanatory variables’ influence on C O 2 emissions and their effectiveness in explaining temporal fluctuations.

1. Introduction

The circular economy (CE) concept has the potential to positively affect C O 2 emissions (COE). In a CE, emphasis is placed on reducing waste, reusing materials, and recycling resources, which can lead to decreased resource extraction and energy consumption, ultimately resulting in lower COE. By extending the lifespan of products through repair, refurbishment, and recycling, a CE minimizes the need to produce new items from scratch, often leading to high energy consumption and greenhouse gases (GHGs) [1]. Additionally, the CE stimulates the adoption of cleaner production methods and the use of renewable energy sources, which contribute less COE. The adoption of sustainable development strategies, including concepts like the CE, involves decoupling economic growth from the consumption of finite resources, as outlined in the goals of the 2023 Agenda for Sustainable Development [2]. Tiwari et al. [3] emphasized the pressing need for closed-loop systems as a prerequisite for economic prosperity.
According to Deutz [4], a CE is an economic system structured to optimize resource utilization, ensuring that resources are used to their fullest extent, while simultaneously minimizing the generation of waste for disposal. The CE emphasizes reusing, repairing, refurbishing, remanufacturing, and recycling existing products for as long as possible. This approach contrasts with the traditional linear economy, which follows a “take, make, disposal” production model.
The extent to which a CE can reduce COE depends on several factors, including the efficiency of the recycling process, product design for circularity, consumer behavior, and the integration of circular practices within industries and supply chains [5].
Overall, while the CE offers promising opportunities to mitigate COE, its success hinges on comprehensive and coordinated efforts across sectors to transition towards sustainable, circular practices.
The CE processes of repairing, reusing, and recycling contrast with the traditional linear economy, where products are manufactured, used, and then discarded as waste.
The key elements of the CE are:
  • Resources are used in a closed-loop system, where they undergo reuse and recycling, reducing the need for new resources and mitigating environmental consequences;
  • Products are designed to have longer lifespans through maintenance, repair, and reuse;
  • Materials from used products are extracted and reprocessed to create new products, reducing the demand for raw material.
The CE is linked to economic growth as follows. One of the main goals of a CE is to decouple economic growth from the consumption of finite resources. In traditional economic models, economic growth often leads to an increase in resource consumption and environmental degradation. The CE breaks this link, stimulating energy efficiency and minimizing waste generation. Innovation in product design, manufacturing processes, and recycling technologies is driven in the transition to a CE. The creation of new industries and job opportunities contributes to economic growth. While traditional economic growth sometimes affects environmental health, the CE attempts to achieve sustainable growth by conserving resources and reducing the environmental impact.
The transition to a CE may require investments in new infrastructure and technologies and changes in consumer patterns. These transition costs can have an impact on short-term economic growth, but they are justified by the long-term benefits of reduced resource dependency. Municipal solid waste (MSW) stands out as a pressing concern that is linked to both economic expansion and urban population growth. In its untreated state, it gives rise to noxious and hazardous compounds that permeate the soil. Conversely, when subject to treatment, it gives rise to a significant volume of GHG [6].
This research brings innovation by incorporating CE principles into a cybernetics system complemented by the ARDL technique. This approach enhances decision making and the formulation of strategic paths. Our findings suggest that over time, an increase in both the recycling rate of municipal waste and the per capita generation of municipal waste is associated with a positive impact on COE, whereas GDP exhibits a negative influence on COE.
This study significantly contributes to Romanian CE literature, pioneering the connection between the CE system and COE. A noteworthy finding is the long-term negative relationship between economic growth and COE, signaling a decoupling process between economic advancement and environmental sustainability. The study’s implications are pivotal for regulatory bodies, suggesting the necessity of environmental regulations to curb carbon emissions in Romania. It offers practical insights into how a CE can mitigate climate change and reduce environmental impact, serving as a guide for public policy and fostering sustainable practices. The adoption of an autoregressive distributed lag (ARDL) model stems from its suitability in capturing dynamic relations among economic, environmental, and social variables, especially in delineating the delayed effects of CE policies on GDP, resource utilization, or emissions.
The CE observed as a cybernetics system and the application of the ARDL model can be linked as follows. The CE is an economic system designed to minimize waste and optimize resource use. It involves designing products, with a focus on the reuse, recycling, and regeneration of materials. When applying the ARDL model to CE indicators, one might seek to understand how changes in certain economic variables affect the circularity of an economy over time. The cybernetics perspective comes into play as feedback loops and control mechanisms within the CE can be reflected in the model. For example, adjustments in policy or industry practices could be viewed as regulatory feedback mechanisms influencing circularity.
The research background of this paper is grounded in the increasing global focus on the CE as a main strategy for mitigating climate change and promoting environmental sustainability. The CE aims to move away from the traditional linear economic model by promoting the reuse, recycling, and reduction in the use of resources [7]. This approach is particularly relevant in the context of Romania, a country working to harmonize its environmental policies with European Union directives, such as the European Green Deal [8] and the Circular Economy Action Plan [9].
The main aim of this study is to investigate, through a cybernetics systems approach, the influence of CE practices in Romania, particularly the recycling rate of municipal waste, the generation of municipal waste per capita, and the GDP per capita, on C O 2 emissions. Additionally, the study aims to determine the extent to which Romania has succeeded in decoupling economic growth from environmental sustainability during the period from 2000 to 2022, using the feedback mechanisms and control processes inherent in a cybernetics system. This study introduces a novel perspective by integrating CE principles into the ARDL analysis through a cybernetics systems approach. This interdisciplinary methodology enhances the understanding of how CE practices can influence environmental outcomes in Romania. Unlike other studies that may focus on linear models or traditional economic–environmental relationships, this paper specifically explores the dynamic interdependence between C O 2 emissions and CE factors over time. The cybernetics system framework allows an examination of how feedback loops and control mechanisms in CE strategies impact climate change efforts and environmental sustainability.
Thus, this study brings the following innovations:
i.
Integration of CE and Cybernetic Systems: The study effectively integrates CE principles into a cybernetics system, improving strategic decision making through the use of the ARDL technique;
ii.
Analysis of Dynamic Interdependence: The study explores the dynamic interdependence between C O 2 emissions and CE factors, highlighting feedback loops and control mechanisms within CE strategies;
iii.
Decoupling Economic Growth from COE: The study identifies a long-term negative relationship between economic growth and COE, indicating a decoupling process with significant implications for sustainable development;
iv.
Focus on the Romanian Context: Our research provides an innovative contribution to Romanian CE literature, providing valuable insights for public policy and sustainable practices.
The structure of this study is organized as follows. The subsequent section provides a concise literature review concerning the CE and carbon emissions. Following this, the CE is elucidated through the lens of a cybernetics system in the succeeding section. Section 3 outlines the methodologies employed, including the ARDL econometric approach. The empirical results, along with a comprehensive description of the data used and the discussions, are presented in Section 4. Section 5 discusses the implications of these findings in the context of integrating CE into a complex cybernetics system, highlighting the potential for systemic optimization and sustainability. The study concludes in the final section, which includes concluding remarks, limitations, and directions for future research.

2. Theoretical Background

The current research on the impact of the CE on C O 2 emissions in Romania aligns with both European and global initiatives aimed at incorporating CE principles into climate change mitigation. Recent research [10,11,12] highlights the CE’s potential to significantly reduce greenhouse gas emissions by optimizing resource use, minimizing waste, and extending the lifespan of products. Romania is integrating these principles into its environmental policies, following EU frameworks such as the European Green Deal [8] and the Circular Economy Action Plan [9]. These initiatives prioritize improving material efficiency, particularly in sectors like waste management and industrial production, which are the main contributors to carbon emissions.
In this section, we explore the conceptual framework and current state of knowledge in the field of the CE and C O 2 emissions. Section 2.1 presents recent research investigating the relationship between the CE and carbon reduction, focusing on studies carried out at the European and global level, as well as on the specific situation in Romania. Section 2.2 focuses on the integration of the CE into a complex cybernetic system, proposing three hypotheses that are analyzed in detail to illustrate how the CE can be understood and optimized through feedback and self-regulatory mechanisms.

2.1. The Stage of Knowledge in the Field

2.1.1. The Relationship between CE and COE

Several studies have focused on investigating the correlation between the CE and COE. Most of these studies have mainly used panel data [6,13].
Magazzino et al. [13] explored waste, GHG emissions, and GDP in Switzerland from 1990 to 2017. MSW generation leads to emissions, while waste recovery reduces GHG. In Denmark (1994–2017), their study linked MSW, income, urbanization, and GHG emissions and found that GDP per capita influenced emissions. Georgescu et al. [14] examined R&D, GDP, and MSW’s impact on municipal waste recycling, noting that technology advances increased waste, emphasizing the need for eco-friendly production.
A holistic view of the renewable energy sources (RESs), storage and non-RES replacement in Romania is provided in [15], which investigates how to quickly avoid carbon emissions. Moreover, the prices of the C O 2 emissions certificates were considered in order to understand the electricity price volatility on the day-ahead market in Romania, taking into account other external factors that were considered in the European green energy transition [16], such as macroeconomics, inflation, interest rate, etc., as well as the energy consumption and generation break down [17].
Two contrasting perspectives exist concerning the influence of the CE on COE. In line with one direction, the CE diminishes COE, thereby enhancing environmental quality.
Schwartz et al. [18] determine the environmental performance of 10 technologies using an LCA matrix model and conclude that recycling the most highly sought-after polymers in Europe reduces COE from plastics by 73%. Razzaq et al. [19] investigate the cointegration relationship between MSW recycling, economic growth, COE, and energy efficiency using bootstrap ARDL. The findings suggest that a 1% increase in MSW diminishes COE by 0.31% in the long run and 0.15% in the short run. Additionally, research focusing on the effectiveness of transitioning toward a CE in reducing COE underlines its significant role in promoting environmental sustainability. Using annual data from 29 European countries from 2000 to 2020, the study by Hailemariam and Erdiaw-Kwasie [1] employs a heteroscedastic-based instrumental variables approach to address endogeneity issues. The findings indicate that progress towards a circular economy considerably enhances environmental quality by reducing C O 2 emissions. This suggests that business strategies that promote recycling and CE practices are essential in achieving net-zero emission targets by 2050 and improving environmental sustainability.
Another study focuses on the changing role of COE in industrial processes in connection with the introduction of CE principles. Tcvetkov et al. [20] investigates whether technogenic C O 2 is still considered industrial waste or whether it has become a valuable resource. The findings reveal that C O 2 is increasingly viewed as a valuable resource, with the total annual C O 2 consumption projected to rise significantly. The development of carbon capture and utilization technologies suggests a shift in attitudes towards C O 2 , leading to new C O 2 -based markets and industries.
The second body of literature contends that a CE exerts an insignificant influence on COE. Gallego-Schmid et al. [21] assert that while CE solutions are often assumed to automatically lead to lower COE, such reductions are not guaranteed in every instance. The study emphasizes the necessity of evaluating each case individually to quantify the actual emissions outcomes. The study by Bayar et al. [22], which uses panel cointegration, discusses how environmental sustainability, as indicated by COE, was influenced by municipal waste recycling and renewable energy adoption across EU member states from 2004 to 2017. Although recycling is commonly viewed as a means of effectively decreasing COE, the study’s outcomes present surprisingly mixed conclusions. The distinct cointegration coefficients highlight that the recycling process contributes to COE reduction in nations such as Belgium, Cyprus, Finland, Poland, and Hungary. The same process is linked to heightened COE in countries like Greece and Luxembourg.

2.1.2. Literature Review on CE in Romania

In the context of Romania, studies have highlighted challenges in CE adoption. Vermeșan et al. [23] highlight Romania’s transition to a CE and the challenges it faces, focusing on prevailing attitudes. Topliceanu et al. [24] assess Romania’s adoption of CE principles using European Commission indicators, comparing it with the EU. Dobre-Baron et al. [25] predict the shift to a CE in Romania and the EU using a quantitative time series approach. Despite some studies indicating Romania’s lag in CE adoption, Botezat et al. [26] identify practices and performances of Romanian producers in implementing CE principles.
Another study [27] analyzes the CE in Romania as an important strategy for achieving a more sustainable future, with benefits for the environment, economy, and society. The main purpose of this study was to conduct a holistic analysis that highlighted Romania’s position in the transition and integration process towards the CE. The ARDL model was employed to assess the impact of variables such as the recycling rate, labor productivity, and the rate of circular material use on GDP. The data used covered the period of 2010–2020. Moreover, the authors integrate a holistic approach into their analysis and consider the fact that the CE system is a cybernetic and complex adaptive system (CAS).
Regarding the benefits of integrating the CE in Romania, and beyond, [28] highlighted the following advantages through their research: reducing environmental pressure, improving the security of raw material supply, increasing business competitiveness, stimulating innovation, boosting economic growth, and last but not least, creating new jobs. The authors analyzed various indicators specific to Romania to make a comparison with the EU level in the period 2010–2020, and the main conclusion was that Romania ranks among the last countries in terms of recycling rates, with the highest rate being recorded in Germany.
Burlacu et al. [29] aimed in their research to highlight the coherence between the Romanian perspective and the European vision regarding how they understood the harmonization of their principles and the directions of action in the field of the CE.
Barna et al. [30] conducted an exploratory study with the aim of investigating the potential of the social economy sector in Romania as part of a CE approach that could advance the green transition in the coming years.
The study by Lacko et al. [31] benchmarks the environmental efficiency of the European Union countries that joined in 2004 and later and identifies common circular economy factors influencing this efficiency. Using data envelopment analysis, the results show that service-oriented countries, such as those with tourism, are the most efficient, while Bulgaria, Romania, and Croatia are the least efficient. The study also highlights the importance of the circular economy in improving the environment and the need for common regional policies at the EU level.
From this analysis of the literature review, we can observe that although the researchers’ interest has increased, the subject of the CE in Romania is still in development. Such research contributes to the enrichment of the existing specialized literature and the formulation of beneficial political, governmental, and tactical strategies for transitioning to such an economy.

2.1.3. The Use of the ARDL Model in CE Analysis

Previous studies have used the ARDL model to evaluate the impact of the CE on economic variables, such as recycling and resource utilization [27].
A recent study [3] investigates the effect of the CE on C O 2 emissions growth by considering factors like energy transition, climate policy, industrialization, and supply chain pressure from 1997 to 2020. Using panel quantile ARDL (QARDL) and the panel PMG approach, the study finds a significant cointegration association among the variables in the long run. The results reveal that the CE and climate policy stringency have a significant negative impact on C O 2 emissions. Musa et al. [32] explores the individual impacts of four sources of the CE, renewable energy consumption, recycling, reuse, and repair of materials, on the ecological footprint in Germany. Using time series data from 1990 to 2021, this research employs the dynamic ARDL simulation technique and kernel-based linear regression (KRLS) to test the robustness of the results. The findings reveal that reuse practices significantly reduce the ecological footprint in both the short and long run. Chiriță and Georgescu [12], in their study, examine the CE in Romania from a cybernetics perspective, framing it as a CAS. The research first analyzes the transition from a linear economy to a CE in Romania and designs a CE cybernetics system. In the second part, the study employs the ARDL model to investigate the long-run and short-run causal relationships between renewable energy, which is treated as the dependent variable, and its determinants, such as real GDP per capita, net greenhouse gas emissions, and other macroeconomic factors. The results of the study highlight the dependencies between renewable energy and macroeconomic factors, emphasizing the role of the circular economy within a cybernetics system. The findings suggest that integrating CE principles into the economic system can enhance the understanding of how renewable energy and other determinants interact over time, providing a comprehensive framework for analyzing sustainable development.
Erdiaw-Kwasie et al. [33] investigate how progress towards a CE and innovation affected tourism receipts in EU countries from 2000 to 2020. By employing the autoregressive distributed lag (ARDL) model and the error correction method (ECM), the study identifies both long-run and short-run equilibrium relationships. The findings indicate that promoting circular innovative practices, including recycling and using secondary raw materials in tourist destinations, can enhance environmental quality and have a positive impact on tourism receipts.
Another study [34] examining the environmental impacts of waste generation and recycling in the Chinese economy over the past 46 years (1975 to 2020) provides valuable insights into the social and environmental consequences of these practices. Using a combination of four primary approaches, unit root tests, the ARDL model, Granger causality, and innovation accounting matrices (IAMs), the study explores the short- and long-run effects of waste production and recycling on emissions per capita. The findings reveal that combustible renewables and waste contribute to reducing carbon emissions by promoting industrial waste recycling.
These studies have shown the potential of the ARDL technique to capture dynamic relationships and provide insights into the delayed effects of CE policies.

2.2. A Cybernetics Approach to the CE System

The global economy system represents the largest and, one could say, the most complex system among the cybernetics systems within the economy. It encompasses all the other CASs described at the individual level, such as the enterprise’s cybernetics system, the financial market’s system, the commercial bank’s system, and the national economy, without, however, borrowing their properties or structure [35]. Within the global economy, specific behaviors develop, which define the general rules by which it functions and is organized.
All economic systems, regardless of their operating level, influence dynamics at the micro- and meso-levels on a global scale. Therefore, the concepts and ideas related to the CAS apply to systems at all levels, from local to global. The following examples illustrate some of these global systems.
Regarding the framing of the CE within a complex cybernetics system, we now construct a holistic approach to this concept. Thus, we propose the following hypotheses, which are to be verified in order to illustrate that the CE can be approached as a cybernetics system:
H1. 
The CE is an adaptive system;
H2. 
The CE is a dynamic system;
H3. 
The CE is a complex system.
First and foremost, we need to understand why the CE can be categorized as an adaptive system. It is evident that the CE adapts to changes in the surrounding environment and the needs of society. Resources are efficiently utilized in a CE, allowing the system to adapt to changes in resource availability and price fluctuations. On the other hand, the CE is based on the principles of reduction, reuse, and recycling, meaning that waste is minimized, contributing to environmental protection and adaptation to resource pressures. To function in a circular manner, companies need to innovate in the design of their products and processes, which means the system is constantly adapting to identify more efficient and sustainable ways to produce and consume goods. The CE aims to replicate the natural cycles of resources, such as the water cycle or the carbon cycle. This approach helps in adapting to the environment and conserving natural resources. Overall, the CE is an adaptive system as it is based on the principle of adapting to changes in the surrounding environment and the needs of society while promoting efficiency and sustainability. Korhonen [36], in his study, also states that four key properties of the CAS are fundamental for the development of the CE: material cycles, the diversity of actors involved, the interdependence of their relationships, and the locality in the product life cycles within the system.
The second hypothesis concerns the integration of the CE into a dynamic system. The CE is based on the concept of continuous resource cycles, where materials and products are constantly designed, manufactured, used, and recycled or reused. This approach contrasts with the traditional linear economy, where resources are used once and then discarded. On the other hand, based on the demonstration of the first hypothesis stated earlier, a dynamic system must be adaptable to changes and new circumstances. In the CE, this translates into the ability to adjust production, consumption, and recycling models to respond to changes in available resources, technology, or market demand. Dynamic systems can benefit from flexibility and diversity to cope with the variability and complexity of the environment. In the CE, diversifying sources of raw materials, developing new technologies, and adapting business models contribute to increasing system resilience. A dynamic system benefits from constant feedback and learning processes. In the CE, the ongoing monitoring and evaluation of product life cycles and their environmental impact lead to continuous improvements and the adaptation of strategies. In a dynamic system, elements are interconnected and mutually influence each other. In the CE, various sectors, such as production, consumption, recycling, and natural resources, are closely linked and mutually influence one another. Information exchange and collaboration between these sectors are essential for the efficient operation of a circular system. In conclusion, the CE fits into a dynamic system; so, the second hypothesis is validated, as it promotes continuous cycles, interconnectivity, adaptability, feedback, renewable resources, flexibility, and diversity to create a sustainable and resilient economic model. This hypothesis is also validated by recent research. For example, Guzzo et al. [37] analyze a system dynamics-based framework for examining CE transitions. They argue that system dynamics facilitate the addressal of the increased complexity within the CE. In their study, the authors examine a framework based on system dynamics aimed at supporting decision-making processes at the micro-, meso-, and macrolevels.
The third hypothesis pertains to the complexity of the CE system. We observed from the previous two hypotheses that the CE is characterized by interconnectivity, diversity, adaptability, feedback, and learning. These characteristics underlie a complex system. Rios et al. [38] also explore the CE environment from the perspective of resource use and C O 2 emissions, aiming to design the complex systems inherent in CE interventions.
Moreover, CE can be considered a self-organizing system, in which processes and interactions self-regulate to maintain balance and efficiency. It can react to disruptions and restructure accordingly. In a complex system, causes and effects can be non-intuitive and challenging to predict. Decisions and actions in one part of the system can have unexpected repercussions in another. The CE is strongly influenced by the local, national, and global contexts, including their rules, policies, infrastructures, and available resources. This variable context can add to the complexity of the system. In conclusion, the CE can be regarded as a complex system due to its interconnectivity, diversity, adaptability, feedback, variation, self-organization, non-intuitive causes and effects, and context dependence. This complexity requires a holistic approach and careful management to achieve the transition to a sustainable CE.
The three hypotheses are interrelated and mutually supportive, as they are all defining characteristics of a complex adaptive cybernetic system. For example, adaptivity cannot exist without system dynamism and both contribute to the complexity of the whole system. The assumption that the CE is an adaptive system is consistent with the fact that the CE is a dynamic system, in which constant changes and cycles influence adaptation. Moreover, this adaptivity and dynamism generates a high degree of complexity, emphasizing interdependencies and feedback between economic and environmental actors. Consequently, the three proposed hypotheses are based on the theory of the CAS, which has been developed by several theorists in cybernetics and systems sciences, such as Norbert Wiener [39] and Herbert Simon [40]. The complexity, adaptivity, and dynamics of a circular system are among the fundamental characteristics of a CAS.
Therefore, we can conclude that, based on the three hypotheses confirmed above, the CE can be conceptualized as a cybernetics system, characterized by continuous feedback and the ability to self-regulate in real time. In a similar manner to a cybernetics control system, the CE monitors and responds to real-time changes, adjusting processes and strategies based on collected data and information. For example, monitoring resource consumption and carbon emissions can lead to immediate changes in production and resource use to minimize environmental impact [41].
The CE adapts to changes in its environment, technological advancements, market demands, and resource availability. This system can quickly adjust production, consumption, and recycling patterns to address new circumstances. For example, in the event of a resource crisis, the CE can redirect priorities toward recycling and reuse to conserve materials and maintain resource cycles.
The complexity of the CE arises from its interconnectedness, the diversity of sectors involved, and its dependence on the local, national, and global contexts. This complexity is managed through a regulatory system and a control system, like a cybernetics system, aimed at maintaining balance and efficiency in the face of constantly changing conditions.
The CE can be seen as a self-organizing system, where processes and interactions autonomously adjust to maintain optimal balance and efficiency. For instance, the supply and demand for recycled raw materials can automatically regulate prices and quantities to achieve equilibrium.
Like a cybernetics system that responds to disruptions, the CE can swiftly adapt to unforeseen events or abrupt changes in its environment. For example, in the case of a natural resource crisis, the CE can rapidly shift to alternative sources or intensify reuse and recycling to reduce dependence on those resources. In conclusion, the CE can be viewed as a complex adaptive cybernetics system characterized by feedback, self-organization, adaptability, complexity, and the ability to respond efficiently and sustainably to changes. This systemic and dynamic approach is essential for achieving a sustainable CE.
In the context of a cybernetics approach, the CE described as a CAS was described above. To provide an even clearer understanding of the characteristics or properties of such a system, we design the cybernetics system of the CE using the Microsoft Visio software solution (version 15.0.4605.1000, 2013). Over the past decade, significant progress has been made in comprehending the vital phenomena present within complex networks.
In the depicted cybernetics system illustrated in Figure 1, various key actors drive the functioning of the CE. These include producers, consumers, government entities, environmental agencies, the capital market, and the recycling industry.
In Figure 1, control points and feedback loops have been identified. The feedback loops among the manufacturers, consumers, and recycling industry represent dynamic interactions in the CE. Manufacturers and consumers play essential roles in determining the quality and quantity of recyclable materials, and the recycling industry adapts based on this feedback to optimize processes and promote sustainability. Regarding the feedback loop with the capital market, it illustrates the interconnected relationship between the recycling industry and the capital market within the CE framework. The efficiency and sustainability of the recycling sector can influence investment decisions, and changes in the capital market may impact the availability of resources for recycling initiatives. The feedback loop between the recycling industry and the environmental agency demonstrates collaboration and regulatory influence. The environmental agency’s policies guide recycling activities to align with environmental goals, and the recycling industry’s feedback reflects the practical implementation and impact of these policies on recycling practices. In the feedback loop between the government and the recycling industry, the government serves as a regulatory authority, establishing rules and standards for recycling. The recycling industry’s feedback informs the government about practical aspects and challenges, ensuring that regulations remain effective, environmentally friendly, and aligned with CE goals.
In Figure 2, the feedback loops influenced by COE are delineated. The control points are also outlined. This interconnected system is designed to minimize COE by engaging key stakeholders in a collaborative effort, with each entity playing a vital role in attaining the CE objectives and addressing the challenges related to climate change. While Figure 1 illustrates the CE as a cybernetics system, highlighting the main actors and their general feedback mechanisms, Figure 2 focuses on the interactions and feedback mechanisms impacting CO 2 emissions in the CE. Although Figure 2 involves the same actors as Figure 1, it specifically details the CO 2 -related feedback interactions, providing a deeper understanding of how these interactions affect CO 2   emissions.

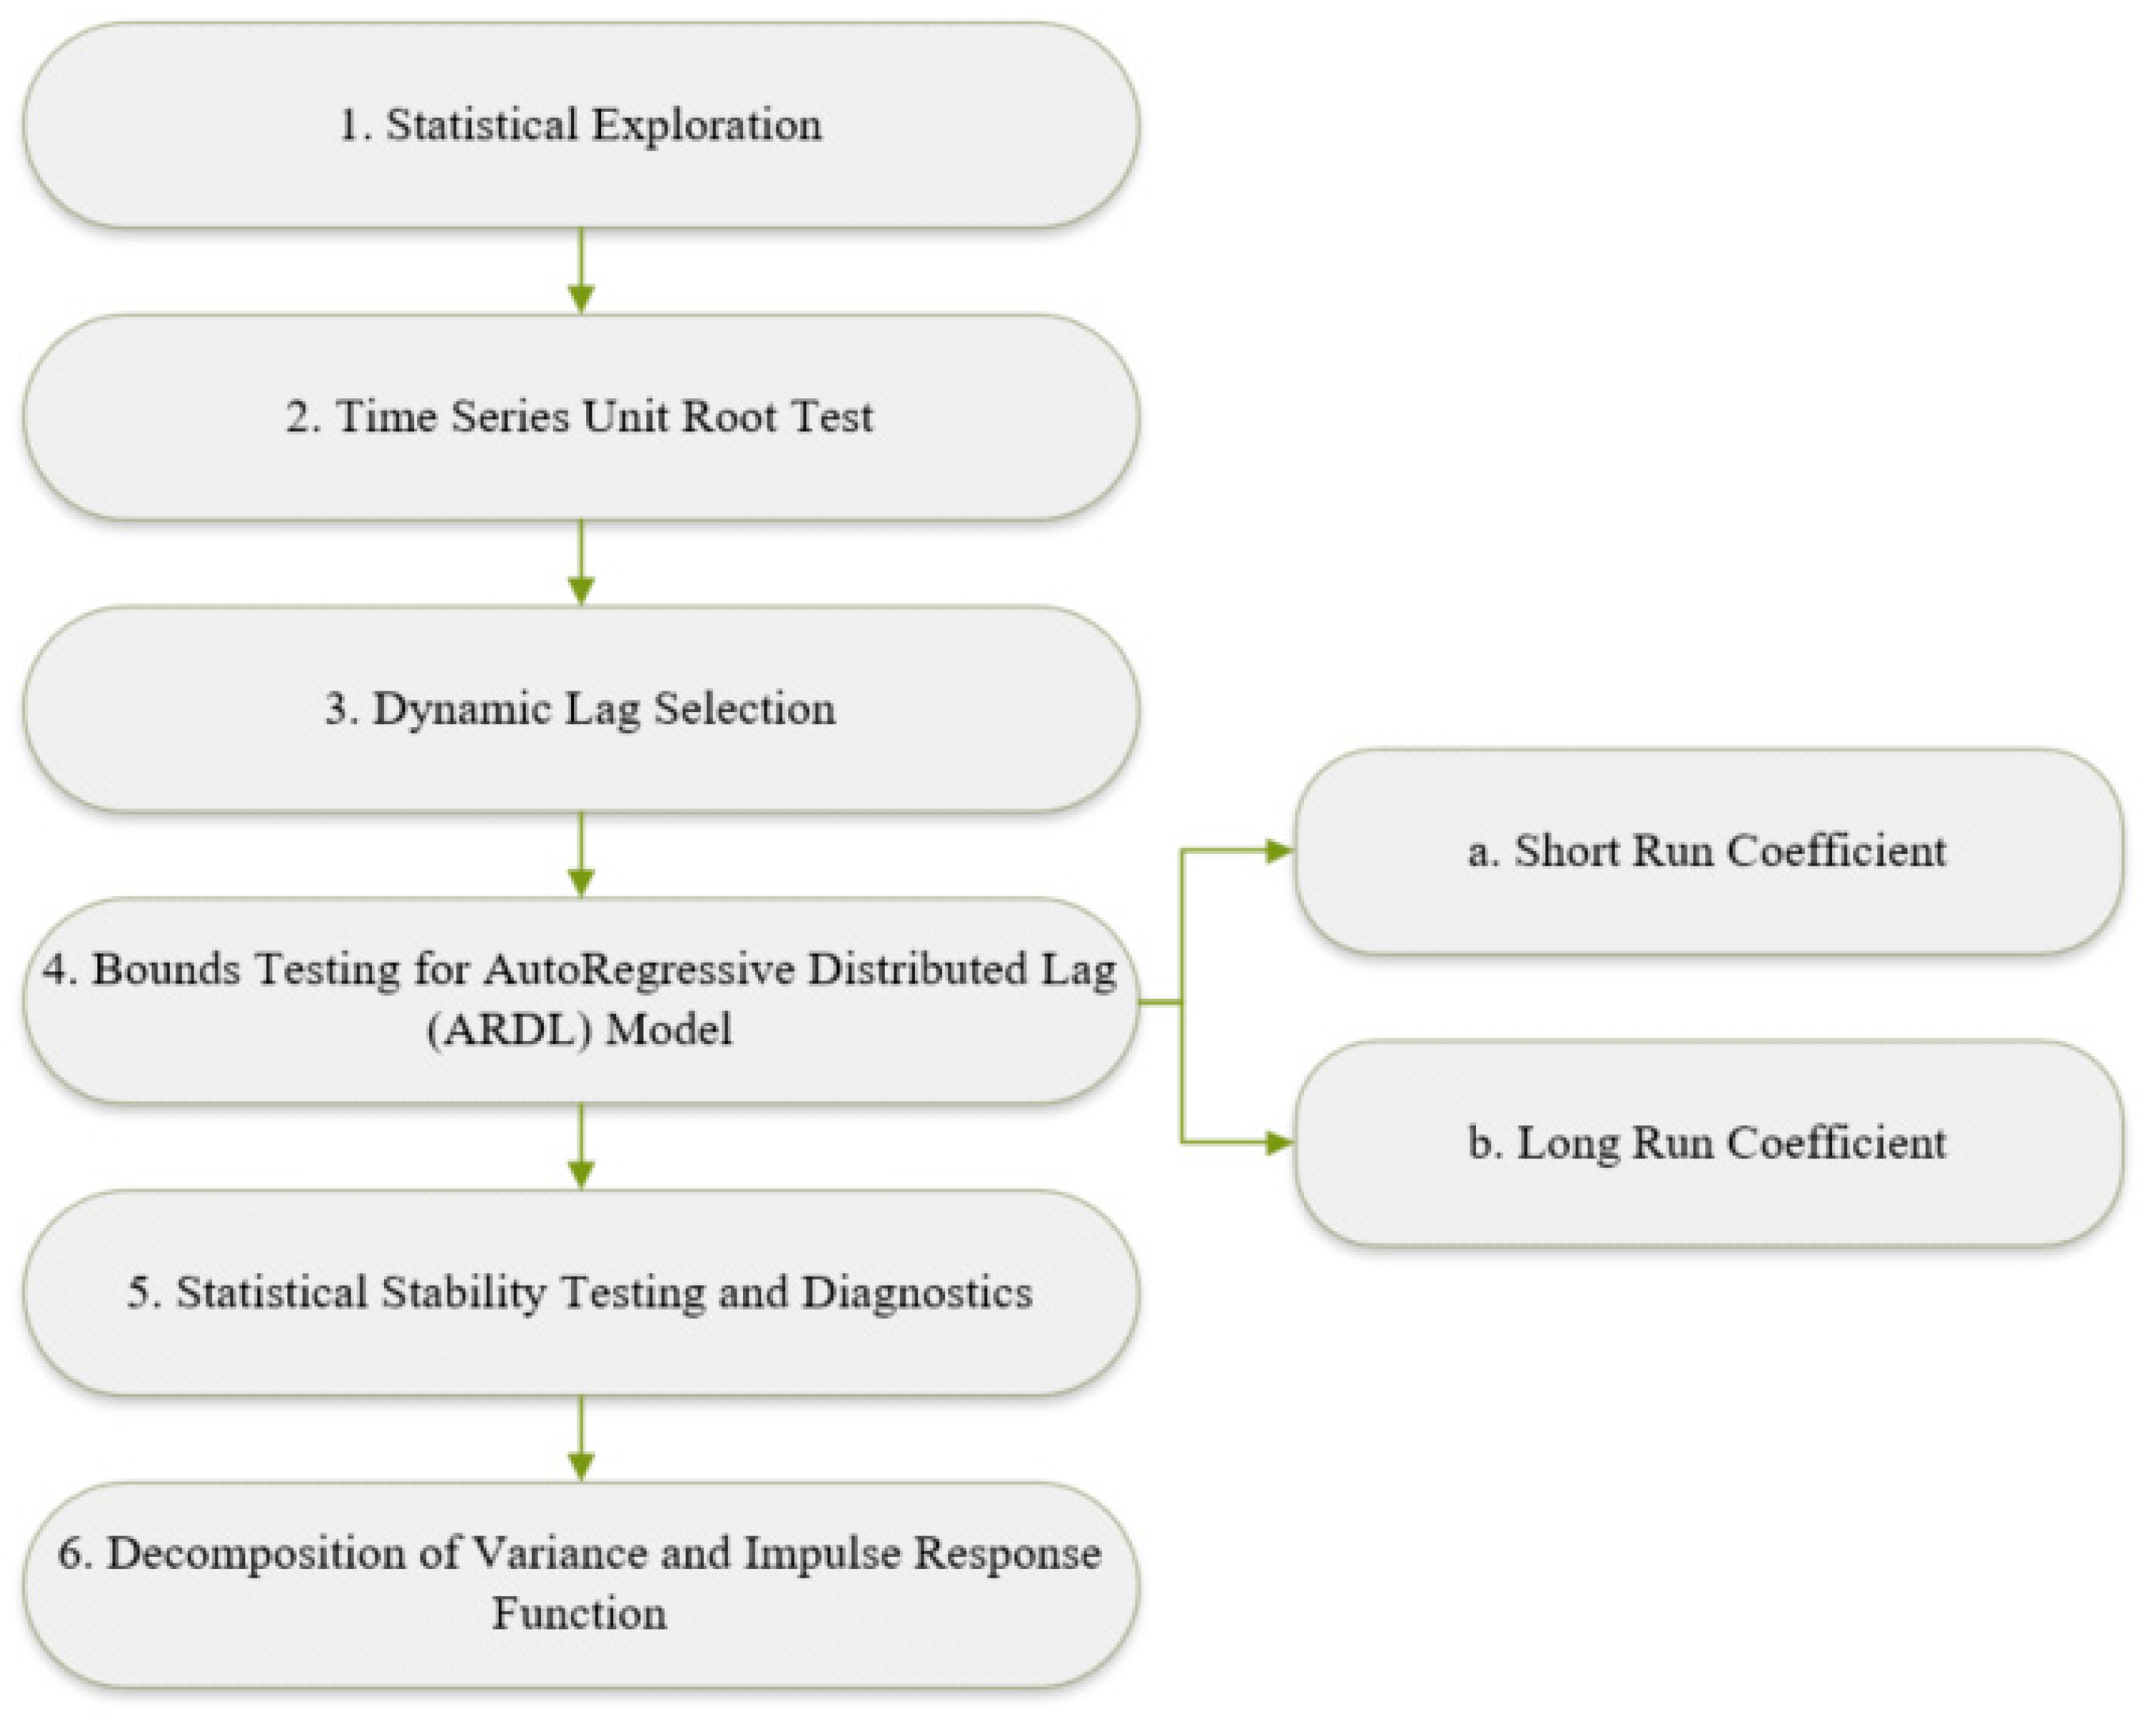
3. ARDL Econometric Methodology

The ARDL model, introduced by Pesaran and Shin [42] and further developed by Pesaran et al. [43], is a versatile cointegration technique that assesses long-run relationships between variables. Unlike conventional tests, ARDL can be applied to integrated series regardless of their order (I (0) or I (1)), and its bounds test allows the creation of an unrestricted error correction model (ECM) with both long- and short-run dynamics. Empirical evidence demonstrates ARDL’s superior performance in providing reliable outcomes even with a limited sample size. Notably, within the ARDL framework, the issue of endogeneity is less significant, reducing concerns about residual correlation [44]. Endogeneity refers to the situation where an independent variable in a regression model is correlated with the error term. Generally, this correlation can lead to biased and inefficient parameter estimates. According to Pesaran and Shin [42], the absence of residual correlation in the ARDL model alleviates concerns regarding the endogeneity problem due to the fact that incorporating appropriate lags effectively eliminates both serial correlation and endogeneity issues.
The equation of the ARDL model is, according to [42]:
B t = a 0 + i = 1 p b i B t i + i = 0 q c i A t i + ε t
In Equation (1), B t is the dependent variable, formulated by incorporating its lagged values and the lagged values of the independent variables found in vector A t . The constants b and c denote the short-run coefficients, while p and q are the optimal lag periods for the dependent and independent variables. a 0 represents the baseline C O 2 emissions when all the independent variables are at zero. The values of p and q are frequently chosen using the Akaike information criterion (AIC). The term ε t   signifies the error component, with the errors displaying no serial correlation or interdependence. Here, we give some reasons why AIC is applied in econometrics when selecting the best model. AIC penalizes models for being too complex, discouraging overfitting. AIC contains a penalty term based on the number of parameters in the model, favoring simpler models which are a good fit for the data. AIC is derived from information theory, namely the Kullback–Leibler information divergence. AIC also has favorable asymptotic properties, which contribute to its reliability in selecting models in different situations [45].
The steps of the ARDL model are represented in the diagram in Figure 3.
In Figure 3, the steps involved in the construction and validation of the ARDL model are presented. The first step involves statistical exploration of the data; this is an important stage in the development of any statistical model as it helps us understand the distribution and essential characteristics of the dataset. The next stage is unit root testing, which is a fundamental step for assessing the stationarity of time series. The proper selection of lags can significantly impact the accuracy of the model and the interpretation of the results. Therefore, the next step in constructing the most suitable ARDL model is the selection of the optimal number of lags.
The fourth stage is the bounds testing of the model, involving the assessment of the short- and long-term impact of changes in the independent variables on the dependent variable. Additionally, in this stage, it is determined whether there is cointegration between variables, indicating the existence of a stable long-term relationship.
The subsequent stage is the verification of model correctness. In this stage, diagnostic tests are applied to assess whether the model satisfies essential statistical assumptions and to identify any potential issues.
To validate the reliability of the ARDL model, we employ the Breusch–Godfrey serial correlation LM test, the Breusch–Pagan–Godfrey heteroskedasticity test, and the Jarque–Bera normality test. The model’s structural stability is evaluated using the Ramsey RESET test. Graphical verification of stability is carried out through the CUSUMSQ test, wherein the model’s stability at a significance of 5% is affirmed if the blue line falls within the boundary of the dotted red line. The final stage is the analysis of variance and the impulse response functions (IFRs), providing an in-depth understanding of how changes in independent variables affect the dependent variable in the short and long term. This stage is useful for understanding the relative contributions of factors to variability and for evaluating responses to exogenous disturbances. By going through these steps, the ARDL model offers a comprehensive approach for the analysis and prediction of time series, ensuring both stability and a meaningful interpretation of the results.

4. Data Collection and Results

The examination of the Romanian CE from 2000 to 2022 utilizes variables in Table 1 to assess the sustainability of the nation’s economic and environmental approaches. GDP serves as a metric for progress, indicating the capacity for investing in circular initiatives. Also, GDP per capita is used to assess how economic growth impacts environmental sustainability, supported by the environmental Kuznets curve (EKC), which suggests that economic development initially worsens the environment but later improves it [46]. Monitoring COE assesses the environmental footprint, while municipal waste generation (GMW) and the recycling rates of municipal waste (RMW) act as CE indicators, emphasizing the importance of waste reduction and prevention efforts. C O 2 emissions are important for understanding the environmental impact of waste management and economic activities. Studies on the EU’s CE strategies highlight C O 2   reduction as a main goal [20,47]. GMW and RMW are central to CE practices, with waste minimization and recycling being critical for sustainable development. Research on the EU’s waste prevention targets emphasizes their importance [19,22].
For a clearer understanding of all the acronyms used in our study, see Abbreviations, which describes these acronyms.
Considering the cybernetics analysis conducted in the previous section, additional justification for the selected variables in the ARDL model also refers to the observed feedback links and effects among them. Figure 4 shows the evolution of the four variables for Romania during 2000–2022. The variables description in Figure 1 contributes to the theoretical understanding of the factors under investigation, while the variable trends in Figure 4 help reveal the empirical patterns and dynamics in their behavior over time. One notices that GDP had an increasing trajectory during this period. RMW had an increasing trend during 2010–2022. The rise of RMW in Romania can be attributed to the government initiatives and policies implemented by the Romanian government, such that citizens and municipalities adopted more sustainable waste management practices. Romania is a signatory to international agreements or targets related to waste management and sustainability.
The ARDL model specification is:
COE t = a 0 + a 1 GDP t + a 2 GMW t + a 3 RMW t + ε t
Equation (2) can be expressed as an ARDL (n, p, q, r) regression:
Δ CO E t = a 0 + k = 1 n a 1 Δ CO E t   k + k = 1 p a 2 Δ GD P t   k + k = 1 q a 3 Δ GM W t   k + k = 1 r a 4 Δ RM W t   k + λ 1 CO E t 1 + λ 2 GD P t 1 + λ 3 GM W t 1 + λ 4 RM W t 1 + ε t
In Equation (3), a 0 is the drift component; Δ is the first difference; ε t is the white noise; and n ,   p ,   q , and r are lag lengths. If there is cointegration among the variables the ECM has the form:
Δ CO E t = a 0 + k = 1 n 1 a 1 Δ CO E t k + k = 1 p 1 a 2 Δ GD P t   k + k = 1 q   1 a 3 Δ GM W t   k + k = 1 r   1 a 4 Δ RM W t k + Γ ECM t   1 + ε t
In Equation (4), Γ is the coefficient of the ECM describing the short-run dynamics.
The ECM elucidates the system’s speed in returning to long-term equilibrium after a short-term shock. The error correction coefficient, following the guidelines in [48], should be significant and fall within [ 2, 0]. A value in [ 1, 0] signals a monotonic adjustment, while [ 2, 1] suggests a damped equilibrium process, with fluctuations around the long-run value during the error correction. The ARDL-ECM model’s robustness is gauged through diagnostic tests, including examinations for serial correlation, heteroscedasticity, and the Jarque–Bera normality criteria. Model stability is tested using the cumulative sum (CUSUM) test [49]. A plot within the 5% critical threshold indicates the model’s parameter stability. VD and IRFs are significant in an ARDL model, revealing evolving patterns and showcasing how changes in the independent variables impact the dependent one. Stability requires that the IRFs approach zero progressively. The IRFs aid in predicting shock outcomes and guiding policy interventions. Forecast error variance decomposition shows the contribution of various impulses to observed variable variability.
Table 2 contains descriptive statistics of the original data. One notices that all the variables are normally distributed, according to the probabilities of the Jarque–Bera test. All four variables included in the study have platykurtic distributions. All the variables have the skewness between 0.5 and 0.5; therefore, they are symmetric. We work with logarithmized absolute-valued time series since log transformation is effective in stabilizing the variance of a time series and in reducing the impact of extreme values.
Before checking the ARDL bounds test, one needs to check the data stationarity.
The aim of testing data stationarity is to determine whether the set of variables exhibits consistent statistical properties over time, i.e., their mean and variance remain stable over time.
By applying the ADF unit root test to the level and first difference, one finds that all the variables are integrated I (1), as shown in Table 3.
The next step is to determine the suitable lag configuration of the model, as seen in Table 4; four out of five lag order selection criteria indicate that the optimal lag number is 3.
The cointegration bounds test is executed in Table 5 to examine the existence of long-term causality. Since F is calculated as 17.88, which is greater than the critical upper bound I (1), it means we have cointegration among the variables. The chosen model for this analysis is ARDL (1,3,2,2). Therefore, n = 1, p = 3, q = 2, r = 2 in Formula (4).
From Table 6, one notices that GMW and RMW have positive long-run impacts on COE. An increase in GMW by 1% will increase COE by 0.57%. Actually, this relation is not direct. Various factors are considered in this connection. The composition of municipal waste matters. If the waste contains organic materials, they decompose and produce methane (CH4), which is a GHG. If the waste is incinerated, it releases CO2 and other GHGs in the atmosphere. Increased waste generation is linked to increased consumption of resources, such as raw materials, water, and energy. The production and transportation of these resources can raise COE. Rising per capita waste generation could suggest shifts in consumer habits, like a greater demand for disposable goods and excessive packaging. This behavior plays a role in amplifying waste quantities and the amount of COE associated with the production and disposal of these items.
An increase in RMW by 1% will increase COE by 0.06%, which is an insignificant amount. According to [50], using the material recovery and the specific processes, recycling also creates COE; thermal and material recycling can result in CO2 surplus or reduction. A similar positive relation was obtained by the authors of [51], who investigated the recycling process of steel, plastic, and paper in China. The authors found that recycling these materials had an adverse environmental effect, increasing COE. Also, the findings of [52] lead to the conclusion that chemical recycling technology is unlikely to result in a reduction in fossil resource consumption or GHGs. This is due to the fact that the relatively minimal environmental impacts of these technologies are greater than those associated with the existing standard waste treatment methods.
An increase in GDP by 1% will decrease COE by 0.18%. Usually, this relation between GDP and COE is positive, due to higher energy consumption and economic activity. However, the achievement of economic growth while simultaneously reducing or offsetting COE is called “decoupling” or “green growth”. This approach involves using more sustainable technologies, increasing energy efficiency and the transition to cleaner energy sources. The same result was obtained by the authors of [53], who studied the CO2 determinants for Romania during 2000–2020, and by [54] in a study on Finland. Ref. [2] reported the same process of decoupling economic progress from the consumption of finite resources, in this case forested areas. In [55], the authors obtained a negative relationship between GDP and forest area growth in a recent study on Finland, as land is used for urbanization and industrial activities.
Several studies have explored the related dynamics. Blagoeva et al. [56] analyze the relationship between municipal solid waste generation and GDP and show how recycling rates can mitigate CO2 emissions in Bulgaria, compared to other EU countries. Binsuwadan et al. [57] explored the relationship between CE practices and economic growth in Gulf Cooperation Council (GCC) countries, using ARDL to assess the impact of CE indicators on economic performance. The study covered aspects such as recycling and waste management, with the ARDL model proving useful for identifying both short-run and long-run relationships.
Table 7 reports the outcomes of the ARDL-ECM model. ECT is −1.21; thus, it belongs to the interval [−2, −1] and is statistically significant. This means that the error correction process has fluctuations that decrease over time, gravitating towards the long-time value [58]. The speed of adjustment to the long-run equilibrium following a short-term deviation is 121%. The short-run dynamics of GMW and RMW are mixed. In the short run, GDP positively impacts COE due to increased energy demand and the existing infrastructure and technology. In the short term, the Romanian economy relies on the existing infrastructure and technology, which may not be the most energy-efficient or environmentally friendly. The overall impact of the explanatory variables explains 95% of the variability observed in COE, as shown by the adjusted R-squared value.
The null hypotheses of four diagnostic tests along with their p-values are reported in Table 8. The p-values of the Breusch–Godfrey serial correlation LM test, the ARCH heteroscedasticity test, and the Jarque–Bera normality test exceed the 5% threshold level.
Furthermore, the Ramsey RESET test confirms the accurate specification of the model, affirming the absence of instability in the factors influencing COE.
The stability of the ARDL long-run and short-run parameters is further examined by applying the CUSUM test. The graph in Figure 5 indicates that the values of CUSUM remain within the critical boundaries at a 5% significance level.
Prior to delving into the exposition of the VD and IRF analysis, we ascertain the stability of the VAR model. From the chart in Figure 6, one can see that all the roots of the AR characteristic polynomial represented by blue dots are situated within the unit circle, thereby confirming the stability of the VAR model.
Next, we examine the response of one variable to change in another variable using the Cholesky IRFs, as presented in Figure 7. The IRFs exhibit similar trends, marked by initial fluctuations followed by diminishing oscillations toward zero. The exceptions are the following graphs: the responses of COE, RMW, GMW, and GDP to COE. These four graphs present higher fluctuations reverting to zero in the long run. Several factors can contribute to these slight fluctuations. The relationship between the four variables might be relatively stable. If the system has reached a stable equilibrium, changes in COE could lead to a proportional change in GDP, RMW, and GMW. In some cases, the impact on COE might not manifest immediately. The effects could be gradual and more long-term in nature. If regulations related to COE, waste management, and recycling remain constant, the responses might show less variability.
Variance decomposition (VD) quantifies how a shock to one variable influences the forecast error of another, aiding in predicting causality direction and strength [59]. Using Wolde–Rufael [60] VD offers an insight into the expected error variance for a series, which is explained by innovations from independent variables over distinct time spans. In the ARDL model (Table 9), variance decomposition analysis reveals each explanatory variable’s relative contribution to the long- and short-term variability of the dependent variable, based on parameter estimates. This analysis is conducted after the adjustment of the ARDL model to derive more results.
According to Table 9, in the initial year, COE is solely influenced by its own shocks, accounting for 100%. Over 5 to 20 periods, COE’s self-explanatory power decreases from 70.03% to 66.74%, indicating a substantial long-term self-influence. GDP’s impact grows to 9.89%, while GMW’s rises to 5.96% over 20 periods. However, RMW’s contribution becomes substantial at 17.38% in the 20th period, possibly due to other factors, such as direct impact on energy use and emissions and indirect effects on resource extraction. COE’s dominant contribution to GDP declines from 79.55% to 69.53% over 20 periods. RMW contributes 6.06% to GDP in the 20th period, while GMW’s contribution to GDP is the weakest at 3.50%. COE and GDP explain 74.46% and 13.47%, respectively, of GMW through their innovative shocks. When RMW is the dependent variable, the most significant contribution comes from RMW (52.80%), followed by GDP (28.14%) and GMW (10.12%). RMW’s direct ties with GMW imply that higher municipal waste generation requires greater recycling efforts. Economic activity and consumer patterns, reflected in GDP, directly influence GMW, contributing to municipal waste.

5. Discussion

This section aims to interpret the research results and discuss their implications from the perspective of integrating the CE into a complex cybernetics system. We analyze how the studied variables, such as CO2 emissions, GDP per capita, RMW, and GMW, interact in the context of the ARDL model, thus validating the proposed hypotheses. We also discuss the relevance of the results for public policy and long-term sustainability in Romania, providing a holistic view of the interdependencies between economic development and environmental protection. An analysis of the projected graphs and the historical decomposition technique provides a detailed insight into the contributions of each variable to the CO2 emissions variations and highlights the role of the CE in reducing environmental impacts.
This study provides a detailed and integrated analysis of the CE within a cybernetics framework, thus offering a novel perspective on the interdependencies among the analyzed variables in the context of CE integration in Romania. The study spans a significant period, from 2000 to 2022, providing a robust longitudinal analysis. This extended timeframe enhances the credibility of our conclusions and provides a detailed view of the evolution of the investigated phenomena. Our results demonstrate a successful decoupling of economic growth from environmental impact, emphasizing the relevance and applicability of CE practices in the Romanian context. To further strengthen our findings, we proceeded with the forecasting of the dependent variable and applied the historical decomposition using the Cholesky weights technique to analyze the contribution of each variable to COE variation.
We can observe in Figure 8 the forecast graph of the dependent variable COE. According to the performance metrics displayed in the graph, the root mean squared error (RMSE) has a value of 0.006, indicating a good precision of the model in estimating the data, and the mean absolute error (MAE) shows that the forecast differs by only 0.005 units from the actual values. Additionally, the mean absolute percentage error (MAPE) value of 1.86% emphasizes the model’s good accuracy. The covariance proportion has a value of 99%, confirming that the model efficiently captures the relationships between these variables. The inequality coefficient gauges the precision of the forecast, ranging from 0 to 1, where a value of 0 signifies a flawless prediction. In this instance, the Theil inequality coefficient is 0.21, indicating a good level of forecast accuracy.
Historical decomposition using Cholesky weights is a technique used particularly in the context of VAR models, to understand the contribution of each shock to the historical movements of variables [61]. In Figure 9, the manner in which the independent variables contribute to the observed variations in the dependent variable COE was depicted. The baseline represents the baseline level of COE before applying certain macroeconomic shocks or the influences of independent variables. The subsequent variations in COE are illustrated on the graph, representing changes in COE over time. Given that the actuals and baseline do not follow an identified trend, this aspect confirms that independent variables have a significant influence on COE.
Considering the National Strategy for the CE in Romania, published in 2022 and set to be adopted at the end of 2023 [62], our study contributes to the specialized literature in Romania regarding research on the transition from a linear economy to a CE. Furthermore, given that the EU promotes the CE and the EU Ecolabel encourages producers to generate less waste and CO2 during the manufacturing process and to develop sustainable, easily repairable, and recyclable products, we believe that our study is highly relevant.
Regarding the connection between the cybernetics system described in Figure 1 and the impact of CO2 emissions on the activities of the identified actors, Figure 2 outlines the formed feedback interactions and control points. The variables selected in the ARDL model were chosen considering the holistic perspective provided by the described cybernetic system. Regarding the GDP variable in the ARDL model, an increase in real GDP per capita can reflect economic growth and an increase in consumption, which can affect how waste is generated and managed. A cybernetics system could help monitor and regulate how this economic growth interacts with responsible production and consumption practices. Additionally, the GMW variable is understood by the amount of waste generated per capita, which can affect environmental sustainability. A cybernetics system can assist in analyzing and optimizing production, consumption, and waste management practices to reduce per capita waste generation. Also, a higher RMW rate can contribute to the reduction in the environmental impact. The cybernetics system can intervene to monitor and improve the efficiency of recycling processes, thereby influencing the level of recycling and waste management. In essence, the cybernetics system can contribute to the optimization of the interactions between these variables, ensuring a more efficient and sustainable approach to production, consumption, and waste management in a CE.
In terms of the ARDL model, diagnostic tests for short-term ARDL were performed in the measurement testing process. This was a deliberate choice based on the specific objective of the analysis. The ARDL model is well suited to capture both short- and long-term relationships between the dependent variable (CO2 emissions) and the independent variables. The omission of temporal fixed effects and temporal trends could make the model susceptible to omitted variable errors if there are temporal factors influencing CO2 emissions that are not accounted for. For example, unobserved factors such as technological advances or policy changes over time may affect the relationship between the variables [63].
This research addresses significant gaps in the understanding of the role of CE practices in mitigating carbon emissions in Romania, by means of the cybernetics systems approach. While previous studies have primarily focused on general sustainability measures, there is limited research examining the specific relationship between CE indicators (such as waste management and recycling) and environmental outcomes like CO2 emissions in Romania. This study fills that gap by analyzing the variables, GDP per capita, CO2 emissions, municipal waste generation, and recycling rates over a 22-year period, providing a more nuanced understanding of how economic growth and environmental sustainability can be decoupled.
The findings of this study can be applied to other areas: policy making and strategic planning, corporate environmental responsibility, sustainable urban development, and environmental economics. The insights gained from this research can inform government policies and strategies aimed at integrating CE practices with sustainable development goals. The use of the ARDL model in a cybernetics system could help policymakers design adaptive frameworks that promote long-term sustainability. Companies aiming to reduce their environmental impact can use the study’s findings to evaluate how waste management and recycling practices influence carbon emissions. This could guide more sustainable operational practices, resource efficiency, and responsible waste generation. The results can also contribute to urban planning, where waste management and recycling programs are important to reduce the environmental footprint of cities. Circular urban models can be developed starting from this study. The decoupling of economic growth from environmental degradation, highlighted in this study, can be further explored in the field of environmental economics. The approach could be used to assess similar dynamics in other countries or regions pursuing CE transitions.

6. Conclusions and Policy Recommendations

Romania is well positioned to embrace a CE, presenting an opportunity for substantial carbon emission reduction. This transition involves swiftly adopting sustainable production models, fostering recycling, and enhancing the waste management infrastructure. With dedicated commitment and cooperation across sectors, both public and private, Romania can significantly curtail its carbon footprint, aligning with global climate change mitigation goals. Beyond environmental benefits, this circular shift can fortify the national economy, rendering it more resilient to market fluctuations and resource dynamics.
The comprehensively designed cybernetics system for the CE provides a comprehensive overview of the interactions and dynamics within this ecosystem. Serving as a valuable tool, this system elucidates how various actors, material flows, and feedback loops influence key variables like production, consumption, investments, and environmental outcomes. Decision makers can leverage this dynamic model to explore scenarios and understand the potential impact of their choices, facilitating informed decisions that promote recycling, reuse, and resource efficiency. Enterprises can develop more effective strategies by designing products for circularity and efficient waste management. The system aids progress monitoring and reporting, highlighting the areas requiring improvement and streamlining the integration and transition strategies in Romania.
This approach enables rapid adaptation to environmental changes, enhances efficiency, optimizes decision making, and aids in achieving environmental objectives. By providing a holistic perspective, the dynamic system fosters coordination among CE sectors, contributing to a more efficient ecosystem. It becomes an important tool for promoting sustainable practices and efficient resource use for environmental and societal benefit.
In the study, the ARDL model examined the COE, GDP, GMW, and RMW relations for Romania during 2000–2022. The long-term findings revealed that GMW and RMW positively impact COE, while GDP negatively affects COE. Variance decomposition and impulse response functions assessed the explanatory variables’ impact on COE and their capacity to explain fluctuations.
The application of the ARDL model to CE indicators to understand the dynamic relationships over time acknowledges the cybernetics principles of feedback and control within the CE system. The integration of these concepts can provide valuable insights for policymakers and businesses aiming to enhance circularity in economic systems.
However, the study has limitations due to a short time series, the unavailability of more recent data, and potential statistical issues. Secondly, it is influenced by factors such as multicollinearity and the statistical insignificance of certain variables incorporated into the model. Pesaran et al. [43] conducted F-test statistics estimation for ARDL models, advocating for n > 30, though some researchers may accept n > 20, where n is the number of periods. Models with smaller n are deemed less effective in capturing lagged variables due to the associated loss of degrees of freedom. Future research could extend this by including temporal fixed effects or time trends to control for unobserved temporal factors. In addition, other control variables could be incorporated into more comprehensive models to capture additional factors that may influence CO2 emissions.
According to Kirchherr et al. [64], there are several practical implications of the CE concept. A CE requires a significant systemic transformation, especially in relation to current supply chains. A CE is viewed not as a final objective, but as a pathway to achieve sustainable development. A CE model should balance environmental sustainability with economic growth. A wide-ranging coalition of stakeholders, including consumers and producers, is essential for driving the transition to a CE, which could add complexity to the implementation of CE strategies.
Based on the above findings, some policies could be formulated. Romania should prioritize investments in advanced recycling technologies and waste management systems to improve the recycling rate and reduce waste generation. Policies could incentivize businesses and households to increase recycling efforts through tax benefits or subsidies for adopting sustainable waste practices. Romania could introduce regulations that require companies to adopt circular production processes, such as material recovery and reuse, to reduce their environmental footprint. Educational programs aimed at citizens, schools, and businesses could emphasize the benefits of reducing consumption, recycling, and adopting sustainable practices at all levels of society. Supporting innovation in sectors such as bioenergy, clean manufacturing, and eco-design could accelerate the transition to a low-carbon economy. Policymakers should adopt stricter regulations on municipal waste generation and disposal.
Despite this, policymakers should endorse business strategies supporting the transition to a CE, promoting recycling, and incentivizing sustainable practices to achieve emissions reduction goals. Future studies should aim to develop a more complex dynamic system, capturing a broader range of CE actors, relationships, and interactions, contributing to informed decisions for Romania’s circular integration. Also, future research could expand upon the investigation of the viability of biomass energy systems. This approach has the advantages of cost reduction and pollution mitigation.

Author Contributions

Conceptualization, I.G., I.N. and C.D.; methodology, I.G., I.N. and N.C.; software, I.G. and I.N.; validation, C.D., C.C. and N.C.; formal analysis, I.G. and I.N.; investigation, I.G., I.N., C.D., C.C. and N.C.; resources, I.G.; data curation, C.C. and N.C.; writing—original draft preparation, I.G. and I.N.; writing—review and editing, I.N., C.D., C.C. and N.C.; visualization, I.G., I.N., C.D., C.C. and N.C.; supervision, I.G., I.N. and C.D.; project administration, C.D. All authors have read and agreed to the published version of the manuscript.

Funding

This research received no external funding.

Institutional Review Board Statement

Not applicable.

Informed Consent Statement

Not applicable.

Data Availability Statement

The data presented in this study are available on request from the corresponding author.

Acknowledgments

This work was funded by Bucharest University of Economic Studies under the project “Modeling and Analysis the Circular Economy in the Context of Sustainable Development using Emerging Technologies—2024”.

Conflicts of Interest

The authors declare no conflicts of interest.

Abbreviations

AcronymDefinition
CECircular Economy
COECO2 emissions
GHGsGreenhouse gases
MSWMunicipal solid waste
GDPGross Domestic Product
GMWGeneration of municipal waste per capita
RMWRecycling rate of municipal waste
CASComplex Adaptive Systems
ECMError Correction Model
CUSUMCumulative sum
IFRsImpulse response functions
EKCEnvironmental Kuznets Curve
VDVariance Decomposition
AICAkaike Information Criterion
ADFAugmented Dickey–Fuller
FPEFinal prediction error
SCSchwarz information criterion
HQHannan–Quinn information criterion
SCRSerial Correlation
HEHeteroscedasticity
NONormal distribution
RRRamsey RESET test

References

  1. Hailemariam, A.; Erdiaw-Kwasie, M.O. Towards a Circular Economy: Implications for Emission Reduction and Environmental Sustainability. Bus. Strategy Environ. 2023, 32, 1951–1965. [Google Scholar] [CrossRef]
  2. Rădulescu, C.V.; Bran, F.; Ciuvăț, A.L.; Bodislav, D.A.; Buzoianu, O.C.; Ștefănescu, M.; Burlacu, S. Decoupling the Economic Development from Resource Consumption: Implications and Challenges in Assessing the Evolution of Forest Area in Romania. Land 2022, 11, 1097. [Google Scholar] [CrossRef]
  3. Tiwari, S.; Si Mohammed, K.; Mentel, G.; Majewski, S.; Shahzadi, I. Role of Circular Economy, Energy Transition, Environmental Policy Stringency, and Supply Chain Pressure on CO2 Emissions in Emerging Economies. Geosci. Front. 2023, 15, 101682. [Google Scholar] [CrossRef]
  4. Deutz, P. Circular Economy. In International Encyclopedia of Human Geography; Elsevier: Amsterdam, The Netherlands, 2020; pp. 193–201. ISBN 978-0-08-102296-2. [Google Scholar]
  5. European Environment Agency. Available online: https://circulareconomy.europa.eu/platform/sites/default/files/circular_by_design_-_products_in_the_circular_economy.pdf (accessed on 9 March 2024).
  6. Magazzino, C.; Mele, M.; Schneider, N.; Sarkodie, S.A. Waste Generation, Wealth and GHG Emissions from the Waste Sector: Is Denmark on the Path towards Circular Economy? Sci. Total Environ. 2021, 755, 142510. [Google Scholar] [CrossRef]
  7. European Parliament Circular Economy: Definition, Importance and Benefits. Available online: https://www.europarl.europa.eu/topics/en/article/20151201STO05603/circular-economy-definition-importance-and-benefits (accessed on 8 April 2024).
  8. European Commission the European Green Deal. Available online: https://commission.europa.eu/strategy-and-policy/priorities-2019-2024/european-green-deal_en (accessed on 9 June 2024).
  9. European Commission Circular Economy Action Plan. Available online: https://environment.ec.europa.eu/strategy/circular-economy-action-plan_en (accessed on 9 August 2024).
  10. Piciu, G.C. The Role of Circular Economy in Mitigating Greenhouse Gas Emission. In Reimagining Capitalism in a Post-Globalization World; Fotea, S.L., Văduva, S.A., Fotea, I.Ş., Eds.; Springer Proceedings in Business and Economics; Springer Nature Switzerland: Cham, Switzerland, 2024; pp. 251–264. ISBN 978-3-031-59857-9. [Google Scholar]
  11. Mocanu, A.A.; Brătucu, G.; Ciobanu, E.; Chițu, I.B.; Szakal, A.C. Can the Circular Economy Unlock Sustainable Business Growth? Insights from Qualitative Research with Specialists in Romania. Sustainability 2024, 16, 2031. [Google Scholar] [CrossRef]
  12. Chiriță, N.; Georgescu, I. Cybernetics Analysis of the Circular Economy from Romania. In Proceedings of the 22nd International Conference on Informatics in Economy (IE 2023), Bucharest, Romania, 25–26 May 2023; Ciurea, C., Pocatilu, P., Filip, F.G., Eds.; Smart Innovation, Systems and Technologies. Springer Nature Singapore: Singapore, 2024; Volume 367, pp. 319–330, ISBN 978-981-9969-59-3. [Google Scholar]
  13. Magazzino, C.; Mele, M.; Schneider, N. The Relationship between Municipal Solid Waste and Greenhouse Gas Emissions: Evidence from Switzerland. Waste Manag. 2020, 113, 508–520. [Google Scholar] [CrossRef] [PubMed]
  14. Georgescu, I.; Kinnunen, J.; Androniceanu, A.-M. Empirical evidence on circular economy and economic development in Europe: A panel approach. J. Bus. Econ. Manag. 2022, 23, 199–217. [Google Scholar] [CrossRef]
  15. Bâra, A.; Oprea, S.-V.; Oprea, N. How Fast to Avoid Carbon Emissions: A Holistic View on the RES, Storage and Non-RES Replacement in Romania. Int. J. Environ. Res. Public Health 2023, 20, 5115. [Google Scholar] [CrossRef]
  16. Bucur, C.; Tudorica, B.G.; Oprea, S.-V.; Nancu, D.; Dusmanescu, D.M. Insights Into Energy Indicators Analytics Towards European Green Energy Transition Using Statistics and Self-Organizing Maps. IEEE Access 2021, 9, 64427–64444. [Google Scholar] [CrossRef]
  17. Bâra, A.; Oprea, S.-V.; Georgescu, I.A. Understanding electricity price evolution—Day-ahead market competitiveness in Romania. J. Bus. Econ. Manag. 2023, 24, 221–244. [Google Scholar] [CrossRef]
  18. Schwarz, A.E.; Ligthart, T.N.; Godoi Bizarro, D.; De Wild, P.; Vreugdenhil, B.; Van Harmelen, T. Plastic Recycling in a Circular Economy; Determining Environmental Performance through an LCA Matrix Model Approach. Waste Manag. 2021, 121, 331–342. [Google Scholar] [CrossRef] [PubMed]
  19. Razzaq, A.; Sharif, A.; Najmi, A.; Tseng, M.-L.; Lim, M.K. Dynamic and Causality Interrelationships from Municipal Solid Waste Recycling to Economic Growth, Carbon Emissions and Energy Efficiency Using a Novel Bootstrapping Autoregressive Distributed Lag. Resour. Conserv. Recycl. 2021, 166, 105372. [Google Scholar] [CrossRef]
  20. Tcvetkov, P.; Cherepovitsyn, A.; Fedoseev, S. The Changing Role of CO2 in the Transition to a Circular Economy: Review of Carbon Sequestration Projects. Sustainability 2019, 11, 5834. [Google Scholar] [CrossRef]
  21. Gallego-Schmid, A.; Chen, H.-M.; Sharmina, M.; Mendoza, J.M.F. Links between Circular Economy and Climate Change Mitigation in the Built Environment. J. Clean. Prod. 2020, 260, 121115. [Google Scholar] [CrossRef]
  22. Bayar, Y.; Gavriletea, M.D.; Sauer, S.; Paun, D. Impact of Municipal Waste Recycling and Renewable Energy Consumption on CO2 Emissions across the European Union (EU) Member Countries. Sustainability 2021, 13, 656. [Google Scholar] [CrossRef]
  23. Vermeșan, H.; Mangău, A.; Tiuc, A.-E. Perspectives of Circular Economy in Romanian Space. Sustainability 2020, 12, 6819. [Google Scholar] [CrossRef]
  24. Topliceanu, L.; Puiu, P.G.; Drob, C.; Topliceanu, V.V. Analysis Regarding the Implementation of the Circular Economy in Romania. Sustainability 2022, 15, 333. [Google Scholar] [CrossRef]
  25. Dobre-Baron, O.; Nițescu, A.; Niță, D.; Mitran, C. Romania’s Perspectives on the Transition to the Circular Economy in an EU Context. Sustainability 2022, 14, 5324. [Google Scholar] [CrossRef]
  26. Botezat, E.; Dodescu, A.; Văduva, S.; Fotea, S. An Exploration of Circular Economy Practices and Performance among Romanian Producers. Sustainability 2018, 10, 3191. [Google Scholar] [CrossRef]
  27. Nica, I.; Chiriță, N.; Delcea, C. Towards a Sustainable Future: Economic Cybernetics in Analyzing Romania’s Circular Economy. Sustainability 2023, 15, 14433. [Google Scholar] [CrossRef]
  28. Potârniche, M.E.; Giucă, A.D.; Stoica, G.D.; Sterie, C.M. The Circular Economy in Romania and in the EU Member States. Proc. Int. Conf. Bus. Excell. 2022, 16, 409–419. [Google Scholar] [CrossRef]
  29. Burlacu, S.; Bran, F.; Rădulescu, C.V.; Bodislav, D.A. The Circular Economy—Romania’s Paradigm from the Perspective of EU Principles and Directions for 2050. Proc. Int. Conf. Bus. Excell. 2022, 16, 278–284. [Google Scholar] [CrossRef]
  30. Barna, C.; Zbuchea, A.; Stănescu, S.M. Social Economy Enterprises Contributing to the Circular Economy and the Green Transition in Romania. Ciriec-España 2023, 107, 47–69. [Google Scholar] [CrossRef]
  31. Lacko, R.; Hajduová, Z.; Dula, R. Development of Environmental Performance and Circular Economy in the European Union Countries: The Case of “Post-2004” Members. Front. Environ. Sci. 2024, 12, 1467370. [Google Scholar] [CrossRef]
  32. Musa, K.; Tufail, S.; Erum, N.; Said, J.; Mustaffa, A.H. Impact of the Circular Economy on Ecological Footprint: Evidence from Germany. Environ. Sci. Pollut. Res. 2024. [Google Scholar] [CrossRef]
  33. Erdiaw-Kwasie, M.O.; Owusu-Ansah, K.K.; Abunyewah, M.; Alam, K.; Hailemariam, A.; Arhin, P.; Zander, K.K.; Lassa, J. Circular Economy, Environmental Quality and Tourism Receipts in Europe: A Time Series Data Analysis. PLoS ONE 2023, 18, e0288098. [Google Scholar] [CrossRef]
  34. Sasmoko; Zaman, K.; Malik, M.; Awan, U.; Handayani, W.; Jabor, M.K.; Asif, M. Environmental Effects of Bio-Waste Recycling on Industrial Circular Economy and Eco-Sustainability. Recycling 2022, 7, 60. [Google Scholar] [CrossRef]
  35. Nica, I.; Chirita, N. Holistic Approach of Complex Adaptive Systems. Theory, Applications and Case Studies; LAP Lambert Academic Publishing: Saarbrucken, Germany, 2021; ISBN 978-620-3-30709-2. [Google Scholar]
  36. Korhonen, J. The Circular Economy as a Complex Adaptive System. In Handbook of the Circular Economy; Brandão, M., Lazarevic, D., Finnveden, G., Eds.; Edward Elgar Publishing: Cheltenham, UK, 2020; ISBN 978-1-78897-272-7. [Google Scholar]
  37. Guzzo, D.; Pigosso, D.C.A.; Videira, N.; Mascarenhas, J. A System Dynamics-Based Framework for Examining Circular Economy Transitions. J. Clean. Prod. 2022, 333, 129933. [Google Scholar] [CrossRef]
  38. Rios, F.C.; Panic, S.; Grau, D.; Khanna, V.; Zapitelli, J.; Bilec, M. Exploring Circular Economies in the Built Environment from a Complex Systems Perspective: A Systematic Review and Conceptual Model at the City Scale. Sustain. Cities Soc. 2022, 80, 103411. [Google Scholar] [CrossRef]
  39. Wiener, N. Cybernetics or Control and Communication in the Animal and the Machine; The MIT Press: Cambridge, MA, USA, 2019; ISBN 978-0-262-35590-2. [Google Scholar]
  40. Herbert, S. The Architecture of Complexity. Proc. Am. Philos. Soc. 1962, 106, 467–482. [Google Scholar]
  41. Awewomom, J.; Dzeble, F.; Takyi, Y.D.; Ashie, W.B.; Ettey, E.N.Y.O.; Afua, P.E.; Sackey, L.N.A.; Opoku, F.; Akoto, O. Addressing Global Environmental Pollution Using Environmental Control Techniques: A Focus on Environmental Policy and Preventive Environmental Management. Discov. Environ. 2024, 2, 8. [Google Scholar] [CrossRef]
  42. Pesaran, M.H.; Shin, Y. An Autoregressive Distributed-Lag Modelling Approach to Cointegration Analysis. In Econometrics and Economic Theory in the 20th Century: The Ragnar Frisch Centennial Symposium; Strøm, S., Ed.; Cambridge University Press: New York, NY, USA, 1998; pp. 371–413. ISBN 978-0-521-63323-9. [Google Scholar]
  43. Pesaran, M.H.; Shin, Y.; Smith, R.J. Bounds Testing Approaches to the Analysis of Level Relationships. J. Appl. Econom. 2001, 16, 289–326. [Google Scholar] [CrossRef]
  44. Nkoro, E.; Uko, A.K. Autoregressive Distributed Lag (ARDL) Cointegration Technique: Application and Interpretation. J. Stat. Econom. Methods 2016, 5, 63–91. [Google Scholar]
  45. Portet, S. A Primer on Model Selection Using the Akaike Information Criterion. Infect. Dis. Model. 2020, 5, 111–128. [Google Scholar] [CrossRef] [PubMed]
  46. Grossman, G.; Krueger, A. Environmental Impacts of a North American Free Trade Agreement; National Bureau of Economic Research: Cambridge, MA, USA, 1991; p. w3914. [Google Scholar]
  47. Ayodele, B.V.; Mustapa, S.I.; Alsaffar, M.A.; Vo, D.-V.N. Sustainable Utilization of CO2 toward a Circular Economy: Prospects, Challenges, and Opportunities. In Carbon Dioxide Capture and Conversion; Elsevier: Amsterdam, The Netherlands, 2022; pp. 17–36. ISBN 978-0-323-85585-3. [Google Scholar]
  48. Narayan, P.K.; Smyth, R. What determines migration flows from low-income to high-income countries? An empirical investigation of Fiji–U.S. migration 1972–2001. Contemp. Econ. Policy 2006, 24, 332–342. [Google Scholar] [CrossRef]
  49. Brown, R.L.; Durbin, J.; Evans, J.M. Techniques for Testing the Constancy of Regression Relationships Over Time. J. R. Stat. Soc. Ser. B Stat. Methodol. 1975, 37, 149–163. [Google Scholar] [CrossRef]
  50. Unegg, M.C.; Steininger, K.W.; Ramsauer, C.; Rivera-Aguilar, M. Assessing the Environmental Impact of Waste Management: A Comparative Study of CO2 Emissions with a Focus on Recycling and Incineration. J. Clean. Prod. 2023, 415, 137745. [Google Scholar] [CrossRef]
  51. Cudjoe, D.; Wang, H.; Zhu, B. Assessment of the Potential Energy and Environmental Benefits of Solid Waste Recycling in China. J. Environ. Manag. 2021, 295, 113072. [Google Scholar] [CrossRef]
  52. Meys, R.; Frick, F.; Westhues, S.; Sternberg, A.; Klankermayer, J.; Bardow, A. Towards a Circular Economy for Plastic Packaging Wastes—The Environmental Potential of Chemical Recycling. Resour. Conserv. Recycl. 2020, 162, 105010. [Google Scholar] [CrossRef]
  53. Androniceanu, A.; Georgescu, I.; Nica, I.; Chiriță, N. A Comprehensive Analysis of Renewable Energy Based on Integrating Economic Cybernetics and the Autoregressive Distributed Lag Model—The Case of Romania. Energies 2023, 16, 5978. [Google Scholar] [CrossRef]
  54. Georgescu, I.; Kinnunen, J. The Role of Foreign Direct Investments, Urbanization, Productivity, and Energy Consumption in Finland’s Carbon Emissions: An ARDL Approach. Environ. Sci. Pollut. Res. 2023, 30, 87685–87694. [Google Scholar] [CrossRef]
  55. Georgescu, I.; Kinnunen, J.; Nica, I. Assessing Forest Conservation for Finland: An ARDL-Based Evaluation. Sustainability 2024, 16, 612. [Google Scholar] [CrossRef]
  56. Blagoeva, N.; Georgieva, V.; Dimova, D. Relationship between GDP and Municipal Waste: Regional Disparities and Implication for Waste Management Policies. Sustainability 2023, 15, 15193. [Google Scholar] [CrossRef]
  57. Binsuwadan, J.; Yousif, G.; Abdulrahim, H.; Alofaysan, H. The Role of the Circular Economy in Fostering Sustainable Economic Growth in the GCC. Sustainability 2023, 15, 15926. [Google Scholar] [CrossRef]
  58. Too, H.K.; Bett, H.K.; Gitau, R. What Explains the Trends of Wheat Imports in Kenya; A Cointegration Analysis Using ARDL-ECM Modelling. J. Econ. Sustain. Dev. 2021, 12, 6–98. [Google Scholar] [CrossRef]
  59. Wolde-Rufael, Y. The defence spending–external debt nexus in Ethiopia. Def. Peace Econ. 2009, 20, 423–436. [Google Scholar] [CrossRef]
  60. Sims, C.A. Macroeconomics and Reality. Econometrica 1980, 48, 1–48. [Google Scholar] [CrossRef]
  61. Osinsky, A.; Bychkov, R.; Trefilov, M.; Lyashev, V.; Ivanov, A. Regularization for Cholesky Decomposition in Massive MIMO Detection. IEEE Wirel. Commun. Lett. 2023, 12, 1603–1607. [Google Scholar] [CrossRef]
  62. European Union National Strategy for the Circular Economy in Romania. Available online: https://circulareconomy.europa.eu/platform/en/strategies/national-strategy-circular-economy-romania (accessed on 18 December 2023).
  63. Chang, Z.; Jiao, Y.; Wang, X. Influencing the Variable Selection and Prediction of Carbon Emissions in China. Sustainability 2023, 15, 13848. [Google Scholar] [CrossRef]
  64. Kirchherr, J.; Yang, N.-H.N.; Schulze-Spüntrup, F.; Heerink, M.J.; Hartley, K. Conceptualizing the Circular Economy (Revisited): An Analysis of 221 Definitions. Resour. Conserv. Recycl. 2023, 194, 107001. [Google Scholar] [CrossRef]
Figure 1. CE as a cybernetics system.
Sustainability 16 08248 g001
Figure 2. Interactions and feedback mechanisms impacting C O 2 emissions in the CE (source: authors computation).
Sustainability 16 08248 g002
Figure 3. ARDL model development and validation workflow diagram.
Sustainability 16 08248 g003
Figure 4. The trend of variables.
Sustainability 16 08248 g004
Figure 5. Plot of CUSUM for coefficients’ stability of ARDL model at 5% level of significance.
Sustainability 16 08248 g005
Figure 6. Inverse roots of AR characteristic polynomial.
Sustainability 16 08248 g006
Figure 7. Impulse response functions.
Sustainability 16 08248 g007
Figure 8. COE forecast.
Sustainability 16 08248 g008
Figure 9. Historical decomposition using Cholesky weights.
Sustainability 16 08248 g009
Table 1. Variables and sources.
VariableAcronymMeasurement UnitSource
Annual CO2 emissions (per capita)COEMetric tons per capitaWorld Bank
Real GDP per capitaGDPConstant 2015 USDWorld Bank
Generation of municipal waste per capitaGMWKilograms per capitaEurostat
Recycling rate of municipal wasteRMW%Eurostat
Table 2. Descriptive statistics.
COEGDPGMWRMW
Mean1.3898588195.056314.85217.543478
Median1.3767898234.30530211.3
Maximum1.54397811,670.1441114.8
Minimum1.2691274567.24246.59740
Std. Dev.0.0963882178.58457.823175.971510
Skewness0.2672410.0222560.251110−0.127223
Kurtosis1.6256162.0109251.4993701.152229
Jarque–Bera2.0839940.9394082.3997793.492877
Probability0.3527500.6251870.3012270.177917
Table 3. ADF unit root test.
VariablesLevelFirst DifferenceOrder of Integration
T-StatisticsT-Statistics
COE 1.07 (0.705) 4.39 *** (0.002)I (1)
GDP 1.91 (0.320) 3.82 *** (0.009)I (1)
GMW 1.05 (0.713) 2.88 * (0.063)I (1)
RMW 1.44 (0.539) 5.46 *** (0.000)I (1)
*, *** indicate the significance of variables at 10% and 1% levels, respectively.
Table 4. VAR lag order selection criteria.
LagLogLLRFPEAICSCHQ
039.91NA 2.68 × 10 7 3.78 3.58 3.74
1105.1296.09 1.59 × 10 9 8.96 7.96 8.79
2144.0640.99 * 1.87 × 10 10 11.37 9.58 11.07
3170.9716.99 1.45 × 10 10 12.52 * 9.93 * 12.08 *
* indicates the lag order selected by the criterion; LR: sequential modified LR test statistic (each test at 5% level); FPE: final prediction error; AIC: Akaike information criterion; SC: Schwarz information criterion; HQ: Hannan–Quinn information criterion.
Table 5. Results of cointegration bounds test.
Test StatisticValueK (Number of Regressors)
F-statistic17.883
Critical value bounds (Finite sample n = 30)
SignificanceI (0)I (1)
10%2.673.59
5%3.274.30
1%4.615.96
Table 6. The long-run estimated coefficients.
VariablesCoefficientT-StatisticsProb.
GDP 0.18 5.140.000 ***
GMW0.575.720.000 ***
RMW0.063.500.008 ***
C 1.45 4.060.003 ***
*** indicate the significance of variables at 1% levels, respectively.
Table 7. Short-run ARDL approach.
VariableCoefficientT-StatisticsProb.
D (GDP)0.5713.250.000 ***
D (GDP (−1))0.787.250.000 ***
D (GDP (−2))0.243.580.007 ***
D (GMW)0.226.570.000 ***
D (GMW (−1)) 0.49 7.390.000 ***
D (RMW)0.013.480.008 ***
D (RMW (−1)) 0.02-0.550.000 ***
CointEq (−1) 1.21 11.580.000 ***
R-squared0.97
Adjusted R-squared0.95
*** indicate the significance of variables at 1% levels, respectively.
Table 8. Results of diagnostic and stability tests.
TestH0Decision Statistics [p-Value]
SC *There is no serial correlation
in the residuals
Accept H0
2.00 [0.214]
HE **There is no autoregressive
conditional heteroscedasticity
Accept H0
0.25 [0.622]
NO ***Normal distributionAccept H0
0.05 [0.971]
RR ****Absence of model
misspecification
Accept H0
3.14 [0.116]
SC *—serial correlation, HE **—heteroscedasticity, NO ***—normal distribution, RR ****—Ramsey RESET.
Table 9. Variance decomposition.
VariablePeriodCOEGDPGMWRMW
COE1100.000.000.000.00
570.035.144.3720.44
1071.476.625.5616.32
1568.578.295.3317.78
2066.749.895.9617.38
GDP179.5520.440.000.00
581.8713.430.554.13
1073.3418.122.895.63
1572.4818.992.925.59
2069.5320.893.506.06
GMW174.511.6623.820.00
580.6211.905.172.29
1079.6510.964.424.95
1578.8011.474.605.10
2076.4613.474.605.45
RMW147.664.048.1040.18
567.9718.379.554.09
1058.8923.308.847.95
1556.7325.969.727.56
2052.8028.1410.128.92
Disclaimer/Publisher’s Note: The statements, opinions and data contained in all publications are solely those of the individual author(s) and contributor(s) and not of MDPI and/or the editor(s). MDPI and/or the editor(s) disclaim responsibility for any injury to people or property resulting from any ideas, methods, instructions or products referred to in the content.

