

Spatial–Temporal Development Trends and Influencing Factors of Government Environmental Information Disclosure: Empirical Evidence Based on China’s Provincial Panel Data


Abstract
:1. Introduction
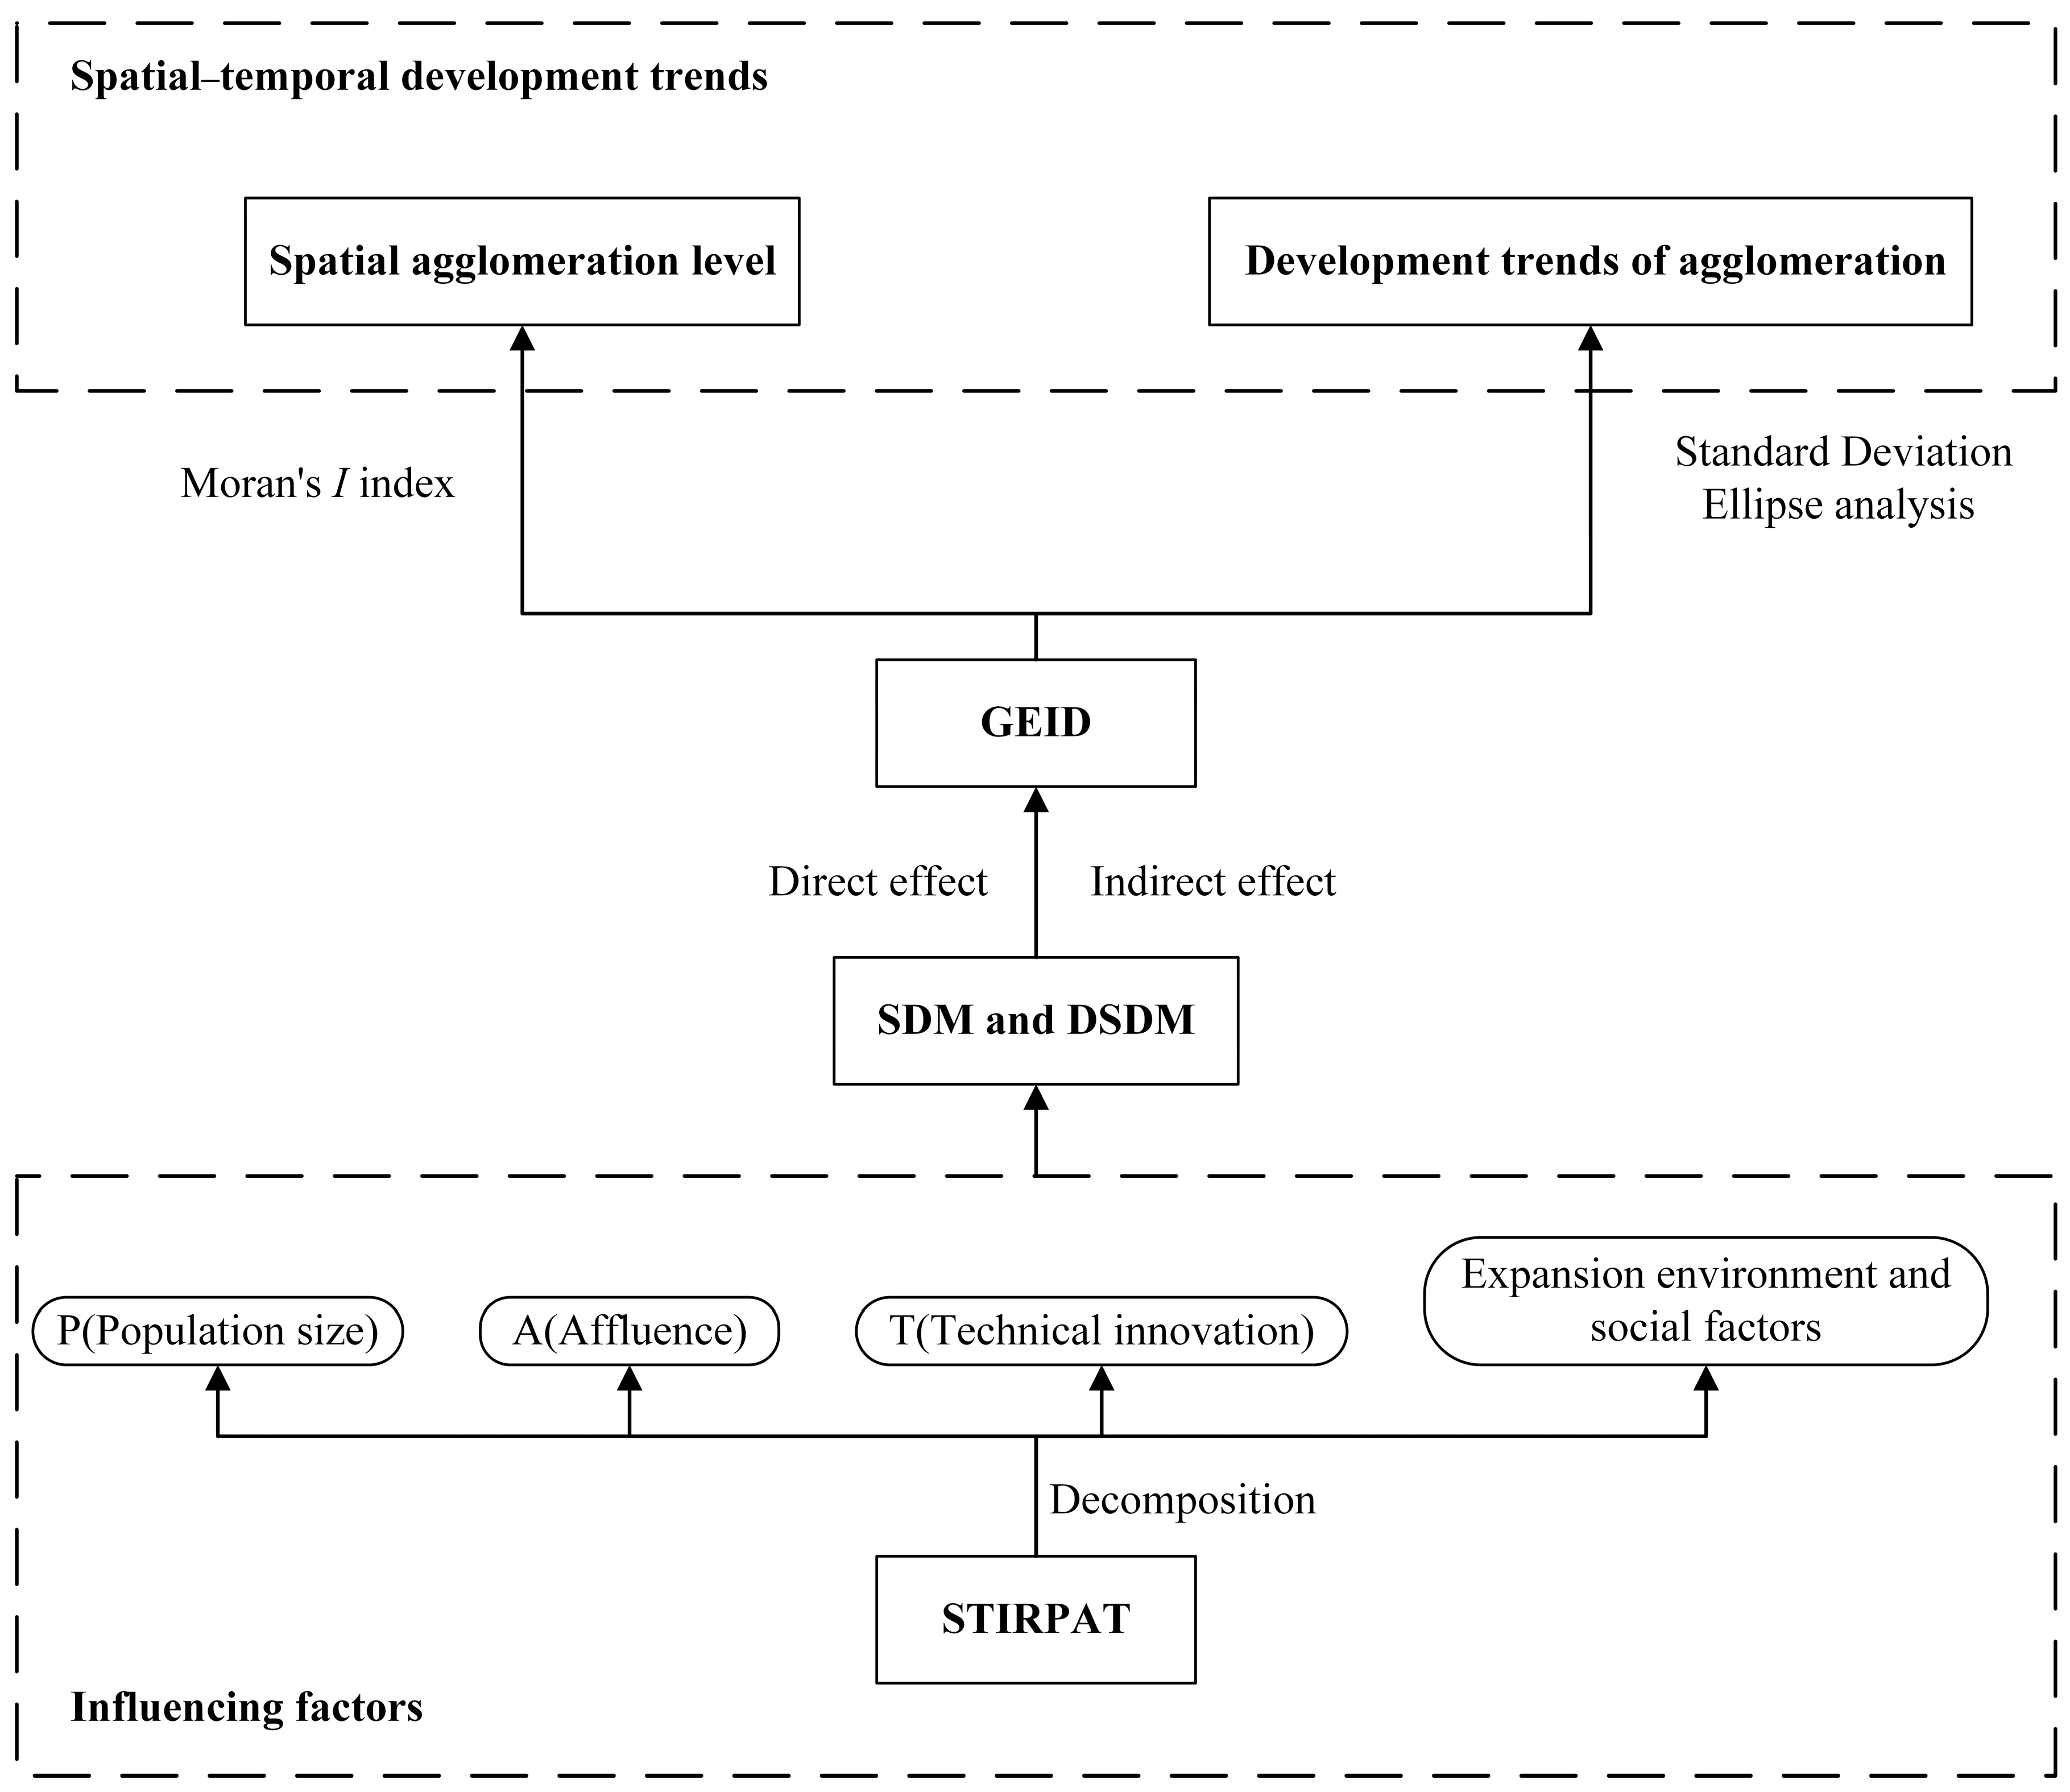
2. Methods and Data
2.1. Methods
2.1.1. STIRPAT Model Improvement and Variable Design
- (1)
- Population size. Previous studies have shown that population has a significant impact on the environment, which mainly includes three perspectives. The first perspective suggests that population growth has a disastrous effect on the environment [19]. The second perspective suggests that population growth promotes technological advancement, resulting in a neutral or even positive environmental effect [20]. This paper aligns with the third perspective, which considers population density as one of the explanatory variables. It posits that population is not the dominant factor influencing GEID but plays a role with other factors like affluence and technology [21].
- (2)
- Affluence. Relevant studies indicate that economic disparities are a significant factor leading to regional imbalances in China’s GEID. The level of regional economic development determines the general revenue of local governments, thereby influencing the level of GEID [5]. This paper uses general budget revenue of the local governments as a measure of affluence to investigate its impact on GEID.
- (3)
- Technical innovation. Technological innovation can enhance the efficiency of information acquisition and processing, enabling the local governments to disclose environmental information more promptly and accurately [22]. However, there is limited research on the spatial effect of technical innovation on GEID. To address this gap, this paper uses the quantity of green patent grants as a proxy indicator for technical innovation, drawing on the study by Du et al. [23].
- (4)
- Public participation. Public participation is a crucial factor in driving GEID. Relevant studies show that in places with higher income and education levels, the public has stronger requirements for GEID [24]. Therefore, this paper uses the average number of students enrolled in high school per 100,000 people as the measure of public participation.
- (5)
- Environmental regulation. The political performance evaluations of local officials are green-oriented, leading to strengthened government efforts to enhance environmental protection through regulations. This has resulted in an improvement in GEID [25]. Therefore, this paper uses the environmental attention index to measure the intensity of government environmental regulations and investigate their impact on GEID.
- (6)
- (7)
- Industrial structure. Excessive representation of high-emission industries will increase the local government’s environmental pressure, thus inhibiting the initiative of GEID. Considering China’s industrial development, this paper chooses industrial added value as a share of GDP, transportation industry added value as a share of GDP, and Real Estate added value as a share of GDP as indicators of industrial structure, which have long been regarded as high-emission industries and pillar industries in China [28].
2.1.2. Spatial Correlation Test
2.1.3. Standard Deviation Ellipse Analysis
2.1.4. Spatial Panel Model
2.2. Data Sources
3. Results
3.1. Spatial Correlation Test and Agglomeration Characteristics of GEID
3.1.1. Global Spatial Correlation Analysis
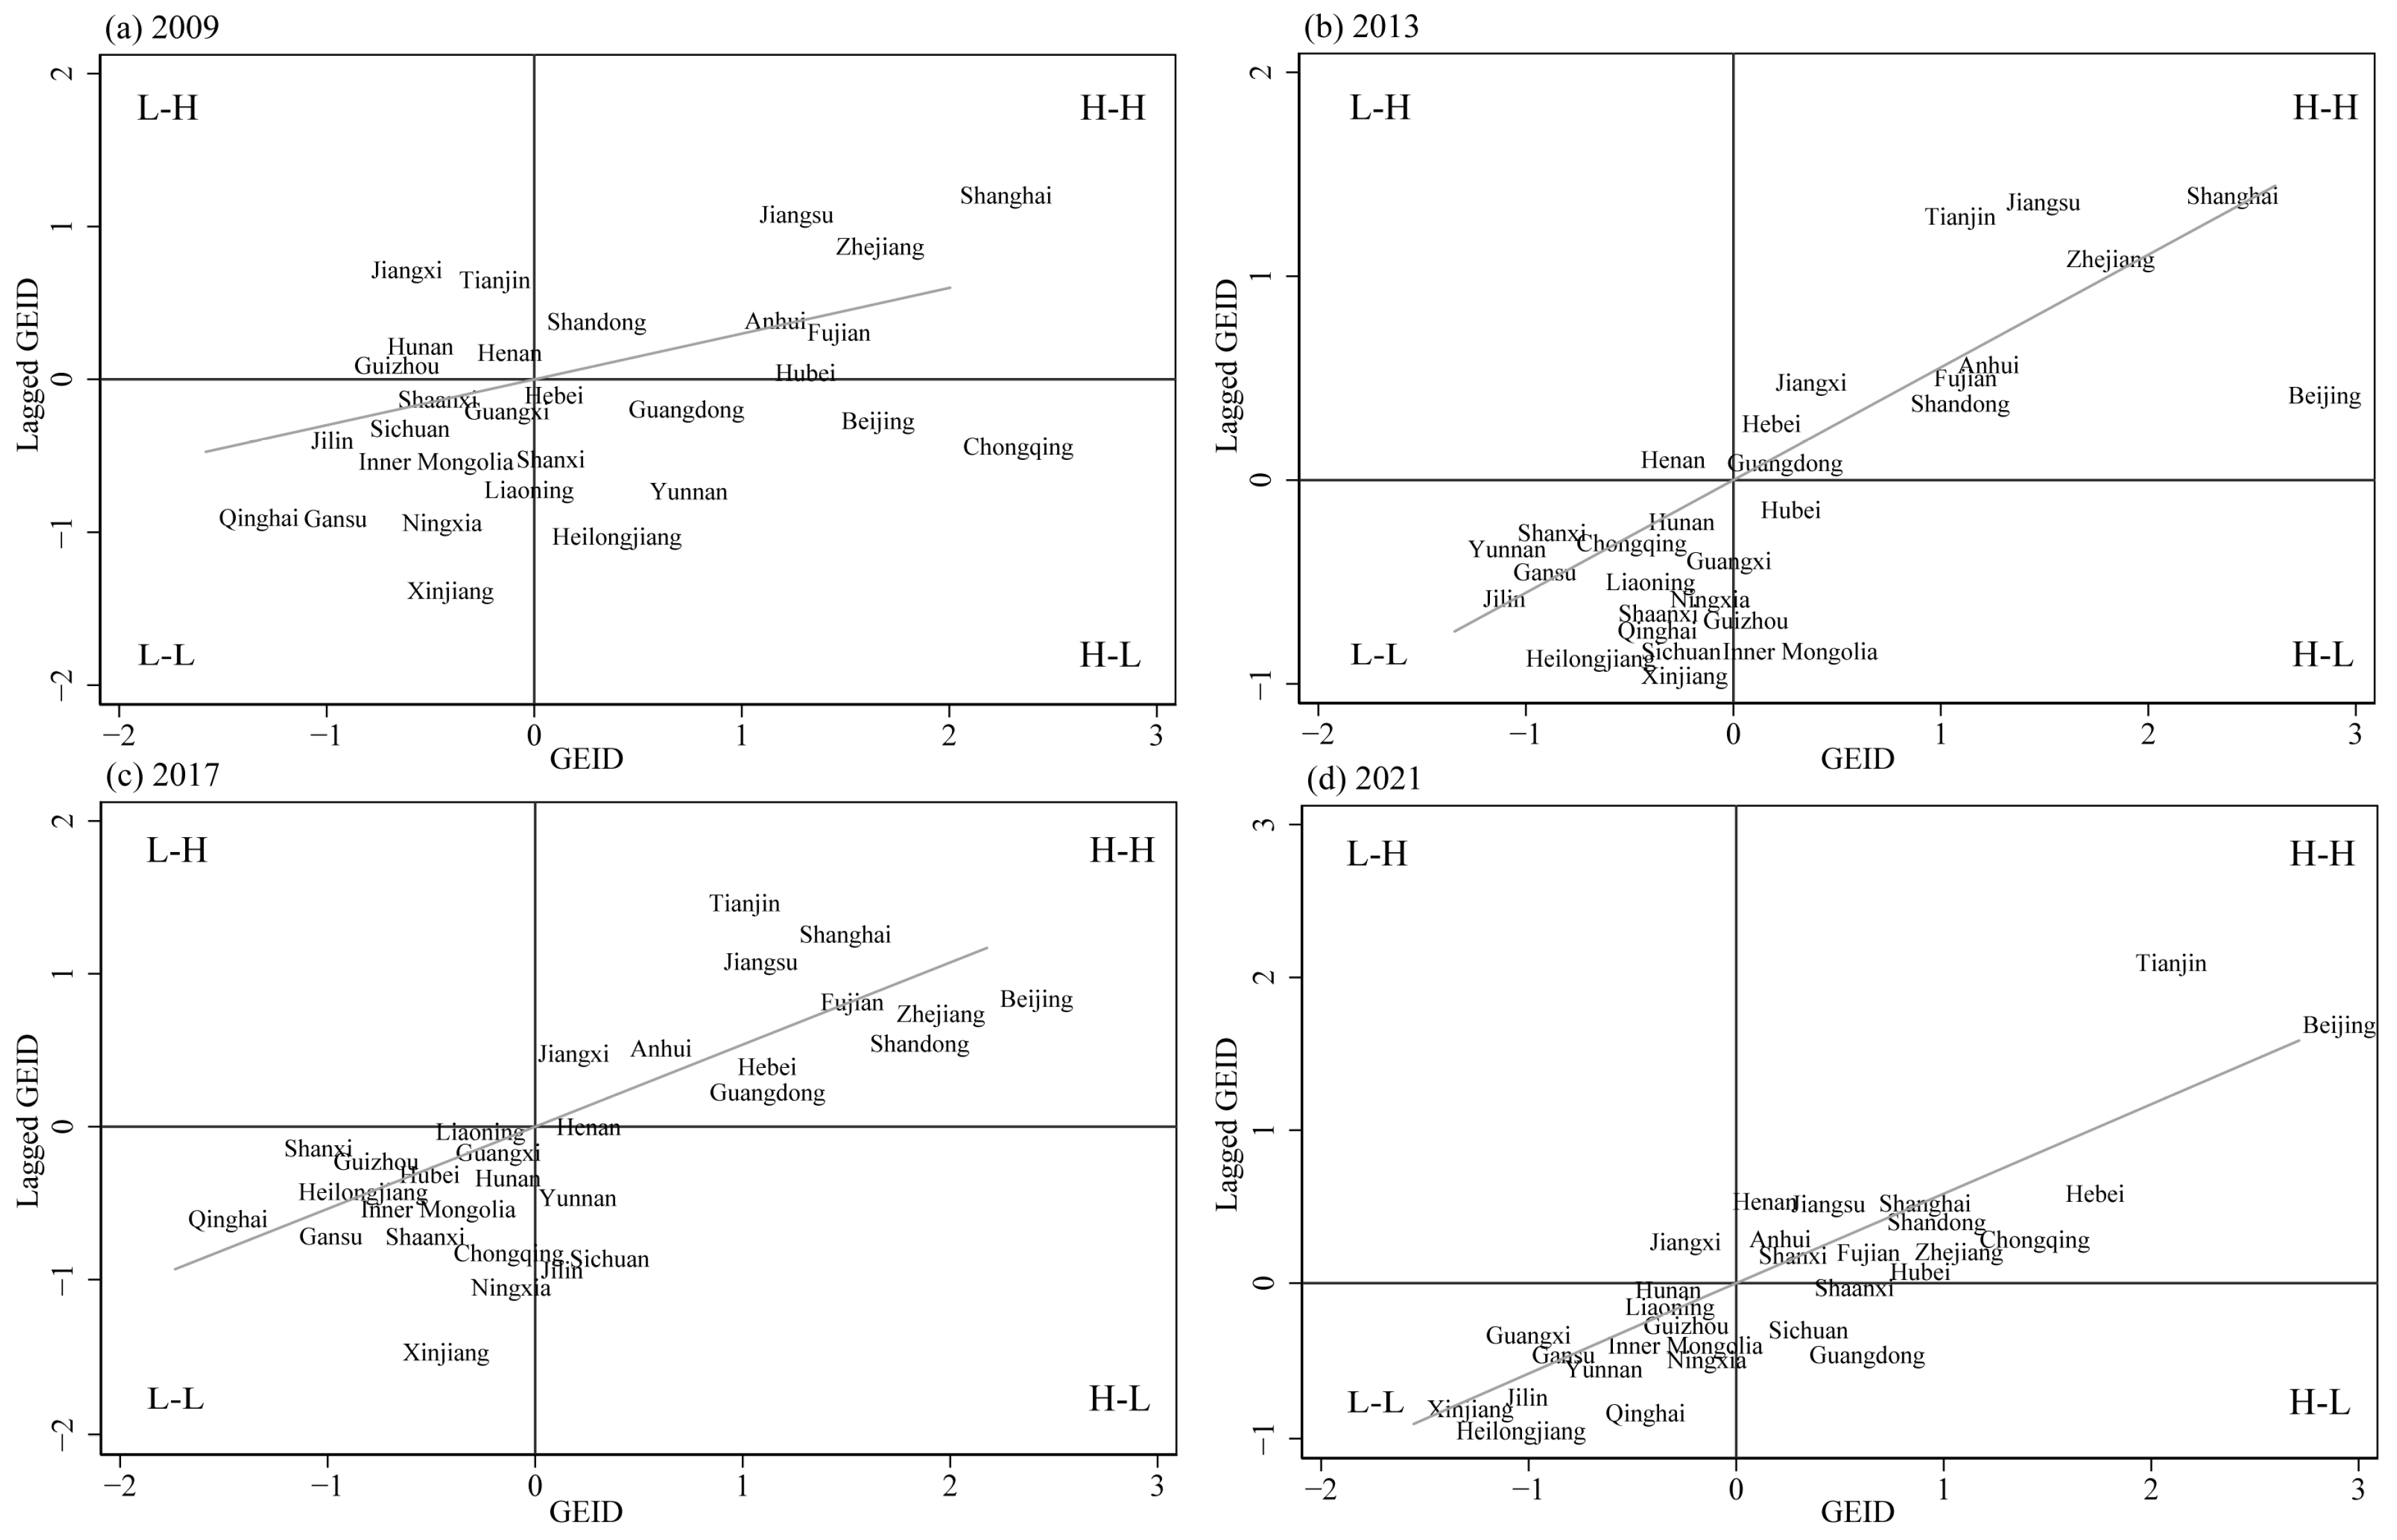
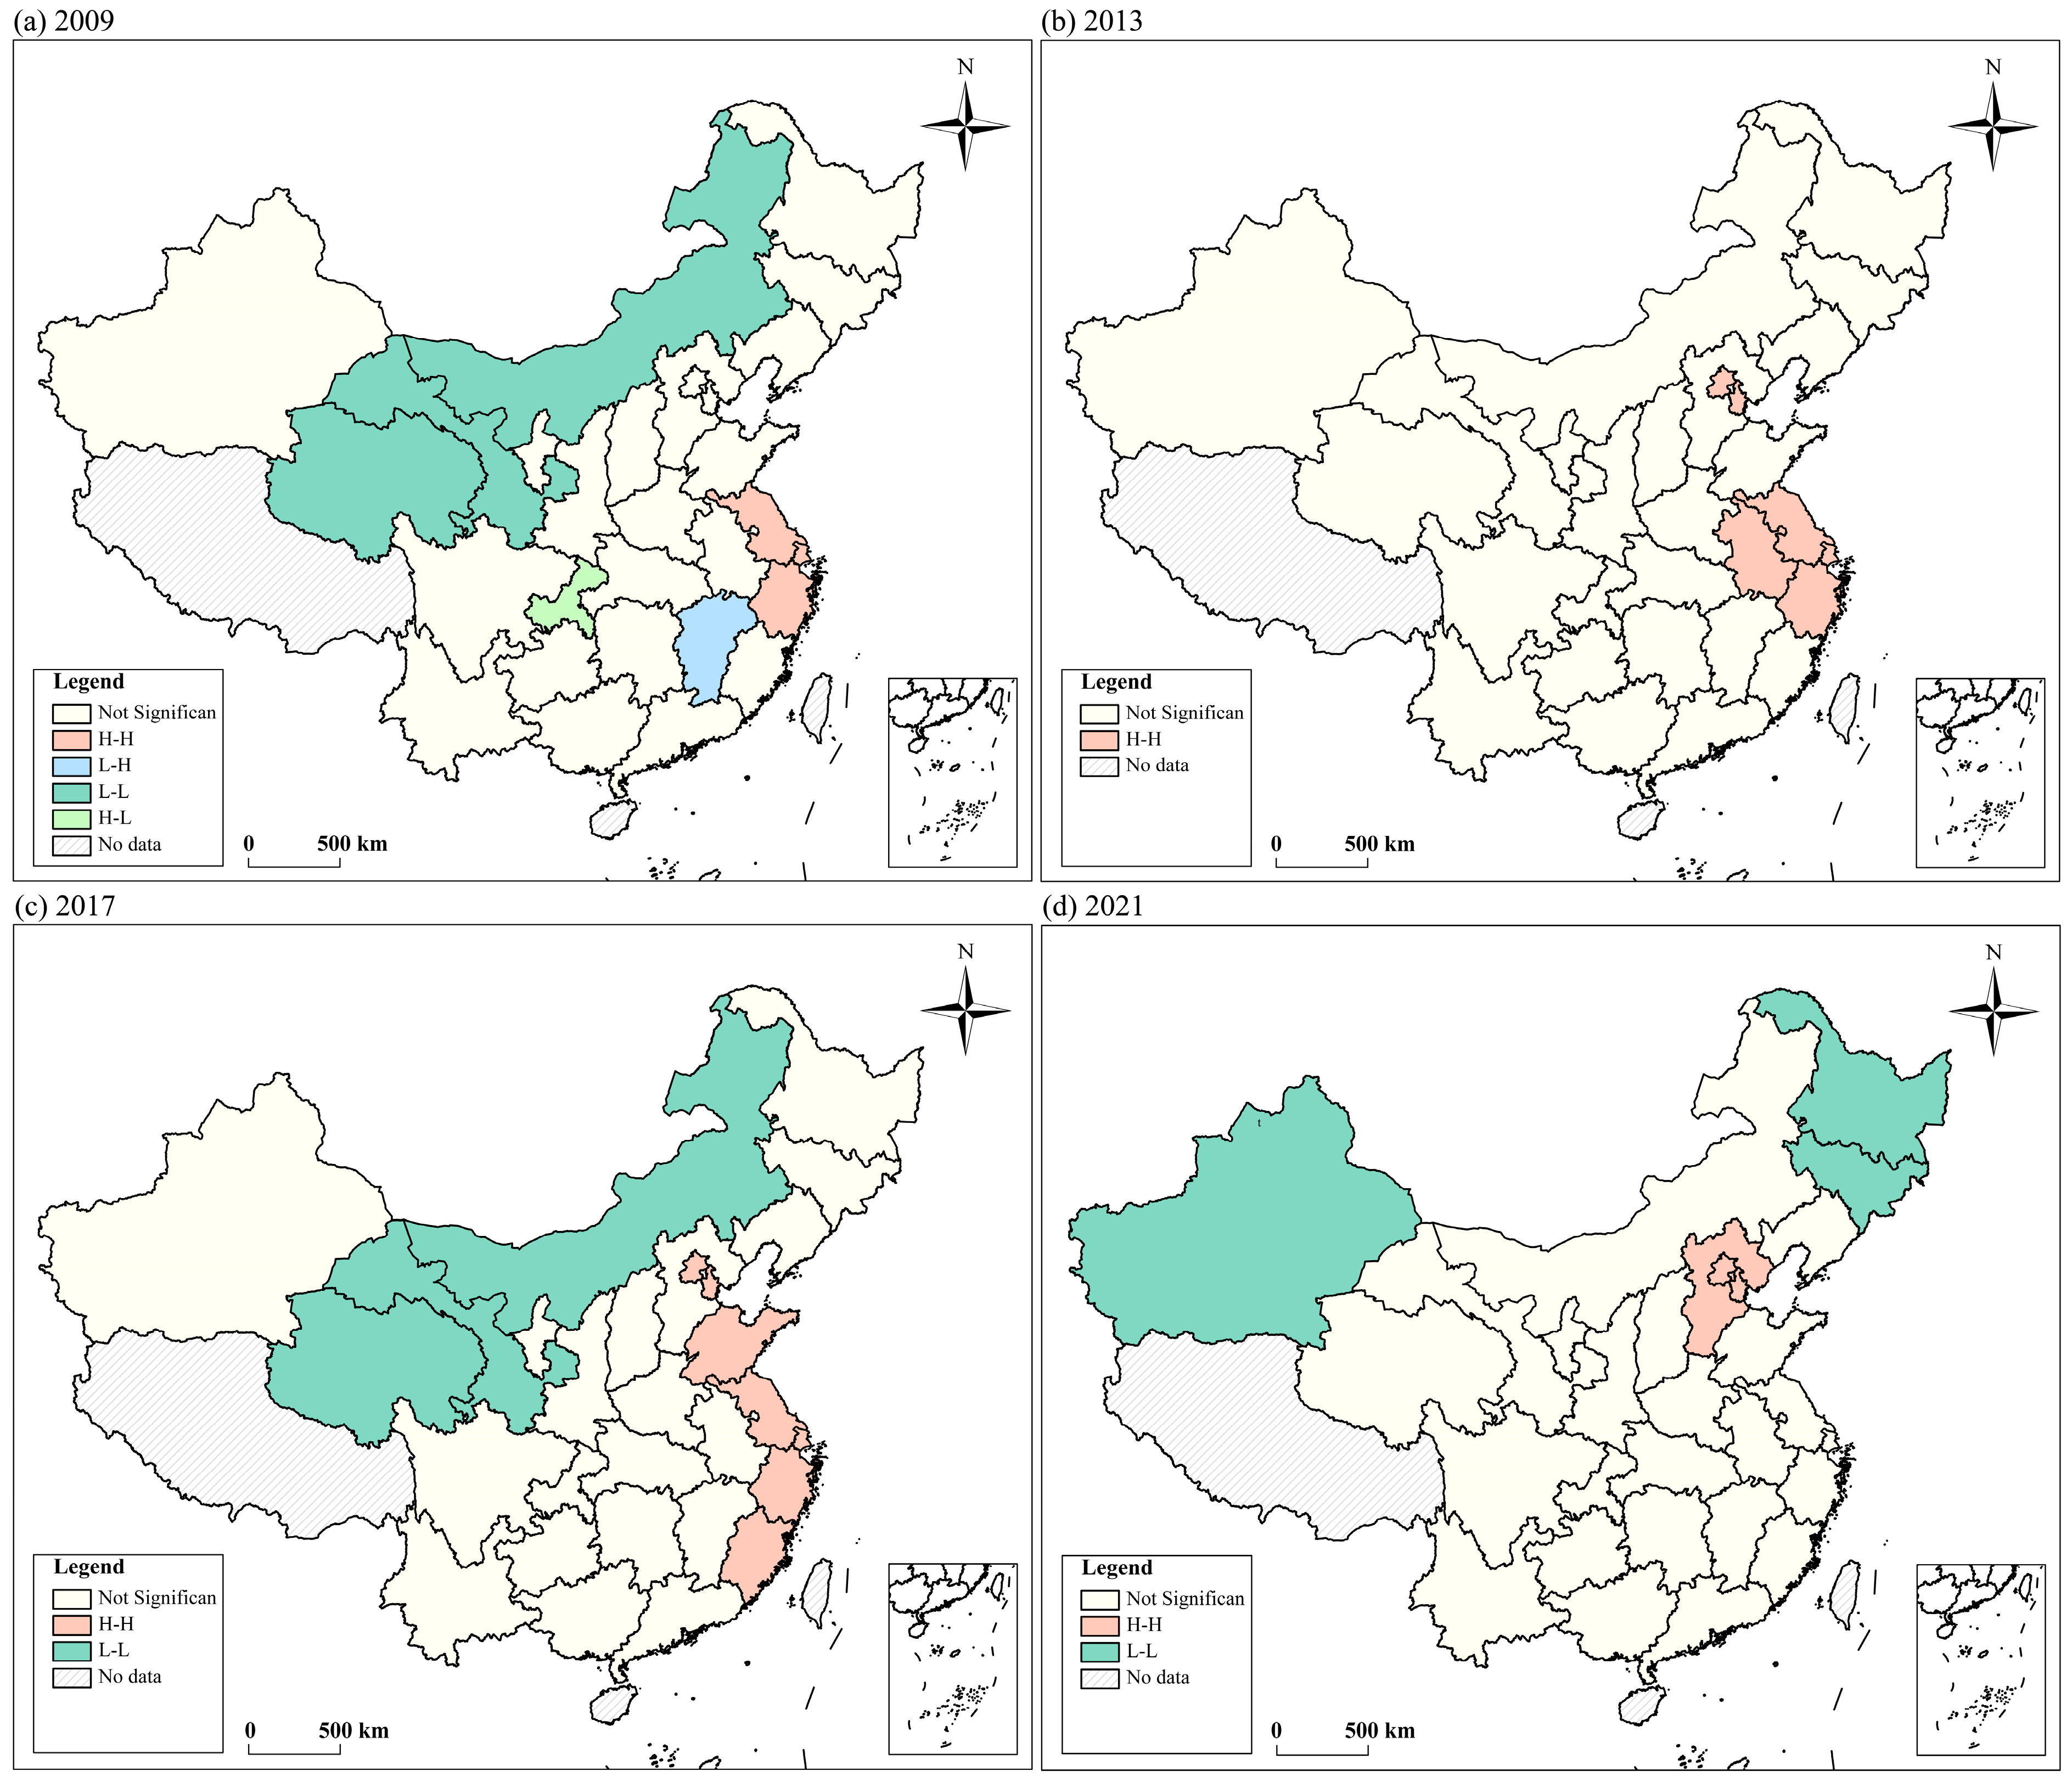
3.1.2. Local Spatial Correlation Analysis
3.1.3. Spatial Agglomeration Characteristic Analysis
3.2. Spatial–Temporal Trends in the Agglomeration of GEID
3.3. Analysis of Factors Influencing the Level of GEID
3.3.1. Spatial Panel Estimation Results
- (1)
- Analysis of the spatial–temporal effects of GEID. In terms of the temporal dimension, the time lag coefficient χ of GEID is significantly positive at the 1% level under the three spatial weight matrices, which are all significantly positive at the 1% level, which fully explains the existence of path dependence characteristics. This manifests that the level of GEID in the current period will have a positive promotional effect on the next period. In terms of the spatial dimension, some provinces located in “H-L” or “L-H” quadrants in Moran scatter diagram exhibit seemingly insignificant aggregation, but the results of the spatial Durbin model show that the spatial lag coefficients ρ of the three spatial weighting matrices under the static and dynamic models are all significantly positive, which firmly verifies that the level of GEID has a significant spatial agglomeration feature overall. This manifests the “H-H” agglomeration effect generated by the radiation-driven effect, where higher levels of GEID in neighbouring provinces drive up the level of GEID in the local province, and the “L-L” agglomeration effect generated by the trough-impacting effect, where lower levels of GEID in neighbouring provinces affect the level of GEID in the local province. In terms of spatial–temporal dimension, only the spatial–temporal lag coefficient γ of the geographical distance matrix is significantly positive, indicating that the spatial–temporal double effect of GEID is not significant. This implies that the GEID of the previous period in neighbouring provinces does not significantly affect the current GEID in the local province.
- (2)
- Analysis of factors influencing GEID. The estimation results of the spatial Durbin model (SDM) and the dynamic spatial Durbin model (DSDM) under the Wa matrix indicate that among the nine influencing factors, population size (P), affluence (A), technical innovation (T), public participation (PU), environmental regulation (ER), industry (IND), and transportation industry (TI) significantly affect GEID. The coefficient of population size (P) is negative, indicating that higher population density leads to lower levels of GEID in the local province. The remaining factors all have a positive effect on GEID in the local province. Except for technical innovation (T), the spatial spillover effect of the other six factors is significant. The spillover effect of population size (P) is positive, indicating that an increase in population density in neighbouring provinces promotes GEID in the local province. The spillover effect of the other five factors is negative.
3.3.2. Effect Decomposition of Influencing Factors
- (1)
- From the perspective of population factors, the direct effect of population size (P) is significantly positive, while the indirect effect is significantly negative. The estimated coefficient is the largest among the nine influencing factors, indicating that population size has the greatest impact on GEID. The increase in population size will lead to a decrease in the GEID of the local province, and the increase in the population size of neighbouring provinces will promote the improvement of the GEID of the local government. Therefore, the role of population factors in the development of GEID in China is significant.
- (2)
- From the economic perspective, the direct effect of affluence (A) is positive but not significant, suggesting that economic development helps to improve GEID in the local province, but this effect is not statistically significant. The indirect effect is significantly negative, indicating that economic development in neighbouring provinces reduces the level of GEID in the local province. The “siphon effect” from economically developed neighbouring provinces may be the main reason for this phenomenon. A large number of talents and funds flowed out of the province into the neighbouring provinces, while the high-emission industries correspondingly moved from the neighbouring provinces to the province. As a result, the economic and environmental performances of the local province lag behind the neighbouring provinces, and the government is not sufficiently motivated to disclose environmental information, resulting in a lower level of GEID.
- (3)
- From the technical innovation perspective, the direct and indirect effects of technical innovation (T) are both positive, but the indirect effect does not pass the significance test. This indicates that progress in technological innovation, especially the improvement of green innovation capabilities, can improve the province’s level of clean production, reduce environmental pollution problems, and strengthen the government’s willingness to disclose environmental information.
- (4)
- From the public participation perspective, the direct effect of public participation (PU) is significantly positive, indicating that the improvement of GEID depends on extensive public participation. The higher the level of concern among residents in the local province, the greater the public pressure on the local province to improve GEID. However, the indirect effect is significantly negative, suggesting that high levels of public participation in neighbouring provinces reduce the level of GEID in the local province. This phenomenon may be due to the environmental risk aversion psychology of the local province. As the level of public concern about the environment increases in neighbouring provinces, the level of GEID also increases in neighbouring provinces. At this point, the local province faces both public pressure and comparative pressure on environmental performance from neighbouring provinces, leading to a tendency to reduce environmental information disclosure and consequently lower levels of GEID.
- (5)
- From the environmental regulation perspective, the direct effect of environmental regulation (ER) is significantly positive, and the indirect effect is not significant. It fully indicates that the higher the government’s attention to local environmental problems, the higher the level of GEID.
- (6)
- From the environmental regulation perspective, both the direct and indirect effects of environmental status (ES) are not significant, indicating that the level of environmental pollution is not a major factor influencing the level of GEID.
- (7)
- From the industry perspective, the direct and indirect effects of Real Estate (RE) are both insignificant, indicating that although Real Estate (RE) has long been regarded as a pillar industry in China, it has no significant effect on the level of GEID. The direct effect of industry (IND) and transportation industry (TI) is significantly positive, and the indirect effect is significantly negative, indicating that industry and transportation industry will cause the level of GEID of the local province to improve, and the development of industry and transportation industry in neighbouring provinces will reduce the level of GEID of the local province.
4. Conclusions and Suggestions
Author Contributions
Funding
Data Availability Statement
Conflicts of Interest
References
- Chen, W.Y.; Cho, F.H.T. Understanding China’s transition to environmental information transparency: Citizens’ protest attitudes and choice behaviours. J. Environ. Policy Plann. 2021, 23, 275–301. [Google Scholar] [CrossRef]
- Moellmann, J.; Thomas, V.M. Social enterprise factory location and allocation model: Small scale manufacturing for East Africa. Socio-Econ. Plan. Sci. 2019, 68, 100694. [Google Scholar] [CrossRef]
- Yu, Y.; Huang, J.; Luo, N. Can More Environmental Information Disclosure Lead to Higher Eco-Efficiency? Evidence from China. Sustainability 2018, 10, 528. [Google Scholar] [CrossRef]
- Tu, Z.; Hu, T.; Shen, R. Evaluating public participation impact on environmental protection and ecological efficiency in China: Evidence from PITI disclosure. China Econ. Rev. 2019, 55, 111–123. [Google Scholar] [CrossRef]
- Kosajan, V.; Chang, M.; Xiong, X.; Feng, Y.; Wang, S. The design and application of a government environmental information disclosure index in China. J. Clean. Prod. 2018, 202, 1192–1201. [Google Scholar] [CrossRef]
- Zhang, L.; Mo, A.P.J.; He, G. Transparency and information disclosure in China’s environmental governance. Curr. Opin. Environ. Sustain. 2016, 18, 17–24. [Google Scholar] [CrossRef]
- Zhang, L.; Mol, A.P.J.; He, G.; Lu, Y. An implementation assessment of China’s Environmental Information Disclosure Decree. J. Environ. Sci. 2010, 22, 1649–1656. [Google Scholar] [CrossRef]
- Li, Y.; Zhang, X.; Yao, T.; Sake, A.; Liu, X.; Peng, N. The developing trends and driving factors of environmental information disclosure in China. J. Environ. Manag. 2021, 288, 112386. [Google Scholar] [CrossRef]
- Chen, W.Y.; Su, Y.; Liekens, I. Environmental information disclosure and public choice decisions for urban river restoration: A comparative study between Brussels (Belgium) and Guangzhou (China). J. Environ. Manag. 2022, 319, 115692. [Google Scholar] [CrossRef]
- Yang, Y.; Shen, L.; Li, Y.; Li, Y. The Impact of Environmental Information Disclosure on Environmental Governance Satisfaction. Sustainability 2022, 14, 7888. [Google Scholar] [CrossRef]
- Zhang, M.; Huang, M. Study on the impact of informal environmental regulation on substantive green innovation in China: Evidence from PITI disclosure. Environ. Sci. Pollut. Res. 2023, 30, 10444–10456. [Google Scholar] [CrossRef] [PubMed]
- Lu, J.; Li, H. The impact of government environmental information disclosure on enterprise location choices: Heterogeneity and threshold effect test. J. Clean. Prod. 2020, 277, 124055. [Google Scholar] [CrossRef]
- Meng, X.H.; Zeng, S.X.; Shi, J.J.; Qi, G.Y.; Zhang, Z.B. The relationship between corporate environmental performance and environmental disclosure: An empirical study in China. J. Environ. Manag. 2014, 145, 357–367. [Google Scholar] [CrossRef] [PubMed]
- Shen, D.; Xia, M.; Zhang, Q.; Elahi, E.; Zhou, Y.; Zhang, H. The impact of public appeals on the performance of environmental governance in China: A perspective of provincial panel data. J. Clean. Prod. 2019, 231, 290–296. [Google Scholar] [CrossRef]
- Ren, S.; Wei, W.; Sun, H.; Xu, Q.; Hu, Y.; Chen, X. Can mandatory environmental information disclosure achieve a win-win for a firm’s environmental and economic performance? J. Clean. Prod. 2020, 250, 119530. [Google Scholar] [CrossRef]
- Tian, X.-L.; Guo, Q.-G.; Han, C.; Ahmad, N. Different extent of environmental information disclosure across Chinese cities: Contributing factors and correlation with local pollution. Glob. Environ. Chang.-Hum. Policy Dimens. 2016, 39, 244–257. [Google Scholar] [CrossRef]
- York, R.; Rosa, E.A.; Dietz, T. STIRPAT, IPAT and ImPACT: Analytic tools for unpacking the driving forces of environmental impacts. Ecol. Econ. 2003, 46, 351–365. [Google Scholar] [CrossRef]
- Ehrlich, P.R.; Holdren, J.P. Impact of Population Growth. Science 1971, 171, 1212–1217. [Google Scholar] [CrossRef]
- Nhat Minh, P.; Toan Luu Duc, H.; Nasir, M.A. Environmental consequences of population, affluence and technological progress for European countries: A Malthusian view. J. Environ. Manag. 2020, 260, 110143. [Google Scholar] [CrossRef]
- Simon, J.L. Environmental disruption or environmental improvement. Soc. Sci. Q. 1981, 62, 6591507. [Google Scholar]
- Liddle, B.; Lung, S. Age-structure, urbanization, and climate change in developed countries: Revisiting STIRPAT for disaggregated population and consumption-related environmental impacts. Popul. Environ. 2010, 31, 317–343. [Google Scholar] [CrossRef]
- Feng, Y.; Wang, X.; Liang, Z. How does environmental information disclosure affect economic development and haze pollution in Chinese cities? The mediating role of green technology innovation. Sci. Total Environ. 2021, 775, 145811. [Google Scholar] [CrossRef] [PubMed]
- Du, K.; Li, P.; Yan, Z. Do green technology innovations contribute to carbon dioxide emission reduction? Empirical evidence from patent data. Technol. Forecast. Soc. Change 2019, 146, 297–303. [Google Scholar] [CrossRef]
- Dong, Y.; Ishikawa, M.; Liu, X.; Hamori, S. The determinants of citizen complaints on environmental pollution: An empirical study from China. J. Clean. Prod. 2011, 19, 1306–1314. [Google Scholar] [CrossRef]
- Zheng, Y.; Ge, C.; Li, X.; Duan, X.; Yu, T. Configurational analysis of environmental information disclosure: Evidence from China’s key pollutant-discharge listed companies. J. Environ. Manag. 2020, 270, 110671. [Google Scholar] [CrossRef]
- Lemma, T.T.; Feedman, M.; Mlilo, M.; Park, J.D. Corporate carbon risk, voluntary disclosure, and cost of capital: South African evidence. Bus. Strategy Environ. 2019, 28, 111–126. [Google Scholar] [CrossRef]
- Tang, Y.; Chen, S.; Huang, J. Green research and development activities and SO2 intensity: An analysis for China. Environ. Sci. Pollut. Res. 2021, 28, 16165–16180. [Google Scholar] [CrossRef]
- Guo, J.; Zhang, Y.-J.; Zhang, K.-B. The key sectors for energy conservation and carbon emissions reduction in China: Evidence from the input-output method. J. Clean. Prod. 2018, 179, 180–190. [Google Scholar] [CrossRef]
- Zhao, L.; Zhao, Z. Projecting the Spatial Variation of Economic Based on the Specific Ellipses in China. Sci. Geogr. Sin. 2014, 34, 979–986. [Google Scholar]
- Elhorst, J.P.; Gross, M.; Tereanu, E. Cross-Sectional Dependence and Spillovers in Space and Time: Where Spatial Econometrics and Global Var Models Meet. J. Econ. Surv. 2021, 35, 192–226. [Google Scholar] [CrossRef]
- Elhorst, J.P. Dynamic spatial panels: Models, methods, and inferences. J. Geogr. Syst. 2012, 14, 5–28. [Google Scholar] [CrossRef]
- Giacomini, D.; Rocca, L.; Zola, P.; Mazzoleni, M. Local Governments’ environmental disclosure via social networks: Organizational legitimacy and stakeholders’ interactions. J. Clean. Prod. 2021, 317, 128290. [Google Scholar] [CrossRef]
- Zhang, S.; Zhang, M.-A.; Qiao, Y.; Li, X.; Li, S. Does improvement of environmental information transparency boost firms’ green innovation? Evidence from the air quality monitoring and disclosure program in China. J. Clean. Prod. 2022, 357, 131921. [Google Scholar] [CrossRef]
- Zhao, S.; Zhao, Z.; Zhao, Z. Large-scale Spatial Agglomeration of Technical Innovation in China and Its Trend. Econ. Geogr. 2023, 43, 126–134. [Google Scholar]
- Elhorst, J.P. Matlab Software for Spatial Panels. Int. Reg. Sci. Rev. 2014, 37, 389–405. [Google Scholar] [CrossRef]
- Lesage, J.; Pace, R.K. Introduction to Spatial Econometrics; CRC Press: Boca Raton, FL, USA, 2009. [Google Scholar]


| Variable | Symbol | Definition | Unit |
|---|---|---|---|
| Government environmental information disclosure | GEID | Local government environmental information disclosure level | - |
| Population size | P | Population density | Person/km2 |
| Affluence | A | General budget revenue of local governments | 100 million RMB |
| Technical innovation | T | Number of green patents granted | Pcs |
| Public participation | PU | Average number of students enrolled in high school per 100,000 people | Person |
| Environmental regulation | ER | Environmental attention, number of environmental words in government documents | Pcs |
| Environmental status | ES | Total SO2 emissions | Tonne |
| Industry | IND | Industrial added value as a share of GDP | % |
| Transportation industry | TI | Transportation industry added value as a share of GDP | % |
| Real Estate | RE | Real Estate added value as a share of GDP | % |
| Year | Moran’s I | p-Value | Z-Value |
|---|---|---|---|
| 2009 | 0.299 | 0.006 | 2.735 |
| 2010 | 0.358 | 0.001 | 3.242 |
| 2011 | 0.282 | 0.009 | 2.595 |
| 2012 | 0.302 | 0.006 | 2.759 |
| 2013 | 0.553 | 0.000 | 4.910 |
| 2014 | 0.422 | 0.000 | 3.753 |
| 2015 | 0.356 | 0.001 | 3.269 |
| 2016 | 0.507 | 0.000 | 4.446 |
| 2017 | 0.537 | 0.000 | 4.685 |
| 2018 | 0.480 | 0.000 | 4.173 |
| 2019 | 0.425 | 0.000 | 3.801 |
| 2020 | 0.501 | 0.000 | 4.507 |
| 2021 | 0.585 | 0.000 | 5.190 |
| W | Wa | We | Wd | ||||
|---|---|---|---|---|---|---|---|
| Test | Statistical Value | p-Value | Statistical Value | p-Value | Statistical Value | p-Value | |
| LM-error | Moran’s I | 10.241 | 0.000 | 10.109 | 0.000 | 18.808 | 0.000 |
| LM | 97.067 | 0.000 | 95.408 | 0.000 | 289.839 | 0.000 | |
| Robust LM | 1.178 | 0.278 | 0.260 | 0.610 | 140.239 | 0.000 | |
| LM-lag | LM | 117.989 | 0.000 | 129.200 | 0.000 | 165.738 | 0.000 |
| Robust LM | 22.100 | 0.000 | 34.053 | 0.000 | 16.228 | 0.000 | |
| Hausman | 45.170 | 0.000 | 34.610 | 0.000 | 75.720 | 0.000 | |
| LR-ind | 97.150 | 0.000 | 78.820 | 0.000 | 66.080 | 0.000 | |
| LR-time | 147.090 | 0.000 | 147.390 | 0.000 | 146.610 | 0.000 | |
| LR-SEM | 31.440 | 0.000 | 47.570 | 0.000 | 19.940 | 0.018 | |
| LR-SLM | 36.460 | 0.000 | 39.560 | 0.000 | 28.620 | 0.001 | |
| Wald-SEM | 27.080 | 0.001 | 12.460 | 0.000 | 24.550 | 0.002 | |
| Wald-SLM | 32.630 | 0.000 | 21.460 | 0.000 | 31.250 | 0.000 | |
| Model | Wa | We | Wd | |||
|---|---|---|---|---|---|---|
| Variable | SDM | DSDM | SDM | DSDM | SDM | DSDM |
| lnGEIDt−1 | 0.478 *** | 0.413 *** | 0.508 *** | |||
| (χ) | (10.34) | (9.19) | (10.67) | |||
| W×lnGEID | 0.141 ** | 0.124 * | 0.208 ** | 0.156 * | 0.287 ** | 1.271 *** |
| (ρ) | (1.99) | (1.67) | (2.37) | (1.69) | (2.16) | (3.80) |
| W×lnGEIDt−1 | 0.004 | 0.178 | 1.499 ** | |||
| (γ) | (0.05) | (1.41) | (2.42) | |||
| lnP | −1.774 *** | −0.890 ** | −1.373 *** | −1.300 *** | −1.222 *** | −1.108 *** |
| (−4.31) | (−2.05) | (−3.78) | (−3.51) | (−3.05) | (−2.75) | |
| lnA | 0.131 | 0.136 *** | 0.024 | 0.144 *** | 0.253 ** | 0.105 * |
| (1.33) | (2.69) | (0.24) | (2.64) | (2.28) | (1.91) | |
| lnT | 0.098 * | 0.077 | 0.090 | 0.069 | 0.151 ** | 0.113 * |
| (1.79) | (1.35) | (1.62) | (1.22) | (2.52) | (1.85) | |
| lnPU | 0.285 *** | 0.241 | −0.033 | 0.169 | 0.265 *** | 0.133 |
| (3.17) | (1.30) | (−0.36) | (1.01) | (2.75) | (0.80) | |
| lnER | 0.164 ** | 0.016 | 0.125 * | 0.003 | 0.163 ** | 0.099 |
| (2.53) | (0.17) | (1.94) | (0.04) | (2.29) | (0.99) | |
| lnES | 0.036 | 0.044 | −0.007 | −0.115 | −0.038 | 0.063 |
| (1.21) | (0.51) | (−0.20) | (−1.31) | (−1.17) | (0.71) | |
| lnIND | 0.560 *** | −0.001 | 0.555 *** | −0.009 | 0.602 *** | −0.024 |
| (2.93) | (−0.02) | (3.11) | (−0.33) | (3.38) | (−0.83) | |
| lnTI | 0.257 ** | 0.258 ** | 0.120 | 0.141 | 0.283 ** | 0.130 |
| (2.36) | (2.51) | (1.07) | (1.37) | (2.34) | (1.20) | |
| lnRE | 0.062 | −0.004 | −0.018 | −0.073 | 0.080 | −0.015 |
| (0.72) | (−0.05) | (−0.19) | (−0.84) | (0.82) | (−0.17) | |
| W×lnP | 2.259 *** | 1.367 | −0.553 | −1.107 | 1.010 | −0.657 |
| (2.76) | (1.57) | (−0.57) | (−1.04) | (0.14) | (−0.09) | |
| W×lnA | −0.862 *** | 0.082 | −0.872 *** | 0.245 | 3.007 | −1.313 |
| (−3.56) | (0.70) | (−3.13) | (1.44) | (1.45) | (−1.07) | |
| W×lnT | 0.141 | −0.188 | 0.292 * | 0.010 | −0.356 | 0.856 |
| (1.19) | (−1.55) | (1.72) | (0.07) | (−0.32) | (0.81) | |
| W×lnPU | −0.292* | 0.050 | 0.659 *** | −0.457 | 0.317 | −1.081 |
| (−1.75) | (0.12) | (2.69) | (−1.03) | (0.26) | (−0.25) | |
| W×lnER | −0.188 | −0.640 *** | −0.046 | −0.324 | 0.827 | 2.035 |
| (−1.36) | (−2.75) | (−0.27) | (−1.22) | (0.67) | (1.09) | |
| W×lnES | 0.020 | −0.070 | 0.175 * | 0.181 | −1.057 ** | 1.138 |
| (0.35) | (−0.43) | (1.90) | (0.75) | (−2.50) | (0.96) | |
| W×lnIND | −1.055 ** | −0.093 * | −0.131 | 0.060 | 2.438 | −0.449 |
| (−2.45) | (−1.73) | (−0.28) | (0.72) | (0.52) | (−1.06) | |
| W×lnTI | −0.862 *** | 0.042 | −0.253 | −0.706 ** | 2.576 | −2.069 |
| (−2.95) | (0.16) | (−0.78) | (−2.23) | (0.78) | (−0.70) | |
| W×lnRE | −0.130 | 0.304 | −0.051 | 0.130 | −0.255 | −0.861 |
| (−0.65) | (1.60) | (−0.24) | (0.67) | (−0.13) | (−0.51) | |
| City control | YES | YES | YES | YES | YES | YES |
| Year control | YES | YES | YES | YES | YES | YES |
| Obs | 377 | 348 | 377 | 348 | 377 | 348 |
| Variable | Direct Effect | Indirect Effect | Total Effect |
|---|---|---|---|
| lnP | −1.688 *** | 2.295 ** | 0.607 |
| (−4.08) | (2.47) | (0.64) | |
| lnA | 0.097 | −0.974 *** | −0.877 *** |
| (1.01) | (−3.48) | (−2.88) | |
| lnT | 0.109 ** | 0.184 | 0.293 * |
| (2.07) | (1.27) | (1.82) | |
| lnPU | 0.274 *** | −0.289 * | −0.015 |
| (3.20) | (−1.67) | (−0.08) | |
| lnER | 0.159 ** | −0.178 | −0.019 |
| (2.51) | (−1.09) | (−0.10) | |
| lnES | 0.038 | 0.024 | 0.062 |
| (1.27) | (0.37) | (0.90) | |
| lnIND | 0.521 *** | −1.099 ** | −0.578 |
| (2.62) | (−2.09) | (−0.89) | |
| lnTI | 0.227 ** | −0.911 *** | −0.684 * |
| (1.97) | (−2.65) | (−1.72) | |
| lnRE | 0.065 | −0.139 | −0.074 |
| (0.77) | (−0.60) | (−0.29) |
Disclaimer/Publisher’s Note: The statements, opinions and data contained in all publications are solely those of the individual author(s) and contributor(s) and not of MDPI and/or the editor(s). MDPI and/or the editor(s) disclaim responsibility for any injury to people or property resulting from any ideas, methods, instructions or products referred to in the content. |
© 2024 by the authors. Licensee MDPI, Basel, Switzerland. This article is an open access article distributed under the terms and conditions of the Creative Commons Attribution (CC BY) license (https://creativecommons.org/licenses/by/4.0/).
Share and Cite
Xin, B.; Lv, L.; Dong, J. Spatial–Temporal Development Trends and Influencing Factors of Government Environmental Information Disclosure: Empirical Evidence Based on China’s Provincial Panel Data. Sustainability 2024, 16, 8312. https://doi.org/10.3390/su16198312
Xin B, Lv L, Dong J. Spatial–Temporal Development Trends and Influencing Factors of Government Environmental Information Disclosure: Empirical Evidence Based on China’s Provincial Panel Data. Sustainability. 2024; 16(19):8312. https://doi.org/10.3390/su16198312
Chicago/Turabian StyleXin, Boda, Lianhong Lv, and Jingjing Dong. 2024. "Spatial–Temporal Development Trends and Influencing Factors of Government Environmental Information Disclosure: Empirical Evidence Based on China’s Provincial Panel Data" Sustainability 16, no. 19: 8312. https://doi.org/10.3390/su16198312