Article

Enhanced Early Detection of Cadmium Stress in Rice: Introducing a Novel Spectral Index Based on an Enhanced GAMI-Net Model

by
Jie Liu
1,
Zhao Zhang
2,
Shangran Zhou
1,
Xingwang Liu
1,*,
Feng Li
1,* and
Lei Mao
3
1
Department of Environment, College of Environment and Resources, Xiangtan University, Xiangtan 411105, China
2
RIOH High Science and Technology Group, Beijing 100088, China
3
China Urban Construction Design & Research Institute Co., Ltd., Beijing 100120, China
*
Authors to whom correspondence should be addressed.
Sustainability 2024, 16(19), 8341; https://doi.org/10.3390/su16198341
Submission received: 20 August 2024 / Revised: 16 September 2024 / Accepted: 23 September 2024 / Published: 25 September 2024
(This article belongs to the Section Pollution Prevention, Mitigation and Sustainability)

Abstract

:
Soil cadmium contamination poses a significant threat to global food security and human health, making the timely and accurate diagnosis of cadmium stress in rice crucial for effective pollution control and agricultural management. However, during the early growth stages of rice, particularly the tillering stage, the spectral response to cadmium stress is subtle, rendering traditional remote sensing methods inadequate. This study aims to develop an efficient early diagnosis index, the Cadmium Early Stress Index (CESI), for rapid and accurate detection of cadmium stress in rice at a regional scale. By integrating field surveys with Sentinel-2 satellite data, the study extracts multi-angle spectral features and employs an enhanced Generalized Additive Model Neural Network (E-GAMI-Net) for analysis. E-GAMI-Net analysis identified key indicators for early diagnosis, including log-transformed reflectance at 941 nm (R941_log), Optimized Soil-Adjusted Vegetation Index (OSAVI), and the interaction between Red Edge Amplitude and Chlorophyll content. Based on these findings, CESI was constructed, demonstrating superior diagnostic performance (R2 = 0.77, RMSE = 0.09 mg/kg) compared to existing methods. CESI also exhibited high stability under noise interference, with only a 5.6% reduction in R2 under 15% noise. In regional-scale remote sensing applications, CESI successfully generated cadmium stress distribution maps, identifying previously undetected moderate stress areas. CESI’s high accuracy (R2 = 0.6073, RMSE = 0.3021) and stability make it a promising tool for large-scale cadmium stress monitoring and precision agriculture management.

1. Introduction

Cadmium (Cd) is a highly toxic heavy metal element with a long half-life and a high bioaccumulation potential, classified by the United Nations Environment Programme (UNEP) as one of the most hazardous substances globally [1]. Soil Cd contamination has become an increasingly critical issue worldwide, with approximately 6.24% of agricultural soils in Europe exceeding the safety threshold of 0.5 mg/kg Cd content [2], up to 20% of arable land in certain Asian regions affected by Cd pollution (soil Cd levels generally surpassing 1.0 mg/kg) [3], and about 2% of agricultural soils in North America exceeding the regulatory standard of 1.5 mg/kg Cd content [4]. This widespread contamination poses a severe threat to food security, particularly for rice, which exhibits a strong accumulation capacity for accumulating soil Cd (bioconcentration factor: 0.1–1.0) [5]. Cd can induce various health issues, including renal dysfunction and osteoporosis [6]. Therefore, developing efficient and accurate methods for the early diagnosis of Cd stress in rice is crucial for safeguarding global food security and human health.
Traditional monitoring methods, such as atomic absorption spectrophotometry (AAS) or inductively coupled plasma mass spectrometry (ICP-MS), offer high accuracy but are time-consuming and costly, making them inadequate for large-scale, real-time monitoring [7]. The rapid advancement of remote sensing technologies, particularly hyperspectral remote sensing, has provided new technical support for non-invasive, real-time, and large-scale monitoring of cadmium content in crops. Hyperspectral sensors can continuously collect reflectance spectra within 325–2500 nm, with a spectral resolution of 1–10 nm, offering rich information for for diagnosing cadmium stress diagnosis [8,9].
Recent research has made significant progress in diagnosing heavy metal stress in vegetation using spectral remote sensing techniques. Liu et al. [10] established a predictive model for assessing cadmium content in rice leaves using partial least squares regression (PLSR), achieving an R2 of 0.82. Wang et al. [11] developed a novel spectral index for estimating cadmium content in wheat leaves, attaining an R2 of 0.79 on the validation set. Zhang et al. [12] applied support vector machine regression (SVR) techniques, reducing the model’s RMSE by 15%. Sun et al. [13] explored the application of deep learning in hyperspectral remote sensing for cadmium pollution monitoring. Their convolutional neural network (CNN)-based model demonstrated excellent performance in identifying mild cadmium stress, improving accuracy by 20% compared to traditional methods.
However, early diagnosis of cadmium stress still faces challenges. The impact during early stages (e.g., tillering) is subtle, with chlorophyll content decreasing by only 5–10%, making it difficult for traditional indices or single wavebands to capture these changes. Environmental factors may obscure spectral changes induced by cadmium stress, reducing diagnostic accuracy. Many existing models lack interpretability, failing to provide reliable guidance for practical applications [14,15,16].
Recent advancements in remote sensing and machine learning have opened new avenues for early stress detection in crops. Ma et al. (2019) conducted a comprehensive review of deep learning applications in remote sensing, highlighting the potential for improved accuracy in vegetation stress detection [17]. Cao et al. (2020) demonstrated the effectiveness of UAV-based hyperspectral sensing for chlorophyll content estimation in rice, a key indicator of plant health [18]. However, challenges persist in the early detection of subtle stress indicators, particularly for heavy metal contamination like cadmium. Wu et al. (2023) elucidated complex stress response mechanisms in rice, emphasizing the need for sophisticated detection methods capable of capturing early physiological changes [19]. Our study builds upon these recent findings, addressing the critical need for accurate, early-stage cadmium stress detection in rice through advanced spectral analysis and machine learning techniques.
To address these challenges, this study proposes a novel Cadmium Early Stress Index (CESI) technique for high-precision early diagnosis of cadmium stress in rice at the tillering stage. CESI is based on an improved Generalized Additive Neural Network model (E-GAMI-Net), which integrates non-linear modeling capabilities with interpretability, processing over 100 spectral features and their interactions [20]. We optimized the original GAMI-Net model using a grid search algorithm based on k-fold cross-validation. The innovation of CESI lies in: (1) the integration of multi-angle spectral features to comprehensively capture subtle effects of cadmium stress [21]; (2) the utilization of E-GAMI-Net’s interpretability to identify and quantify sensitive spectral features and their interactions [22]; and (3) the development of CESI through the integration of multiple critical features and their interactions [23].
The primary objectives of this study are: (1) analyzing the relationship between multi-angle spectral features and cadmium stress using E-GAMI-Net; (2) developing and optimizing CESI through model interpretability analysis and examining feature interaction effects; and (3) evaluating CESI’s diagnostic accuracy, stability, interference resistance, and potential for regional-scale application, while comparing it with traditional methods [24]. This study aims to provide innovative tools for the early warning of cadmium stress in rice and for precision agriculture management, with implications for global food security and agricultural environmental protection. The proposed methodology may offer insights for remote sensing monitoring of other crops and heavy metal contamination.

2. Materials and Methods

This study aims to develop the Cadmium Early Stress Index (CESI) for the rapid and accurate detection of cadmium stress in rice at a regional scale. We integrated field surveys and Sentinel-2 satellite data, adopted multi-angle spectral feature extraction, and used an enhanced generalized additive model neural network (E-GAMI-Net) for analysis. The method aims to identify key indicators for the early diagnosis of cadmium stress and to construct an index that can detect the subtle spectral changes of early cadmium stress in different environments (Figure 1).

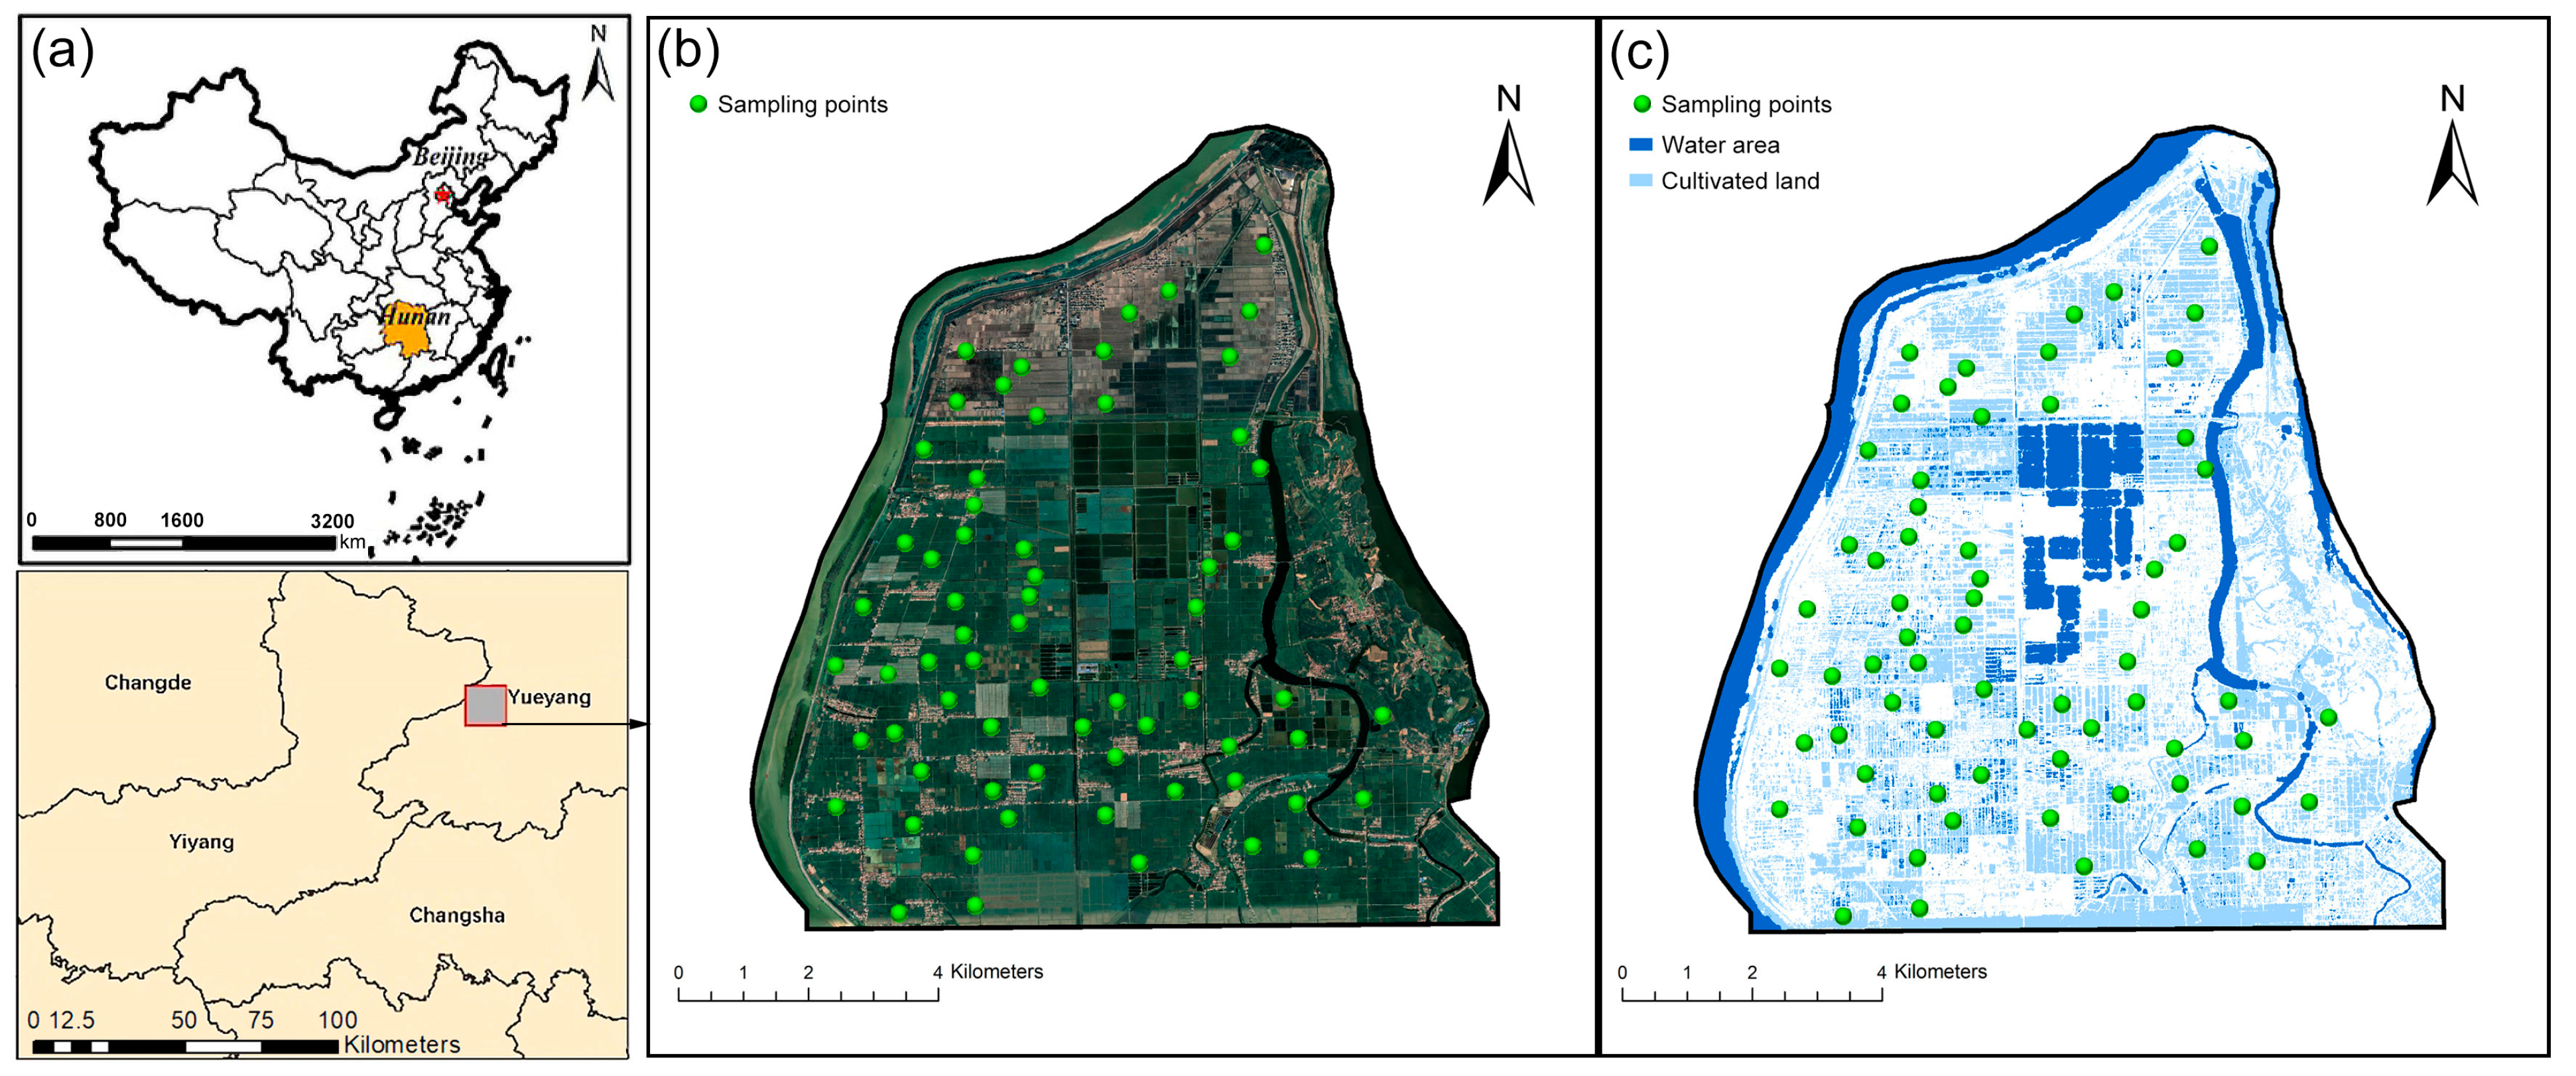
2.1. Study Area and Data Acquisition

2.1.1. Study Area

The study area was located in Yueyang, Hunan Province, China (Figure 2), covering approximately 218 km2 adjacent to Dongting Lake. This region experiences a subtropical monsoon climate with an average annual temperature of 17.3 °C, 1739.6 h of sunshine, and 1415.2 mm of precipitation [25]. Rice cultivation dominates the agricultural landscape, accounting for over 90% of the arable land. Previous studies have shown that Hunan Province, including Yueyang, exhibits elevated soil cadmium levels attributed to both natural geological factors and anthropogenic activities [3]. The study site was selected for its wide range of cadmium contamination levels and distinct spatial distribution patterns of cadmium concentrations [26]. The soil type in this area is mainly paddy soil, with a pH range of 5.5–6.8 and an organic matter content of 15–30 g/kg. These characteristics are similar to those of most rice-growing areas in southern China [3]. The cadmium pollution levels observed in this study (0.14–2.24 mg/kg) are typical of many cadmium-contaminated farmlands around the world [2]. Therefore, the study area not only reflects the general characteristics of cadmium pollution in Chinese paddy soils, but also provides a reference for monitoring cadmium pollution in similar climates and soil conditions globally. A total of 67 sampling points were strategically distributed across the area to capture the spatial variability of soil cadmium content and its effects on rice crops [14]. The cadmium pollution levels were classified based on soil cadmium concentrations according to Chinese soil environmental quality standards for agricultural land (GB 15618-2018 [27]) and recent studies on cadmium pollution in paddy fields [28,29]. The classification thresholds were set as follows: clean: Cd < 0.3 mg/kg; low: 0.3 mg/kg ≤ Cd < 0.6 mg/kg; medium: 0.6 mg/kg ≤ Cd < 1.0 mg/kg; high: Cd ≥ 1.0 mg/kg. These thresholds were selected based on a combination of regulatory requirements and ecotoxicological considerations.

2.1.2. Data Acquisition

Field sampling was conducted during the rice tillering stage (20–26 July 2019). A stratified random sampling method was employed to ensure representation of various cadmium pollution levels. Each sampling point covered a 30 m × 30 m area, corresponding to the spatial resolution of Sentinel-2 satellite imagery.
(1)
Field sampling
Soil samples were collected from 0–20 cm depth, with five subsamples mixed into one composite sample per point. Soil cadmium content was determined using Inductively Coupled Plasma Mass Spectrometry (ICP-MS, iCAP RQ, Thermo Fisher, Waltham, MA, USA), with a relative standard deviation (RSD) of less than 5% [30]. Chlorophyll content in rice leaves was measured using a SPAD-502 chlorophyll meter (Konica Minolta, Tokyo, Japan), with measurements from 30 leaves averaged per point. Leaf chlorophyll content (LCC) was calculated using the equation: Y = 0.996 x 1.52 , where Y is chlorophyll concentration (μg/cm2) and x is the SPAD reading [31].
(2)
Hyperspectral measurement
Field hyperspectral data were collected using an ASD FieldSpec 4 HandHeld-2 spectrometer (Malvern Panalytical, Westborough, MA, USA) (325–1075 nm range, 1 nm sampling interval, 3 nm resolution). Measurements were taken between 10:00 and 14:00 under stable weather conditions. Savitzky-Golay filtering was applied for smoothing [32].
(3)
Satellite data acquisition
Sentinel-2 Level-2A data were acquired from the European Space Agency’s Copernicus program, corresponding to the field survey period. The imagery underwent standard preprocessing procedures [33].

2.2. Multi-Angle Spectral Feature Extraction

To comprehensively capture the effects of cadmium stress on rice spectral characteristics, various features were extracted from seven different perspectives: original spectra, first-order derivative spectra, continuum-removed spectra, log-transformed spectra, spectral feature parameters, wavelet decomposition parameters, and vegetation indices [34]. Spectral feature parameters, including red edge position (680–780 nm), red edge amplitude, and near-infrared shoulder area (750–1075 nm), were calculated to quantify changes in plant physiology [35]. Wavelet decomposition using Daubechies 1 (db1) wavelet was applied with 8 decomposition levels, extracting sensitive wavelet statistical parameters [15]. For vegetation indices, we calculated a total of 22 different indices. These indices were selected for their sensitivity to various aspects of plant health and stress, including chlorophyll content, early stress detection, water stress, and canopy structure. Specifically, we included indices such as Normalized Difference Vegetation Index (NDVI), Enhanced Vegetation Index (EVI), and Modified Chlorophyll Absorption Ratio Index (MCARI) for their sensitivity to chlorophyll content and early stress detection [36]. Water Band Index (WBI) and Normalized Difference Water Index (NDWI) were included to account for water stress induced by heavy metal toxicity [37]. Additionally, Optimized Soil-Adjusted Vegetation Index (OSAVI) and Renormalized Difference Vegetation Index (RDVI) were calculated to assess potential impacts on canopy structure [38].

2.3. Improved GAMI-Net Model

This study adopted and enhanced the GAMI-Net model [20], an interpretable neural network combining generalized additive models with structured interactions, to enhance the early diagnosis of cadmium stress in rice. The mathematical representation of the model is as follows:
g E Y X = μ + j S 1 h j X j + j , l S 2 f j l X j , X l
where μ is the intercept, X represents the input features, Y is the response variable, and S 1 and S 2 are sets of individual features and pairwise interactions, respectively; h j X j represents the main effects of feature X j on Y , and f j l X j , X l represents the interaction effect between features X j and X l on Y .
To enhance predictive accuracy and robustness, we proposed an enhanced GAMI-Net (E-GAMI-Net) incorporating a Grid Search with k-Fold Cross-Validation (GSKC) algorithm [39,40]. The optimization objective is as follows:
g * E Y X = arg m i n L θ   μ + j S 1 h j X j + j , l S 2 f j l X j ,   X l
where L θ is the loss function averaged over k-fold cross-validation: L θ = 1 K k = 1 K 1 n k i = 1 n k l Y ,   g E Y X ;   θ , arg m i n L θ signifies the optimization of the model parameters θ by minimizing L θ . K is the number of cross-validation folds, n k is the sample size in the k t h validation set, l Y ,   g E Y X ;   θ is the loss for an individual sample, and θ is the parameter space determined through grid search.
The E-GAMI-Net (Figure 3) was implemented in Python 3.9 with TensorFlow. It employs three hidden layers (64, 32, 16 neurons) with ReLU activation, trained using an Adam optimizer (learning rate: 0.001). We used 10-fold cross-validation, exploring learning rates (1 × 10⁻⁴ to 1 × 10⁻²) and L2 regularization (1 × 10⁻⁵ to 1 × 10⁻²) [41]. The E-GAMI-Net model is available on GitHub (https://github.com/RaySinclair01/Enhanced-GAMI-Net, accessed on 19 August 2024). The model’s performance was compared with traditional machine learning models, including Random Forest (RF), Support Vector Machine (SVM), and Artificial Neural Network (ANN). Details on these classical models are provided in Supplementary Materials Section S4.

2.4. Model Interpretability and Construction of CESI

This study leveraged the high interpretability of the E-GAMI-Net model to conduct feature importance analysis, feature response curve analysis, and feature interaction effect analysis [20]. These analyses formed the foundation for constructing the novel Cadmium Early Stress Index (CESI). Utilizing the decomposable feedforward network structure of E-GAMI-Net, we evaluated the contributions of individual features and their interactions to the model predictions. The feature importance analysis was performed by assessing the variance explained by each main effect subnetwork and interaction effect subnetwork. A feature response curve analysis was conducted by visualizing the outputs of the individual main effect and interaction effect subnetworks across their respective input feature ranges. To analyze feature interactions, pairwise interaction subnetworks were utilized to quantify and visualize the combined effects of feature pairs [42].
Based on these interpretability analyses, we developed CESI to integrate the advantages of multiple spectral features and their interactions. CESI was formulated as a weighted sum of the individual feature contributions and their interaction terms:
C E S I = i w i f i X i + i j w i j g i j X i , X j
where f i X i represents individual feature contributions, g i j X i , X j denotes feature interactions, and w i and w i j are their respective weights. A genetic algorithm was employed to optimize these weights. The index’s predictive accuracy and stability were evaluated through two comparative analyses: first, comparing CESI with existing methods (vegetation indices and classical machine learning models) under normal conditions, and, second, comparing their performances with 15% added noise to assess robustness [43].
By integrating non-linear relationships and feature interactions from the interpretable structure of E-GAMI-Net, CESI was expected to better capture subtle spectral changes associated with early cadmium stress compared to linear vegetation indices [14]. The rigorous feature selection and weight optimization process aimed to produce a robust index capable of consistent performance under environmentally noisy conditions [18].

2.5. Model and Index Evaluation Methodology

This study employed a comprehensive evaluation approach to validate the performance of the enhanced GAMI-Net model (E-GAMI-Net) and assessed the effectiveness of the constructed Cadmium Early Stress Index (CESI). The evaluation assessed model prediction accuracy, regional-scale application efficacy, and robustness to interference, with all aspects compared against existing methods.

2.5.1. Prediction Accuracy Assessment

An independent validation dataset was utilized to evaluate the predictive accuracy of both the E-GAMI-Net model and CESI. Key performance metrics included the coefficient of determination (R2), root mean square error (RMSE), and relative prediction deviation (RPD). These metrics were calculated using standard formulae to quantify the model’s explanatory power, prediction errors, and predictive capability relative to data variability. The formula for calculating these indicators are as follows:
(i)
R 2 = 1 i = 1 N y i y ^ i 2 i = 1 N y i y ¯ 2
(ii)
RMSE = 1 N i = 1 N y i y ^ i 2
(iii)
RPD = SD RMSE
(iv)
SE = S D N
where N is the number of data points, y i is the ith observed value, y ^ i is the ith predicted value, y ¯ is the average of the observed values, and SD is the standard deviation.

2.5.2. Regional-Scale Application Evaluation

To assess CESI’s practical applicability, Sentinel-2 satellite imagery underwent preprocessing, including atmospheric correction, geometric rectification, and radiometric calibration. A polynomial non-linear transformation was used to mitigate scale effects, followed by CESI calibration for optimal performance with Sentinel-2 multispectral data. The calibrated CESI was then applied to generate a spatial distribution map of early cadmium stress in rice throughout the study area, demonstrating its effectiveness in large-scale monitoring scenarios.

2.5.3. Comparative Analysis and Stability Testing

The E-GAMI-Net model and CESI were benchmarked against existing methods, including traditional indices (HCSI, REP, NDVI) and classical machine learning models (SVM, RF, ANN). This comparison highlighted the advantages of our proposed approach in cadmium stress diagnosis. A stability test was conducted by introducing 15% Gaussian noise to the data, simulating potential real-world interferences. This test assessed the resilience of the E-GAMI-Net model and CESI to external disturbances, providing insights into their reliability under varied environmental conditions.

3. Results

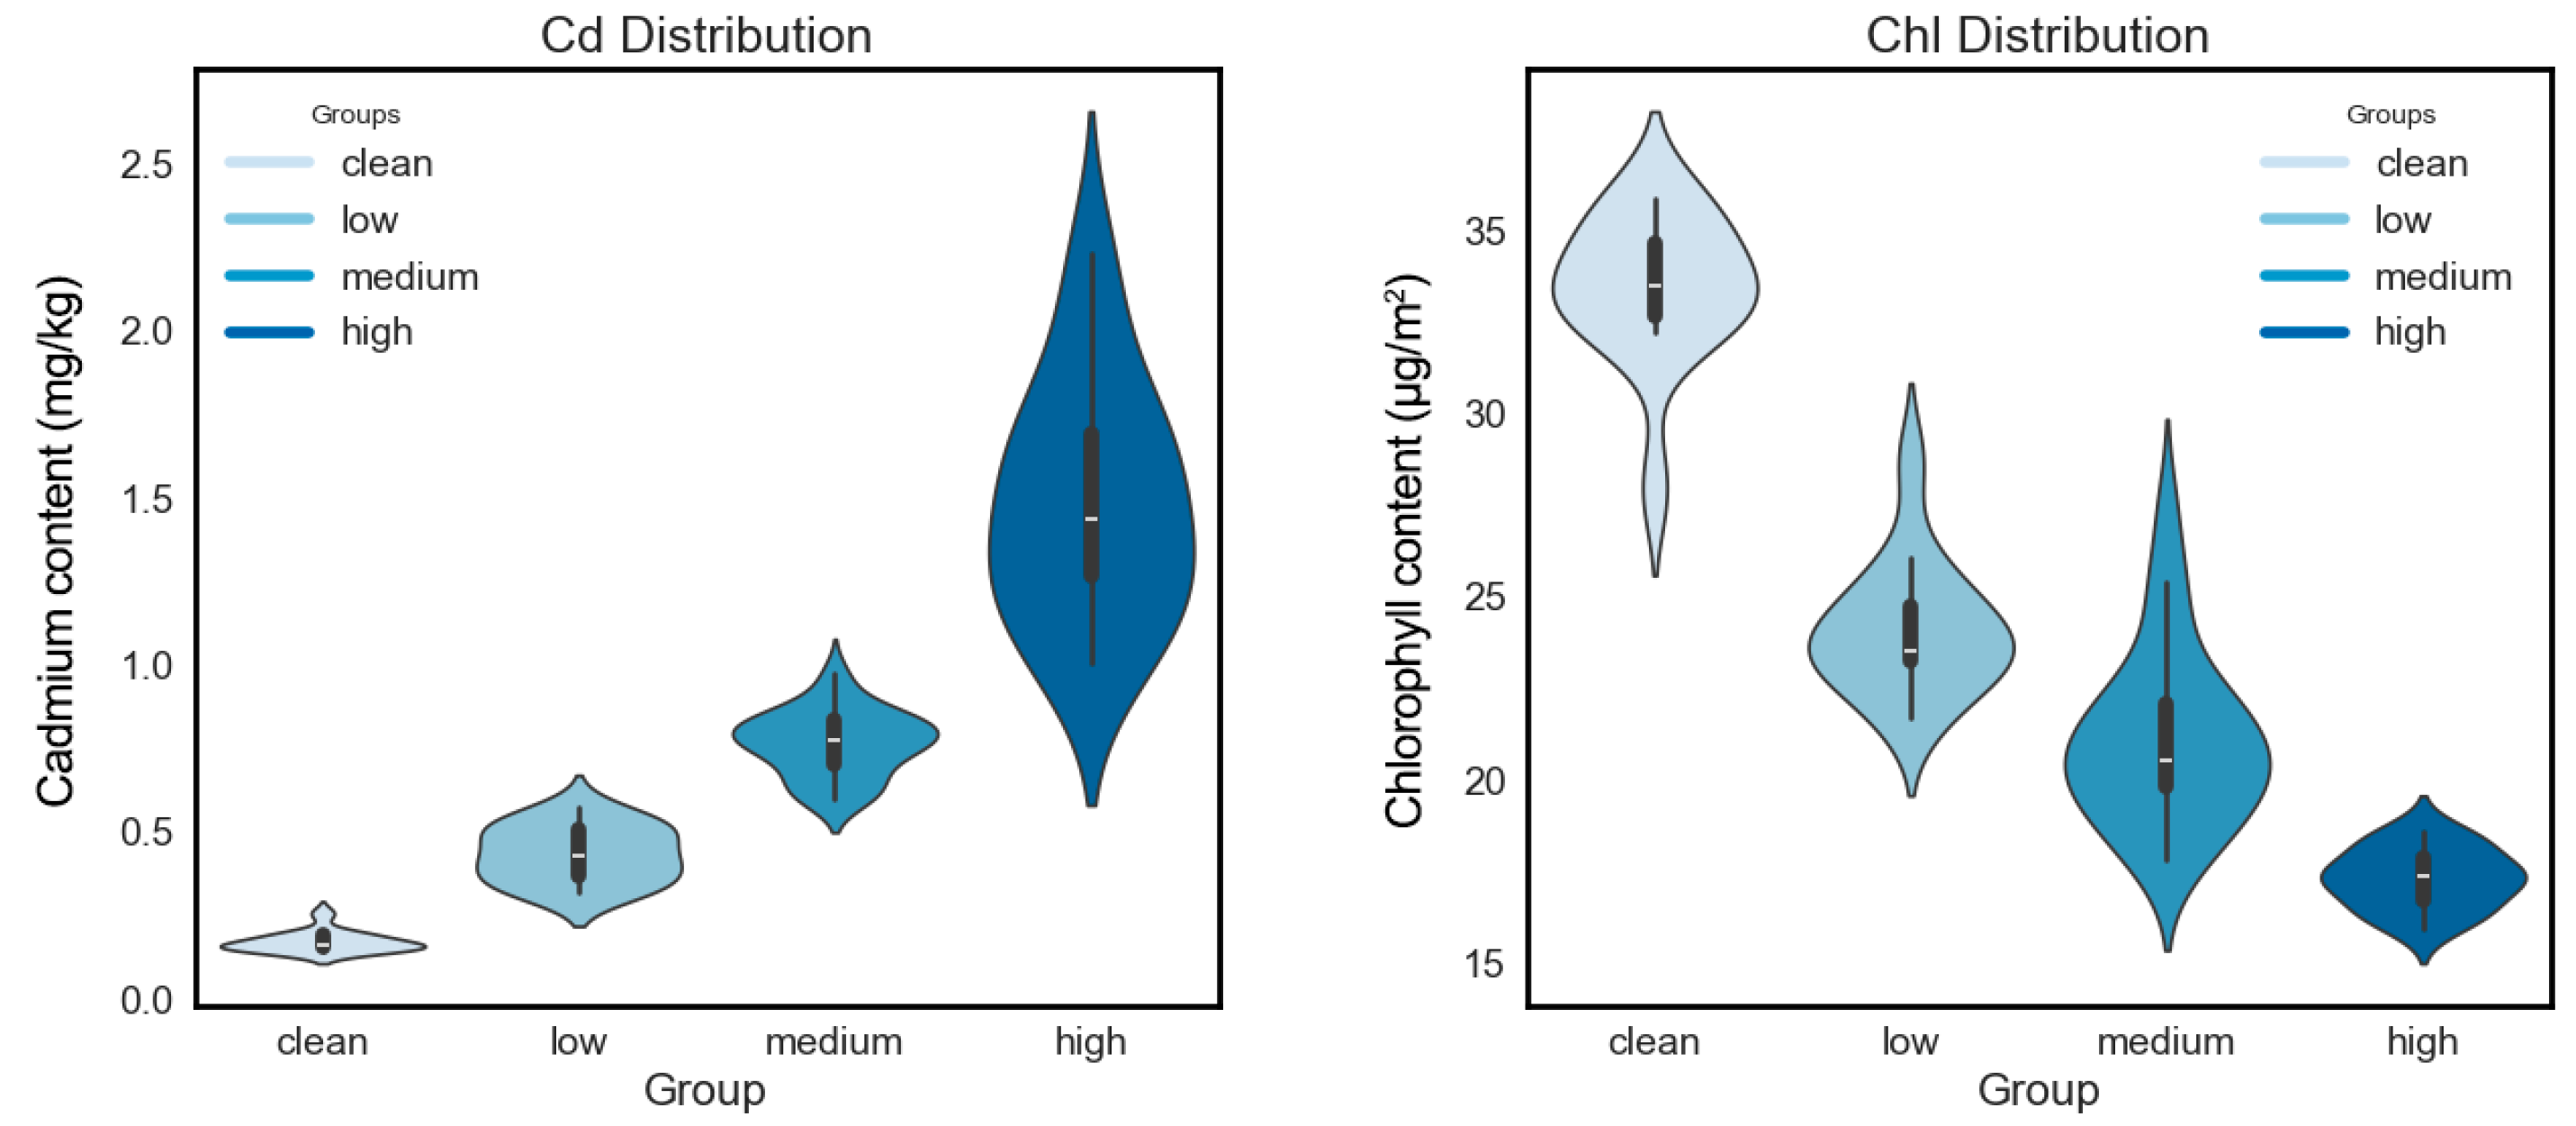
3.1. Statistical Analysis of Sampled Data

This research investigated the levels of soil cadmium and rice leaf chlorophyll content to evaluate cadmium pollution and its physiological impact on rice in the study area. As shown in Table 1, soil cadmium concentrations exhibited significant variation, ranging from 0.14 to 2.24 mg/kg, with a mean of 0.73 mg/kg and a standard deviation of 0.50 mg/kg. Table 1 summarizes the descriptive statistics of soil Cd content and SPAD values. The data show that there are significant differences in the degree of soil Cd pollution in the study area, which provides a good basis for evaluating the performance of CESI at different pollution levels. The distribution demonstrated a slight positive skew (skewness z-score = 0.874) and near-mesokurtic characteristics (kurtosis z-score = 0.362), indicating an approximately normal distribution. Chlorophyll content, measured as SPAD values and expressed in μ g / c m 2 , ranged from 15.97 to 35.87 μ g / c m 2 , with a mean of 23.58 μ g / c m 2 and a standard deviation of 6.03 μ g / c m 2 , exhibiting a similar distribution pattern (skewness z-score = 0.796, kurtosis z-score = 0.565).
Figure 4 illustrates the distribution of soil cadmium concentrations and chlorophyll content across four pollution categories (clean, low, medium, and high). The violin plots reveal a progressive increase in cadmium content from the ‘clean’ to ‘high’ categories, conversely, chlorophyll content displays an inverse trend, decreasing as cadmium pollution levels increase. The ‘medium’ and ‘high’ cadmium categories exhibit the most variability in both cadmium and chlorophyll distributions. The observed inverse relationship between soil cadmium levels and chlorophyll content suggests the potential for utilizing chlorophyll-related spectral indices for the early diagnosis of cadmium stress in rice plants.

3.2. Spectral Response to Cadmium Stress in Rice

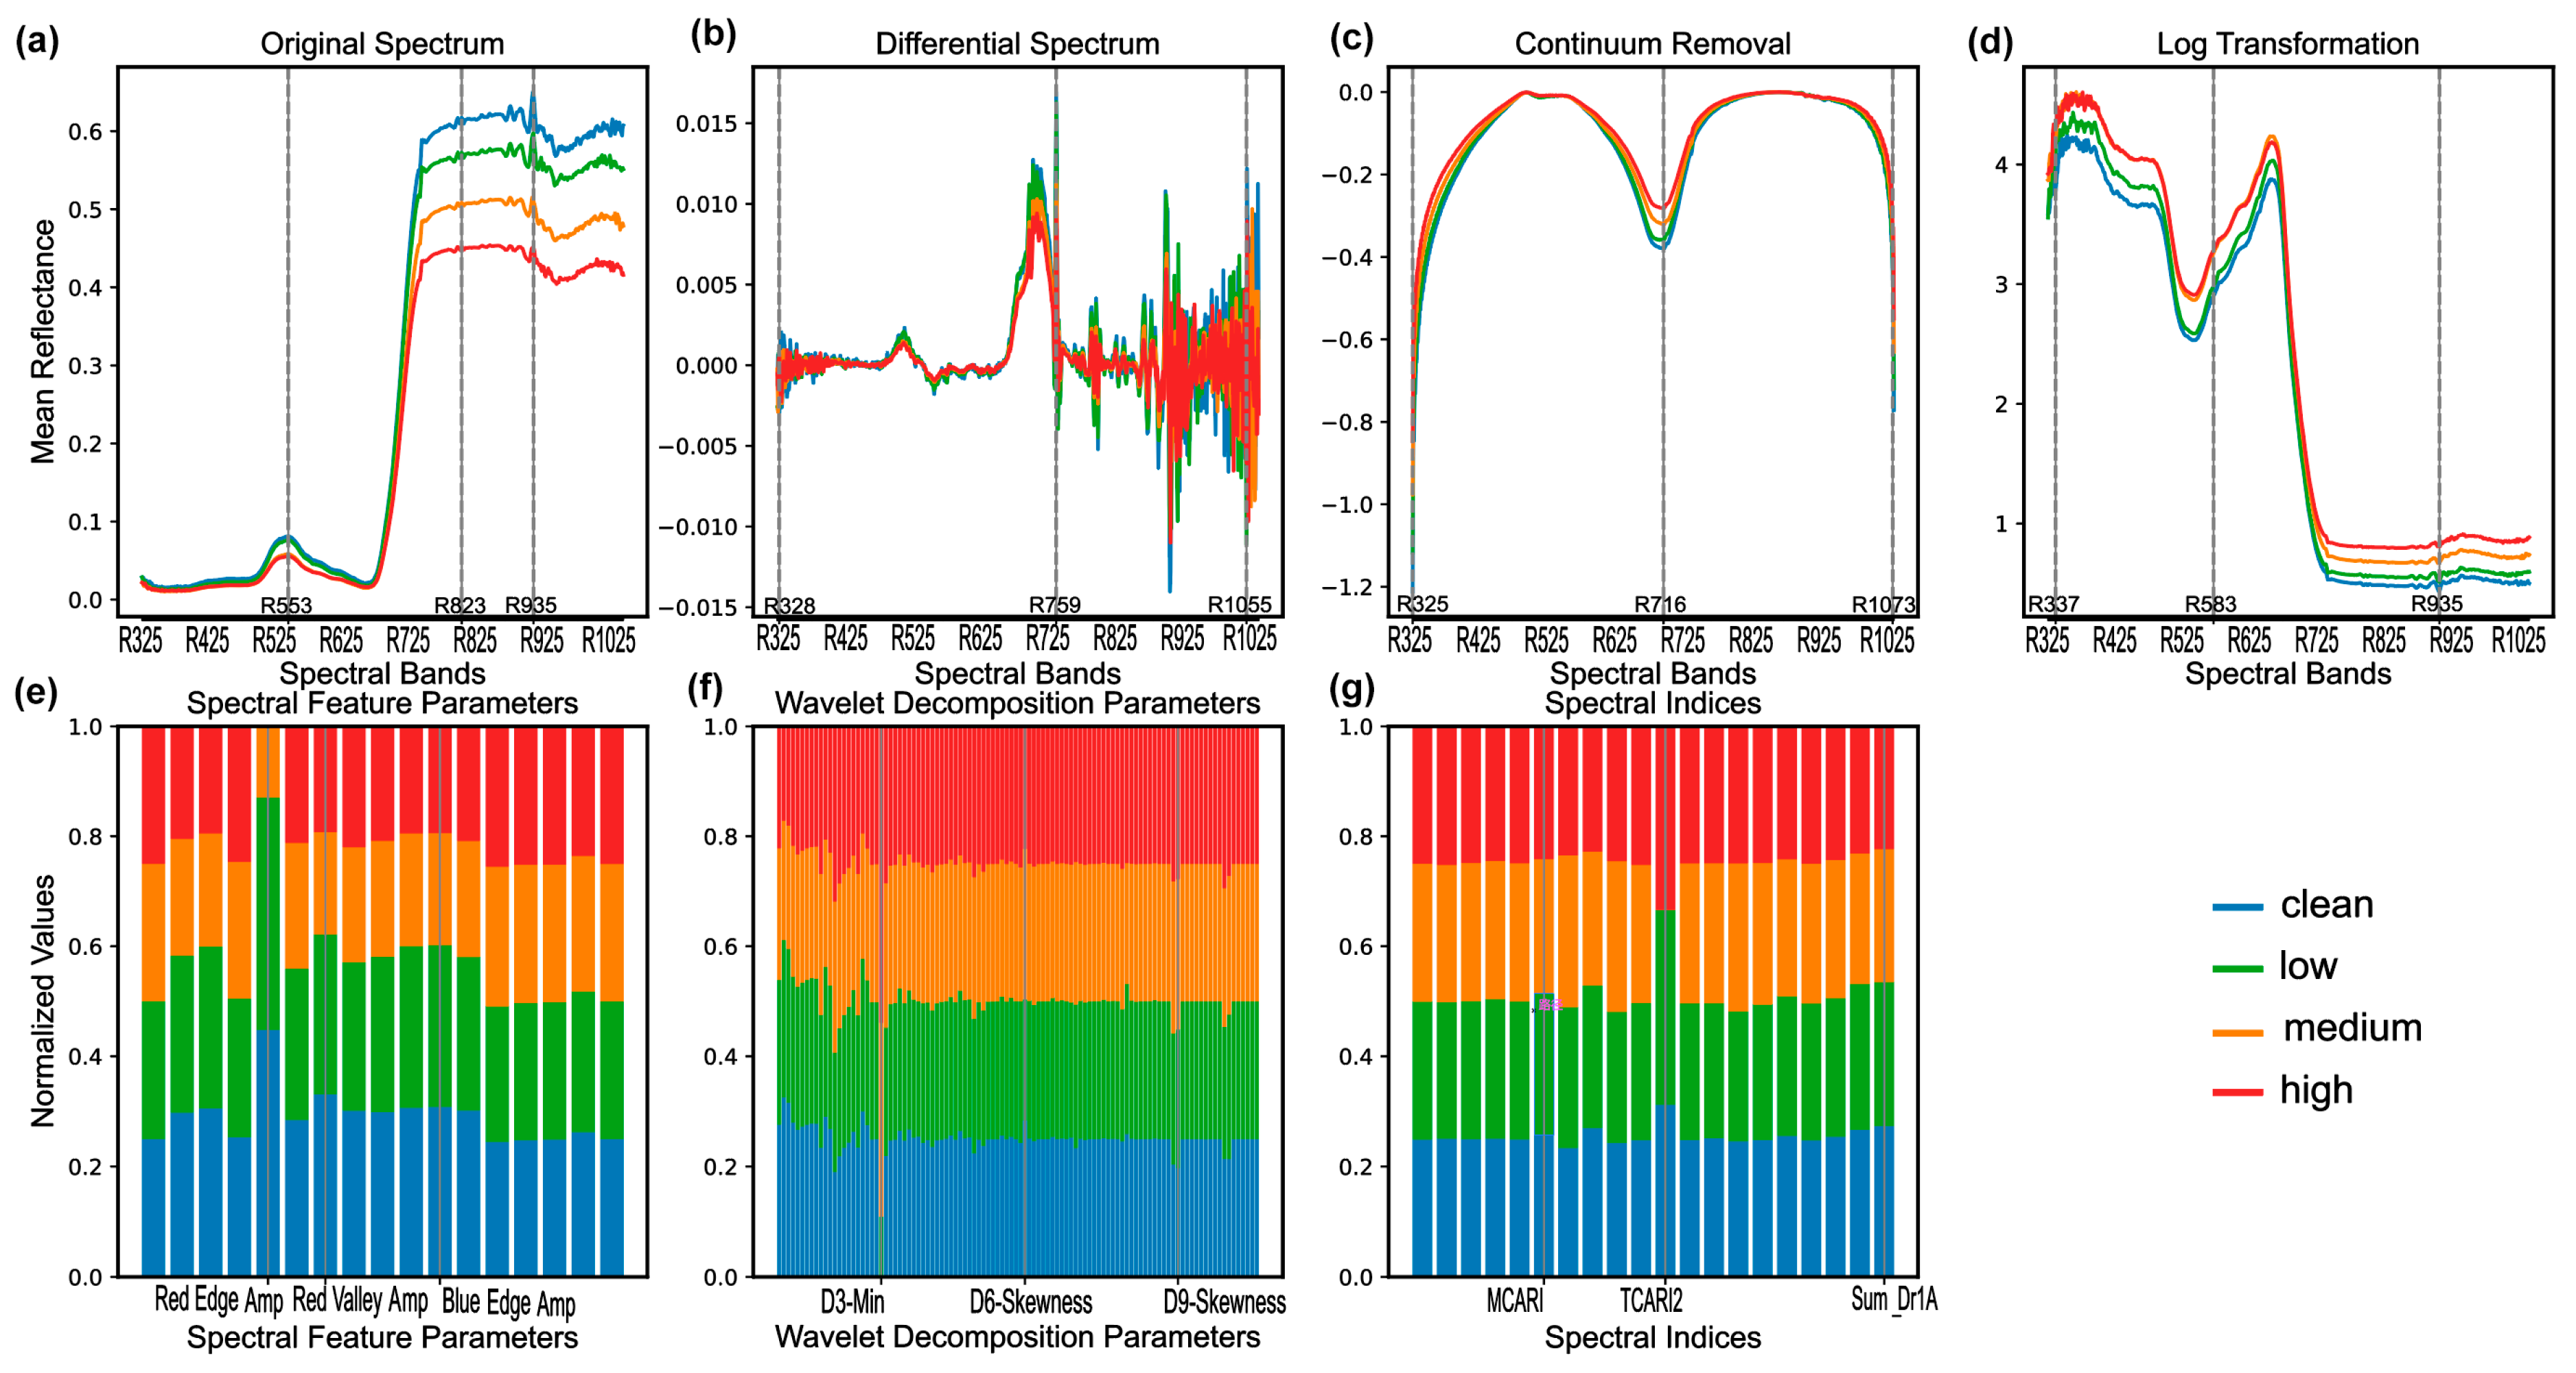
3.2.1. Spectral Reflectance in Response to Cadmium Stress

This study examined the spectral response of rice leaves to varying levels of cadmium contamination using multiple analytical approaches. Analysis of the reflectance spectra under different cadmium stress levels revealed significant alterations across visible, red-edge, and near-infrared regions as cadmium concentration increased. Notably, a reduction in reflectance at the green peak (550 nm) and a shift towards shorter wavelengths in the red-edge position were observed, particularly in moderately to highly contaminated samples. Quantitative assessment at 720 nm showed a 23.7% decrease in reflectance for the highly contaminated group compared to the control (p < 0.001), while at 860 nm the moderate and high contamination groups exhibited 12.5% and 18.9% reductions, respectively (p < 0.001). The spectral reflectance curves for different Cd pollution levels are presented in Figure S1 of the Supplementary Materials.

3.2.2. Comparison of Spectral Characteristics under Cadmium Stresses

Further analysis using various spectral transformation techniques (Figure 5) provided additional insights into cadmium-induced stress. The original spectra (Figure 5a) revealed a progressive decrease in reflectance within the near-infrared region (750–1025 nm) with increasing cadmium levels. First-order differential spectra (Figure 5b) accentuated changes around 759 nm, while continuum removal (Figure 5c) and logarithmic transformation (Figure 5d) enhanced the visibility of absorption features and differences in the visible spectrum. Quantitative analysis of spectral features (Figure 5e), wavelet decomposition parameters (Figure 5f), and vegetation indices (Figure 5g) revealed that Red Edge Amplitude, D3-Min wavelet parameter, and Modified Chlorophyll Absorption Ratio Index (MCARI) were particularly sensitive to cadmium stress levels.

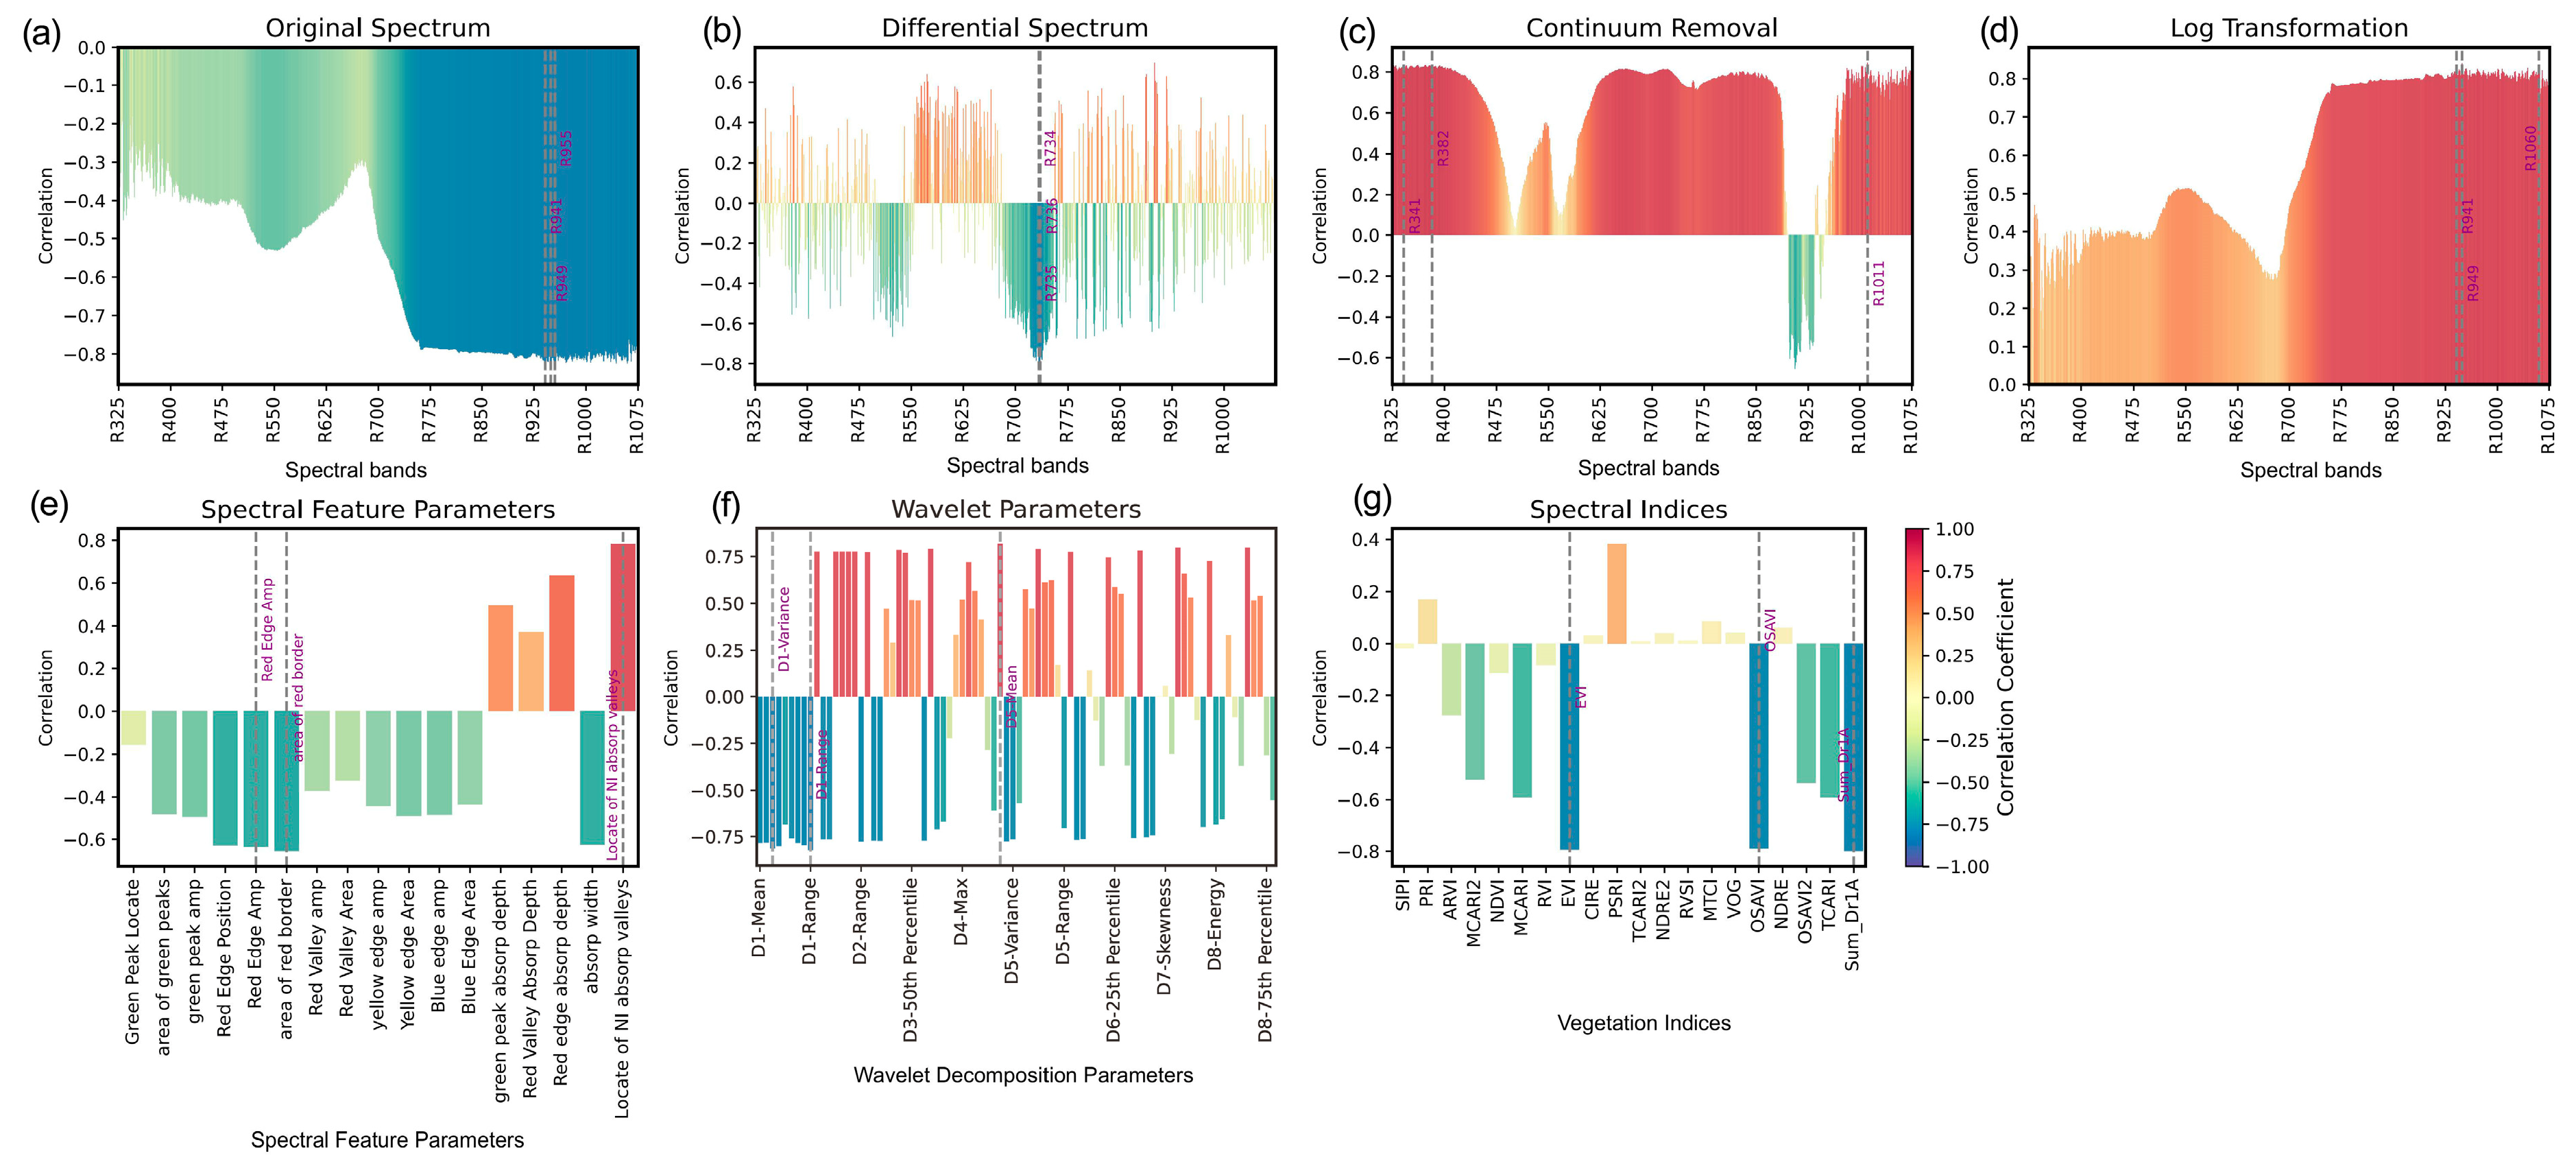
3.2.3. Correlation Analysis of Spectral Characteristics under Cadmium Stress

The correlation analysis (Figure 6) conducted between spectral features and soil cadmium content revealed significant indicators of stress. Notably, strong negative correlations were identified in the near-infrared region (950–1000 nm) of the original spectrum (Figure 6a). The first-order differential spectra (Figure 6b) exhibited high negative correlations in the red-edge region (700–750 nm). Among the spectral parameters (Figure 6e), red edge amplitude, red edge area, and near-infrared absorption valley showed the strongest correlations. Wavelet decomposition analysis (Figure 6f) highlighted D1-Variance, D1-range, and D5-Mean as the most strongly correlated parameters. Vegetation indices (Figure 6g), EVI, OSAVI, and Sum_Dr1A exhibited the strongest relationships to cadmium content.
Following comprehensive group differences and correlation analyses of multispectral characteristics, 40 spectral features exhibiting sensitivity to cadmium stress were identified. However, the proximity of feature count to sample size raised concerns regarding potential overfitting and multicollinearity. To address these issues, a rigorous feature selection process was implemented, employing Lasso regression, Random Forest, and recursive feature elimination methodologies. This process culminated in the identification of 24 key features, which were subsequently utilized for model analysis. For a detailed exposition of the feature selection procedure, readers are directed to the Supplementary Materials Section S2.

3.3. Performance and Interpretability of E-GAMI-Net Model

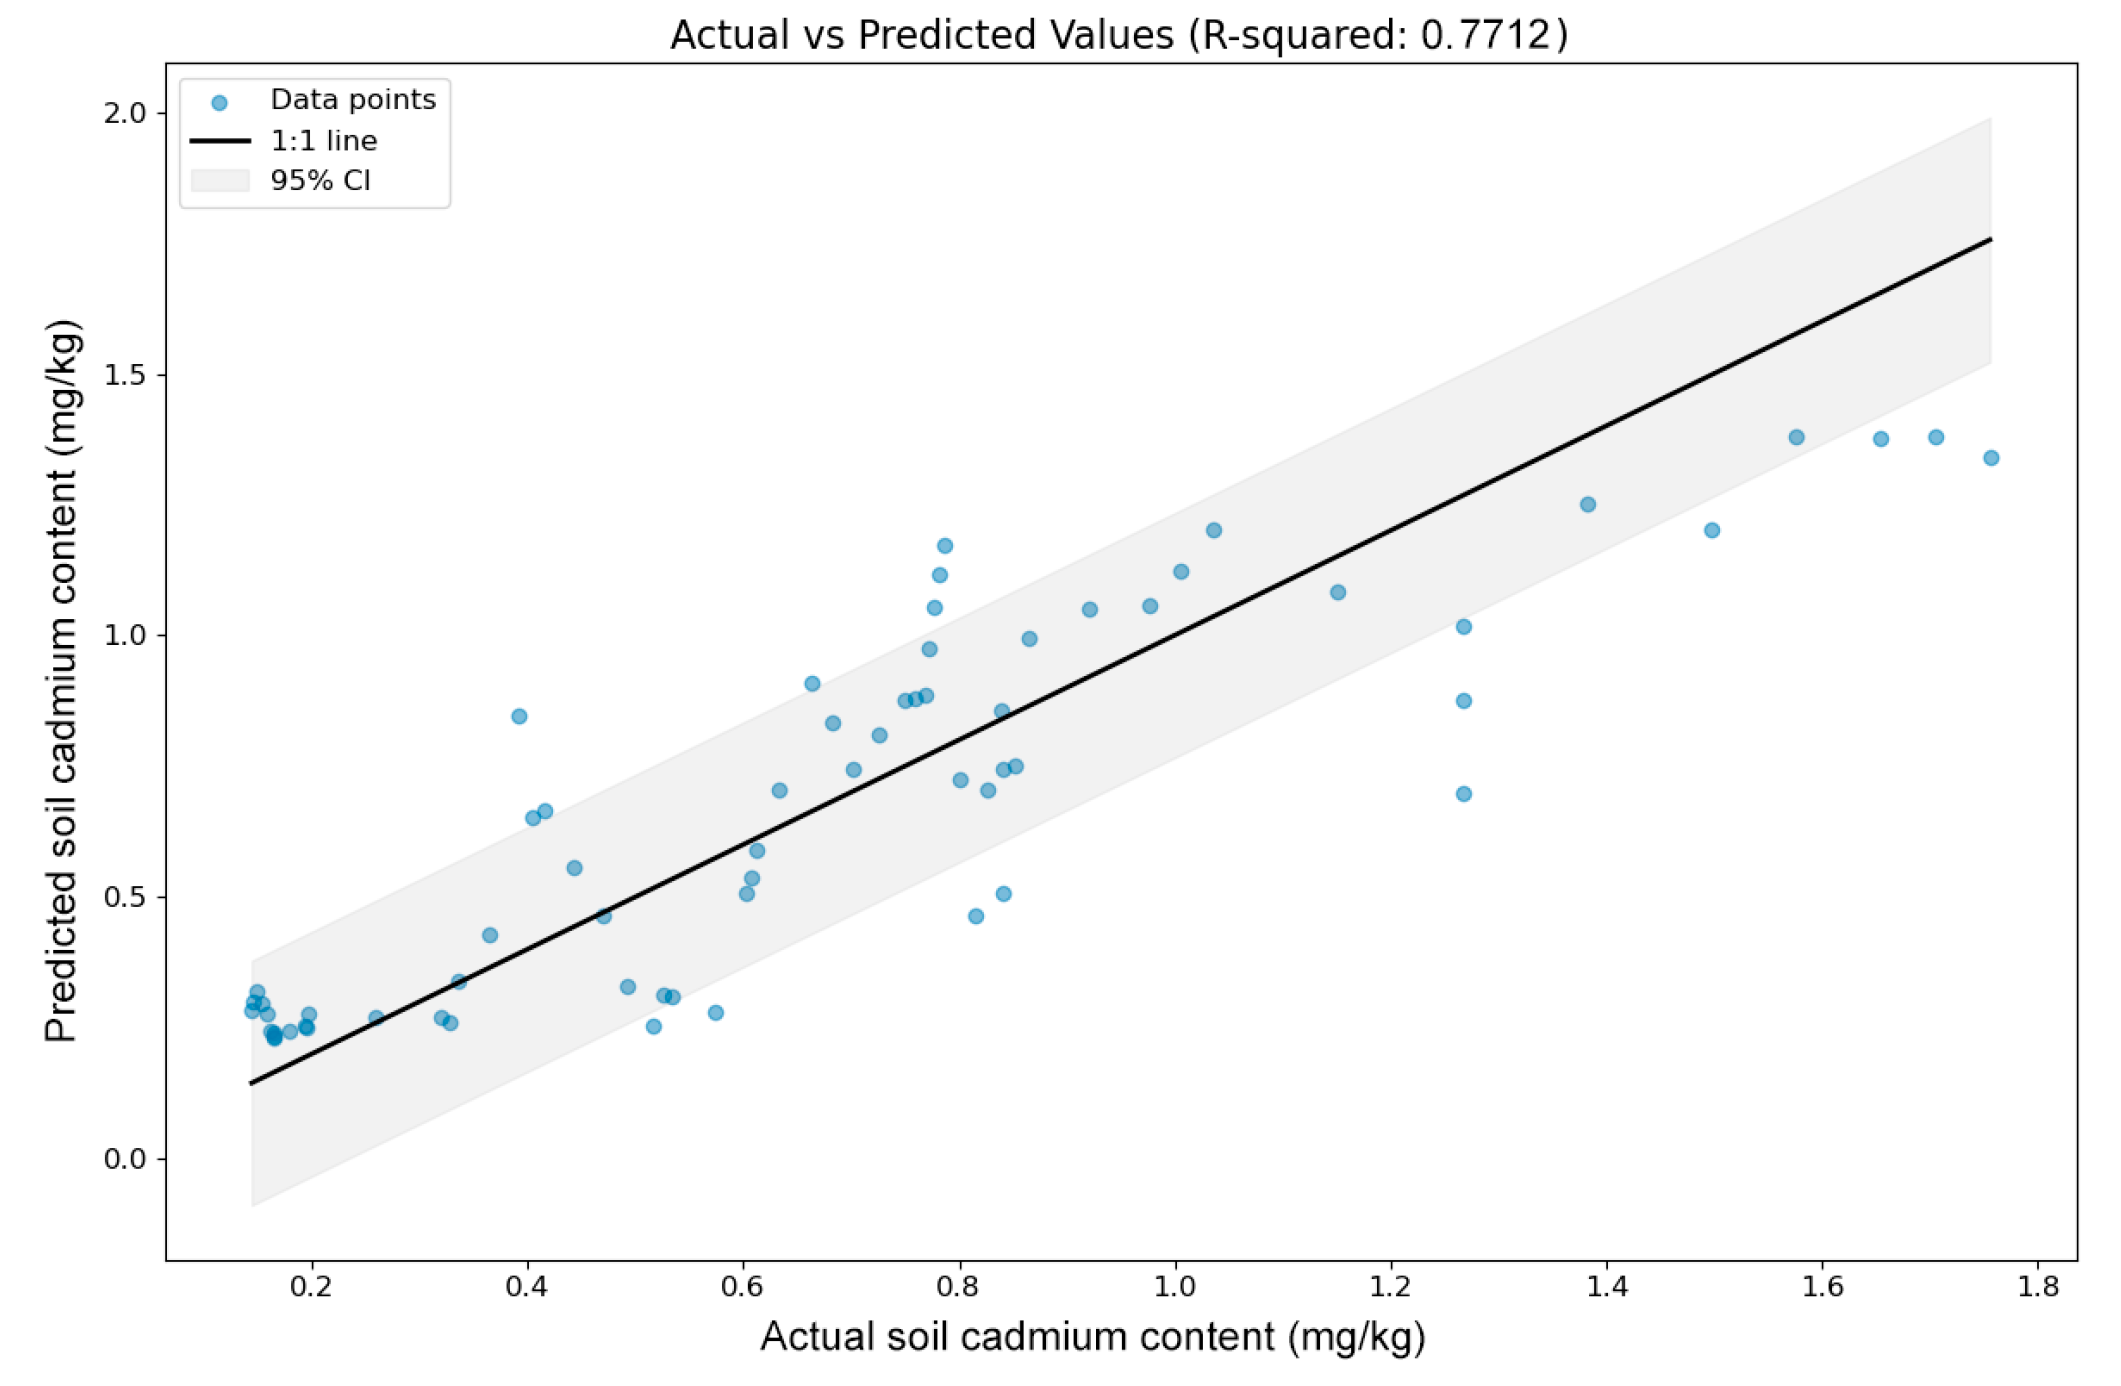
3.3.1. Performance of E-GAMI-Net Model

The E-GAMI-Net model demonstrated high effectiveness in diagnosing early cadmium stress, as evidenced by its performance on the test set (Figure 7). Detailed numerical results can be found in Supplementary Materials Table S5, which lists the specific values of all evaluation metrics. The model achieved a coefficient of determination (R2) of 0.91 and a root mean square error (RMSE) of 0.09 mg/kg. The E-GAMI-Net model exhibited a relative prediction deviation (RPD) of 3.56, which was higher than other comparative models. This elevated RPD value indicates the model’s strong capability to handle data variations, particularly at low cadmium concentrations, confirming its predictive power and stability across the entire sample range.

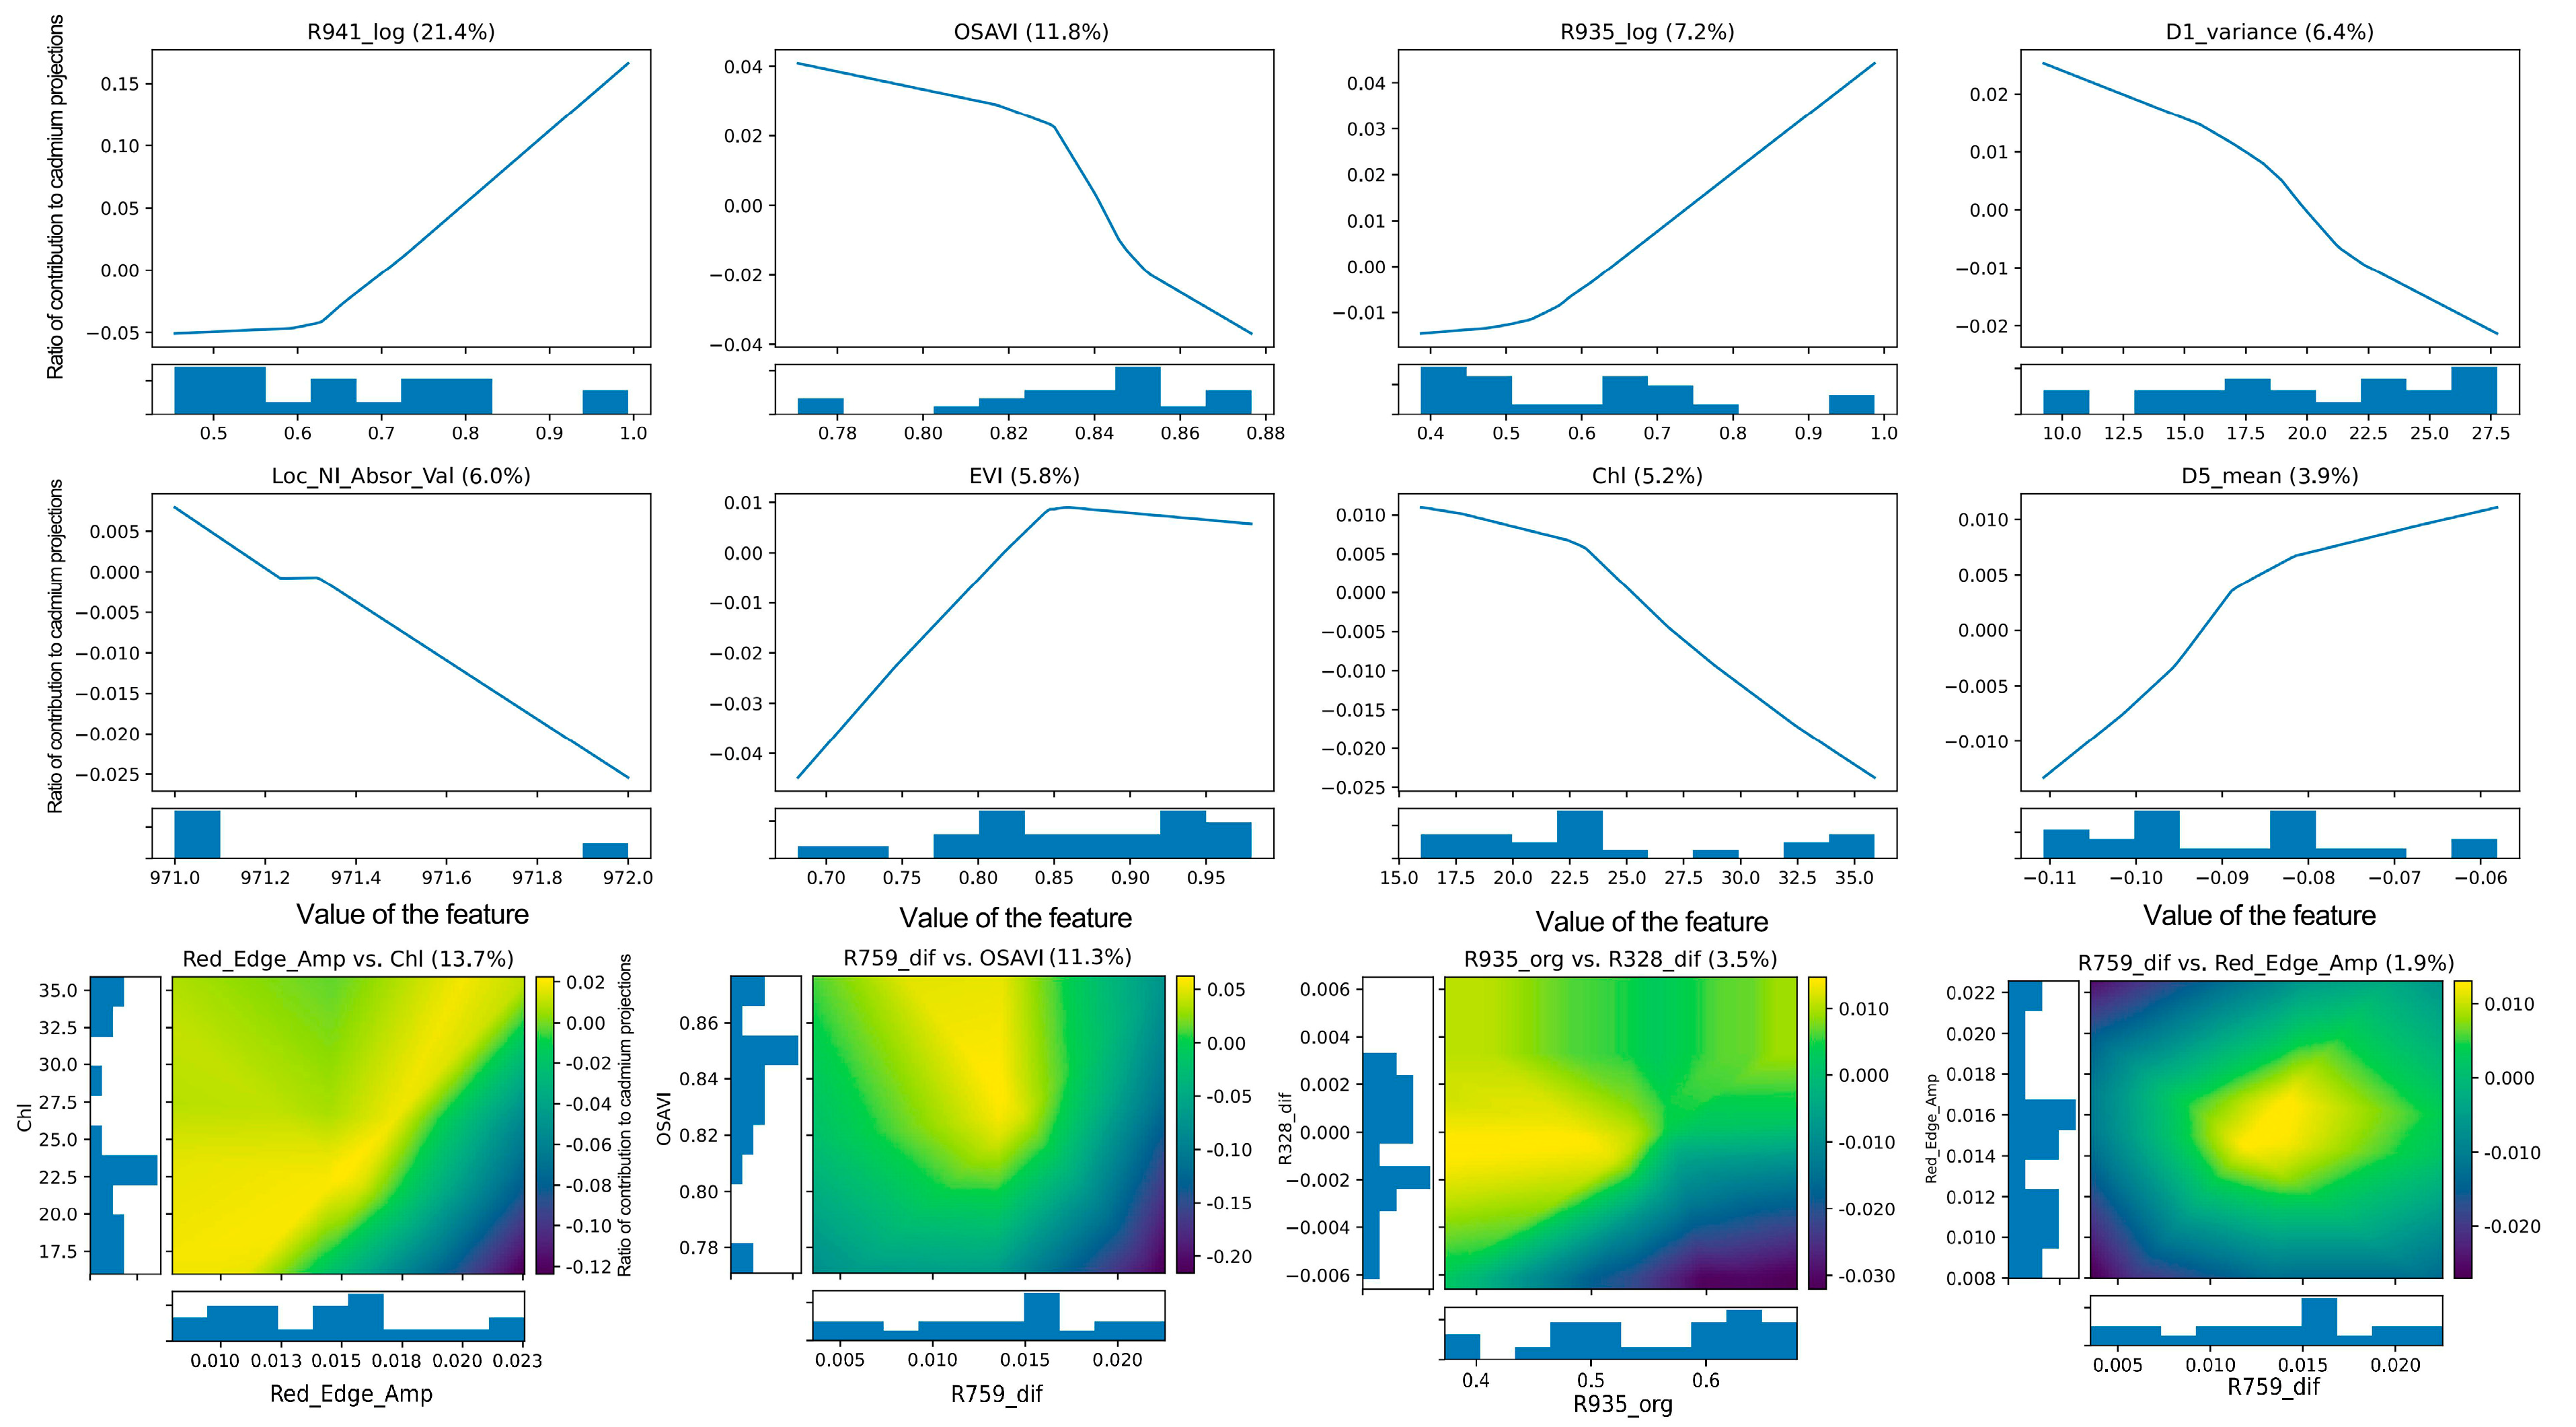
3.3.2. Feature Importance Analysis of the E-GAMI-Net Model

The interpretability analysis of the GAMI-Net model revealed the relative importance of various spectral features in diagnosing cadmium stress, encompassing both main effects and interaction effects (Figure 8). Among the main effects, the log-transformed spectral reflectance at 941 nm (R941_log) emerged as the most influential feature, contributing 21.4% to the model’s predictive power. This was followed by the Optimized Soil-Adjusted Vegetation Index (OSAVI) at 11.8%, and the log-transformed spectral reflectance at 935 nm (R935_log) at 7.2%. Furthermore, the model also identified significant interaction effects, with the interaction between Red Edge Amplitude and Chlorophyll content (Chl) being the most prominent, contributing 13.7% to the model’s accuracy. The interaction between the first-order differential spectrum at 759 nm (R759_dif) and OSAVI contributed 11.3%.

3.3.3. Analysis of Feature Response Curves

The feature response curves are illustrated in Figure 8 and quantified in Table 2. Spectral feature response functions for cadmium stress detection revealed complex relationships between spectral features and their contributions to cadmium stress prediction in rice leaves. R941_log and R935_log exhibited strong positive non-linear correlations with cadmium stress, particularly at higher values, as evidenced by their cubic response functions ( f 1 and f 3 ). This suggests their sensitivity to stress-induced changes in leaf structure and water content. Conversely, OSAVI, D1_variance and Loc_NI_Absor_Val demonstrated negative relationships. OSAVI’s response, modeled by a sigmoid function ( f 2 ), showed a sharp decrease in contribution as its value increased, indicating its effectiveness in detecting stress-related changes in rice leaf structure.
EVI displayed a complex non-linear pattern ( f 6 ), with its contribution peaking at moderate values. Chl exhibited a negative correlation ( f 7 ), with its negative contribution intensifying at higher values, reflecting the inhibitory effect of cadmium stress on chlorophyll synthesis. D5_mean showed a predominantly positive relationship ( f 8 ), with its strongest impact at higher values. The high R2 values (0.9869 to 0.9993) for these fitted response functions underscore the model’s accuracy in capturing these intricate spectral-stress relationships. These quantified response patterns provide a robust mathematical foundation for integrating multiple spectral features, laying the groundwork for the development of the Cadmium Early Stress Index (CESI) in subsequent analyses.

3.3.4. Analysis of Feature Interaction Effects

The analysis of feature interaction effects, as illustrated in Figure 8 and quantified in Table 3, revealed significant synergies between certain spectral characteristics in predicting cadmium stress in rice. The interaction between Red Edge Amplitude and Chlorophyll content (Chl) emerged as the most significant, contributing 13.7% to the model’s accuracy. This interaction, represented by function f 9 (R2 = 0.4350), showed a complex pattern with the highest combined effect observed at moderate chlorophyll levels and high red edge amplitudes, indicating a nuanced relationship between leaf structure and pigment content under cadmium stress. The interaction between the first derivative at 759 nm (R759_dif) and OSAVI was also notable, contributing 11.3%, with function f 10 (R2 = 0.4833) capturing a strong effect at low OSAVI values and moderate R759_dif values, suggesting the importance of combining vegetation structure indices with spectral slope information for stress detection.
Furthermore, the interaction between the reflectance at 935 nm (R935_org) and the first derivative at 328 nm (R328_dif) contributed 3.5% to the model’s performance, as described by function f 11 (R2 = 0.4542). This interaction highlighted the subtle but important relationship between near-infrared reflectance and blue-edge derivatives in stress detection. Lastly, the interaction between R759_dif and Red Edge Amplitude, despite contributing only 1.9%, revealed notable patterns captured by function f 12 (R2 = 0.4293), particularly evident at elevated values of both features. These interaction effects, though exhibiting moderate R2 values, underscore the complexity of spectral responses to cadmium stress in rice and emphasize the importance of considering multiple spectral features in combination for accurate early diagnosis. The integration of these interaction terms into the GAMI-Net model significantly enhanced its ability to capture the multifaceted impacts of cadmium stress on rice leaf spectral properties.

3.4. Construction of the CESI

Building upon the comprehensive analysis of spectral features and their interactions, we developed the CESI to enhance the early detection of cadmium stress in rice. The CESI incorporates the most significant spectral features and interaction effects identified by the E-GAMI-Net model, utilizing their importance scores as initial weights. To optimize both complexity and accuracy, we selected features and interactions with importance scores exceeding 5%. This approach ensured the capture of the most influential factors while maintaining computational efficiency.
The initial formulation of CESI was based on the fitted response functions ( f 1 to f 12 ) of key features, as detailed in Table 2 and Table 3. This method captured both individual and synergistic effects of spectral characteristics on cadmium stress manifestation. To refine the CESI structure and coefficient weights, we employed a genetic algorithm, using actual cadmium content data serving as the optimization objective. This process maximized the index’s sensitivity and accuracy in predicting cadmium stress levels.
The resulting CESI is formulated as:
CESI = 0.1058 f 1 ( R 941 _ l o g ) 0.2837 f 2 ( O S A V I ) + 1.0888 f 3 ( R 935 _ l o g ) 52.2007 f 4 ( D 1 _ v a r i a n c e )                                                   12.5709 f 5 ( L o c _ N I _ A b s o r _ V a l ) 1.8153 f 6 ( E V I ) + 0.0011 f 9 ( R e d _ E d g e _ A m p , C h l )                                                   0.0012 f 10 ( R 759 d i f , O S A V I )
To mitigate the effects of light changes on CESI, we applied the internal average relative reflectance (IARR) method for pre-processing the raw hyperspectral data [44]. This method reduces the impact of light variations by dividing the spectrum of each pixel by the average spectrum of the entire image. Additionally, we introduced an adaptive thresholding method that dynamically adjusts the weight of the absolute value component (R941_log) in CESI based on image statistical features. This approach improves CESI’s adaptability to light changes while maintaining its sensitivity [45].
The CESI formula integrates multiple spectral features, each reflecting distinct aspects of cadmium stress in rice plants. Log-transformed reflectance at 941 nm (R941_log) and 935 nm (R935_log) capture changes in leaf structure and water content. The Optimized Soil-Adjusted Vegetation Index (OSAVI) and Enhanced Vegetation Index (EVI) account for variations in canopy structure and chlorophyll content. The first-order wavelet variance (D1_variance) enables detection of subtle spectral changes associated with early stress symptoms.
Notably, CESI incorporates interaction terms, such as the Red Edge Amplitude with Chlorophyll content ( f 9 ) and the first derivative at 759 nm with OSAVI ( f 10 ). These terms capture complex, non-linear relationships between spectral features under cadmium stress conditions, a key advantage over traditional vegetation indices.
To evaluate CESI’s performance, we compared its predicted values with measured soil cadmium content using an independent validation dataset (Figure 9). The results showed a high coefficient of determination (R2 = 0.77) and low root mean square error (RMSE = 0.08 mg/kg), demonstrating CESI’s strong predictive power and high accuracy in estimating cadmium stress levels.

3.5. Performance Evaluation and Comparative Analysis of CESI

To comprehensively evaluate the performance of the Cadmium Early Stress Index (CESI) and validate its superiority, we conducted a series of tests and comparisons with other methods. On an independent validation set, CESI demonstrated excellent diagnostic accuracy, achieving an R2 of 0.69 and an RMSE of 0.09 mg/kg, indicating a high level of predictive accuracy and dependability. CESI also performed exceptionally well in interference resistance tests. Under 15% Gaussian noise, its noise resistance was reflected by a mere 5.6% decrease in R2. Furthermore, CESI exhibited high computational efficiency, with an average processing time of only 0.03 s, making it particularly suitable for large-scale real-time monitoring applications. These results demonstrate CESI’s ability to maintain high diagnostic accuracy in complex environments.
To further validate CESI’s advantages, we conducted a comprehensive comparison with traditional machine learning models, common vegetation indices, and other cadmium stress diagnostic indices (Table 4). The comparison included Random Forest (RF), Support Vector Machine (SVM), Artificial Neural Network (ANN), Normalized Difference Vegetation Index (NDVI), Red Edge Position (REP), and Heavy Metal Stress Index (HCSI).
The comparison results indicate that CESI outperformed other methods across all metrics. In terms of predictive accuracy, CESI’s R2 and RMSE were significantly superior to other models and indices. In the interference resistance assessment, CESI exhibited the smallest performance degradation under noisy conditions, demonstrating excellent stability. Although CESI’s computation time was slightly longer than simple vegetation indices, it was significantly faster than machine learning models, achieving an optimal balance between efficiency and accuracy. These results highlight CESI’s unique advantages in the early diagnosis of cadmium stress.
To further validate CESI’s stability under varying light conditions, we performed additional analyses. We simulated different light intensities by adding ±20% random variation to the original reflectance data. After IARR pre-processing, CESI maintained high stability (coefficient of agreement r = 0.92, p < 0.001) under these simulated light changes. Moreover, using multi-temporal Sentinel-2 data, we found that CESI showed good consistency in time series (average coefficient of variation CV = 0.15), further confirming its stability in practical applications.

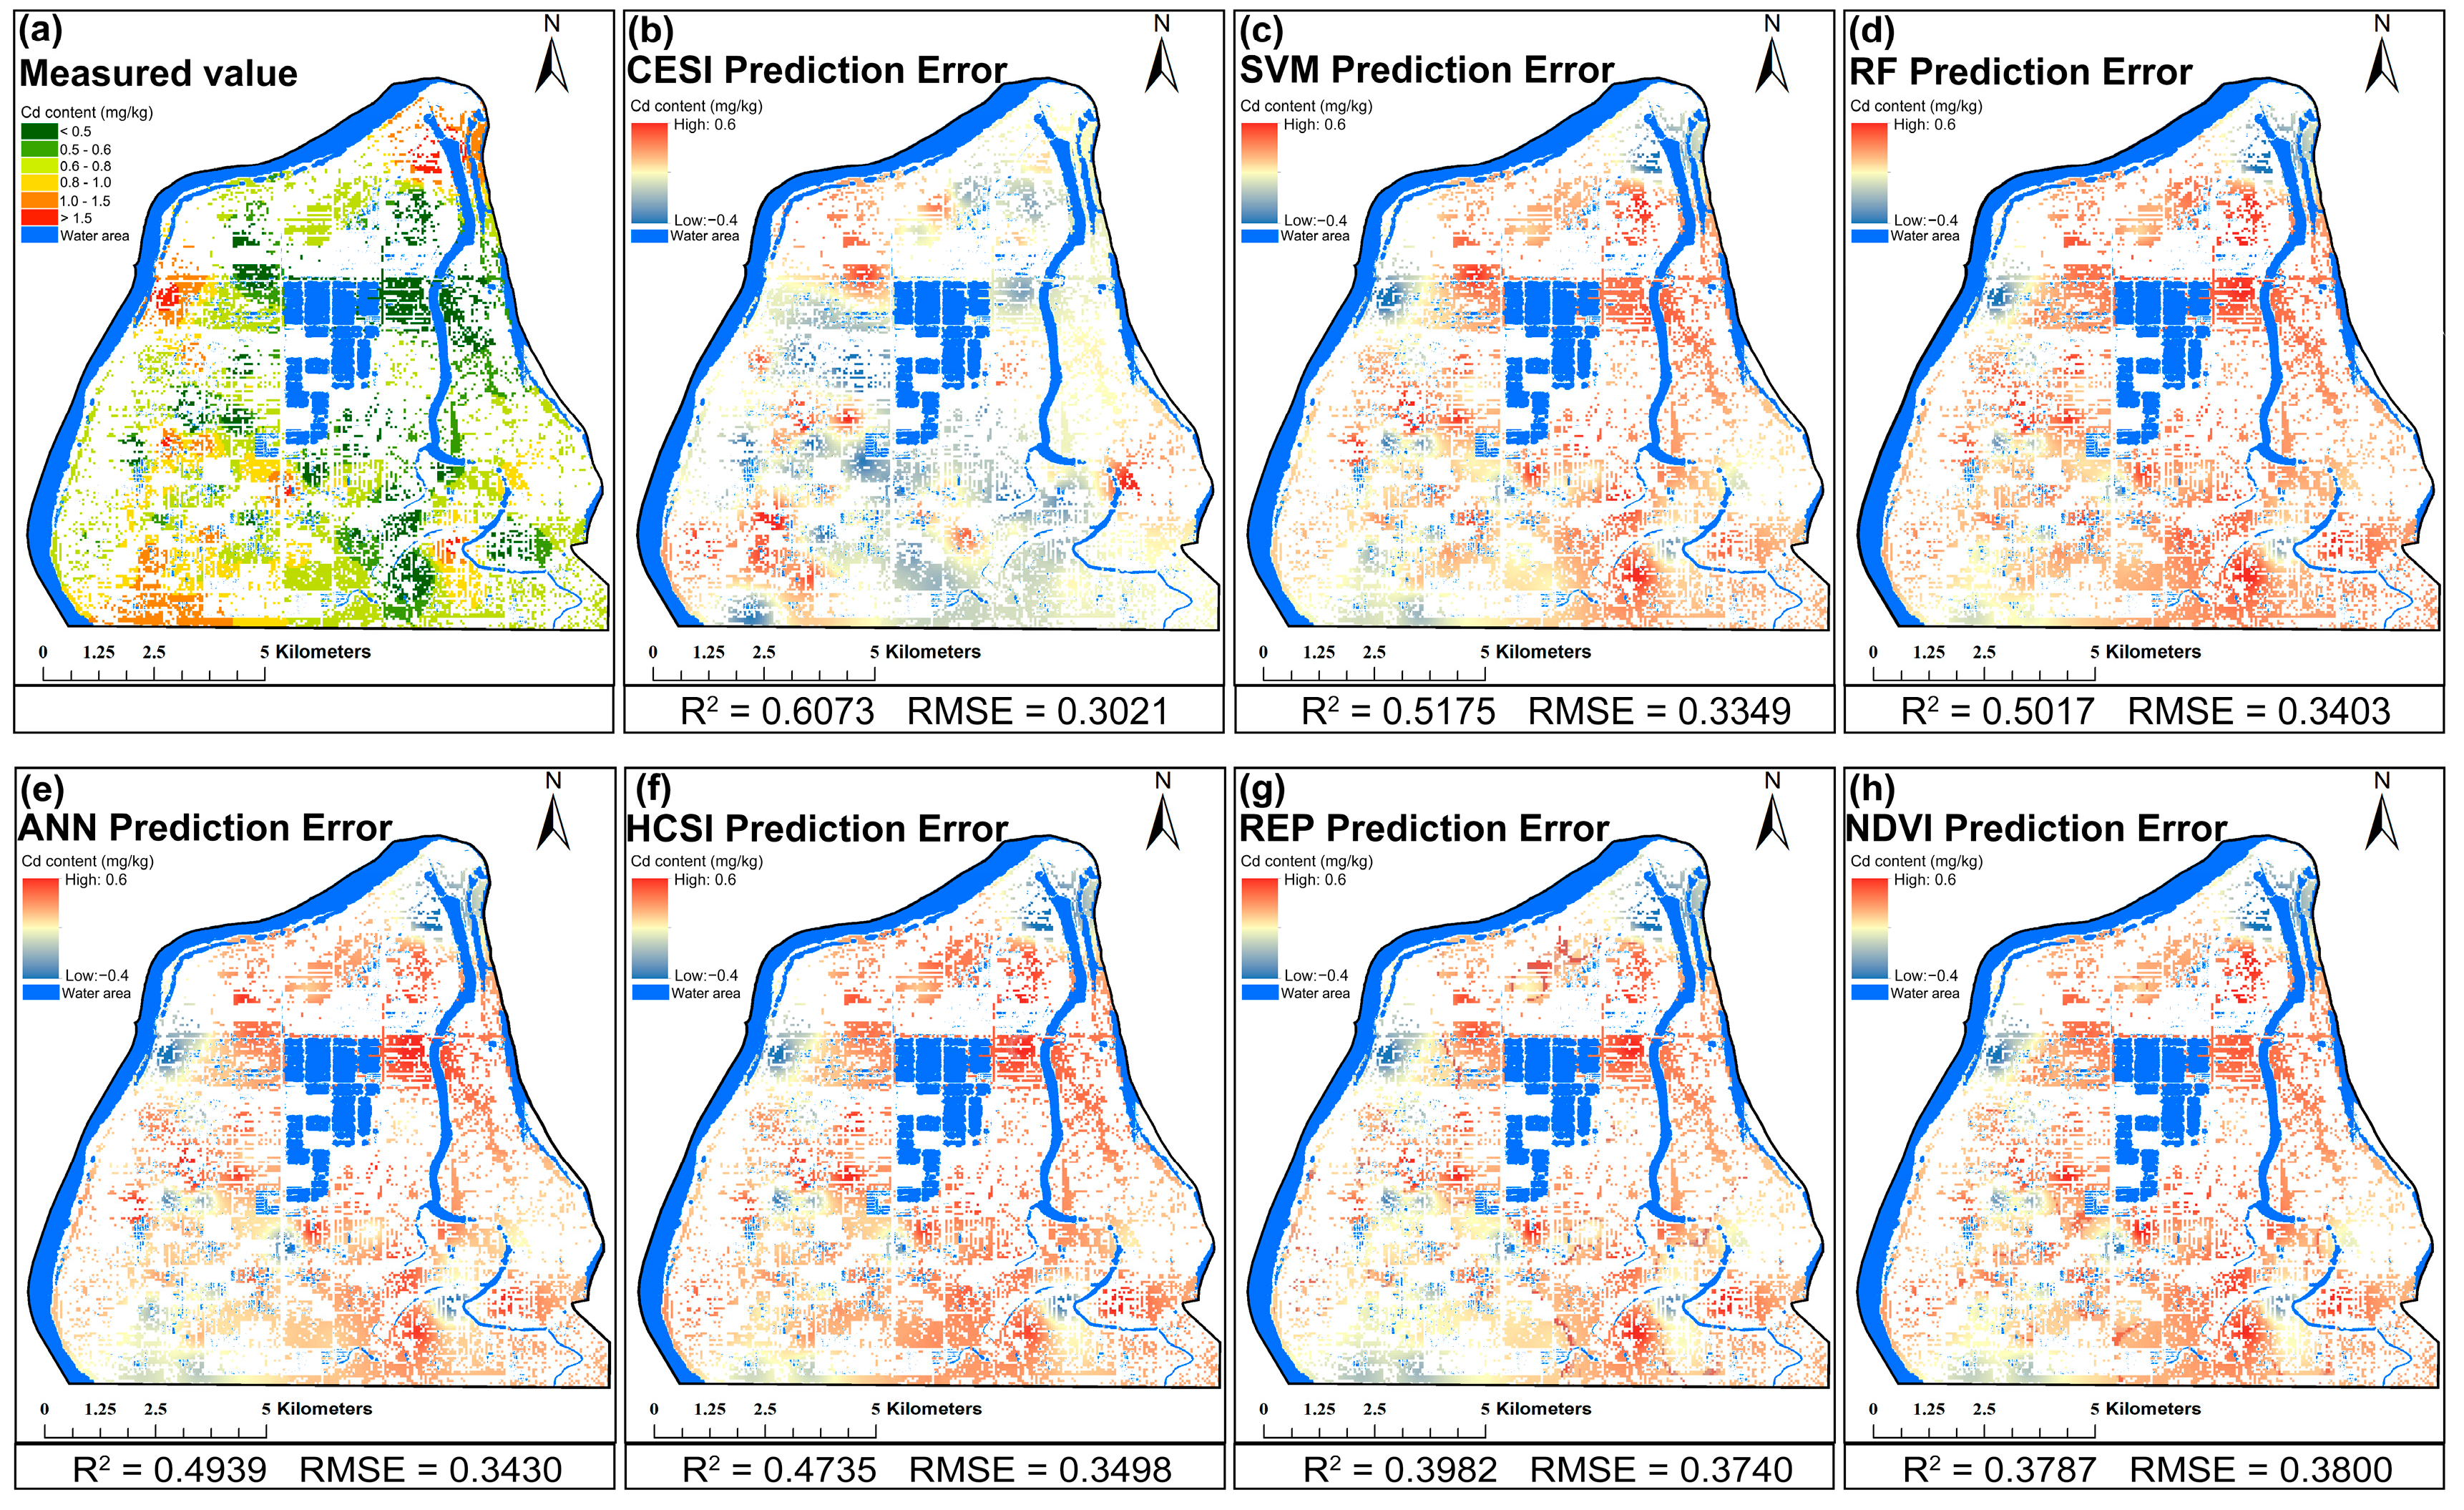
3.6. Regional-Scale Remote Sensing Inversion

Figure 10 collectively demonstrates the superior performance of the Cadmium Early Stress Index (CESI) in mapping soil cadmium content across the study area. Figure 10a presents the measured cadmium distribution, revealing a heterogeneous pattern with high concentrations clustered in central and southeastern regions, while lower levels predominate in northern and southwestern areas. The CESI prediction map (Figure 10b) exhibits the closest alignment with the measured values, accurately capturing major contamination hotspots and preserving overall spatial patterns. This visual assessment is corroborated by quantitative metrics in Figure 10, where CESI achieves the highest coefficient of determination (R2 = 0.6073) and the lowest root mean square error (RMSE = 0.3021) among all the methods evaluated.
Other machine learning models, such as Support Vector Machine (SVM) and Random Forest (RF), show reasonable agreement with measured values but tend to overestimate moderately contaminated areas. This is reflected in their lower R2 values (0.5175 and 0.5017, respectively) and higher RMSE values (0.3349 and 0.3403, respectively) compared to CESI. Traditional vegetation indices, including Normalized Difference Vegetation Index (NDVI) and Red Edge Position (REP), demonstrate limited effectiveness in representing cadmium distribution, particularly in areas with moderate to high contamination. This limitation is evident in their substantially lower R2 values (0.3787 and 0.3982, respectively) and higher RMSE values (0.3800 and 0.3740, respectively). The comprehensive analysis of spatial patterns and quantitative metrics underscores CESI’s efficacy in capturing the nuanced distribution of soil cadmium contamination. These results highlight CESI’s potential as a robust tool for regional-scale monitoring of cadmium stress in rice paddies, offering improved accuracy and reliability compared to conventional methods and indices.

4. Discussion

4.1. Advantages of the E-GAMI-Net Model for Early Cadmium Stress Detection in Rice

The Enhanced Generalized Additive Model with Interactions (E-GAMI-Net) demonstrates significant advantages in early cadmium stress detection, achieving high accuracy (R2 = 0.91, RMSE = 0.09 mg/kg). This performance can be attributed to several key factors. Firstly, the E-GAMI-Net effectively captures complex non-linear relationships between spectral features and cadmium content [20], as evidenced by the feature response curve analysis, which accurately detects rapid changes in the Log-transformed reflectance at 941 nm (R941_log) within the critical 0.5–0.7 mg/kg range. Compared to recent deep learning applications, our model shows unique advantages in dealing with high-dimensional spectral data and addressing complex environmental factors [17]. This non-linear modeling capability enables E-GAMI-Net to outperform traditional linear models in detecting subtle spectral changes associated with early cadmium stress [10]. Secondly, the model successfully integrates multiple important feature interactions. For instance, the strong interaction between Red Edge Amplitude (Red_Edge_Amp) and Chlorophyll content of rice leaves (Chl), contributing 13.7% to diagnostic accuracy, reveals that cadmium stress likely affects both chlorophyll content and leaf structure simultaneously [46]. This multidimensional impact is difficult to capture with single-feature indices, explaining E-GAMI-Net’s superiority over traditional vegetation indices [43].

4.2. Innovative Aspects and Practical Value of CESI

The Cadmium Early Stress Index (CESI), developed based on E-GAMI-Net’s interpretability analysis, exhibits several innovative characteristics that contribute to its superior performance. CESI integrates multiple spectral features including the log-transformed reflectance at 941 nm (R941_log), Optimized Soil-Adjusted Vegetation Index (OSAVI), and the Near-Infrared Absorption Valley Position (Loc_NI_Absor_Val), enabling a comprehensive detection of cadmium stress effects on leaf water content, canopy structure, and biochemical composition, respectively [14]. By incorporating interaction effect terms, CESI more accurately describes complex relationships between spectral features and cadmium content [12]. The inclusion of an interaction term between Red_Edge_Amp and Chl captures the compound impact of cadmium stress on plant physiology and structure [8], while the introduction of D1-variance wavelet decomposition parameters enhances CESI’s sensitivity to subtle changes in spectral curve shape [15]. These innovations contribute to CESI’s superior early diagnostic performance (R2 = 0.77 for hyperspectral data and R2 = 0.61 for Sentinel-2 multispectral data) and robust interference resistance (R2 decrease of only 5.6% under 15% noise). Compared with recently developed deep learning-based heavy metal stress detection methods [47], our CESI more accurately describes the complex relationship between spectral features and cadmium content by introducing interaction effect terms. These innovations make CESI excel in early diagnosis performance and anti-interference ability, demonstrating its significant potential for early cadmium stress detection in rice [21].

4.3. Specificity of CESI for Cadmium Stress Detection

While CESI incorporates spectral features sensitive to various stress factors, its unique combination and weighting of these features enhance its specificity for cadmium stress detection. Comparative studies have shown that cadmium stress induces distinct spectral responses in rice plants. For instance, Wu et al. (2019) reported that under high cadmium stress, near-infrared reflectance of rice leaves decreased by 25–30%, a more significant change compared to drought stress [48]. Furthermore, cadmium stress caused a more pronounced blue shift (5–7 nm) in the red edge position compared to other metal stresses like lead or arsenic (2–3 nm shift) [48]. A key advantage of CESI is its integration of multiple spectral features and their interactions. The non-linear relationship between red edge amplitude and chlorophyll content under cadmium stress differs significantly from patterns observed under drought or heat stress [49]. By capturing these complex interactions, CESI can more accurately distinguish cadmium stress from other stress types. However, we acknowledge that further research is needed to improve CESI’s specificity. Future work should include multi-stress control experiments, the exploration of shortwave infrared spectral features, and the application of advanced machine learning techniques to enhance discrimination between different stress types.

4.4. Potential and Challenges in Regional-Scale Application

The CESI-based cadmium stress diagnosis method demonstrates significant potential for large-scale monitoring, achieving robust performance (R2 = 0.6073, RMSE = 0.3021) in regional-scale application. It successfully identified previously unknown moderate cadmium stress areas, particularly in central and southeastern regions, outperforming other machine learning models and traditional vegetation indices [30]. CESI showed superior ability in distinguishing moderate to high contamination areas, crucial for targeted intervention strategies. However, challenges persist in scaling from ground-point measurements to satellite remote sensing. These challenges are particularly evident when dealing with highly heterogeneous regions [50]. Despite rigorous spectral matching and spatial interpolation, model performance slightly decreased in highly heterogeneous areas, particularly in transition zones between contamination levels [14].
Future research should focus on multi-scale integration methods to improve model applicability across spatial resolutions, addressing within-pixel heterogeneity in satellite imagery [16]. Incorporating multi-temporal satellite data could enhance the model’s ability to capture dynamic cadmium stress patterns, providing insights into seasonal variations and long-term trends [18]. These advancements would further improve the model’s predictive power and its practical utility for ongoing monitoring and management of affected areas, ultimately contributing to more effective environmental management and agricultural planning in regions affected by cadmium contamination.

4.5. Limitations and Future Directions

This study demonstrates promising outcomes but has limitations that indicate areas for future research. While the current sample set encompasses various pollution levels, it may not fully represent the diverse spectrum of cadmium pollution scenarios and environmental conditions. Moreover, the model’s performance under multiple stress factors (e.g., concurrent agrochemical stresses [19]) and its geographical transferability require further investigation. Future research could address these limitations by expanding the sample range to include diverse geographical regions, soil types, and rice varieties, thus enhancing model generalizability. The integration of multi-source data, including hyperspectral, thermal infrared, and SAR [51], could potentially improve model robustness in complex environments. Incorporating time series analysis may reveal temporal dynamics of cadmium stress, potentially enhancing early diagnosis accuracy. Exploring advanced machine learning techniques, such as deep learning and transfer learning [52], could contribute to improved model performance and adaptability across different contexts [17]. Furthermore, developing models capable of diagnosing multiple concurrent environmental stresses would better reflect real-world agricultural conditions. These proposed directions aim to extend the current study’s approach and advance remote sensing-based stress detection in agriculture.
Despite the measures taken to improve CESI’s stability, we acknowledge that it may still have limitations under extreme lighting conditions. Future work should explore index construction methods based purely on relative values, introduce automatic light correction algorithms such as the dark channel prior method [53], and develop multi-scale integration methods combining data sources with different spatial resolutions. These improvements could further enhance CESI’s applicability in heterogeneous areas and under varying light conditions.

5. Conclusions

This study demonstrates the efficacy of an enhanced GAMI-Net model for the early diagnosis of cadmium stress in rice, achieving a high accuracy (R2 = 0.91, RMSE = 0.08 mg/kg). Key indicators for early diagnosis, including R941_log, OSAVI, and the interaction effects between Red_Edge_Amp and Chl, were identified through interpretability analysis. The newly developed Cadmium Early Stress Index (CESI) outperformed existing methods, exhibiting robust performance for both hyperspectral (R2 = 0.77) and Sentinel-2 multispectral data (R2 = 0.61). For regional applications, CESI demonstrated high prediction accuracy and stability (consistency coefficient = 0.61, RMSE = 0.30). While CESI demonstrates promising performance in cadmium stress detection, future research should focus on enhancing its specificity through multi-stress comparisons and the incorporation of additional spectral features.
This research advances early cadmium stress diagnosis in rice, and contributes to precision agriculture and environmental monitoring practices. The CESI application exemplifies the integration of remote sensing with machine learning for agricultural monitoring, providing a comprehensive framework for the broad-scale hyperspectral image analysis of cadmium content in crops and soil. This approach is suitable for integration into precision agriculture systems and environmental monitoring programs, offering valuable tools for managing heavy metal stress in crop production. The study contributes to remote sensing-based stress detection methodologies, and presents practical approaches for improving agricultural sustainability and food safety in cadmium-affected areas.

Supplementary Materials

The following supporting information can be downloaded at: https://www.mdpi.com/article/10.3390/su16198341/s1, Figure S1: Spectral reflectance curves for different Cd pollution levels. Figure S2: Convergence curves of different machine learning models. Table S1: Hyperspectral characteristic parameter definition. Table S2: Spectral feature parameters of a canopy in different pollution levels. Table S3: Definition and formula of conceptual spectral index. Table S4: Feature selection results for Lasso, RF, and RFE. Table S5: Comparison of model assessment metrics [54,55,56,57,58,59,60,61,62,63,64,65,66,67,68,69,70,71,72,73,74,75,76,77,78,79].

Author Contributions

J.L.: methodology, formal analysis, software, visualization, validation, writing—original draft. X.L.: writing—review and editing, software, resources. Z.Z.: investigation, data curation, software, formal analysis. F.L.: writing—review and editing, resources, funding acquisition. S.Z.: investigation, data curation, visualization. L.M.: investigation, data curation, formal analysis. All authors have read and agreed to the published version of the manuscript.

Funding

This work was supported by the National Natural Science Foundation of China (No. 22176161) and the Aid Program for Science and Technology Innovative Research Teams in Higher Educational Institutions of Hunan Province.

Institutional Review Board Statement

Not applicable.

Informed Consent Statement

Not applicable.

Data Availability Statement

The data presented in this study are available on request from the corresponding author.

Conflicts of Interest

Author Zhao Zhang was employed by the company RIOH High Science and Technology Group. Author Lei Mao was employed by the company China Urban Construction Design & Research Institute Co., Ltd. The remaining authors declare that the research was conducted in the absence of any commercial or financial relationships that could be construed as a potential conflict of interest.

References

  1. Haider, F.U.; Liqun, C.; Coulter, J.A.; Cheema, S.A.; Wu, J.; Zhang, R.; Wenjun, M.; Farooq, M. Cadmium toxicity in plants: Impacts and remediation strategies. Ecotox Environ. Safe 2021, 211, 111887. [Google Scholar] [CrossRef] [PubMed]
  2. Tóth, G.; Hermann, T.; Da Silva, M.R.; Montanarella, L. Heavy metals in agricultural soils of the European Union with implications for food safety. Environ. Int. 2016, 88, 299–309. [Google Scholar] [CrossRef] [PubMed]
  3. Zhao, F.; Ma, Y.; Zhu, Y.; Tang, Z.; McGrath, S.P. Soil Contamination in China: Current Status and Mitigation Strategies. Environ. Sci. Technol. 2014, 49, 750–759. [Google Scholar] [CrossRef]
  4. Jia, Y.; Huang, H.; Sun, G.; Zhao, F.; Zhu, Y. Pathways and relative contributions to arsenic volatilization from rice plants and paddy soil. Environ. Sci. Technol. 2012, 46, 8090–8096. [Google Scholar] [CrossRef]
  5. Rizwan, M.; Ali, S.; Adrees, M.; Ibrahim, M.; Tsang, D.C.W.; Zia-ur-Rehman, M.; Zahir, Z.A.; Rinklebe, J.; Tack, F.M.G.; Ok, Y.S. A critical review on effects, tolerance mechanisms and management of cadmium in vegetables. Chemosphere 2017, 182, 90–105. [Google Scholar] [CrossRef] [PubMed]
  6. European, F.S.A. Cadmium dietary exposure in the European population. Efsa J. 2012, 10, 2551. [Google Scholar] [CrossRef]
  7. Gholizadeh, A.; Saberioon, M.; Borůvka, L.; Wayayok, A.; Mohd Soom, M.A. Leaf chlorophyll and nitrogen dynamics and their relationship to lowland rice yield for site-specific paddy management. Inf. Process. Agric. 2017, 4, 259–268. [Google Scholar] [CrossRef]
  8. Gebru, B.M.; Lee, W.; Khamzina, A.; Lee, S.; Negash, E. Hydrological Response of Dry Afromontane Forest to Changes in Land Use and Land Cover in Northern Ethiopia. Remote Sens. 2019, 11, 1905. [Google Scholar] [CrossRef]
  9. Liu, M.; Liu, X.; Wu, M.; Li, L.; Xiu, L. Integrating spectral indices with environmental parameters for estimating heavy metal concentrations in rice using a dynamic fuzzy neural-network model. Comput. Geosci.-Uk 2011, 37, 1642–1652. [Google Scholar] [CrossRef]
  10. Liu, M.; Liu, X.; Ding, W.; Wu, L. Monitoring stress levels on rice with heavy metal pollution from hyperspectral reflectance data using wavelet-fractal analysis. Int. J. Appl. Earth Obs. 2011, 13, 246C255. [Google Scholar] [CrossRef]
  11. Wang, J.; Wang, T.; Skidmore, A.K.; Shi, T.; Wu, G. Evaluating Different Methods for Grass Nutrient Estimation from Canopy Hyperspectral Reflectance. Remote Sens. 2015, 7, 5901–5917. [Google Scholar] [CrossRef]
  12. Wu, H.; Zhao, G.; Li, X.; Wang, Y.; He, B.; Jiang, Z.; Zhang, S.; Sun, W. Identifying water sources used by alpine riparian plants in a restoration zone on the Qinghai-Tibet Plateau: Evidence from stable isotopes. Sci. Total Environ. 2019, 697, 134092. [Google Scholar] [CrossRef] [PubMed]
  13. Sun, W.; Zhang, L.; Du, B.; Li, W.; Lai, Y.M. Band selection using improved sparse subspace clustering for hyperspectral imagery classification. IEEE J.-Stars. 2015, 8, 2784–2797. [Google Scholar] [CrossRef]
  14. Huang, X.; Chen, H.; Gong, J. Angular difference feature extraction for urban scene classification using ZY-3 multi-angle high-resolution satellite imagery. Isprs J. Photogramm. 2018, 135, 127–141. [Google Scholar] [CrossRef]
  15. Cheng, T.; Rivard, B.; Sánchez-Azofeifa, G.A.; Feng, J.; Calvo-Polanco, M. Continuous wavelet analysis for the detection of green attack damage due to mountain pine beetle infestation. Remote Sens. Environ. 2010, 114, 899–910. [Google Scholar] [CrossRef]
  16. Ge, Y.; Thomasson, J.A.; Sui, R. Remote sensing of soil properties in precision agriculture: A review. Front. Earth Sci.-Prc. 2011, 5, 229–238. [Google Scholar] [CrossRef]
  17. Ma, L.; Liu, Y.; Zhang, X.; Ye, Y.; Yin, G.; Johnson, B.A. Deep learning in remote sensing applications: A meta-analysis and review. Isprs J. Photogramm. 2019, 152, 166–177. [Google Scholar] [CrossRef]
  18. Cao, Y.; Jiang, K.; Wu, J.; Yu, F.; Du, W.; Xu, T. Inversion modeling of japonica rice canopy chlorophyll content with UAV hyperspectral remote sensing. PLoS ONE 2020, 15, e0238530. [Google Scholar] [CrossRef]
  19. Wu, J.; Ge, F.; Zhu, L.; Liu, N. Potential toxic mechanisms of neonicotinoid insecticides in rice: Inhibiting auxin-mediated signal transduction. Environ. Sci. Technol. 2023, 57, 4852–4862. [Google Scholar] [CrossRef]
  20. Yang, Z.; Zhang, A.; Sudjianto, A. GAMI-Net: An explainable neural network based on generalized additive models with structured interactions. Pattern Recogn. 2021, 120, 108192. [Google Scholar] [CrossRef]
  21. Liu, Y.; Chen, H.; Wu, G.; Wu, X. Feasibility of estimating heavy metal concentrations in Phragmites australis using laboratory-based hyperspectral data—A case study along Le’an River, China. Int. J. Appl. Earth Obs. 2010, 12, S166–S170. [Google Scholar] [CrossRef]
  22. Liu, Y.; Zhang, Z.; Tong, L.; Khalifa, M.; Wang, Q.; Gang, C.; Wang, Z.; Li, J.; Sun, Z. Assessing the effects of climate variation and human activities on grassland degradation and restoration across the globe. Ecol. Indic. 2019, 106, 105504. [Google Scholar] [CrossRef]
  23. Zhang, X.; Han, L.; Han, L.; Zhu, L. How Well Do Deep Learning-Based Methods for Land Cover Classification and Object Detection Perform on High Resolution Remote Sensing Imagery? Remote Sens. 2020, 12, 417. [Google Scholar] [CrossRef]
  24. Wu, C.; Niu, Z.; Tang, Q.; Huang, W. Estimating chlorophyll content from hyperspectral vegetation indices: Modeling and validation. Agr. Forest Meteorol. 2008, 148, 1230–1241. [Google Scholar] [CrossRef]
  25. Knierim, K.J.; Hays, P.D.; Bowman, D. Quantifying the variability in Escherichia coli (E. coli) throughout storm events at a karst spring in northwestern Arkansas, United States. Environ. Earth Sci. 2015, 74, 4607–4623. [Google Scholar] [CrossRef]
  26. Ma, J.; Fu, X.; Jiang, L.; Zhu, G.; Shi, J. Magnetic flocculants synthesized by Fe3O4 coated with cationic polyacrylamide for high turbid water flocculation. Environ. Sci. Pollut. Res. 2018, 25, 25955–25966. [Google Scholar] [CrossRef]
  27. GB 15618-2018; Soil Environmental Quality Risk Control Standard for Soil Contamination of Agricultural Land. Ministry of Ecology and Environment of the People’s Republic of China: Beijing, China, 2018.
  28. Xiao, R.; Guo, D.; Ali, A.; Mi, S.; Liu, T.; Ren, C.; Li, R.; Zhang, Z. Accumulation, ecological-health risks assessment, and source apportionment of heavy metals in paddy soils: A case study in Hanzhong, Shaanxi, China. Environ. Pollut. 2019, 248, 349–357. [Google Scholar] [CrossRef]
  29. Zhao, K.; Liu, X.; Xu, J.; Selim, H.M. Heavy metal contaminations in a soil–rice system: Identification of spatial dependence in relation to soil properties of paddy fields. J. Hazard. Mater. 2010, 181, 778–787. [Google Scholar] [CrossRef]
  30. Hussain, B.; Lin, Q.; Hamid, Y.; Sanaullah, M.; Di, L.; Hashmi, M.L.U.R.; Khan, M.B.; He, Z.; Yang, X. Foliage application of selenium and silicon nanoparticles alleviates Cd and Pb toxicity in rice (Oryza sativa L.). Sci. Total Environ. 2020, 712, 136497. [Google Scholar] [CrossRef]
  31. Zhang, R.; Yang, P.; Liu, S.; Wang, C.; Liu, J. Evaluation of the Methods for Estimating Leaf Chlorophyll Content with SPAD Chlorophyll Meters. Remote Sens. 2022, 14, 5144. [Google Scholar] [CrossRef]
  32. Zhao, A.; Tang, X.; Zhang, Z.; Liu, J. The parameters optimization selection of Savitzky-Golay filter and its application in smoothing pretreatment for FTIR spectra. In Proceedings of the 2014 9th IEEE Conference on Industrial Electronics and Applications, Hangzhou, China, 9–11 June 2014. [Google Scholar]
  33. Drusch, M.; Del Bello, U.; Carlier, S.; Colin, O.; Fernandez, V.; Gascon, F.; Hoersch, B.; Isola, C.; Laberinti, P.; Martimort, P.; et al. Sentinel-2: ESA’s Optical High-Resolution Mission for GMES Operational Services. Remote Sens. Environ. 2012, 120, 25–36. [Google Scholar] [CrossRef]
  34. Blix, K.; Eltoft, T. Machine Learning Automatic Model Selection Algorithm for Oceanic Chlorophyll-a Content Retrieval. Remote Sens. 2018, 10, 775. [Google Scholar] [CrossRef]
  35. Sun, Y.; Qin, Q.; Ren, H.; Zhang, T.; Chen, S. Red-Edge Band Vegetation Indices for Leaf Area Index Estimation From Sentinel-2/MSI Imagery. IEEE Trans. Geosci. Remote 2020, 58, 826–840. [Google Scholar] [CrossRef]
  36. Haboudane, D.; Miller, J.R.; Tremblay, N.; Zarco-Tejada, P.J.; Dextraze, L. Integrated narrow-band vegetation indices for prediction of crop chlorophyll content for application to precision agriculture. Remote Sens. Environ. 2002, 81, 416–426. [Google Scholar] [CrossRef]
  37. Gholizadeh, M.H.; Melesse, A.M.; Reddi, L. A Comprehensive Review on Water Quality Parameters Estimation Using Remote Sensing Techniques. Sensors 2016, 16, 1298. [Google Scholar] [CrossRef]
  38. Zhen, Z.; Chen, S.; Yin, T.; Chavanon, E.; Lauret, N.; Guilleux, J.; Henke, M.; Qin, W.; Cao, L.; Li, J.; et al. Using the Negative Soil Adjustment Factor of Soil Adjusted Vegetation Index (SAVI) to Resist Saturation Effects and Estimate Leaf Area Index (LAI) in Dense Vegetation Areas. Sensors 2021, 21, 2115. [Google Scholar] [CrossRef]
  39. Malakouti, S.M.; Menhaj, M.B.; Suratgar, A.A. The usage of 10-fold cross-validation and grid search to enhance ML methods performance in solar farm power generation prediction. Clean. Eng. Technol. 2023, 15, 100664. [Google Scholar] [CrossRef]
  40. Yan, T.; Shen, S.; Zhou, A.; Chen, X. Prediction of geological characteristics from shield operational parameters by integrating grid search and K-fold cross validation into stacking classification algorithm. J. Rock. Mech. Geotech. 2022, 14, 1292–1303. [Google Scholar] [CrossRef]
  41. Lundberg, S.M.; Lee, S. A unified approach to interpreting model predictions. Adv. Neural Inf. Process. Syst. 2017, 30, 4765–4774. [Google Scholar]
  42. Jerome, H.F.; Bogdan, E.P. Predictive learning via rule ensembles. Ann. Appl. Stat. 2008, 2, 916–954. [Google Scholar]
  43. Xue, J.; Su, B. Significant Remote Sensing Vegetation Indices: A Review of Developments and Applications. J. Sens. 2017, 2017, 1353691. [Google Scholar] [CrossRef]
  44. Gao, L.; Du, Q.; Zhang, B.; Yang, W.; Wu, Y. A comparative study on linear regression-based noise estimation for hyperspectral imagery. IEEE J.-Stars. 2013, 6, 488–498. [Google Scholar] [CrossRef]
  45. Mousania, Y.; Karimi, S.; Farmani, A. Optical remote sensing, brightness preserving and contrast enhancement of medical images using histogram equalization with minimum cross-entropy-Otsu algorithm. Opt. Quant. Electron. 2023, 55, 105. [Google Scholar] [CrossRef]
  46. Feng, W.; Guo, B.; Zhang, H.; He, L.; Zhang, Y.; Wang, Y.; Zhu, Y.; Guo, T. Remote estimation of above ground nitrogen uptake during vegetative growth in winter wheat using hyperspectral red-edge ratio data. Field Crop Res. 2015, 180, 197–206. [Google Scholar] [CrossRef]
  47. Luo, H.; Tang, Y.Y.; Biuk-Aghai, R.P.; Yang, X.; Yang, L.; Wang, Y. Wavelet-based extended morphological profile and deep autoencoder for hyperspectral image classification. Int. J. Wavelets Multiresolut. Inf. Process. 2018, 16, 1850016. [Google Scholar] [CrossRef]
  48. Wu, C.; Liu, M.; Liu, X.; Wang, T.; Wang, L. Developing a new spectral index for detecting cadmium-induced stress in rice on a regional scale. Int. J. Environ. Res. Public Health 2019, 16, 4811. [Google Scholar] [CrossRef]
  49. Huang, X.; Chen, H.; Chen, H.; Fan, C.; Tai, Y.; Chen, X.; Zhang, W.; He, T.; Gao, Z. Spatiotemporal heterogeneity of chlorophyll content and fluorescence response within rice (Oryza sativa L.) canopies under different cadmium stress. Agronomy 2022, 13, 121. [Google Scholar] [CrossRef]
  50. Huang, B.; Zhao, B.; Song, Y. Urban land-use mapping using a deep convolutional neural network with high spatial resolution multispectral remote sensing imagery. Remote Sens. Environ. 2018, 214, 73–86. [Google Scholar] [CrossRef]
  51. He, L.; Li, J.; Liu, C.; Li, S. Recent advances on spectral–spatial hyperspectral image classification: An overview and new guidelines. IEEE Trans. Geosci. Remote 2017, 56, 1579–1597. [Google Scholar] [CrossRef]
  52. Shi, Y.; Huang, W.; Luo, J.; Huang, L.; Zhou, X. Detection and discrimination of pests and diseases in winter wheat based on spectral indices and kernel discriminant analysis. Comput. Electron. Agr. 2017, 141, 171–180. [Google Scholar] [CrossRef]
  53. Xu, Y.; Guo, X.; Wang, H.; Zhao, F.; Peng, L. Single Image Haze Removal Using Light and Dark Channel Prior; IEEE: Piscataway, NJ, USA, 2016; pp. 1–6. [Google Scholar]
  54. Becker, B.L.; Lusch, D.P.; Qi, J. Identifying optimal spectral bands from in situ measurements of Great Lakes coastal wetlands using second-derivative analysis. Remote Sens. Environ. 2005, 97, 238–248. [Google Scholar] [CrossRef]
  55. Tsai, F.; Philpot, W. Derivative Analysis of Hyperspectral Data. Remote Sens. Environ. 1998, 66, 41–51. [Google Scholar] [CrossRef]
  56. Tang, Z.; Guo, J.; Xiang, Y.; Lu, X.; Wang, Q.; Wang, H.; Cheng, M.; Wang, H.; Wang, X.; An, J.; et al. Estimation of Leaf Area Index and Above-Ground Biomass of Winter Wheat Based on Optimal Spectral Index. Agronomy 2022, 12, 1729. [Google Scholar] [CrossRef]
  57. Xue, Y.; Zhu, L.; Zou, B.; Wen, Y.; Long, Y.; Zhou, S. Research on Inversion Mechanism of Chlorophyll—A Concentration in Water Bodies Using a Convolutional Neural Network Model. Water 2021, 13, 664. [Google Scholar] [CrossRef]
  58. Li, L.; Lu, J.; Wang, S.; Ma, Y.; Wei, Q.; Li, X.; Cong, R.; Ren, T. Methods for estimating leaf nitrogen concentration of winter oilseed rape (Brassica napus L.) using in situ leaf spectroscopy. Ind. Crop Prod. 2016, 91, 194–204. [Google Scholar] [CrossRef]
  59. Serrano, L.; Peñuelas, J.; Ustin, S.L. Remote sensing of nitrogen and lignin in Mediterranean vegetation from AVIRIS data: Decomposing biochemical from structural signals. Remote Sens. Environ. 2002, 81, 355–364. [Google Scholar] [CrossRef]
  60. Penuelas, J.; Baret, F.; Filella, I. Semi-empirical indices to assess carotenoids/chlorophyll a ratio from leaf spectral reflectance. Photosynthetica 1995, 31, 221–230. [Google Scholar]
  61. Gamon, J.A.; Penuelas, J.; Field, C.B. A narrow-waveband spectral index that tracks diurnal changes in photosynthetic efficiency. Remote Sens. Environ. 1992, 41, 35–44. [Google Scholar] [CrossRef]
  62. Kaufman, Y.J.; Tanre, D. Atmospherically resistant vegetation index (ARVI) for EOS-MODIS. IEEE Trans. Geosci. Remote 1992, 30, 261–270. [Google Scholar] [CrossRef]
  63. Tucker, C.J. Red and photographic infrared linear combinations for monitoring vegetation. Remote Sens. Environ. 1979, 8, 127–150. [Google Scholar] [CrossRef]
  64. Daughtry, C.S.T.; Walthall, C.L.; Kim, M.S.; de Colstoun, E.B.; McMurtrey, J.E. Estimating Corn Leaf Chlorophyll Concentration from Leaf and Canopy Reflectance. Remote Sens. Environ. 2000, 74, 229–239. [Google Scholar] [CrossRef]
  65. Wiegand, C.; Anderson, G.; Lingle, S.; Escobar, D. Soil salinity effects on crop growth and yield-Illustration of an analysis and mapping methodology for sugarcane. J. Plant Physiol. 1996, 148, 418–424. [Google Scholar] [CrossRef]
  66. Huete, A.R.; Liu, H.; van Leeuwen, W.J. The use of vegetation indices in forested regions: Issues of linearity and saturation. In Proceedings of the IGARSS’97—1997 IEEE International Geoscience and Remote Sensing Symposium Proceedings. Remote Sensing—A Scientific Vision for Sustainable Development, Singapore, 3–8 August 1997; pp. 1966–1968. [Google Scholar]
  67. Gitelson, A.A.; Gritz, Y.; Merzlyak, M.N. Relationships between leaf chlorophyll content and spectral reflectance and algorithms for non-destructive chlorophyll assessment in higher plant leaves. J. Plant Physiol. 2003, 160, 271–282. [Google Scholar] [CrossRef]
  68. Merzlyak, M.N.; Gitelson, A.A.; Chivkunova, O.B.; Rakitin, V.Y. Non-destructive optical detection of pigment changes during leaf senescence and fruit ripening. Physiol. Plantarum 1999, 106, 135–141. [Google Scholar] [CrossRef]
  69. Barnes, E.M.; Clarke, T.R.; Richards, S.E.; Colaizzi, P.D.; Haberland, J.; Kostrzewski, M.; Waller, P.; Choi, C.; Riley, E.; Thompson, T. Coincident detection of crop water stress, nitrogen status and canopy density using ground based multispectral data. In Proceedings of the Fifth International Conference on Precision Agriculture, Bloomington, MN, USA, 16–19 July 2000. [Google Scholar]
  70. Merton, R.; Huntington, J. Early simulation results of the ARIES-1 satellite sensor for multi-temporal vegetation research derived from AVIRIS. In Proceedings of the Eighth Annual JPL Airborne Earth Science Workshop, Pasadena, CA, USA, 9–11 February 1999; pp. 9–11. [Google Scholar]
  71. Dash, J.; Curran, P.J. The MERIS terrestrial chlorophyll index. Int. J. Remote Sens. 2004, 25, 5403–5413. [Google Scholar] [CrossRef]
  72. Vogelmann, J.E.; Rock, B.N.; Moss, D.M. Red edge spectral measurements from sugar maple leaves. Remote Sens. 1993, 14, 1563–1575. [Google Scholar] [CrossRef]
  73. Rondeaux, G.; Steven, M.; Baret, F. Optimization of soil-adjusted vegetation indices. Remote Sens. Environ 1996, 55, 95–107. [Google Scholar] [CrossRef]
  74. Gitelson, A.A.; Kaufman, Y.J.; Merzlyak, M.N. Use of a green channel in remote sensing of global vegetation from EOS-MODIS. Remote Sens. Environ. 1996, 58, 289–298. [Google Scholar] [CrossRef]
  75. Cho, M.A.; Skidmore, A.K. A new technique for extracting the red edge position from hyperspectral data: The linear extrapolation method. Remote Sens. Environ. 2006, 101, 181–193. [Google Scholar] [CrossRef]
  76. Elvidge, C.D.; Chen, Z. Comparison of broad-band and narrow-band red and near-infrared vegetation indices. Remote Sens. Environ. 1995, 54, 38–48. [Google Scholar] [CrossRef]
  77. Paul, A.; Mukherjee, D.P.; Das, P.; Gangopadhyay, A.; Chintha, A.R.; Kundu, S. Improved Random Forest for Classification. IEEE Trans. Image Process 2018, 27, 4012–4024. [Google Scholar] [CrossRef] [PubMed]
  78. Wang, W.; Men, C.; Lu, W. Online prediction model based on support vector machine. Neurocomputing 2008, 71, 550–558. [Google Scholar] [CrossRef]
  79. Kumar, P.; Verma, S.; Kaur, R.; Papac, J.; Kušić, H.; Štangar, U.L. Enhanced photo-degradation of N-methyl-2-pyrrolidone (NMP): Influence of matrix components, kinetic study and artificial neural network modelling. J. Hazard Mater. 2022, 434, 128807. [Google Scholar] [CrossRef] [PubMed]
Figure 1. Development process of cadmium early stress index (CESI).
Sustainability 16 08341 g001
Figure 2. This illustrates the spatial distribution of study sites in both areas within Hunan Province, China. (a) Location of the study area within China and Hunan Province. (b) Satellite imagery of the study area with sampling points (green dots). (c) Land use classification map showing water areas (dark blue), cultivated land (light blue), other land types (white), and sampling points (green dots).
Sustainability 16 08341 g002
Figure 3. Technical flowchart of the enhanced GAMI-Net model, highlighting the original components (main effects and interactions) and improvement techniques (k-fold cross-validation and grid search).
Sustainability 16 08341 g003
Figure 4. Distribution of chlorophyll content and soil cadmium concentration at different contamination levels. The contamination levels are classified according to the soil cadmium concentration as clean (Cd < 0.3 mg/kg), low (0.3 mg/kg ≤ Cd < 0.6 mg/kg), medium (0.6 mg/kg ≤ Cd < 1.0 mg/kg), and high (Cd ≥ 1.0 mg/kg). The violin plots show the probability density of the data for the different values, with the wider sections indicating a higher probability of being observed at that level. The black dots indicate the median, the thick black bar at the center indicates the interquartile range, and the thin black line indicates the rest of the distribution, excluding outliers.
Sustainability 16 08341 g004
Figure 5. Spectral characteristics of rice leaves under different cadmium contamination levels. (a) Original spectra; (b) first-order differential spectra; (c) continuum-removed spectra; (d) log-transformed spectra; (e) spectral feature parameters; (f) wavelet decomposition parameters; (g) vegetation indices. Gray vertical lines indicate features with the largest group mean differences.
Sustainability 16 08341 g005
Figure 6. Correlation analysis conducted between spectral features and soil cadmium content. (a) Original spectrum; (b) first-order differential spectra; (c) continuum removal spectra; (d) log-transformed spectra; (e) spectral feature parameters; (f) wavelet decomposition parameters; (g) vegetation indices. Gray vertical lines mark features with the highest correlation coefficients.
Sustainability 16 08341 g006
Figure 7. Comparison of E-GAMI-Net model performance with other machine learning models. R2 reflects the model’s ability to explain data variation, RMSE indicates the average prediction error size, and RPD reflects the model’s predictive power relative to data variability.
Sustainability 16 08341 g007
Figure 8. E-GAMI-Net model identifies the most significant main effects and interaction effects in the prediction of cadmium stress. The subplot titles show the feature names and their feature importance scores. The histograms next to the axes show the numerical distribution of the respective features. The first two rows of subplots show the response curves of the main effects, which show the influence of changes in the respective feature values on the model predictions. The third row of subplots shows the response surfaces of the interaction effects, which show the influence of changes in the respective interaction effect features on the model predictions. R94 1_log: log-transformed reflectance at 941 nm; OSAVI: Optimized Soil Adjusted Vegetation Index; Red_Edge_Amp: red edge amplitude; Chl: chlorophyll content; R759_dif: first-order differential reflectance at 759 nm.
Sustainability 16 08341 g008
Figure 9. Comparison of predicted and actual CESI index values. The horizontal axis shows the measured cadmium content in soil (mg/kg), and the vertical axis shows the predicted cadmium content based on the CESI index (mg/kg). The blue dots represent individual samples, the red dotted line is the 1:1 line, and the black solid line is the best-fit line. R-squared represent the coefficient of determination.
Sustainability 16 08341 g009
Figure 10. Spatial distribution map of measured cadmium pollution in the study area and spatial distribution map of inversion prediction error of each model.
Sustainability 16 08341 g010
Table 1. Descriptive statistics of soil cadmium content and leaf SPAD values.
KurtosisMeanSkewness Z-ScoreKurtosis Z-ScoreMaximum ValueSkewnessMinimum ValueStandard Deviation
Soil cadmium0.8420.730.8740.3622.240.3870.140.5
SPAD value0.84523.580.7960.56535.870.43415.976.03
Table 2. Spectral feature response curves for cadmium stress detection.
FeatureFeature Response FunctionFitting R2
R941_log f 1 = 2.116 x 3 + 5.308 x 2 3.822 x + 0.796 0.9986
OSAVI f 2 = 0.0366 + 0.0361 ( 0.0366 ) 1 + x 0.8417 86.59 0.9869
R935_log f 3 = 0.3588 x 3 + 0.8431 x 2 0.5230 x + 0.0830 0.9993
D1_variance f 4 = 0.00001247 x 3 0.0007411 x 2 + 0.01120 x 0.02739 0.9952
Loc_NI_Absor_Val f 5 = 0.000000014 x 3 0.00003307 x 2 0.001226 x + 0.037968 0.9970
EVI f 6 = 1.330061 x 3 + 2.226502 x 2 0.752029 x 0.147405 0.9913
Chl f 7 = 0.00000757 x 3 0.0006405 x 2 + 0.015553 x 0.106239 0.9979
D5_mean f 8 = 52.224984 x 3 23.367028 x 2 2.322176 x 0.056351 0.9904
Table 3. Spectral feature response surfaces for cadmium stress detection.
FeatureFeature Response FunctionFitting R2
Red_Edge_Amp vs. Chl f 9 = 0.5241 38.7484   · x 0.0170 · y + 933.3186 · x 2 + 0.2874 · x · y + 0.0002 · y 2 0.4350
R759_dif vs. OSAVI f 10 = 7.4049 + 47.4750 · x + 18.0753 · y + 787.1972 · x 2 87.9686 · x · y 10.7494 · y 2 0.4833
R935_org vs. R328_dif f 11 = 0.1199 0.4237 · x + 5.0920 · y + 0.3934 · x 2 11.8069 · x · y 99.8646 · y 2 0.4542
R759_dif vs. Red_Edge_Amp f 12 = 0.0307 3.2533 · x 0.6900 · y + 107.0543 · x 2 + 21.9272 · x · y + 13.4927 · y 2 0.4293
Table 4. Performance comparison of CESI with other methods.
MethodR2RMSENoise Resistance (15% noise)Computation Time (s)
CESI0.690.09−5.6%0.03
RF0.640.13−8.3%0.15
SVM0.620.14−9.7%0.08
HCSI0.610.14−10.5%0.01
ANN0.600.15−11.2%0.21
NDVI0.510.18−15.6%0.01
REP0.560.16−12.8%0.01
Disclaimer/Publisher’s Note: The statements, opinions and data contained in all publications are solely those of the individual author(s) and contributor(s) and not of MDPI and/or the editor(s). MDPI and/or the editor(s) disclaim responsibility for any injury to people or property resulting from any ideas, methods, instructions or products referred to in the content.

