Article

Economic Attractiveness of the Flexible Combined Biofuel Technology in the District Heating System

1
Lithuanian Energy Institute, Breslaujos str. 3, LT-44403 Kaunas, Lithuania
2
VTT Technical Research Centre of Finland Ltd., P.O. Box 1000, VTT, FI-02044 Espoo, Finland
3
Deutsches Zentrum für Luft- und Raumfahrt (DLR), Institut für Technische Thermodynamik, Pfaffenwaldring 38–40, 70569 Stuttgart, Germany
*
Author to whom correspondence should be addressed.
Sustainability 2024, 16(19), 8406; https://doi.org/10.3390/su16198406
Submission received: 27 August 2024 / Revised: 23 September 2024 / Accepted: 24 September 2024 / Published: 27 September 2024

Abstract

:
European Union (EU) energy markets are changing rapidly. After the recent turmoil, a new wave of EU legislation is once again reshaping the way energy should be used in the EU, emphasizing not only the increasing importance of using renewable and local energy sources but also highlighting the importance of energy efficiency and decarbonization of high to abate sectors (including aviation and marine fuels). Heating and cooling account for about half of the total gross final energy consumption in the EU. This article explores the novel concept of using waste heat from the flexible Fischer–Tropsch (FT) process (FLEXCHX) in the existing district heating network, resulting in tri-generation: FT C5+ liquids, heat, and electricity. FLEXCHX provides operation flexibility and combines advanced biomass gasification, catalytic liquefaction, electrolysis, and waste heat recovery, allowing use of biomass residues in a more sustainable way. Our results, based on the Kaunas district heating (DH) system, show that this process could be integrated into the existing district heating network in Northern Europe and successfully compete with existing heat-only boilers and CHPs using biomass or municipal waste, resulting in more efficient use of biomass and savings accumulated up to EUR 200 million over the study period in the analysis (2020–2050), supplying up to 30% of the heat in the Kaunas DH system. Enriching the FT process with hydrogen (using electrolysis) could result in additional FLEXCHX utilization benefits by creating demand for cheap excess electricity that might otherwise be curtailed.

1. Introduction

The average annual global temperature has risen by about 1 °C compared to the pre-industrial period [1]. In Europe, the temperature increased even more [2]. About 97–98% of scientists working in the field of climate change agree that human activities cause this climate change [3,4]. In its 2023 Synthesis Report [5], the Intergovernmental Panel on Climate Change states that the observed increase in average temperature is due to greenhouse gas (GHG) emissions caused by human activities.
In view of the potential threats posed by climate change, 194 countries have signed and 189 ratified [6] the Paris Agreement on Climate Change [7], which aims to strengthen the global response to climate change by taking measures to reduce global average temperatures well below 2 °C compared to the pre-industrial period. In the Paris Agreement on Climate Change, the European Union (EU) committed [8] to reduce EU GHG emissions by 40% by 2030 compared to 1990 levels, as calculated by the Intergovernmental Panel on Climate Change (IPCC) in 2006 guidelines [9]. However, the EU is setting even more ambitious goals. The European Green Deal [10] proposes to reduce GHG emissions by 50–55% by 2030, and, by 2050, to ensure that there are no net GHG emissions in the EU at all. To make these targets legally binding and to provide a framework for the transition to a climate-neutral economy, the European Commission has adopted European climate legislation [11]. It establishes binding targets that, by 2030, EU GHG emissions must be reduced by at least 55% compared to 1990 levels and reach a 40% share of renewable energy sources (RES), and, by 2050, deliver a 90% reduction in transport sector emissions. To facilitate transition and to follow progress, each Member State was also required to draw up and submit an Integrated National Energy and Climate Plan (NECP) for 2021–2030. The first iteration of NECP was due by 31 December 2018, and the latest by 30 June 2023 [12].
Following Russia’s unprovoked invasion of Ukraine and following uncertainty in energy markets, the European Commission launched the REPowerEU plan, which outlines future rising decarbonization ambitions [13] with three main focus areas: energy conservation, diversification of supply, and production of clean energy. Among other measures, it set an increased EU-wide 2030 Renewable Energy Sources (RES) target from 40% to 45%. New Renewable Energy Directive (RED-III) [14], ReFuelEU Aviation [15], and ReFuelEU Maritime initiatives [16] target the future reduction of carbon emissions in the transport sector utilizing bio and synthetic fuels.
Transport represents almost a quarter of global [17] and Europe’s GHG emissions [18] and, in most cases, is the main source of pollution in cities. Moreover, from 2019, the transport sector showed a gradual increase in GHG emissions, unlike other sectors like power generation or industry. While GHG emissions in the transport sector in the EU showed a slight decrease in the period 2007–2013, afterwards, the trend was reversed; transport remains the only sector in the EU with emissions higher than in 1990 [19]. Within this sector, road transport is by far the biggest emitter, accounting for more than 70% of all GHG emissions from transport [18]. Electric vehicles are becoming a viable solution for personal mobility. However, there is still a huge demand for other renewable fuels in the heavy road, maritime, and commercial aviation sectors. Speeding up the deployment of low-emission alternative energy for transport, such as advanced biofuels, electricity, hydrogen, and renewable synthetic fuels, is a possible way for transport decarbonization [20]. Energy system integration [21] is the pathway towards an effective, affordable, and deep decarbonization of the European economy in line with the Paris Agreement [7] and the UN’s 2030 Agenda for Sustainable Development [22].
This paper focuses on an analysis of the economic effectiveness of integrating into the energy system a flexible technology that combines the simultaneous production of a certified drop-in fuel to transport fuel using Fischer–Tropsch (FT) technology and the utilization of by-products (steam and exhaust gas) to produce heat and electricity, coupling three sectors together: transport, district heating, and electricity.
Conversion of lignocellulosic biomass into FT fuels is widely discussed in the scientific literature. Savamati et al. [23] and Peduzzi et al. [24] analyzed thermo-economic aspects, and Piazzi et al. concentrated on energy efficiency [25]. Waste heat utilization in the district heating system is discussed by Köfinger et al. [26], focusing on usability of seasonal storage. Ziemele et al. [27] named energy efficiency as the main driving factor in the Riga DH system-based case. The possibilities of waste heat utilization in China were discussed by Fang et al. [28], and a German case was discussed by Peda et al. [29].
The coupling of electrolysis with district heating systems was discussed by Böhm et al. [30] based on the low-temperature Austrian DH system example. Coupling district heating with electricity markets was analyzed by Golmohamadi et al. [31].
The concept of utilizing by-products (excess heat) from biofuel production in district heating networks was introduced by Egeskog et al. [32], providing a bird’s eye view of EU-wide potentials. Ilic et al. [33] investigated opportunities to include biofuel production (including FT) in the district heating sector with a main focus on biofuel production technologies, where district heating was considered only as an external market for by-products. Ljungstedt et al. [34] explored synergies between FT by-products and industrial heat demand in the Scandinavian kraft pulp and paper mill industry.
Despite the abundance of analyses covering different aspects of system integration, both for waste heat from different processes and for electricity markets, there is still a considerable gap in the existing research when viewed from the perspective of the district heating market, where waste heat, on the one hand, competes with existing and new (potential) heat sources, and on the other hand participates in electricity markets, both as a flexible electricity consumer or producer under favorable market conditions. While in most of the research reviewed the reduction of carbon footprint is one of the drivers for waste heat utilization, in our case, the main competition is between different uses of biomass (with different efficiencies), exploring possible synergies between the three sectors and quantifying the economic benefits.
The concept of this technology (FLEXCHX) [35,36] provides operation flexibility and combines advanced biomass gasification, catalytic liquefaction, electrolysis, and waste heat recovery in order to use biomass residues in a more sustainable way instead of direct combustion. This technology, in addition to the production of a certified drop-in fuel to transport fuel, gives the flexibility to respond to changing consumer heat demands and electricity price variations caused by volatile electricity generation from renewable energy sources (RES) or to balance supply and demand in the electricity system [37]. The core of the FLEXCHX technology is the unit, where solid biomass residues are converted to Fischer–Tropsch liquids (FT C5+) (below in the text also called WAX) and by-products (off-gas and steam), whereas within the FT synthesis step, the intermediate product is generated as waste steam and off-gases and therefore might be delivered to the district heating (DH) system for heat and power production, increasing energy efficiency. Depending on consumer demand, these various streams would be used for heat or heat and power production. Additional flexibility is achieved by changing the operation modes of the FLEXCHX technology between “Biomass alone” and “Electrolysis assisted” modes, including their modifications. In the “Electrolysis-assisted” mode, electricity is used by the electrolysis unit to increase the output of FT C5+ liquids. Rapid deployment of wind and solar power plants increased the volatility of electricity prices, resulting in periods with low or even negative electricity price [38]. Thus, the FLEXCHX technology may be used to increase the utilization factor and economic efficiency of electricity generation units using intermittent renewable energy sources (RES). The economic attractiveness of integration of the FLEXCHX technology into the district heating system was analyzed in Lithuanian conditions based on the existing Kaunas district heating system example. The Kaunas DH system was selected because it already has a fully functioning heat market [39] combining biomass heat-only boilers, biomass CHP, municipal waste incineration CHP, and peaking gas units; therefore, the lessons learned from the Kaunas case study may be highly applicable in other areas considering the emerging trends in district heating development.
The aim of this work was to investigate the economic attractiveness of applying FLEXCHX technology in existing district heating systems in Northern Europe. The effects were analyzed under Lithuanian conditions, in particular in the context of the long-term development and operation of the district heating system of the city of Kaunas. The application was studied when the main consumer of Fischer–Tropsch (FT) off-gas and steam was the heat production facilities of the district heating system, which is oriented to meet the heat needs of either residential or industrial consumers.

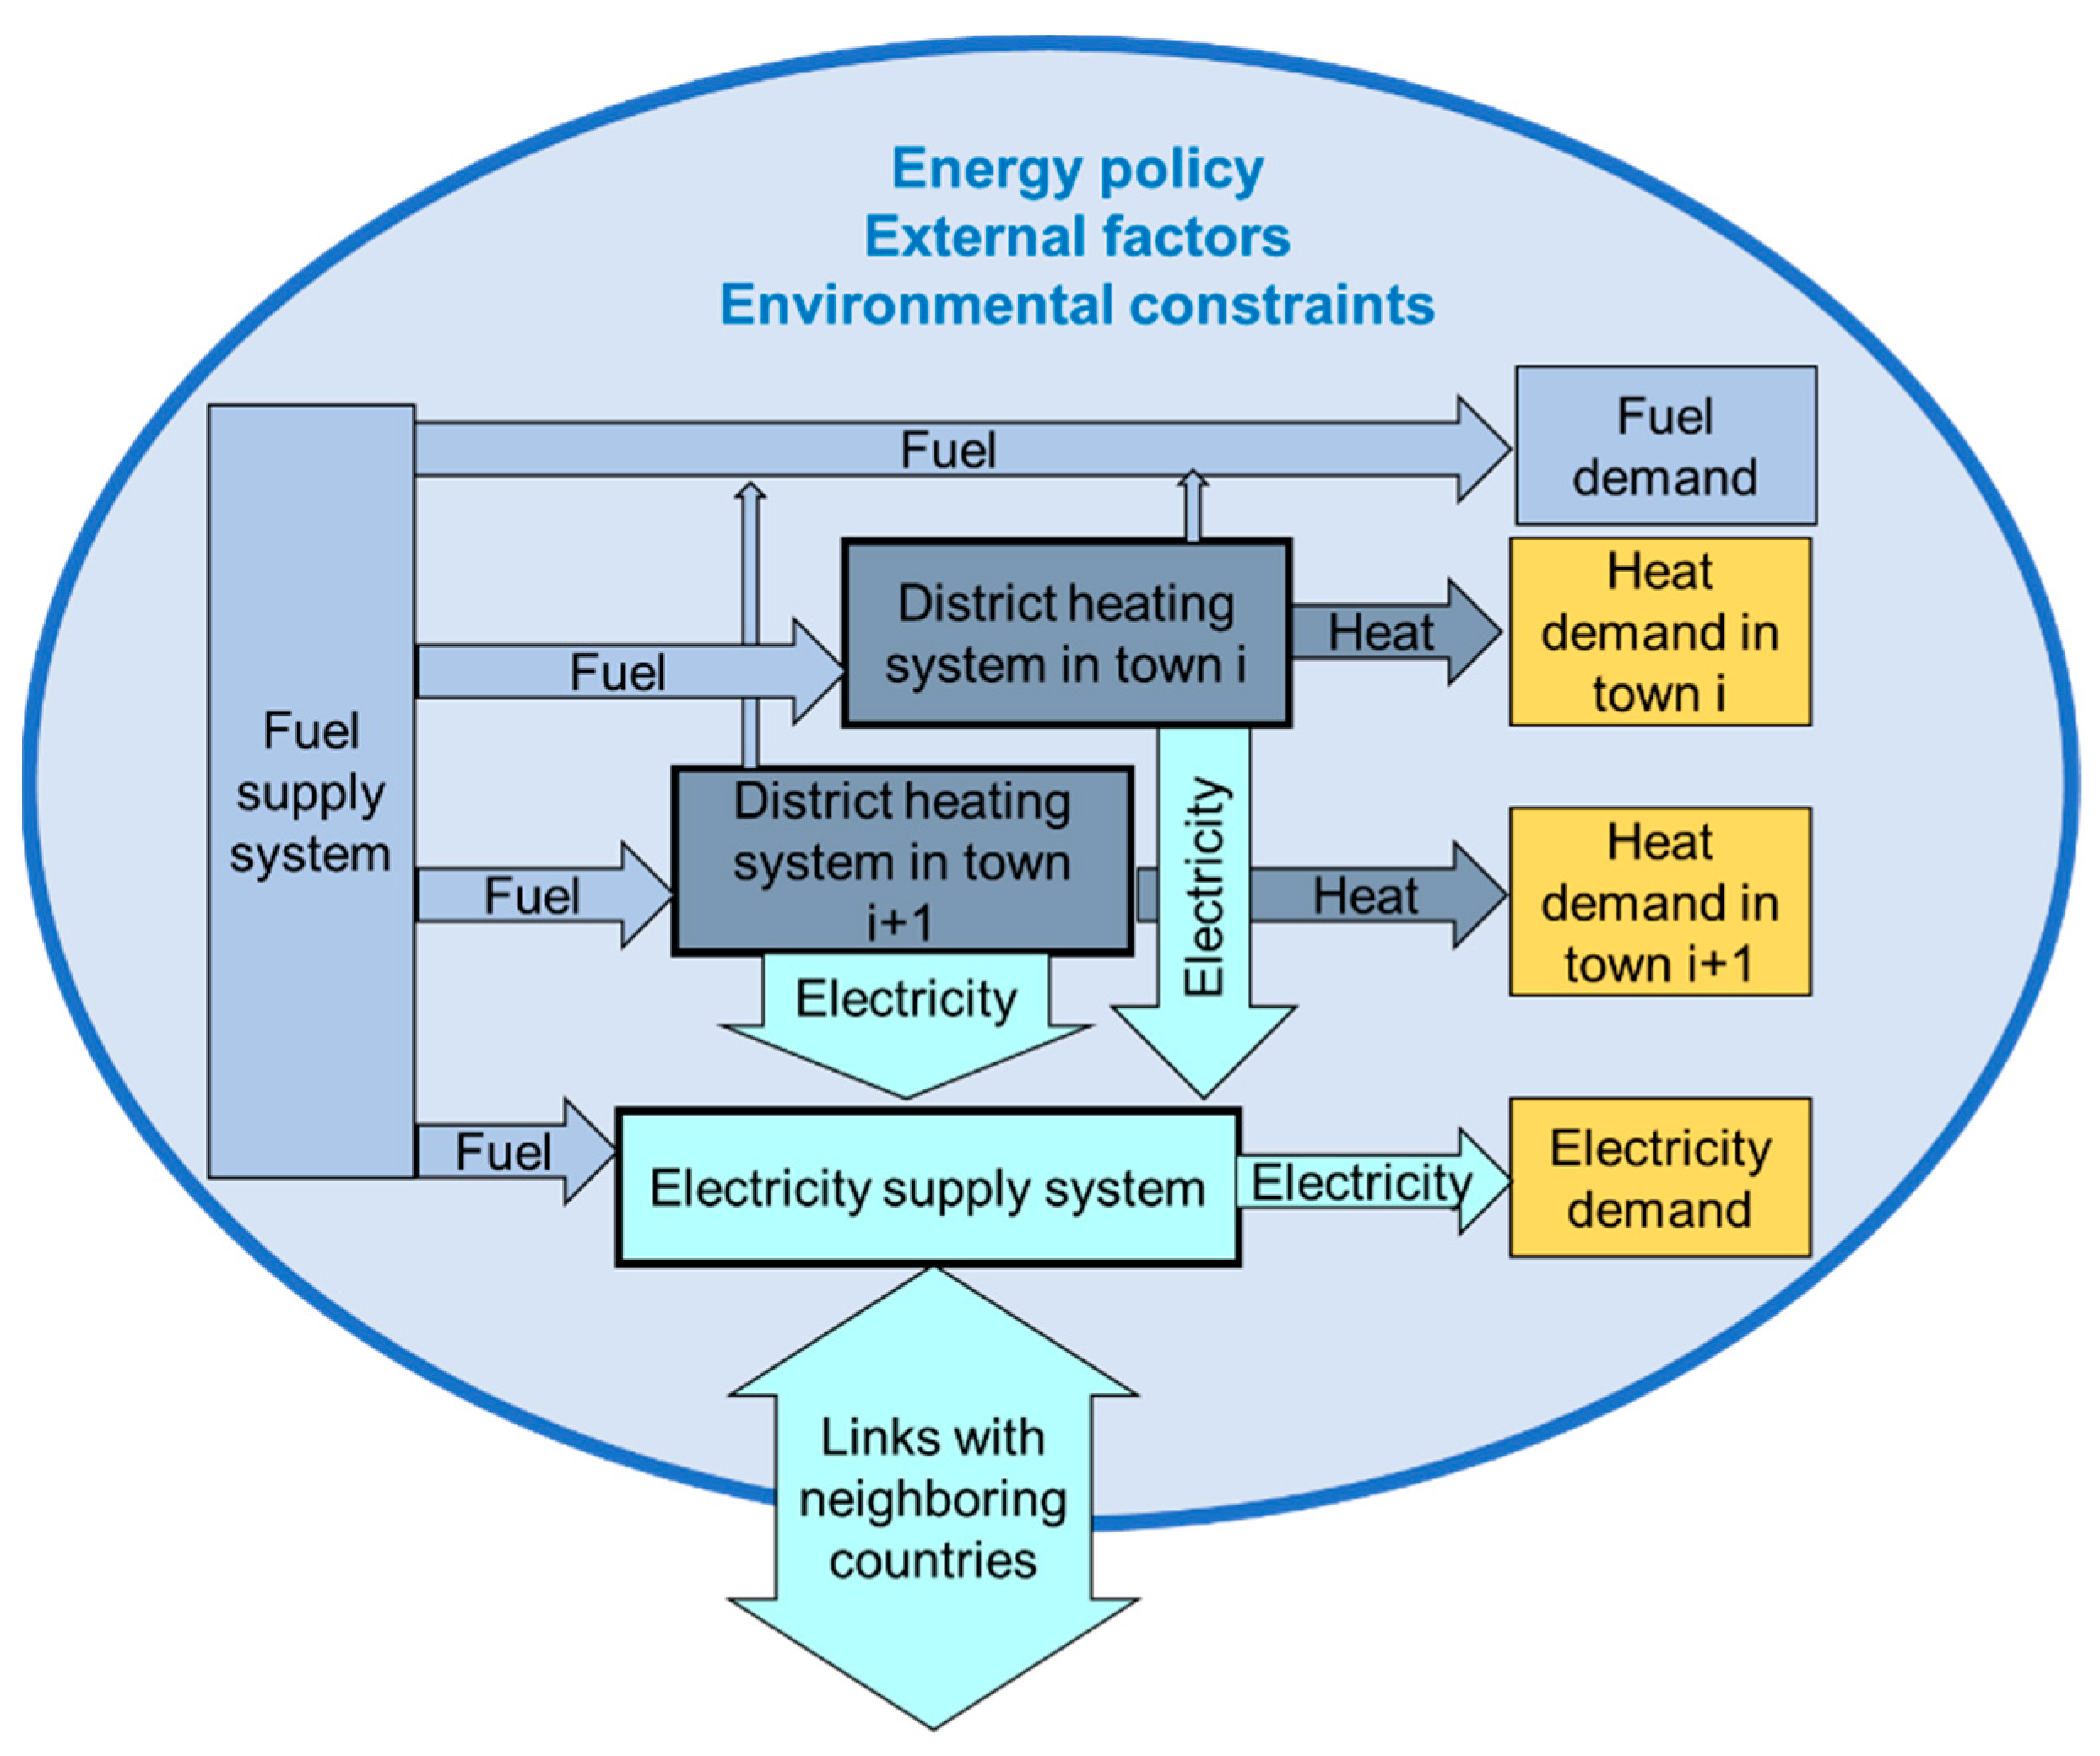
2. Methodology and Data

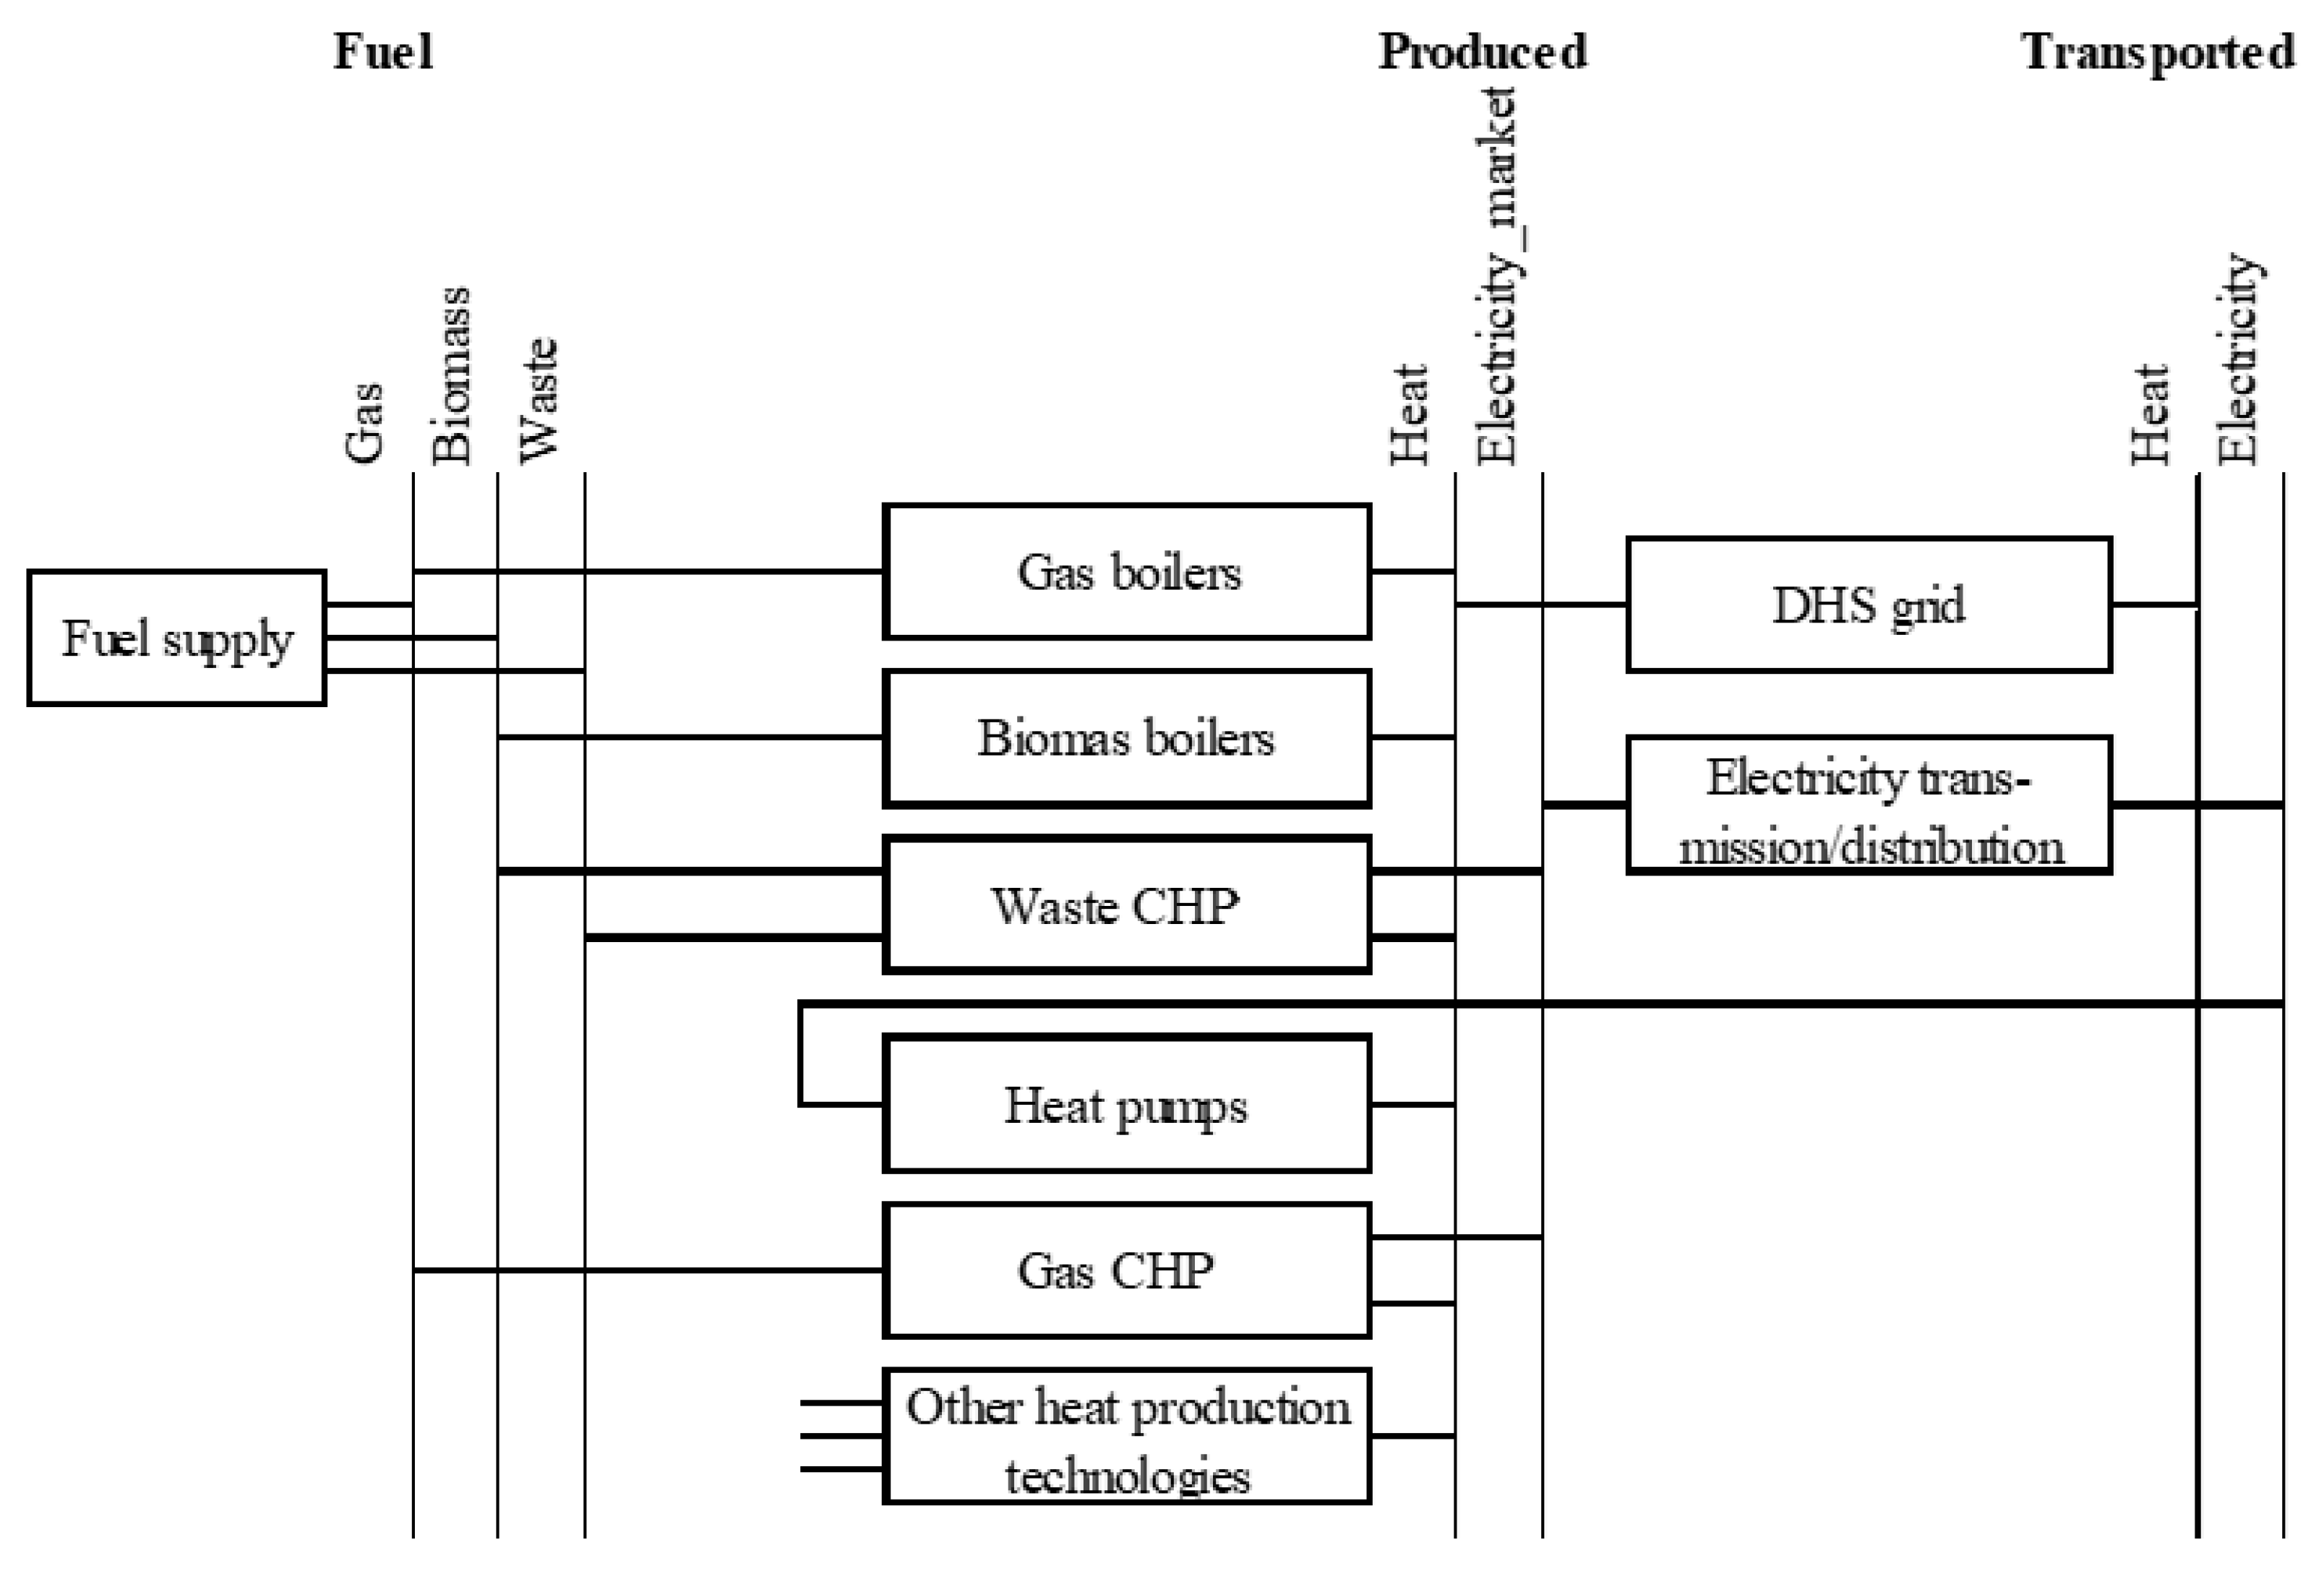
2.1. Model Description

The concept for the analysis is bounded by the following conditions:
  • The development and operation of the Kaunas district heating system is analyzed during a comparatively long time span (up to 2050) using a suite of mathematical models.
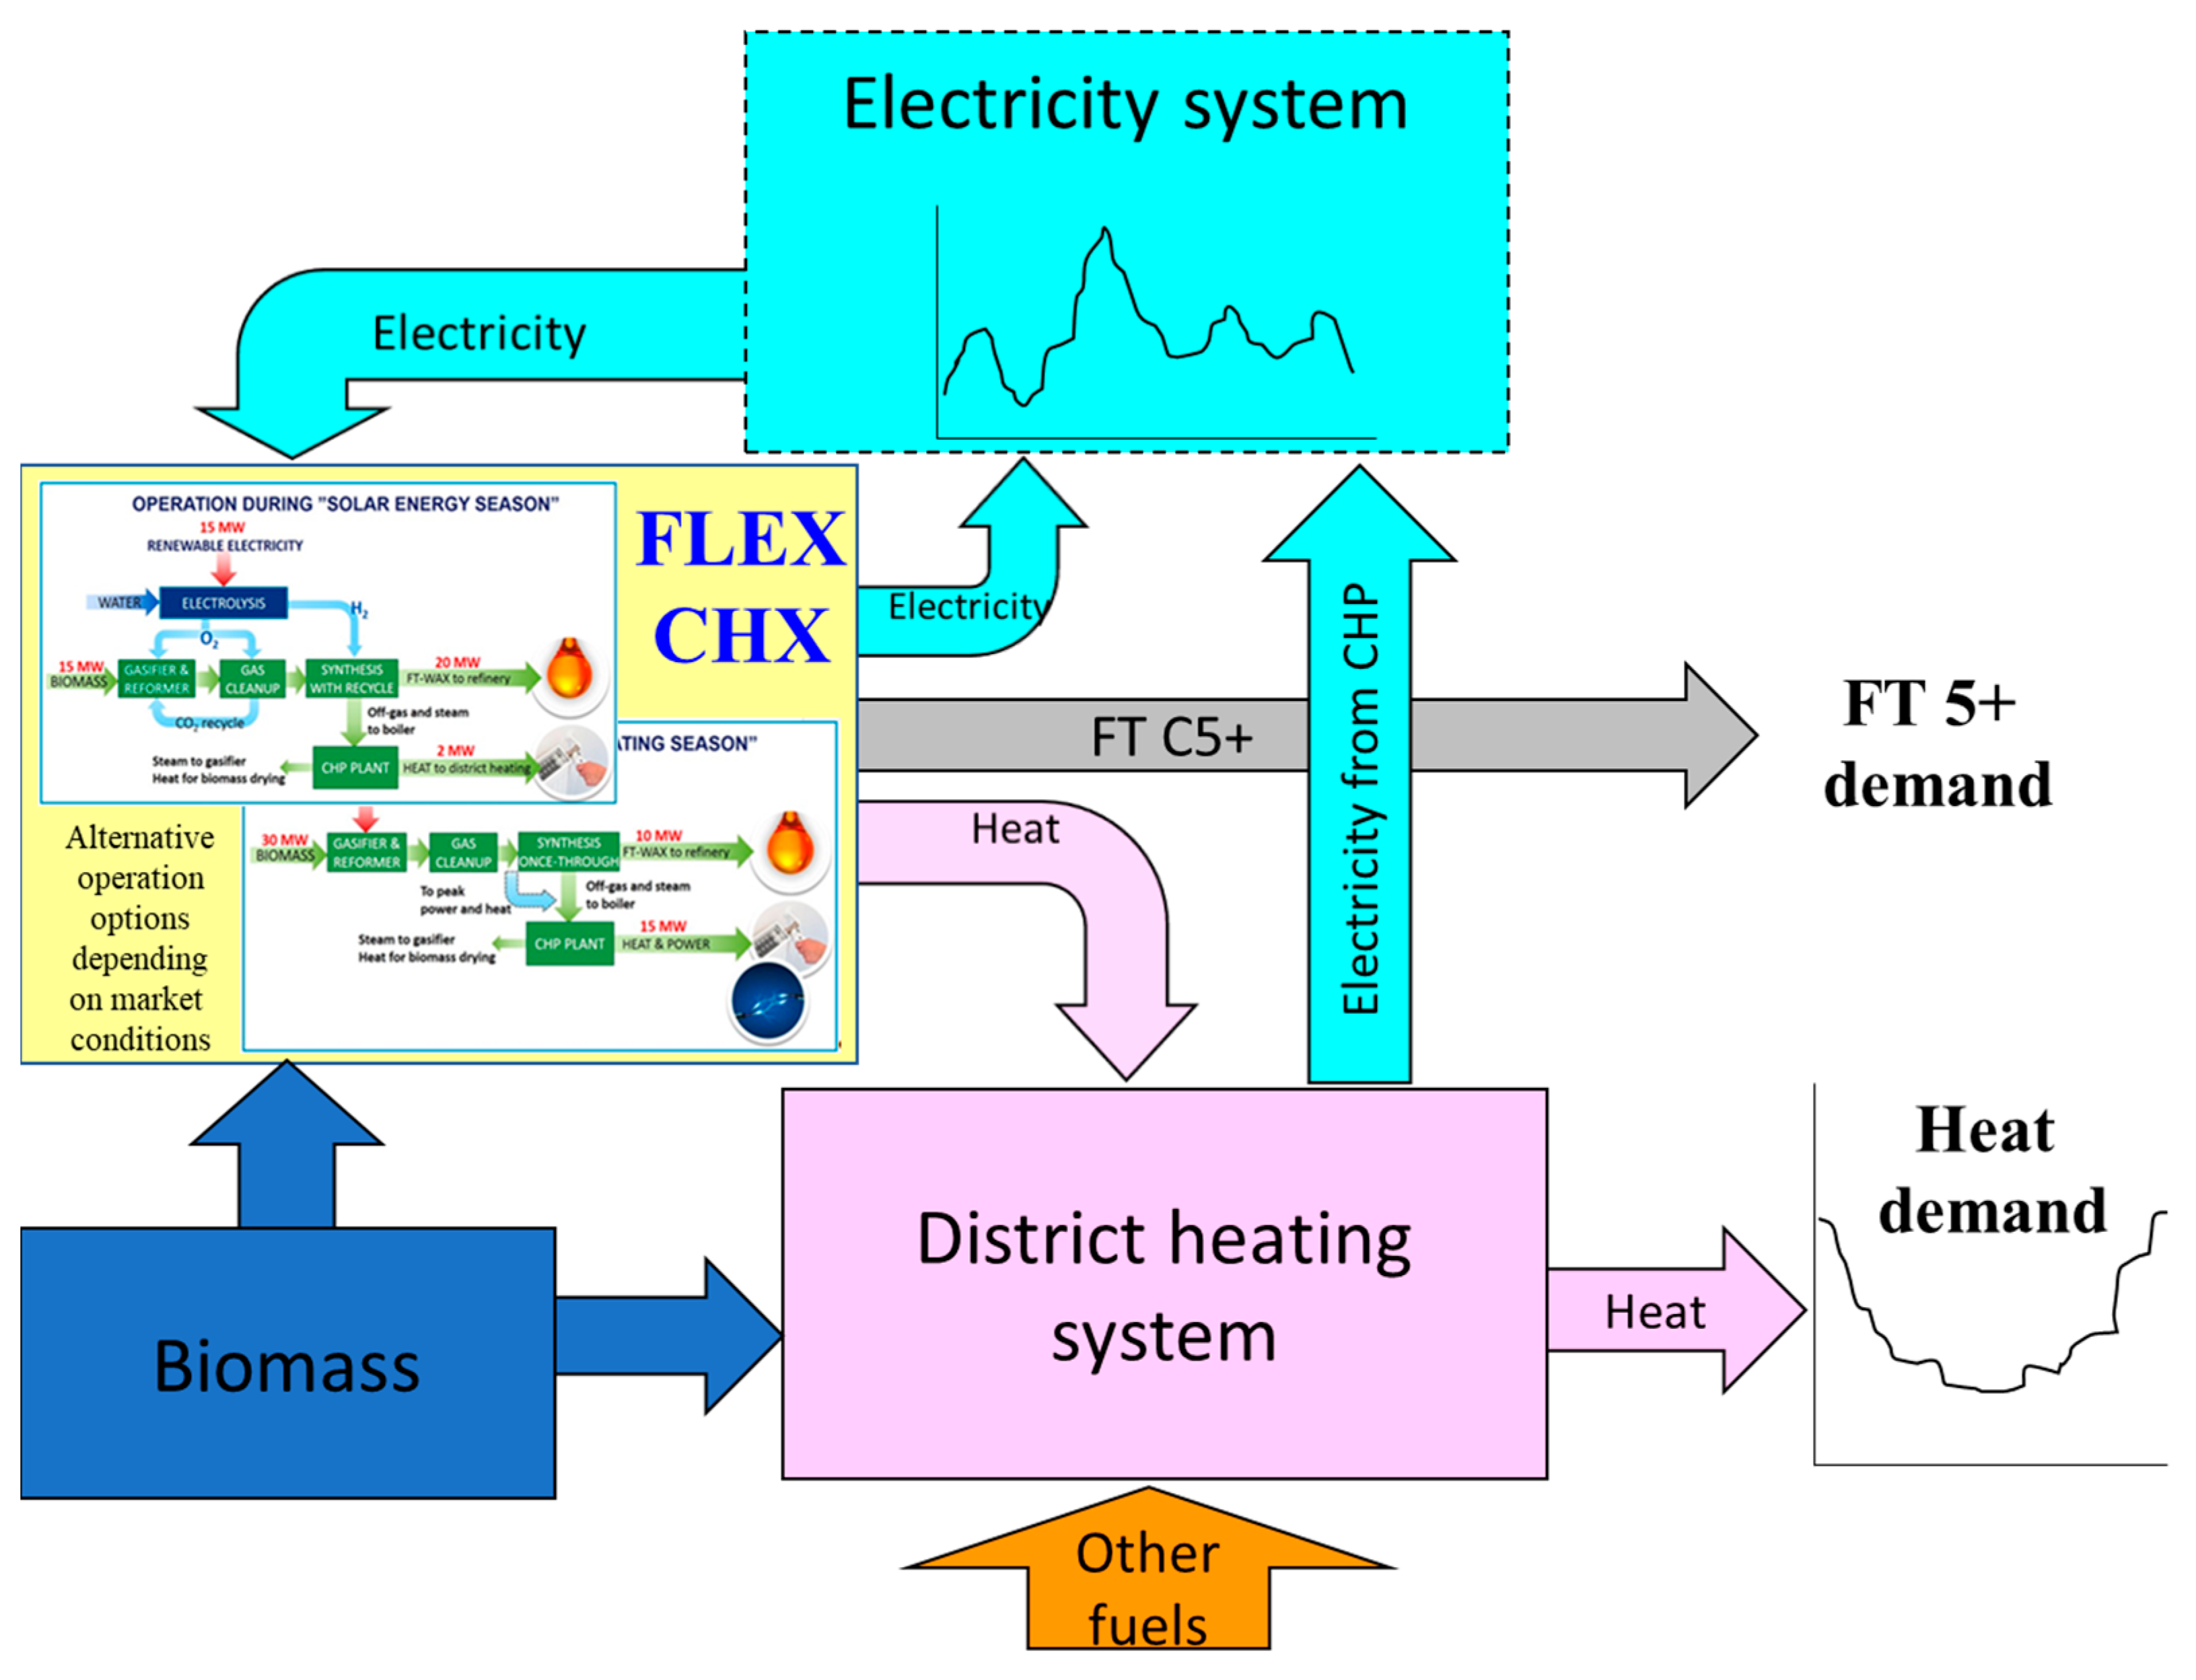
  • The FLEXCHX technological unit is analyzed as a candidate heat supplier among a set of other existing and potentially possible heat supply options.
  • The FLEXCHX technological unit is linked to selected points of the Kaunas district heating system, taking into account the following local conditions:
    • FT off-gas is supplied to an existing gas water heating boiler and steam to the existing heat exchanger converting steam to district heat (case when a FLEXCHX unit is used to contribute to meeting heat demand of residential consumers);
    • FT off-gas is supplied to a combined heat and power (CHP) biomass steam boiler; the steam is optionally supplied directly to an industrial steam consumer or a CHP steam turbine for further electricity and heat production (case for meeting industrial heat demand).
  • Seasonal and daily heat demand variations of residential and industrial consumers are taken into account when specifying demand for the entire system. Projected heat demand during the study period (2020–2050) decreased by 16%.
  • On one hand, the impact of price volatility and the amount of electricity generation from RES is reflected in the variation of electricity price that is used by the FLEXCHX unit as an input. On the other hand, electricity generated from FLEXCHX by-products is supplied to the grid and is sold at the market price.
  • Demand for FT C5+ liquids in the market is reflected by its market price, which is an exogenous variable in the analysis.
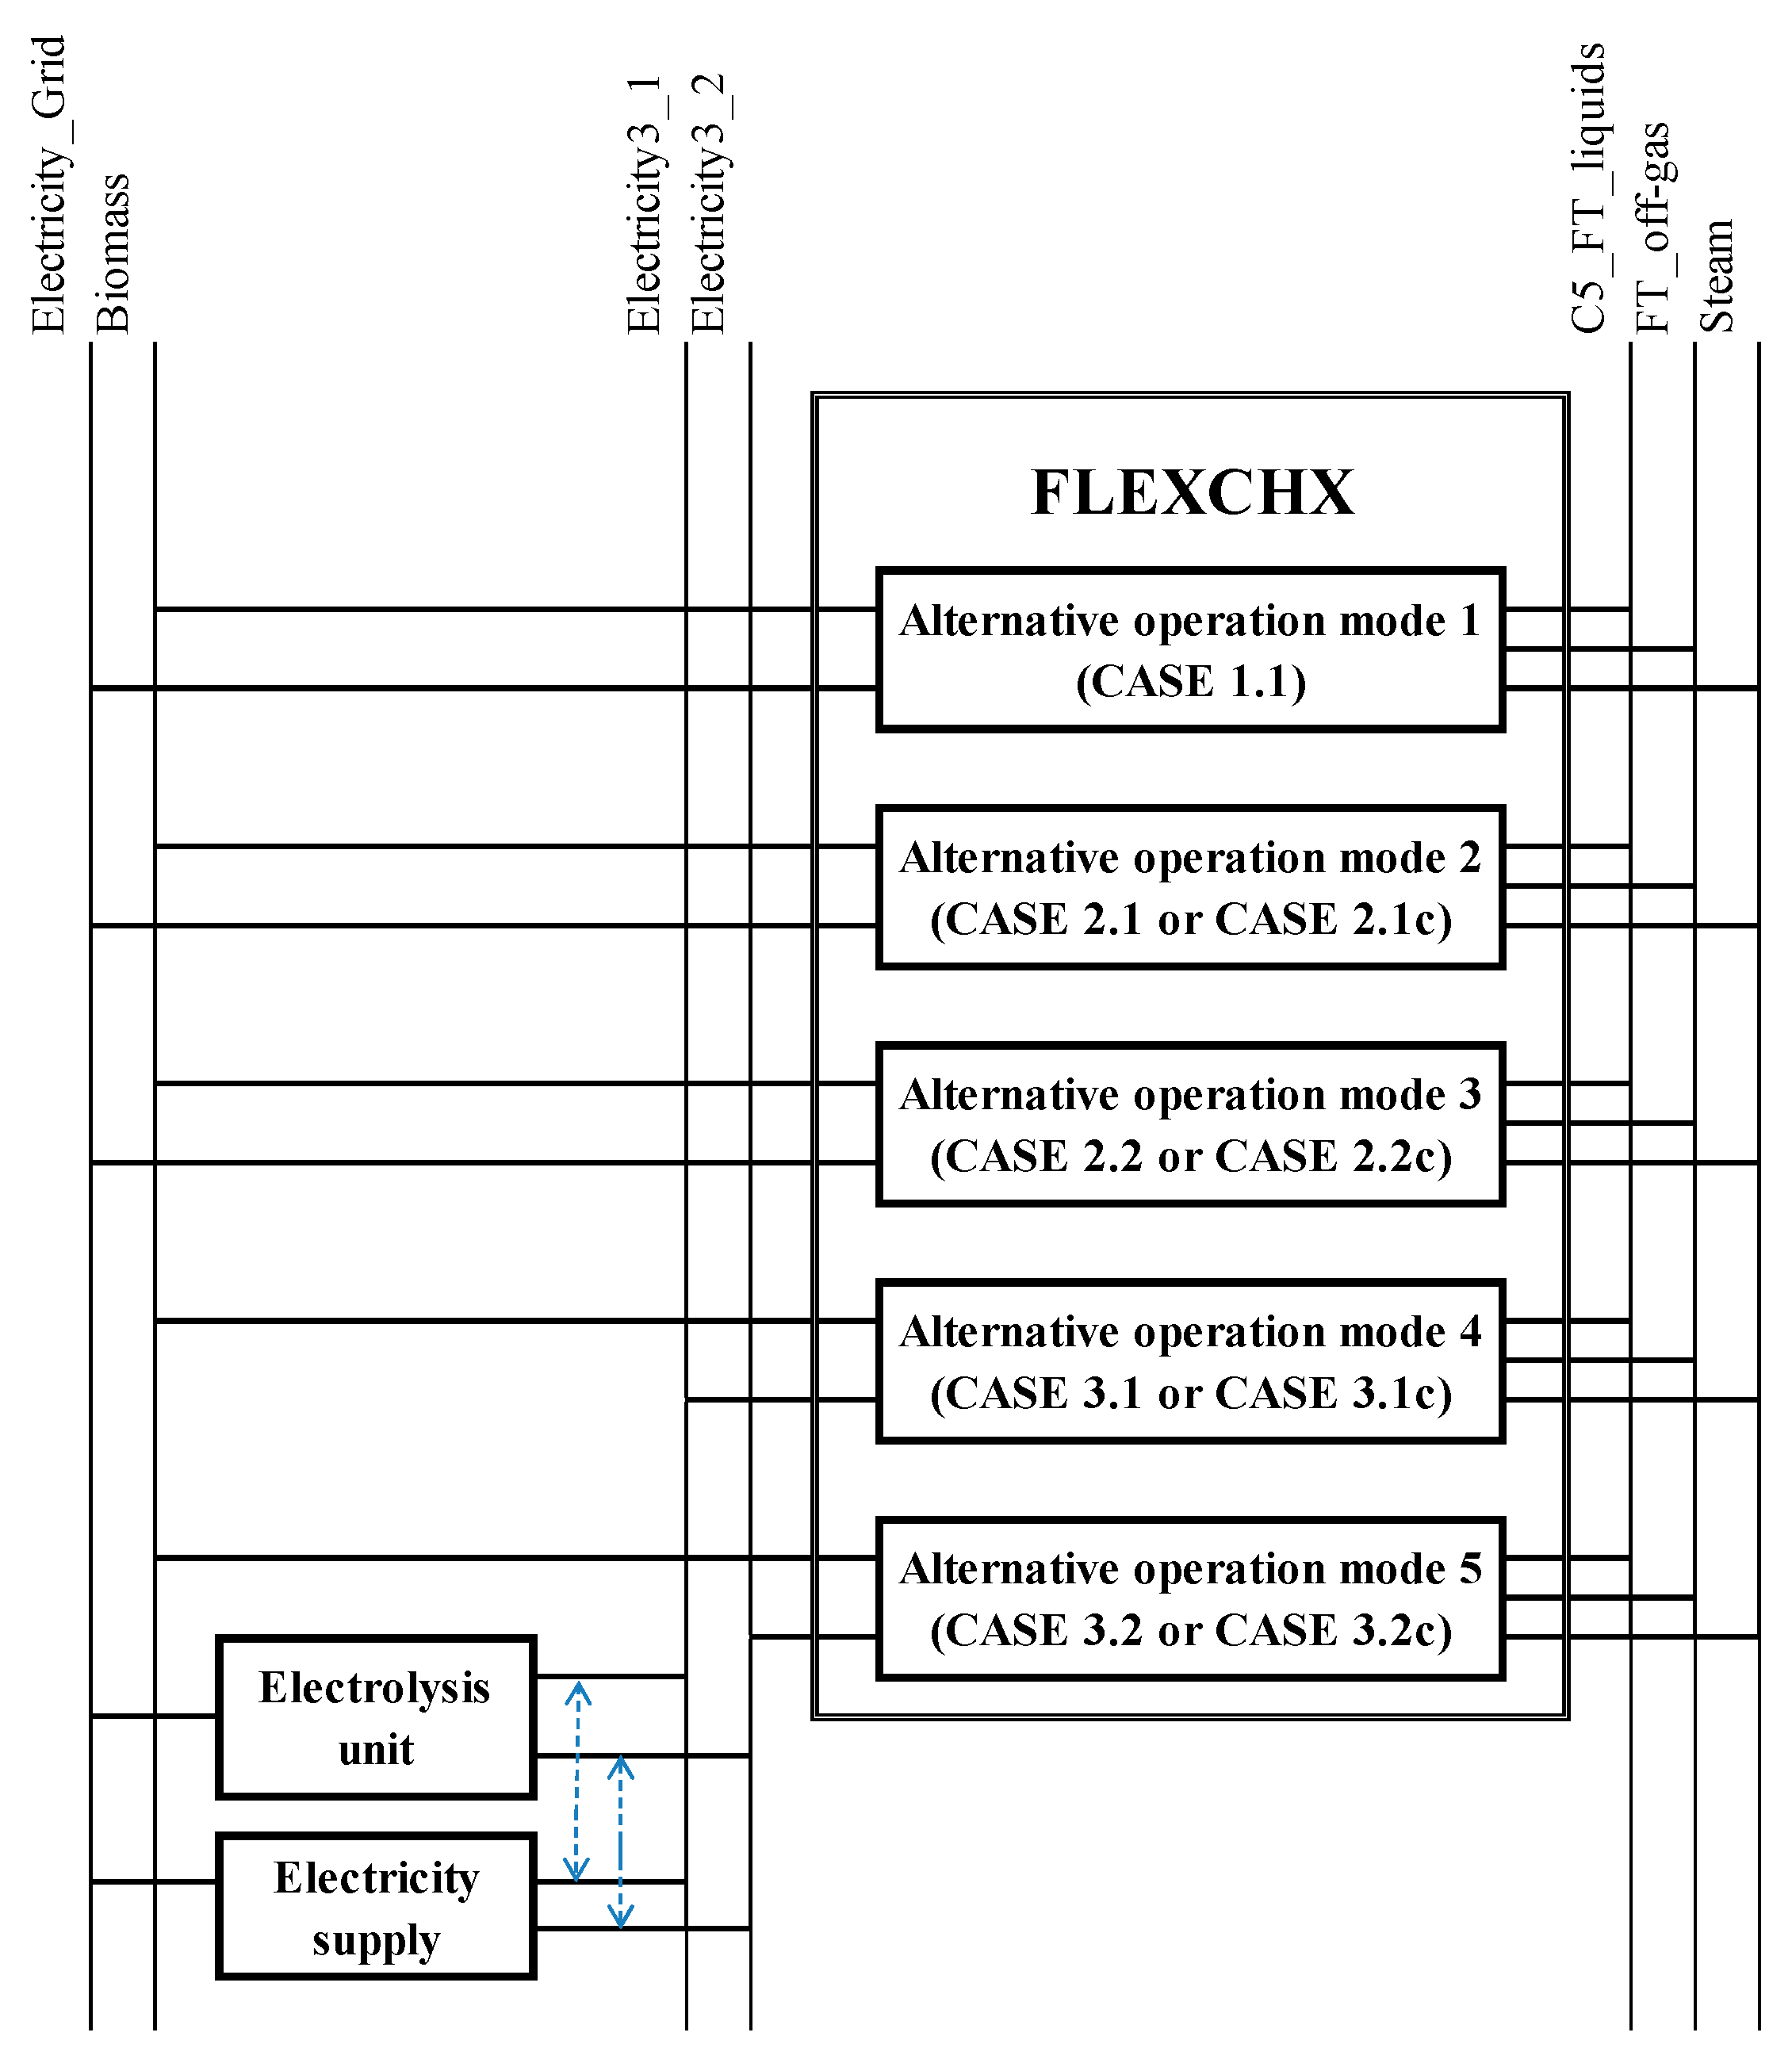
  • Changes in FLEXCHX input and output parameters are assumed as changing linearly when shifting from one operation mode to another. The operation modes analyzed are as follows:
    • Biomass only (Case 1);
    • Biomass with O2/steam gasification and recycling of FT tail gas (Case 2 with variable and Case 2c with constant biomass input);
    • Biomass gasification boosted by electrolysis (Case 3 and Case 3c with variable and constant biomass input, respectively);
  • The optimal capacity and operation mode of the FLEXCHX unit with variable and constant biomass input is selected for different possible location points in the district heating system.
  • Operation modes of the FLEXCHX unit can change depending on the season and time within a day (depending on demand and electricity price variation in the system affecting the unit’s dispatch).
The analysis concept described above is summarized in Figure 1.
The development and operation of the district heating system were analyzed with the mathematical model [40,41] implemented in the MESSAGE Int. V2 energy system modeling software [42]. The energy system is represented using an oriented graph. The branches in the graph correspond to the individual technologies (existing or candidates), while the nodes correspond to the individual energy types at the different energy system levels.
The simplified structural scheme for the district heating system model is presented in Figure 2. The model of the district heating system of the city of Kaunas consists of 103 technologies with different modes of operation, including the provision of reserve services.
The main variables of the district heating model are grouped into the following three categories:
  • energy and product flows (quantities); this category also includes the volume of reserve services required;
  • capacity additions/expansion for technology;
  • storage capacity.
The main equations of the district heating model are grouped into the following four categories:
  • energy or product flow balances at all nodes of the oriented network;
  • constraints on variables over a year or individual time periods within a year;
  • dynamic constraints linking energy flows or installed capacity in years t and t − 1;
  • accounting equations (fuel consumption, energy production, emissions, etc.).
Each technology is characterized by several parameters (investment costs, variable and fixed operating costs, efficiency, lifetime, construction time, availability for reservation services, etc.). Based on the above, a linear programming problem is created. The objective function, which represents the total discounted system cost over the entire study period, is minimized. A summary of parameters describing technology groups is presented in Appendix A Table A1.
Fuel price assumptions are given in Table 1.

2.2. Representation of FLEXCHX Technology in the Model for Analysis of District Heating System Operation and Development

Aggregated energy and commodity flow chains within the FLEXCHX technology, as used in the district heating model, were developed based on actual FLEXCHX technology operation diagrams. Emphasis was placed on representing the total FLEXCHX inputs and outputs when operating in the selected mode. This was done by aggregating separate inputs and outputs of the same energy or commodity form. These energy and commodity chains, representing alternative modes of the technology, form the overall FLEXCHX technology representation (see Figure 3) in the Kaunas District Heating Model.
Shares between quantities of products on the input, as well as on the output, of all alternative operation modes are fixed. They do not change during the FLEXCHX operation. A similar situation is for electricity used by the electrolysis unit and FLEXCHX technology. However, a shift from one operation mode to another or even simultaneous operation of several operation modes is allowed. This allows model flexibility, modeling changes between input and output shares of the FLEXCHX technology. This modeling approach is built on the assumption that linear interpolation for input-output product shares of alternative operation modes is applicable.
A techno-economic analysis of the FLEXCHX technology for five different process configurations and two types of biomass input types (variable and constant) was conducted to estimate techno-economic parameters. The process simulation was conducted in Aspen Plus V10 [43]. Table 2 shows all relevant simulation parameters used for the Kaunas district heating case study.
The resulting efficiency values for all cases are displayed in Table 3. It is apparent that Case 1 has the lowest fuel and carbon efficiencies of all processes, yet, it has the highest process efficiency. This is mainly due to the lack of recycling of other outputs. Without it, the product output is shifted away from the FT C5+ production towards heat and power production. Similar process efficiencies are observed by other authors [25]. Furthermore, with the optimal process configuration simulated in Case 2 and Case 2c, higher efficiencies can be found compared to Case 1. In the boosted by electrolysis mode, Case 3 and Case 3c efficiencies are improved in by adding hydrogen to the process.
Technical parameters describing FLEXCHX technology according to modeling principles are shown in Figure 1 and listed in Table 4. Calculation of economic parameters for Lithuanian conditions and for the Kaunas DH system model prepared using ASPEN model is shown in Appendix A Table A2. Data in Table A2 do not include electricity, district heat, or biomass prices because these parameters are calculated separately using an additional, integrated, Lithuanian power and heat model [40]. Country-specific work wage was assumed to be 15 EUR/hour. Economic parameters are summarized in Table 5.
Costs describing FLEXCHX technology in the model for analysis of Kaunas district heating system operation and development exclude costs related to the electrolyzer. Costs for electrolyzers are calculated by taking cost differences between corresponding costs with and without the electrolyzer. Costs per unit are related to the input (electrical) capacity of the electrolyzer (investment cost and fixed operation and maintenance cost) or to electricity consumption (variable operation and maintenance cost).

2.3. Link with the Electricity System

FLEXCHX technology uses electricity in the technological process. Electricity consumption is particularly significant when hydrogen is used to increase the yield of the main product. For this reason, it only makes economic sense to produce hydrogen when electricity prices are lowest on the market. At these points in time, FLEXCHX technology can switch to other operating modes that comply with Case 3 or Case 3a. For this reason, electricity market price dynamics are needed in order to realistically model FLEXCHX operation.
In the future, the electricity system will also undergo significant changes to mitigate climate change. This will inevitably affect electricity prices, and with the expansion of RES power, price fluctuations are expected to increase over time [38]. Given that future electricity price levels and price fluctuations are associated with large uncertainties and depend on the power generation structure, meteorological conditions, and situation in the neighboring markets, scenario analysis must be employed in order to better represent future situations. Thus, in order to assess possible changes in electricity prices, a mathematical model for analysis of the development of the Lithuanian electricity system in the long run was used in this work (soft linked to Kaunas DH system model) [40]. The schematic diagram of the model is shown in Figure 4.
District heating systems are represented in this electricity system model in an aggregated form; therefore, the direct connection of FLEXCHX technology is not possible. Many details of a specific (in this case, Kaunas DH system) heat supply system would be lost. Thus, a soft coupling of these two models was chosen to ensure both a proper representation of the entire Lithuanian electricity system and a highly detailed modeling of the Kaunas DH system, allowing observation of the impact of the electricity system on the operation of FLEXCHX. A mathematical model designed to analyze the development and operation of the electricity system was used to estimate electricity prices, and a detailed mathematical model designed to analyze the development and operation of the Kaunas district heating system was used to assess the economic attractiveness of the FLEXCHX technology. In the context of this study, economic attractiveness was expressed in terms of total savings over the duration of the study period. This was achieved by comparing FLEXCHX cases (Case 1–3) to the system cost without FLEXCHX.

3. Scenarios Analyzed

The characteristics of the scenarios considered in the study are presented in Table 6.
The “public heat supplier” option corresponds to the situation when the FLEXCHX technology is operated at the Petrasiunai power plant site and the technology by-products, FT off-gas and steam, are used to meet the heating needs of household (retail) consumers. The other case of the “industrial heat supplier” corresponds to the situation when the FLEXCHX technology operates at the Foksita CHP site, and the technology by-products, FT off-gas and steam, are used to meet the heat demand of industrial consumers. In both cases, FLEXCHX technology is not the sole energy provider but competes in the marketplace with other heat providers.
Moderate electricity price volatility corresponds to the case where there are sufficient options in the electricity market to balance the volatile electricity produced by renewable energy sources. This can be done through a wide range of electricity storage facilities, successful development of interconnection capacity, active participation of smart consumers in managing electricity generation and consumption processes, widely developed hydrogen and other synthetic fuel production technologies, and so on. Greater price volatility can be expected if there are constraints on the balancing of variable renewable generation. In Lithuania, this can be the case, where it cannot obtain balancing power from neighboring countries via international interconnectors. Such a situation will be modeled assuming gradually declining electricity import opportunities, which also means that balancing volatile RES generation will become the responsibility of the country.
The parameter on the variability of biomass inputs is intended to describe how the parameters of FLEXCHX technology are evaluated. Two sets of technical and economic parameters of FLEXCHX technology (Table 4 and Table 5) are used in the calculations. In one case, it is considered that the technology configuration is adapted to the constant output of the product FT C5+ liquids. In this case, biomass input may change as the operating modes of FLEXCHX technology change. This corresponds to the “Varying” index in Table 6. Alternatively, the parameters of the FLEXCHX technology are selected to maintain a constant biomass consumption (“Stable” in Table 6).
Each scenario in Table 6 was modeled at different FT C5+ liquid product price levels, which were kept constant throughout the study period considered. These product prices were estimated by calculating the economic performance of the FLEXCHX technology. For Lithuanian conditions, they are in the range of 70–132 EUR/MWh. Ten different steps of product prices were considered; the modeling of the FLEXCHX application in the Kaunas DH system is shown in bold in Table 7.
These calculations, when accepting different product prices, were aimed at estimating the following two things:
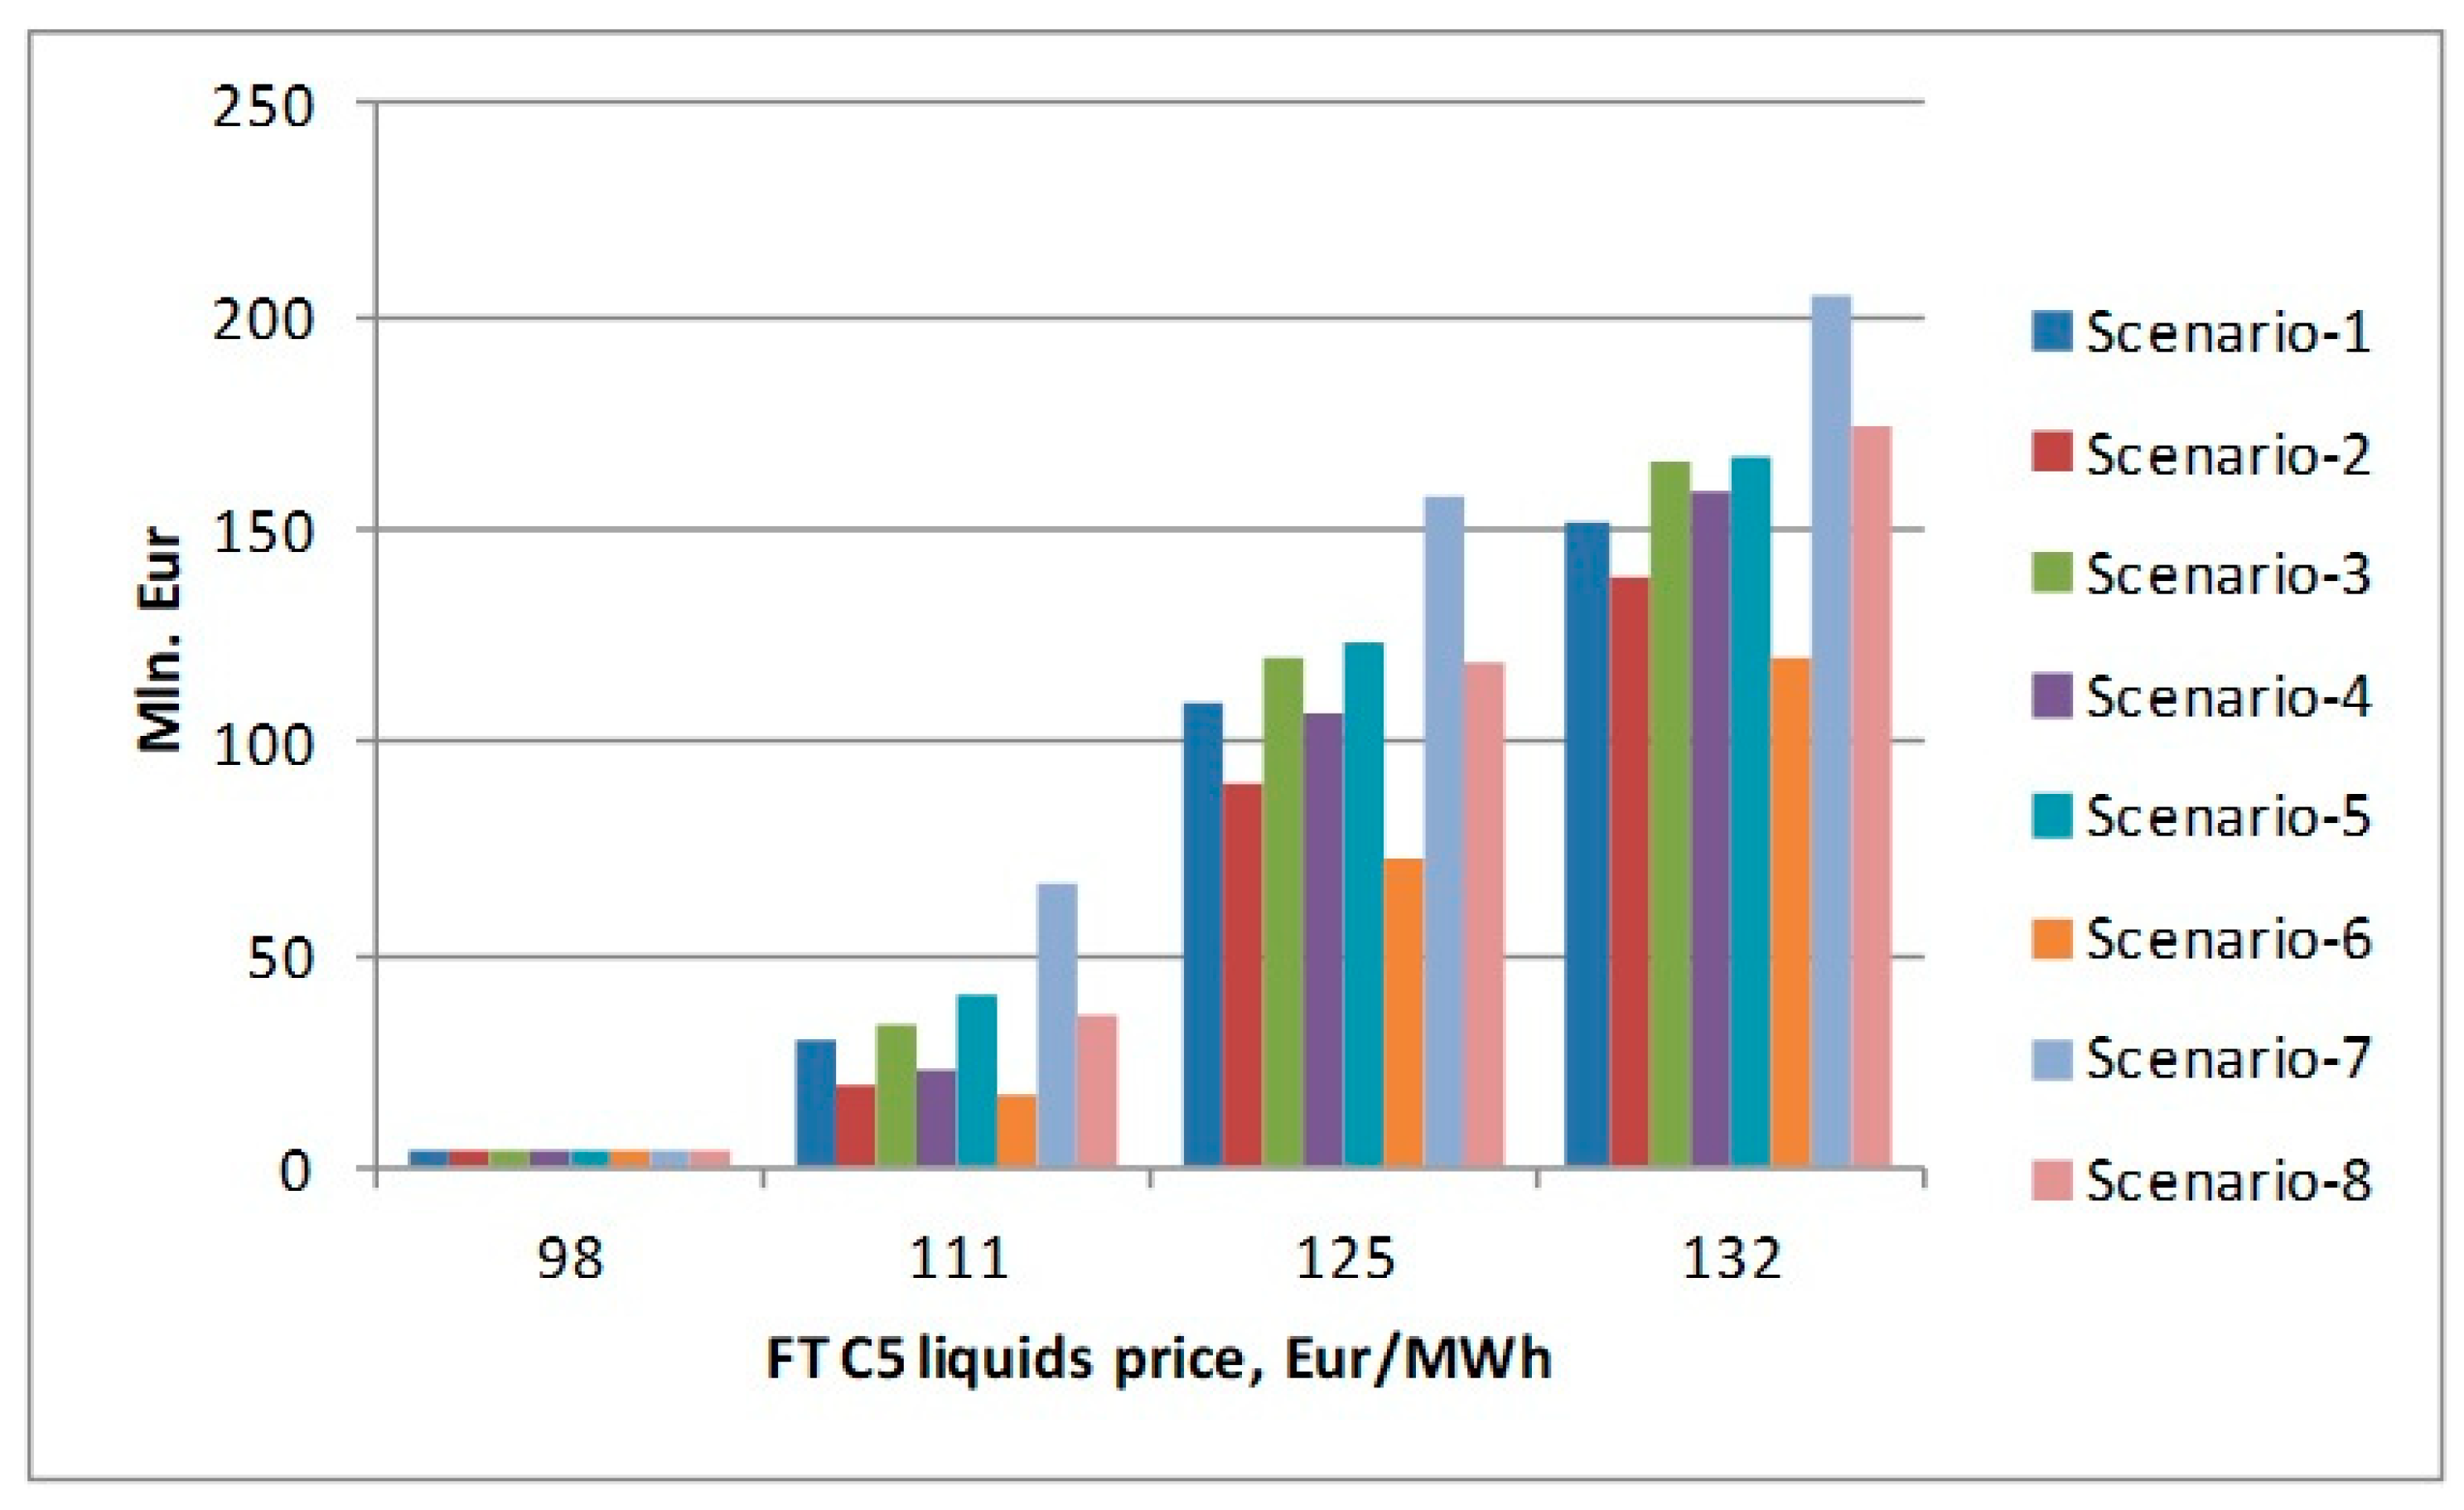
  • at what product (FT C5+) price the implementation of FLEXCHX technology in the Kaunas DH system is cost-effective;
  • the impact of the product price on the installed capacity of FLEXCHX technology.
Obligatory CO2 emission reduction in the Kaunas DH system for all scenarios was assumed linearly, decreasing from the value 367 kt CO2 equivalent in 2005 to zero in 2050. In modeling, negative emissions due to the use of FT C5+ liquids have been based on the assumption that this fuel component allows avoiding emissions in other sectors of the economy. In other words, CO2 emissions in the Kaunas DH system in 2050 could be higher than zero due to the amount of emissions that could be avoided in other sectors by changing oil products to FT C5+ liquids. The CO2 price changed from 17 EUR/t CO2 eqv. in 2020 up to 90 EUR/t CO2 eqv. in 2050.

4. Results and Discussion

4.1. Expected Future Electricity Price Variations in the Electricity System

Electricity production in Lithuania when the power system operates as an integrated part of the larger European power system and there are no big challenges in electricity import or balancing of renewable energy sources differs only slightly from the current situation (Figure 5). Basically, the changes are related only to the commissioning of a municipal waste and biofuel cogeneration plant in Vilnius, moderate development of wind, solar, and gas cogeneration plants (mainly after 2030), and increased production at the Lithuanian power plant. The latter power plants, together with the hydro-pumped storage power plant, are used to balance the volatile generation of wind and solar power plants. However, international lines make the biggest contribution to balancing volatile RES generation, which entails that Lithuania largely meets its electricity needs at the expense of imported electricity. The annual average electricity market price remains in the range of 52.6–58.1 EUR/MWh during the study period, but the forecasted electricity price variation in 2050 is in the range of 6.5–172.3 EUR/MWh (corresponding to Moderate Variations in Table 7). Price developments are influenced by seasonal and daily fluctuations in demand, as well as the changing generation from renewable energy sources. This is in line with other research stressing the importance of imports in balancing power grids [44,45]. The expected price variation in 2040 is given in Figure 6.
Significantly higher (in comparison with the above described) fluctuations in electricity prices (corresponding to Big Variations in Table 6) are observed when Lithuania meets its electricity needs with electricity produced within the country (limited interconnections). Local electricity generation is mainly based on the development of wind and solar power plants (Figure 7). As a result, the amplitude of electricity price fluctuations is growing. The forecasted electricity price variation in 2050 is in the range of 12.6–330.2 EUR/MWh. The expected electricity price variation in 2040 is given in Figure 8.
Electricity prices, presented in Figure 6 and Figure 8, as input parameters are used in the mathematical model of the Kaunas district heating system. It should be noted that in the case of big fluctuations in electricity prices, longer-lasting low-price situations are observed, which are associated with strong winds and high wind power generation. The reverse relation of the intermittent RES generation to market prices is well-researched [46,47]. It should also be noted that strong (high) winds are quite rare in Lithuania. Thus, the low-price situation shown in Figure 6 and Figure 8 is not common in the country. A high share of RES in electricity production requires additional measures (energy storage and other measures) to balance the intermittent generation. This leads to a general increase in the price of electricity. For this reason, the overall price level in medium and low wind situations is higher compared to the case with moderate price variations described above. While a low amount of solar and wind power plants tend to reduce electricity prices [48,49], higher penetration levels tend to increase price volatility and shift electricity pricing patterns [50,51,52], though this could be mitigated by investing in flexibility options [53].

4.2. Cost of System Operation and Development

Modeling of Kaunas DH system development and functioning, in the long run, has shown that FLEXCHX technology can be successfully integrated into the district heating system. However, one of the important conditions is the market price of the main product of this technology, FT C5+ liquids. With a product price lower than 100 EUR/MWh, FLEXCHX technology is not economically attractive. However, when product price exceeds the 100 EUR/MWh threshold, it is already becoming economically viable. Its attractiveness continues to grow as the price of FT C5+ liquids rises. The savings of discounted cost for the development and operation of the DH system in the scenarios considered are shown in Figure 9. This rather high product price is in line with literature estimates [54,55]; moreover, it could be increased in the future by new EU legislation [14,15,16].
The biggest cost savings in the Kaunas case study are obtained for the FLEXCHX technology, designed for a constant output of the main product when the technology’s by-products are used by the industrial consumer (Scenario 7). The resulting economic effect in the period of 2020–2050 is estimated at EUR 60–200 million if the product price is 111–132 EUR/MWh, respectively. However, implementation of FLEXCHX technology will not begin until 2025 at the earliest and is typically delayed until 2030.
Based on the results of the calculations performed, the technology designed for the stable use of biomass gives a lower economic effect in all scenarios analyzed. The lowest profitability of the FLEXCHX technology in this case is observed in the presence of small fluctuations of electricity prices on the market and the use of by-products for technological purposes (Scenario 6). This can be explained by the relatively low probability of low electricity prices compared to the probabilities of medium and high prices. Thus, investing large sums in an electrolysis plant that could significantly increase product yield in the event of low electricity prices is not the best economic solution, as the plant will often not be fully loaded. Our findings are in line with [56], stating that electricity price is one of the key elements of competitiveness of hydrogen-based fuels. During periods of infrequent low electricity prices, it is more economically feasible to partially reduce the output of the biomass gasification unit and maintain the output of the main product with the help of a specially designed electrolysis unit.
Higher fluctuations in electricity prices on the market have a positive effect on the cost-effectiveness of FLEXCHX technology. In all the scenarios analyzed, the economic impact is higher than in the analogous scenarios with the average fluctuation of electricity prices on the market. These differences are greater when the FLEXCHX technology is designed for the stable use of biomass and the supply of its by-products is going to industrial users. The difference in economic effect in the Kaunas DH system, in this case, is estimated at EUR 18–54 mln.

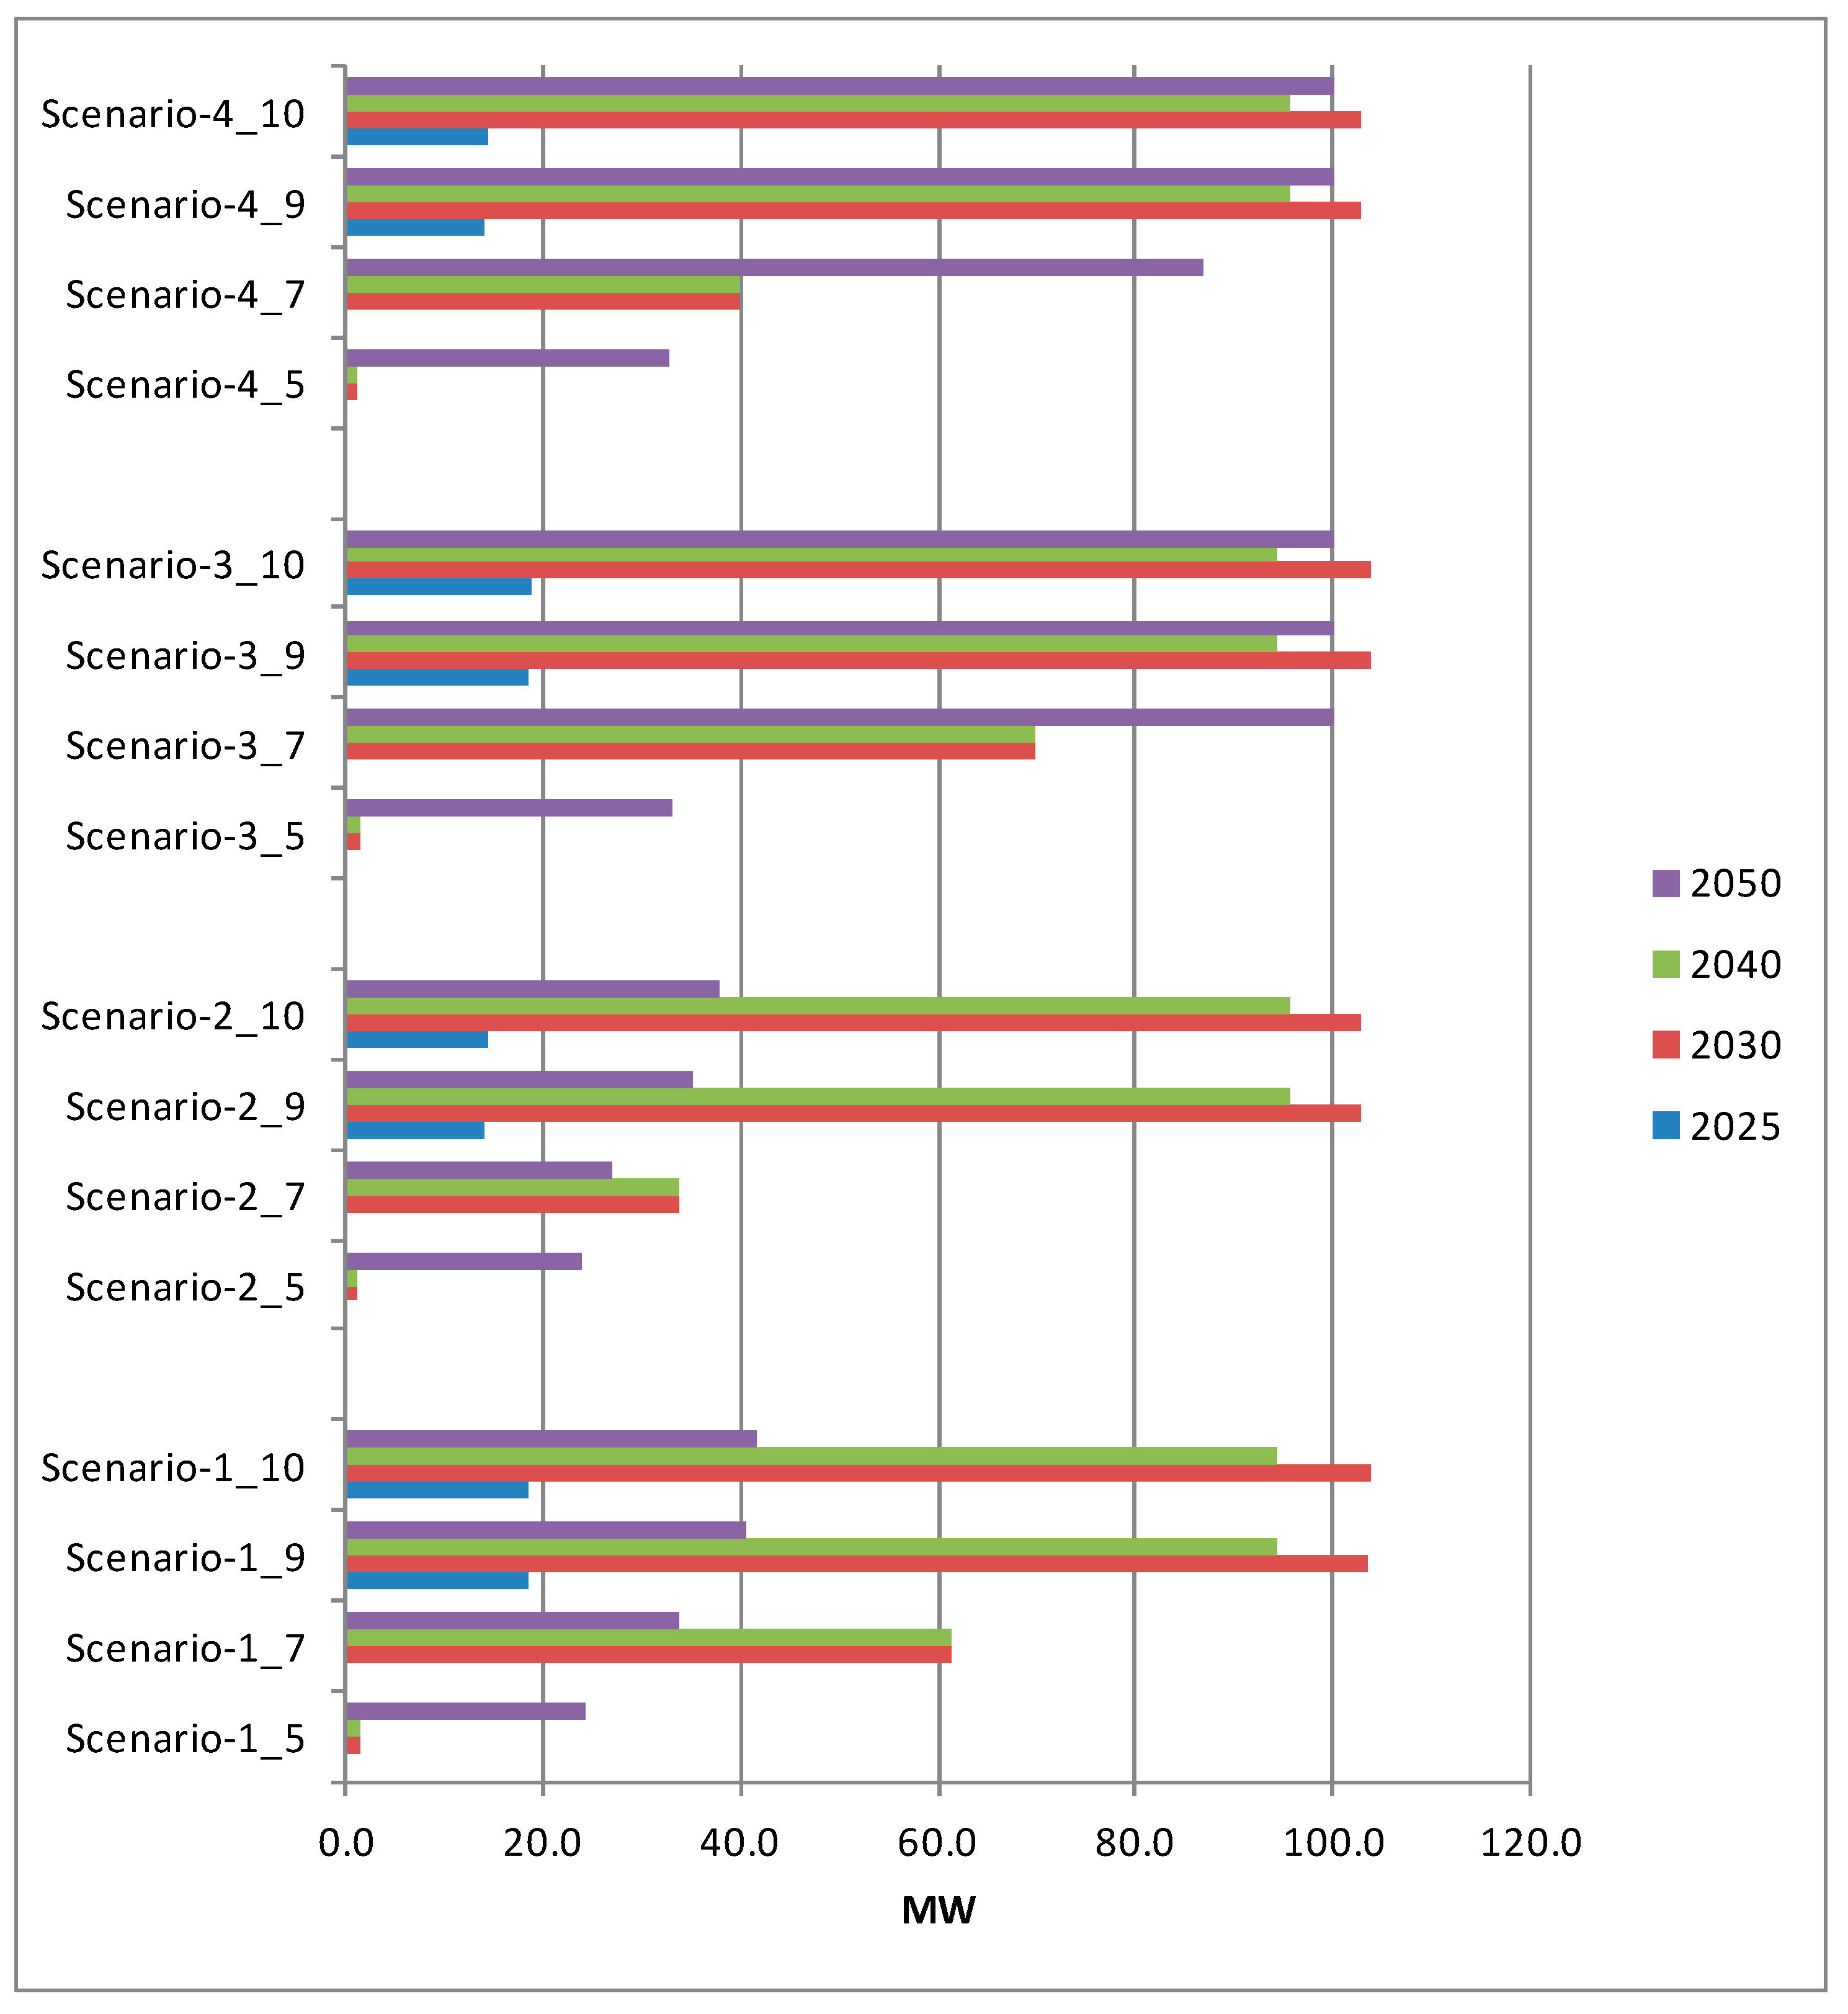
4.3. Installed Capacity of FLEXCHX Technology

The dynamics of the installed capacity of the FLEXCHX technology in the considered scenarios are summarized in Figure 10 and Figure 11. The maximum installed capacity of FLEXCHX technology, achieved at high prices of FT C5+ liquids, is estimated at about 100 MW in the Kaunas DH system (measured by the output of FT C5+ liquids). The maximum installed capacity is limited by the heat demand in the Kaunas DH system and its variations during the year, especially the demand during the non-heating period (summer time base load). FLEXCHX technology aims to meet this demand fully by providing by-products (FT off-gas and steam). However, in the case of average fluctuations in electricity prices, the installed capacity of FLLEXCHX technology, which was increasing during the period under review, decreases at its end (Scenarios 1 and 2, and Scenarios 5 and 6 in case of higher product price). This is explained by the significant biomass price growth and the decommissioning of FLEXCHX technology equipment, which already reached its technical lifetime. Biomass availability for power and heating can be constrained not only by increasing prices, but also by policy changes or resource shortages [57]. Revenue from the sale of the main product and by-products no longer outweighs new investments for the rebuilding of the technology. (A possible decrease in investment costs and/or increase in the price of the main product were not taken into account in the calculations). However, this is not the case with large fluctuations in electricity prices in the market. In this case, the FLEXCHX technology is restored at the end of its technical lifetime.
At lower FT C5+ liquid prices (but still above 100 EUR/MWh), the installed capacity of the FLEXCHX technology does not reach the above level because the lower revenue from the sale of the main product requires higher revenue from the sale of by-products. However, this reduces the competitive advantage in the heat market and narrows the scope of the technology.
Despite the development of FLEXCHX technology in the mathematical model allowed from 2025, the installed capacity in almost all scenarios does not exceed 20 MW in the first period. This is because, in the Kaunas DH system, there is a lot of competition between heat producers [39], which reduces heat prices and FLEXCHX technology revenue from the sale of by-products. With the decommissioning of some heat plants due to the end of their technical service life, the competitive conditions of FLEXCHX technology improve, and the installed capacity increases.

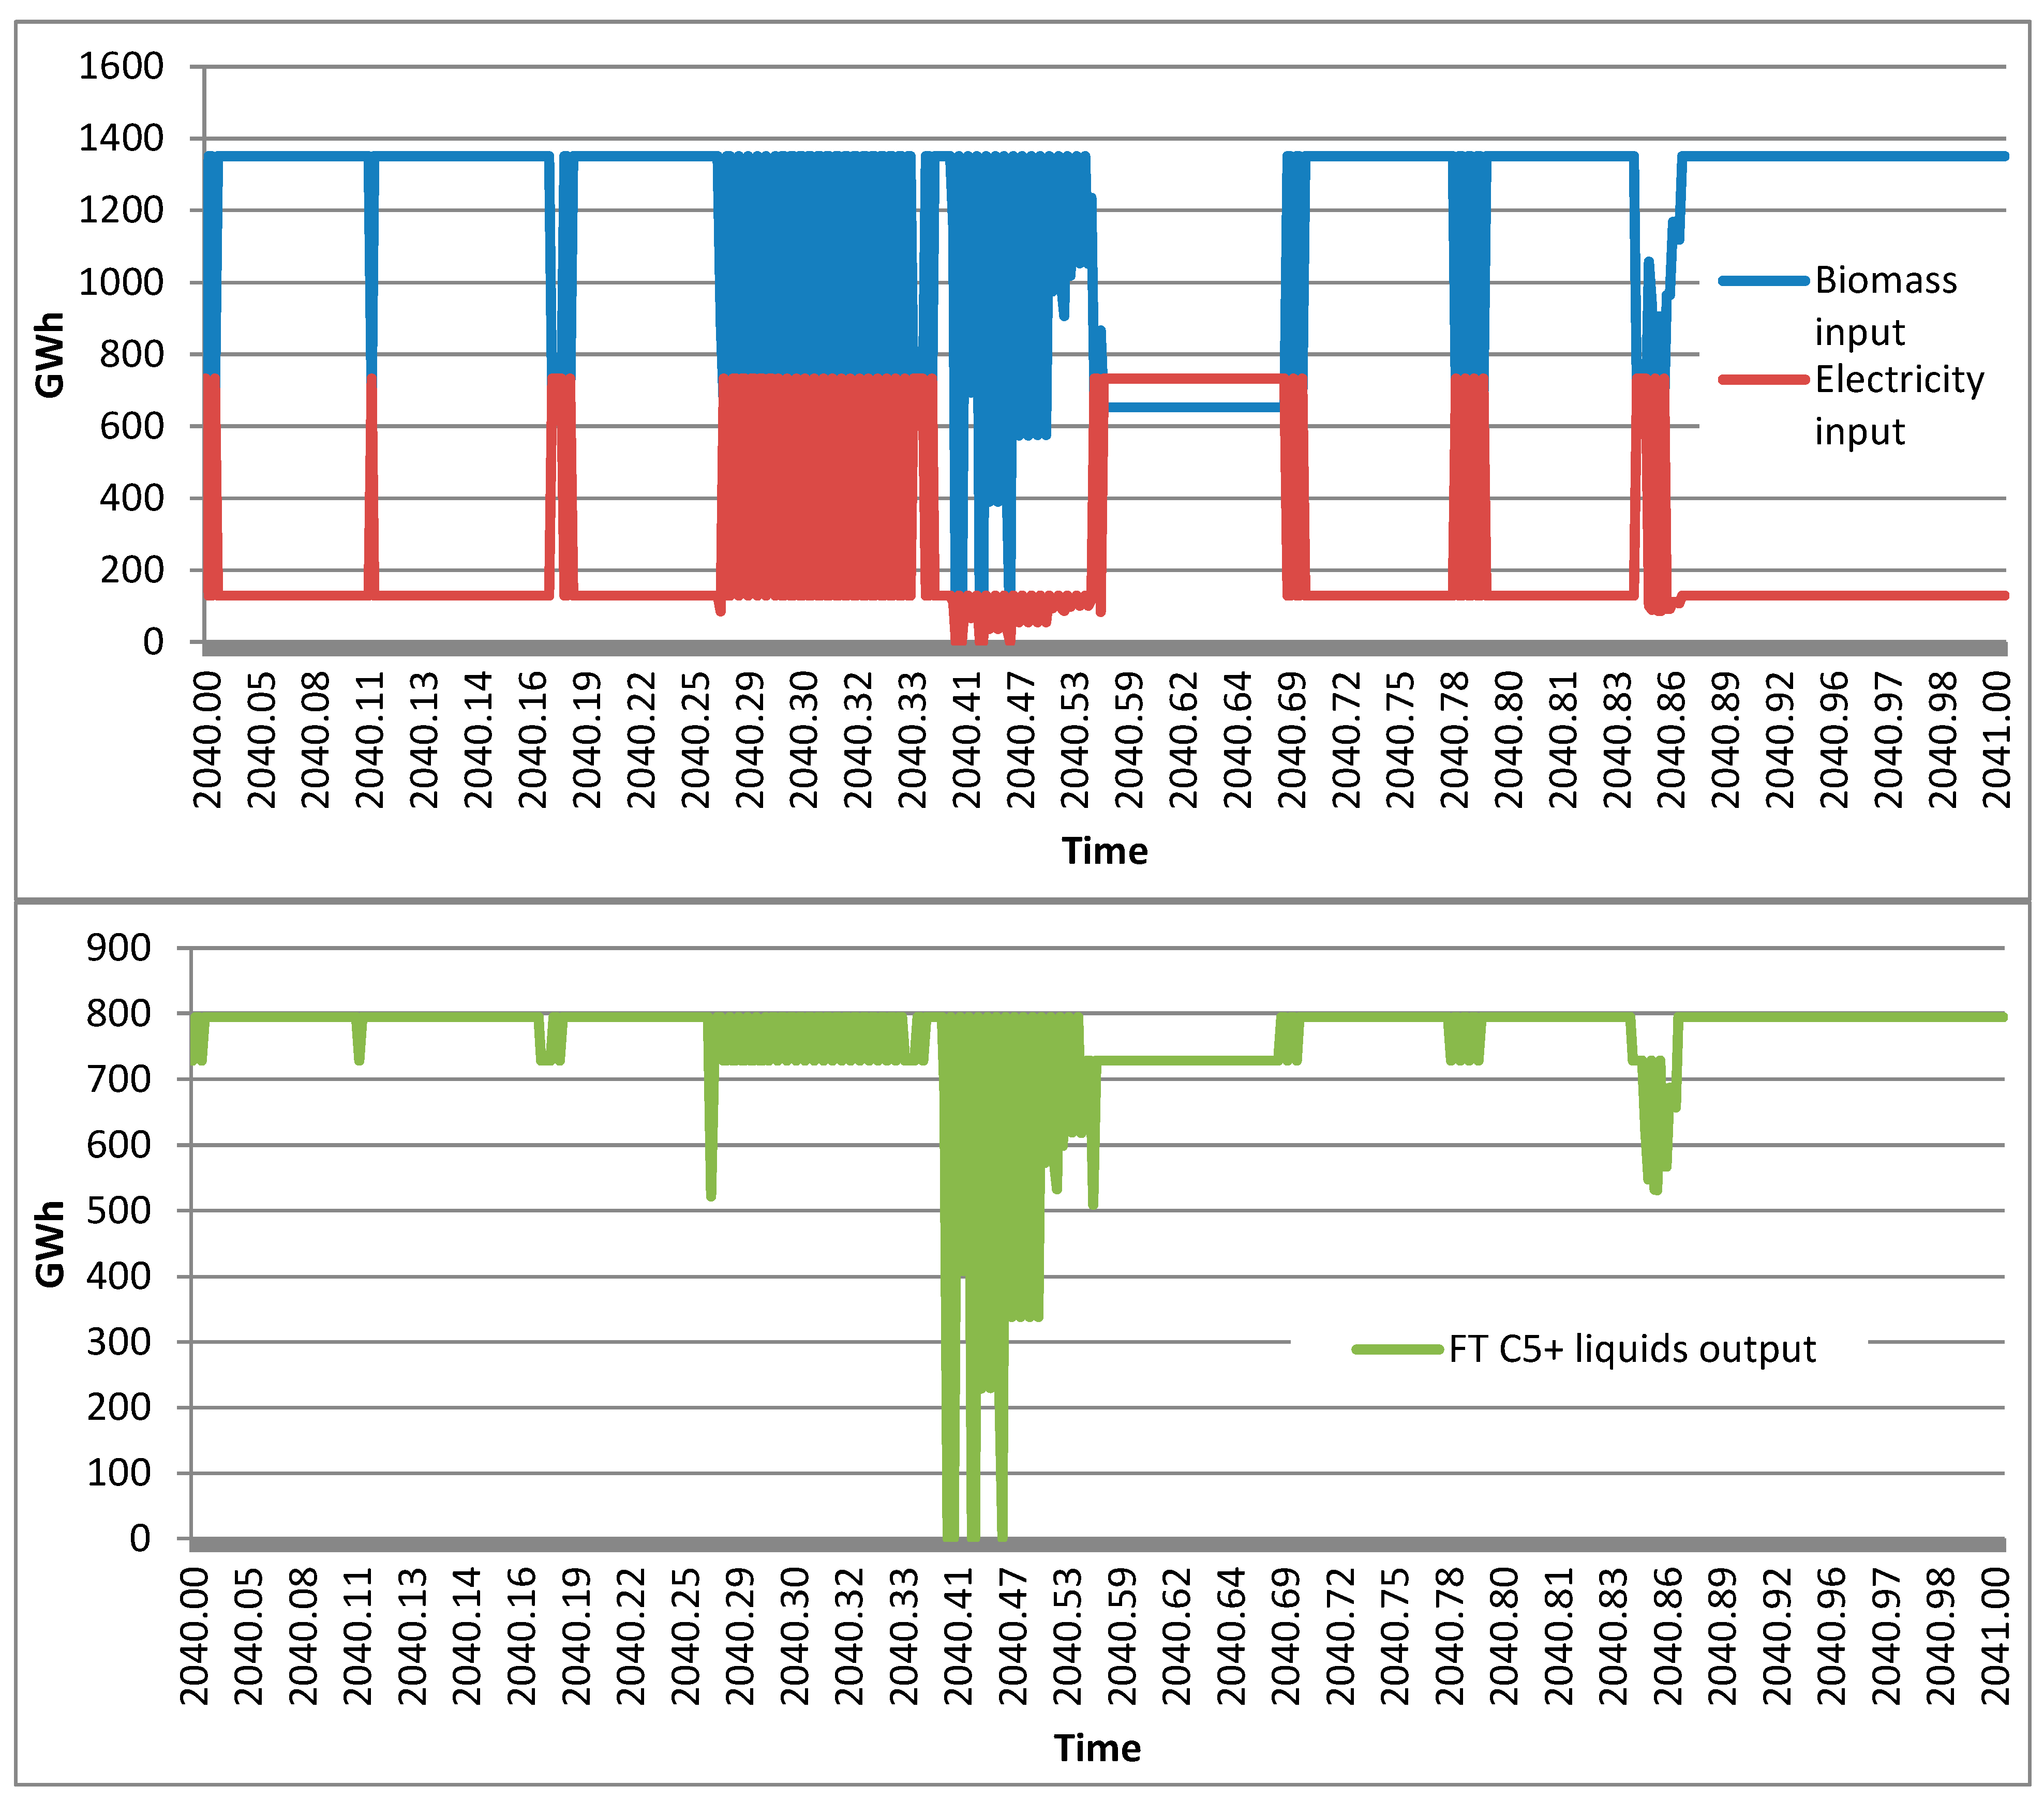
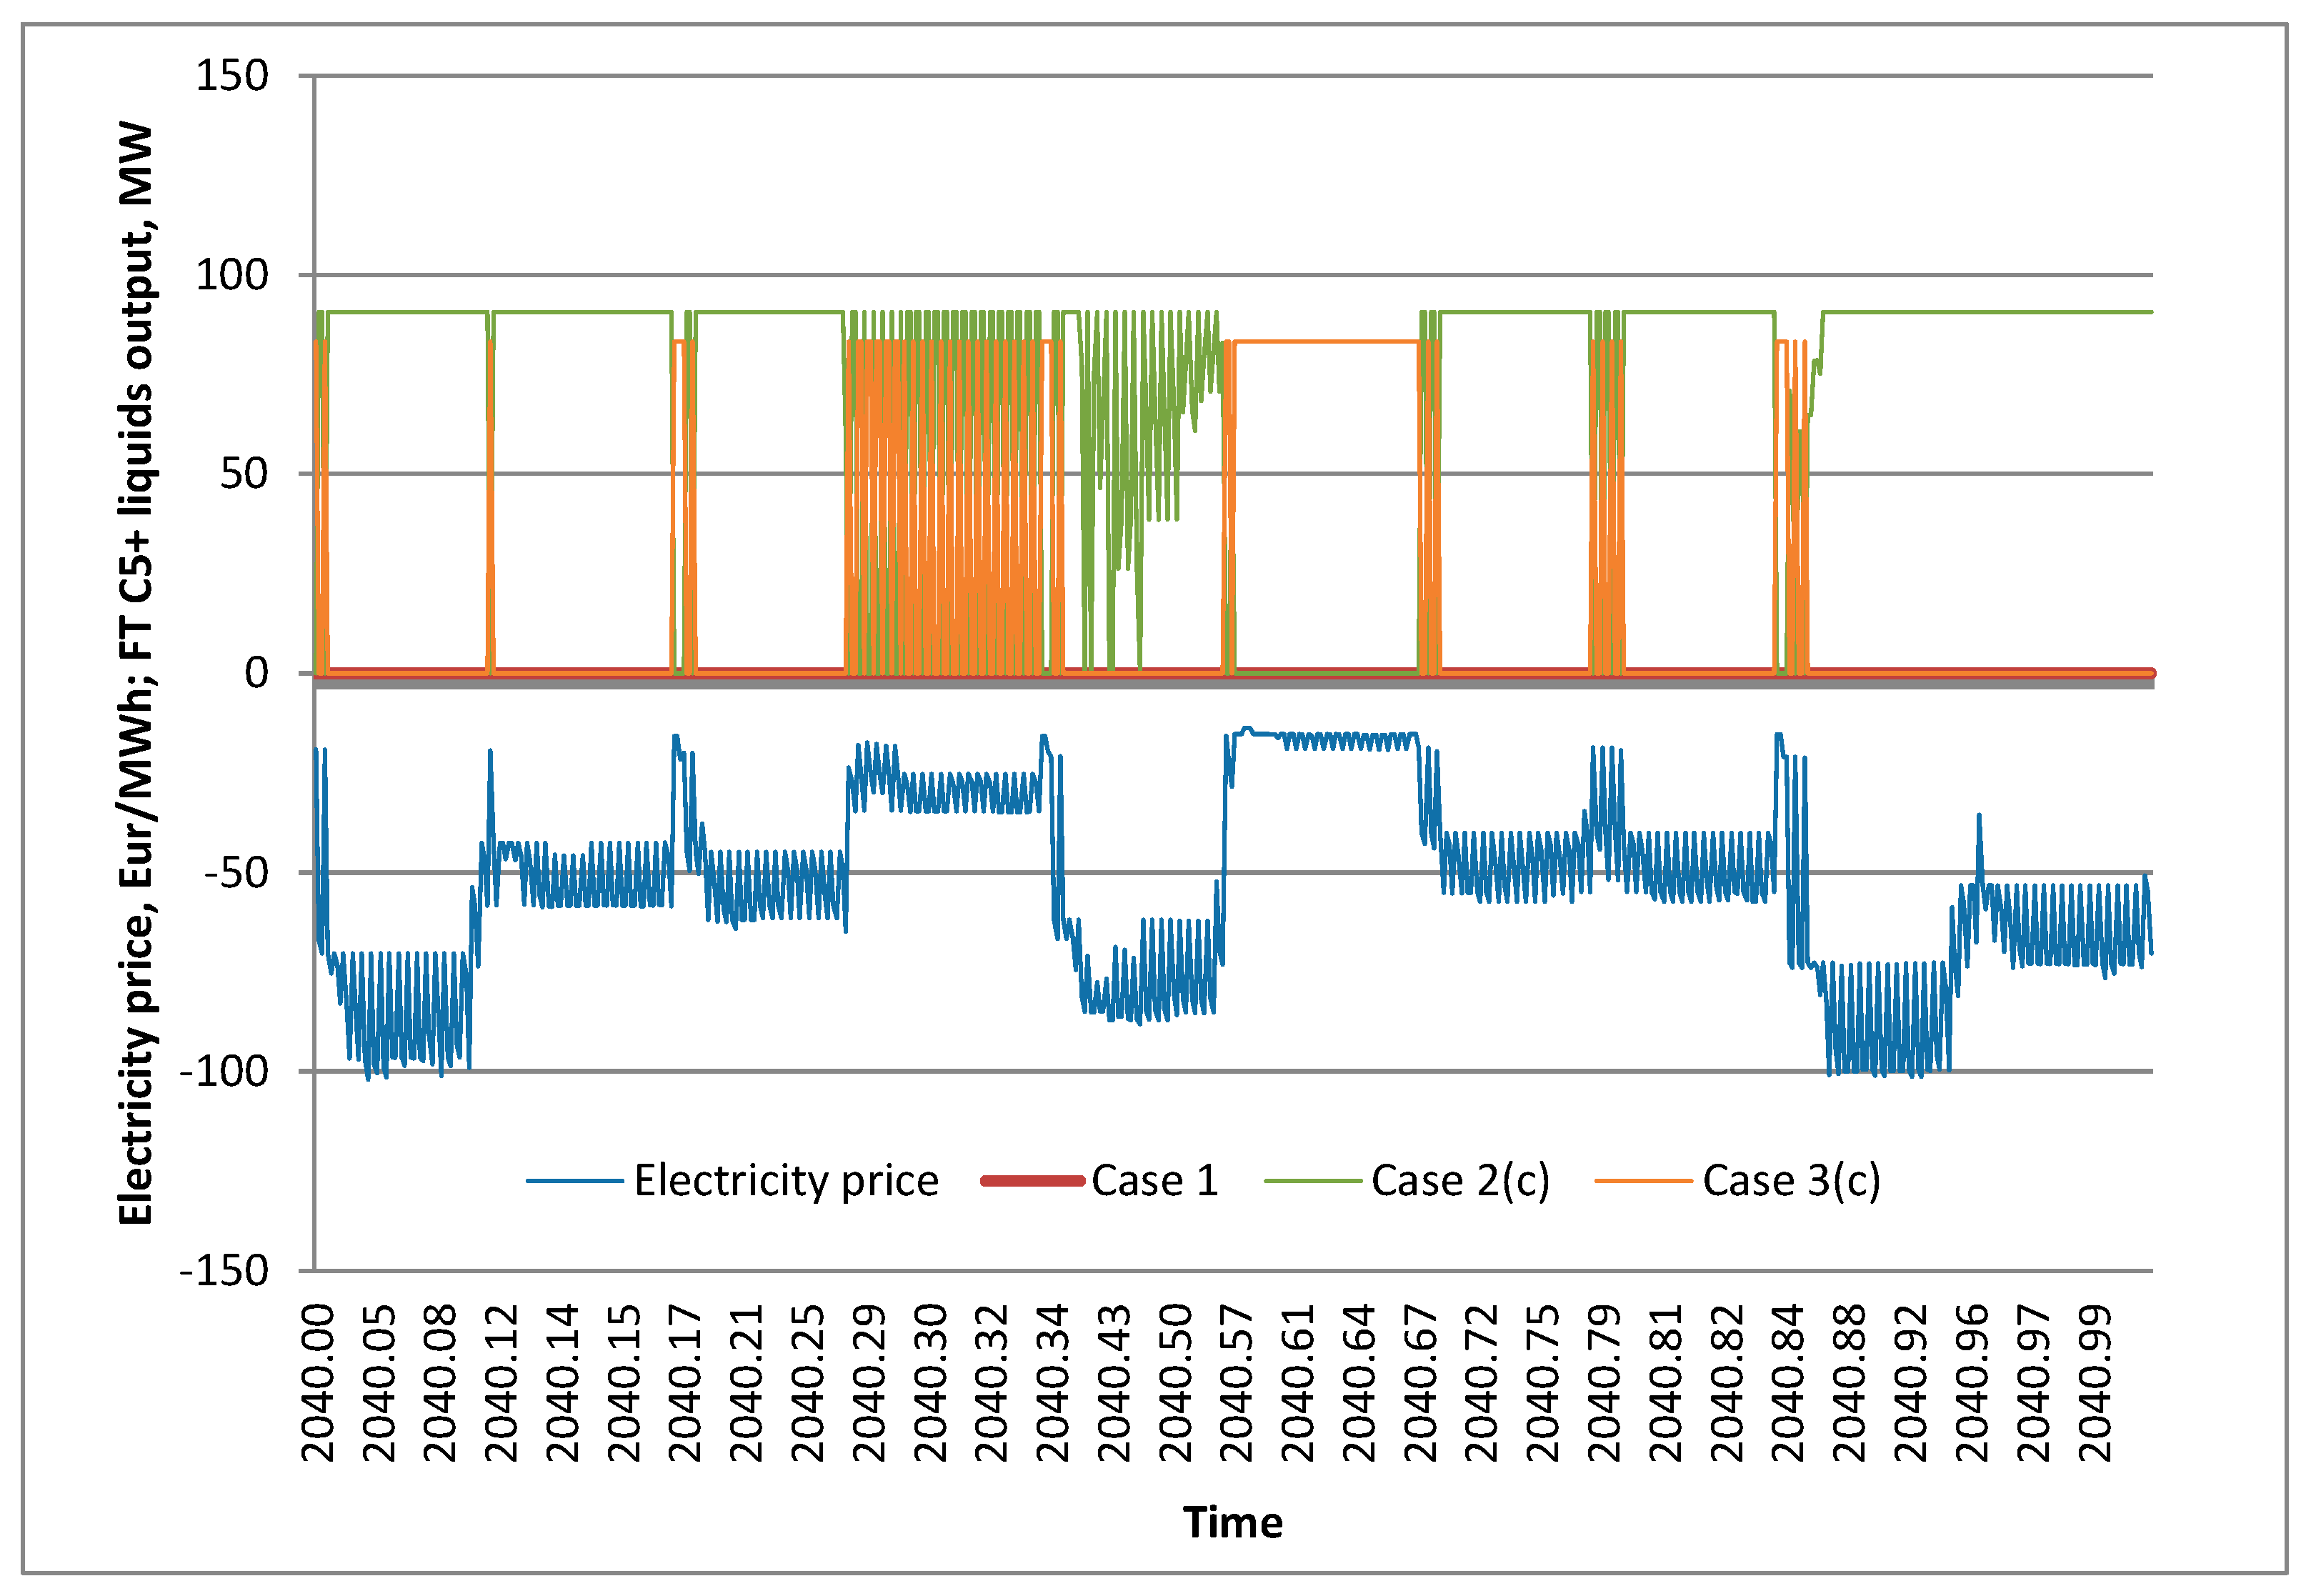
4.4. Operational Regimes of the FLEXCHX Technology

The numerical values characterizing the operating modes of FLEXCHX technology vary slightly in the scenarios considered, but the principle of operation remains the same. For this reason, it is sufficient to examine the work of the technology in the case of one or two scenarios and not to go into the details of other scenarios.
Table 8 shows the annual energy and product balances of FLEXCHX technology for Scenario-1_7 and Table 9 for Scenario-3_10. One feature that is common to all scenarios is seen from the data presented: over the years, the most economical mode of operation of FLEXCHX technology corresponding to Case 2 and the operating mode corresponding to Case 3 is only activated when electricity prices in the market are low.
The operation of FLEXCHX technology (biomass and electricity consumption and product output) during the year in the case of Scenario-1_7 is presented in Figure 12. The dependence of the technology operation on the change in electricity prices is shown in Figure 13. The data presented in these figures need to be considered in parallel. From the data, it can be seen that, at low electricity prices, the technology operation switches to the operating mode corresponding to Case 3. This means that the electrolysis plant is put into operation, and less biomass is used for the same product output. When the price of electricity remains consistently low (e.g., the time interval between 2040.5 and 2040.6), the electrolysis unit operates continuously. However, this situation is not common. For this reason, in the example of the Kaunas DH system, it is not economically reasonable to implement FLEXCHX technology, which is focused on the constant mode of biomass use, because an expensive electrolysis unit will often remain unused. The design for constant product output is a more appropriate option. Habermeyer et al. published similar findings, confirming that, despite better efficiency, regular biomass to liquid FT process is more economically attractive compared to hydrogen exchanged or hybrid operation mode [58].

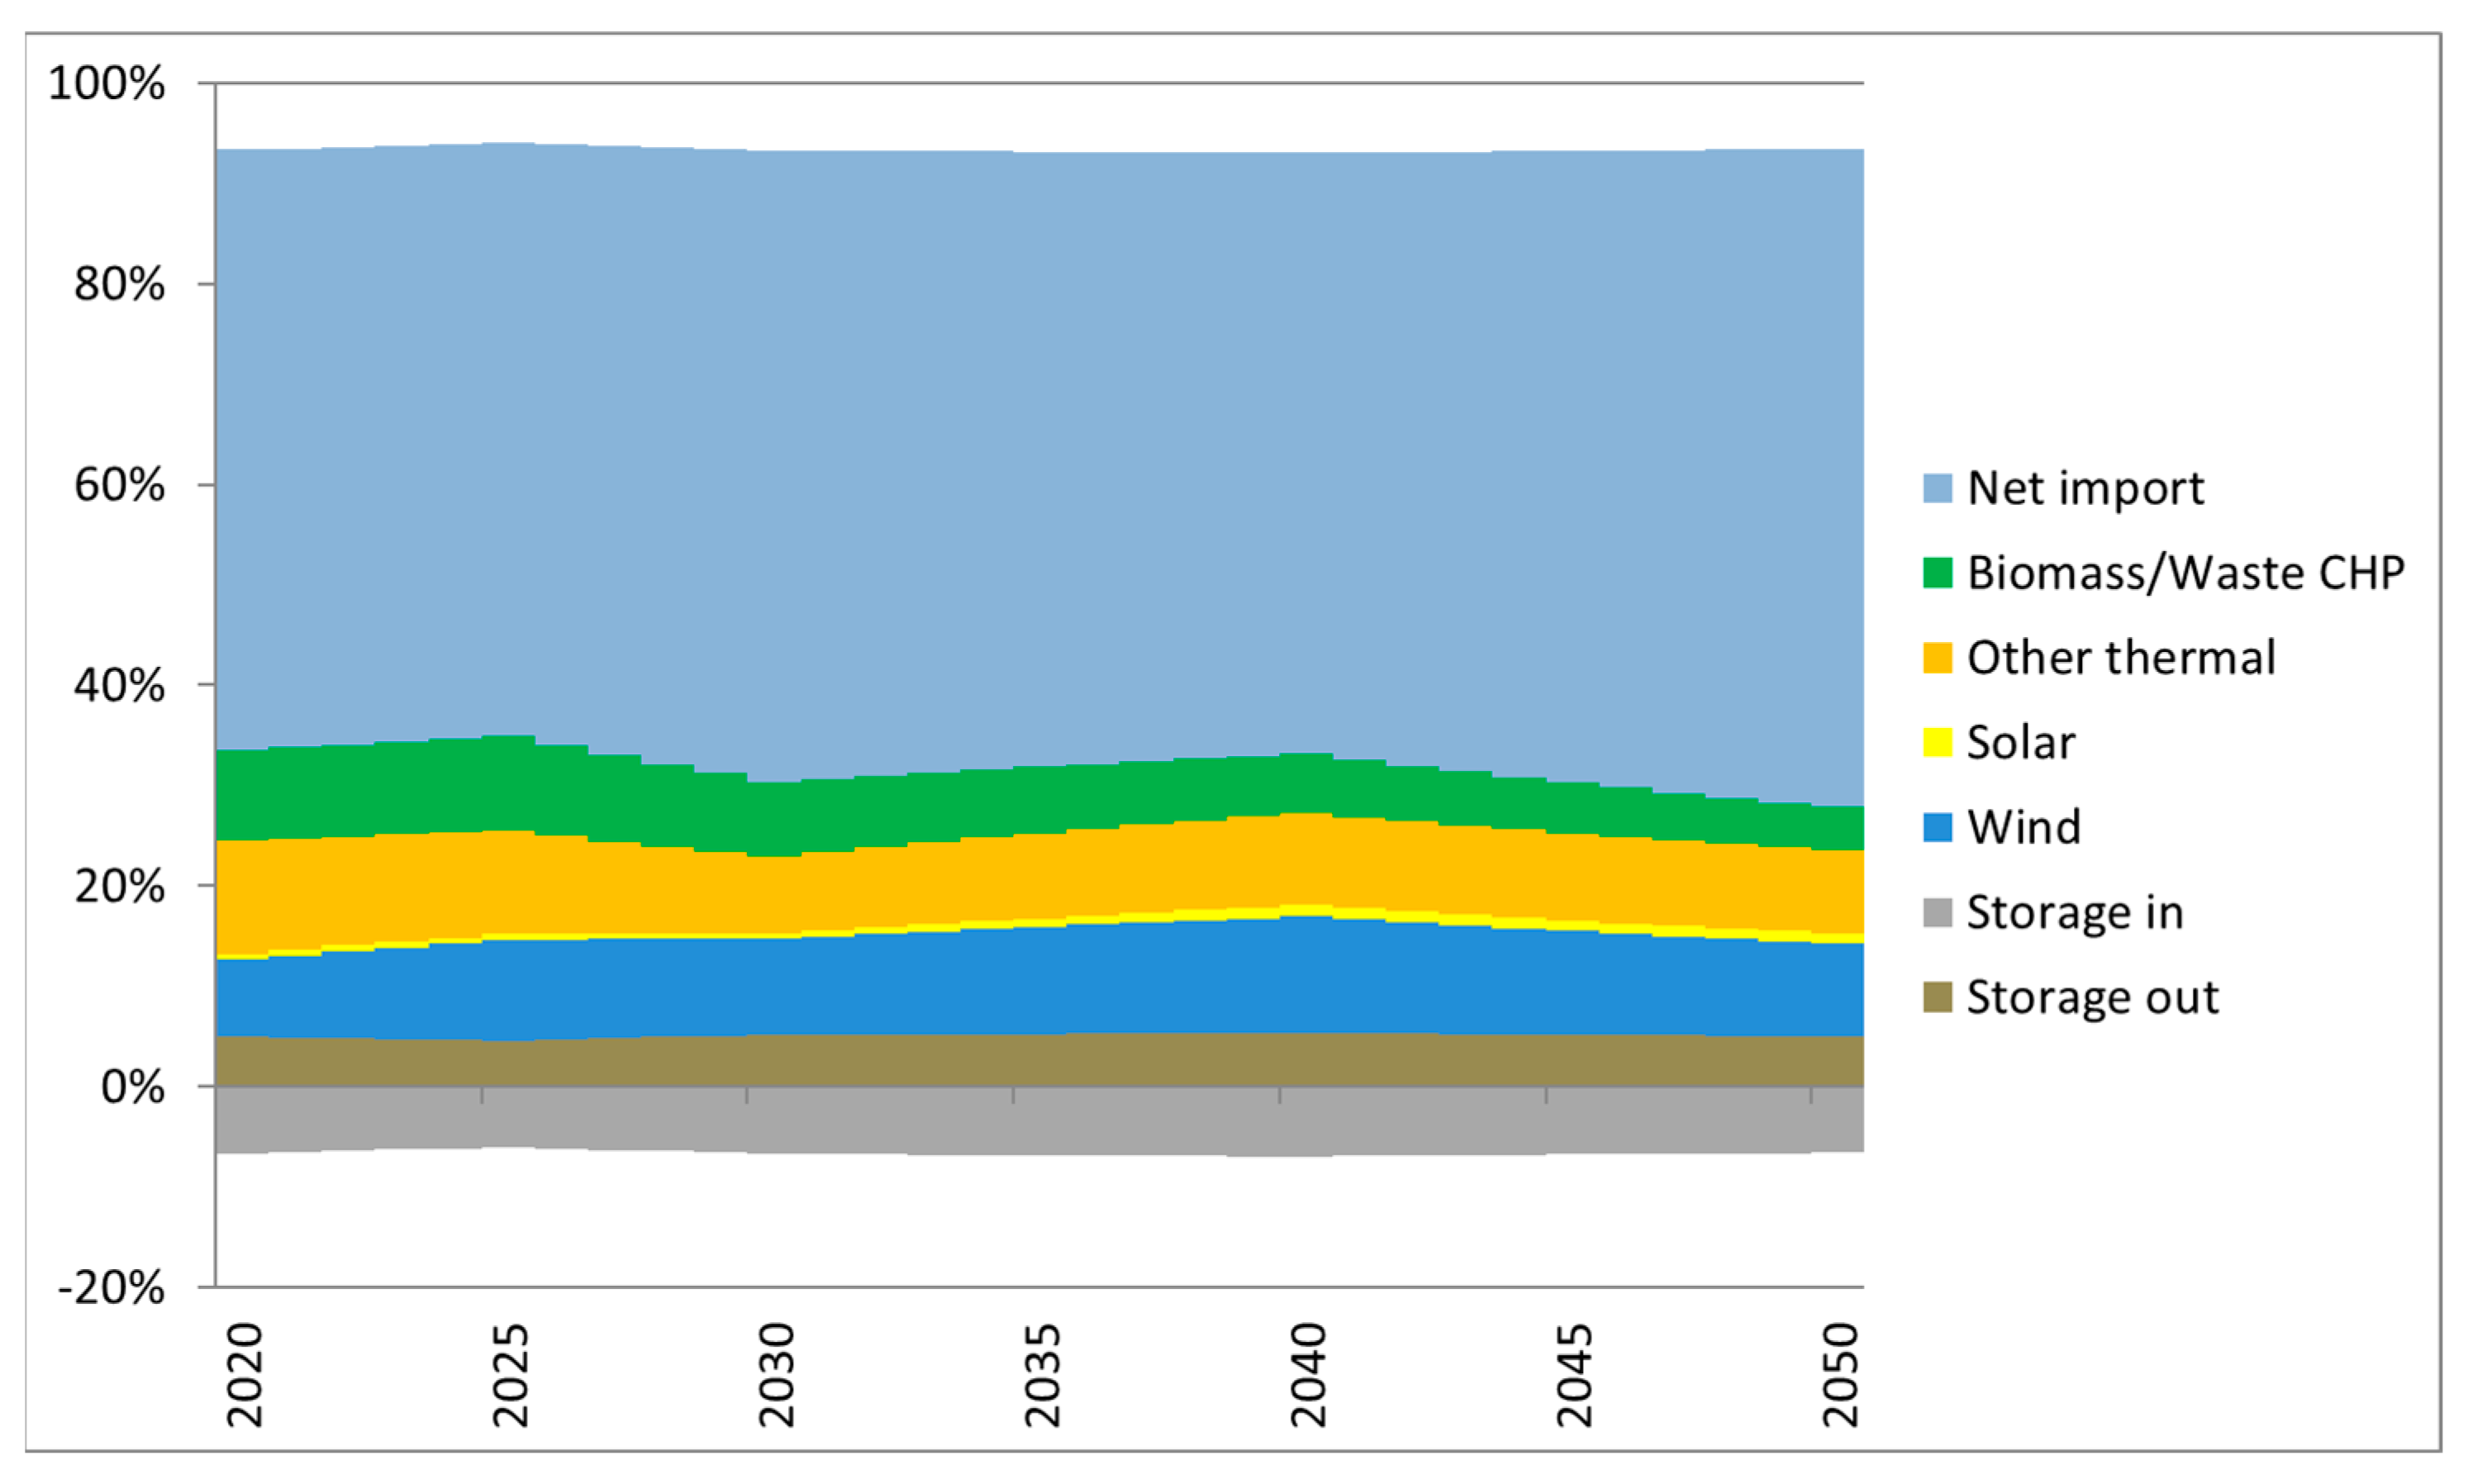
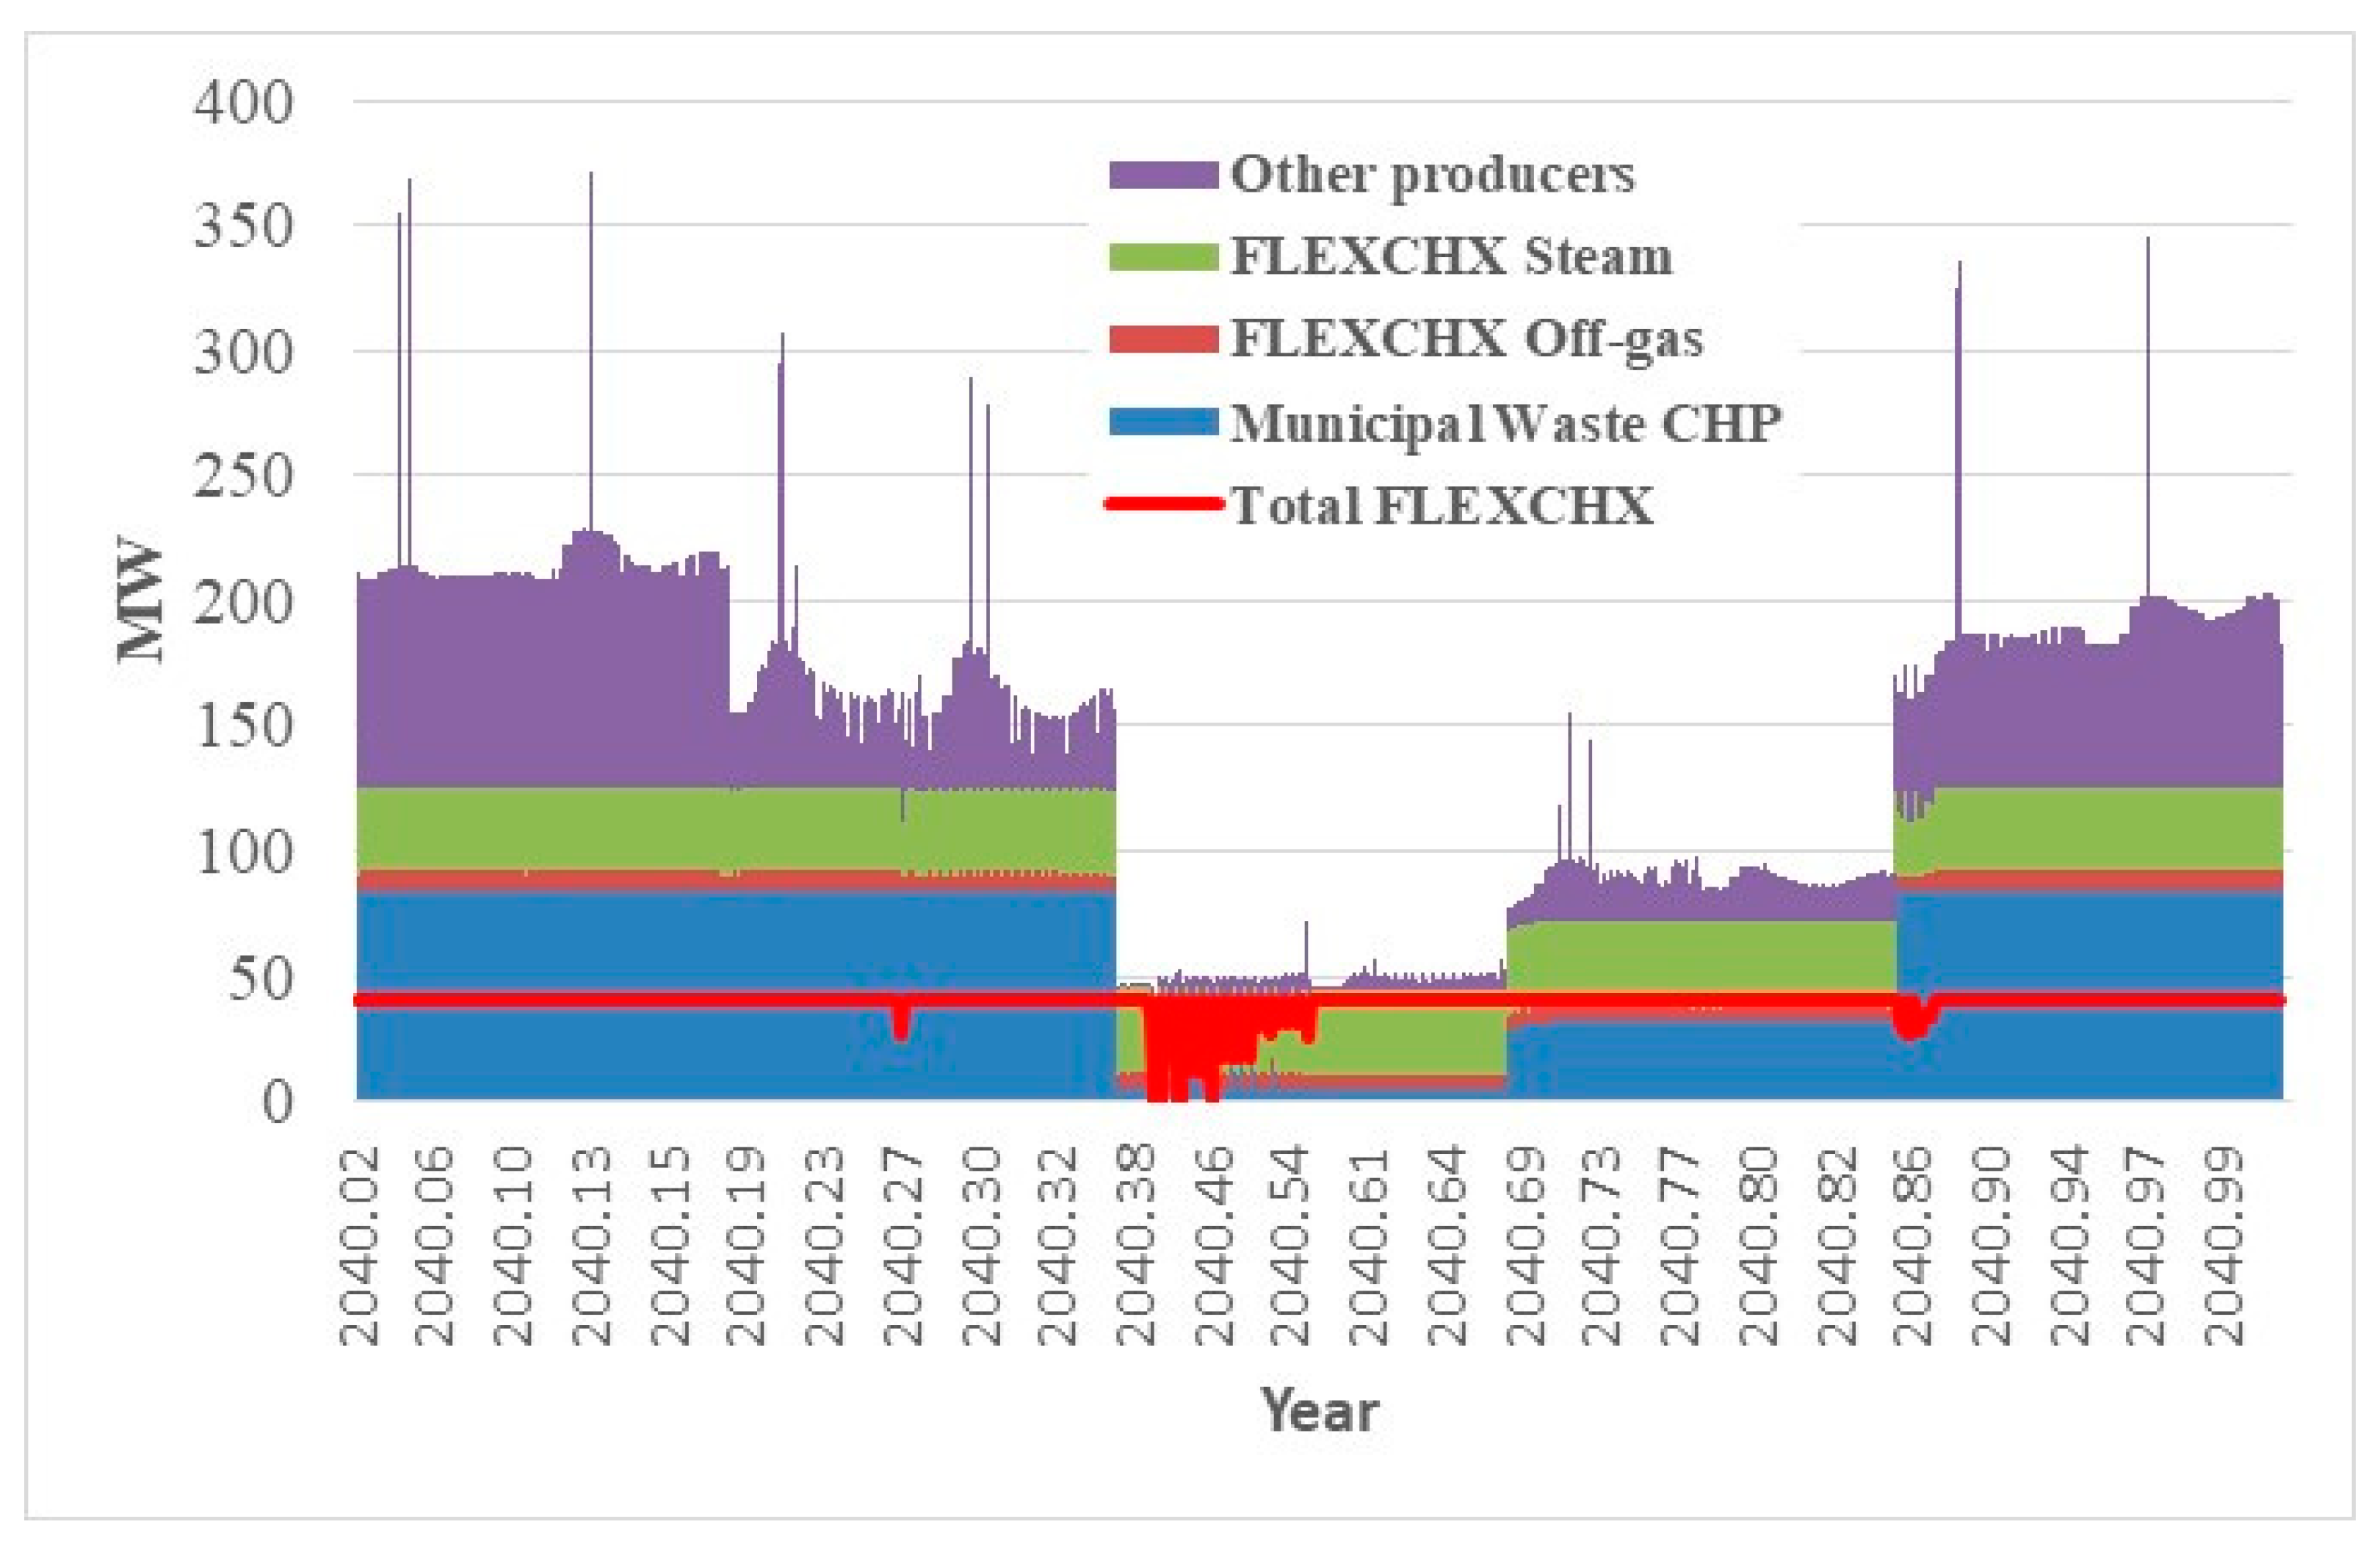
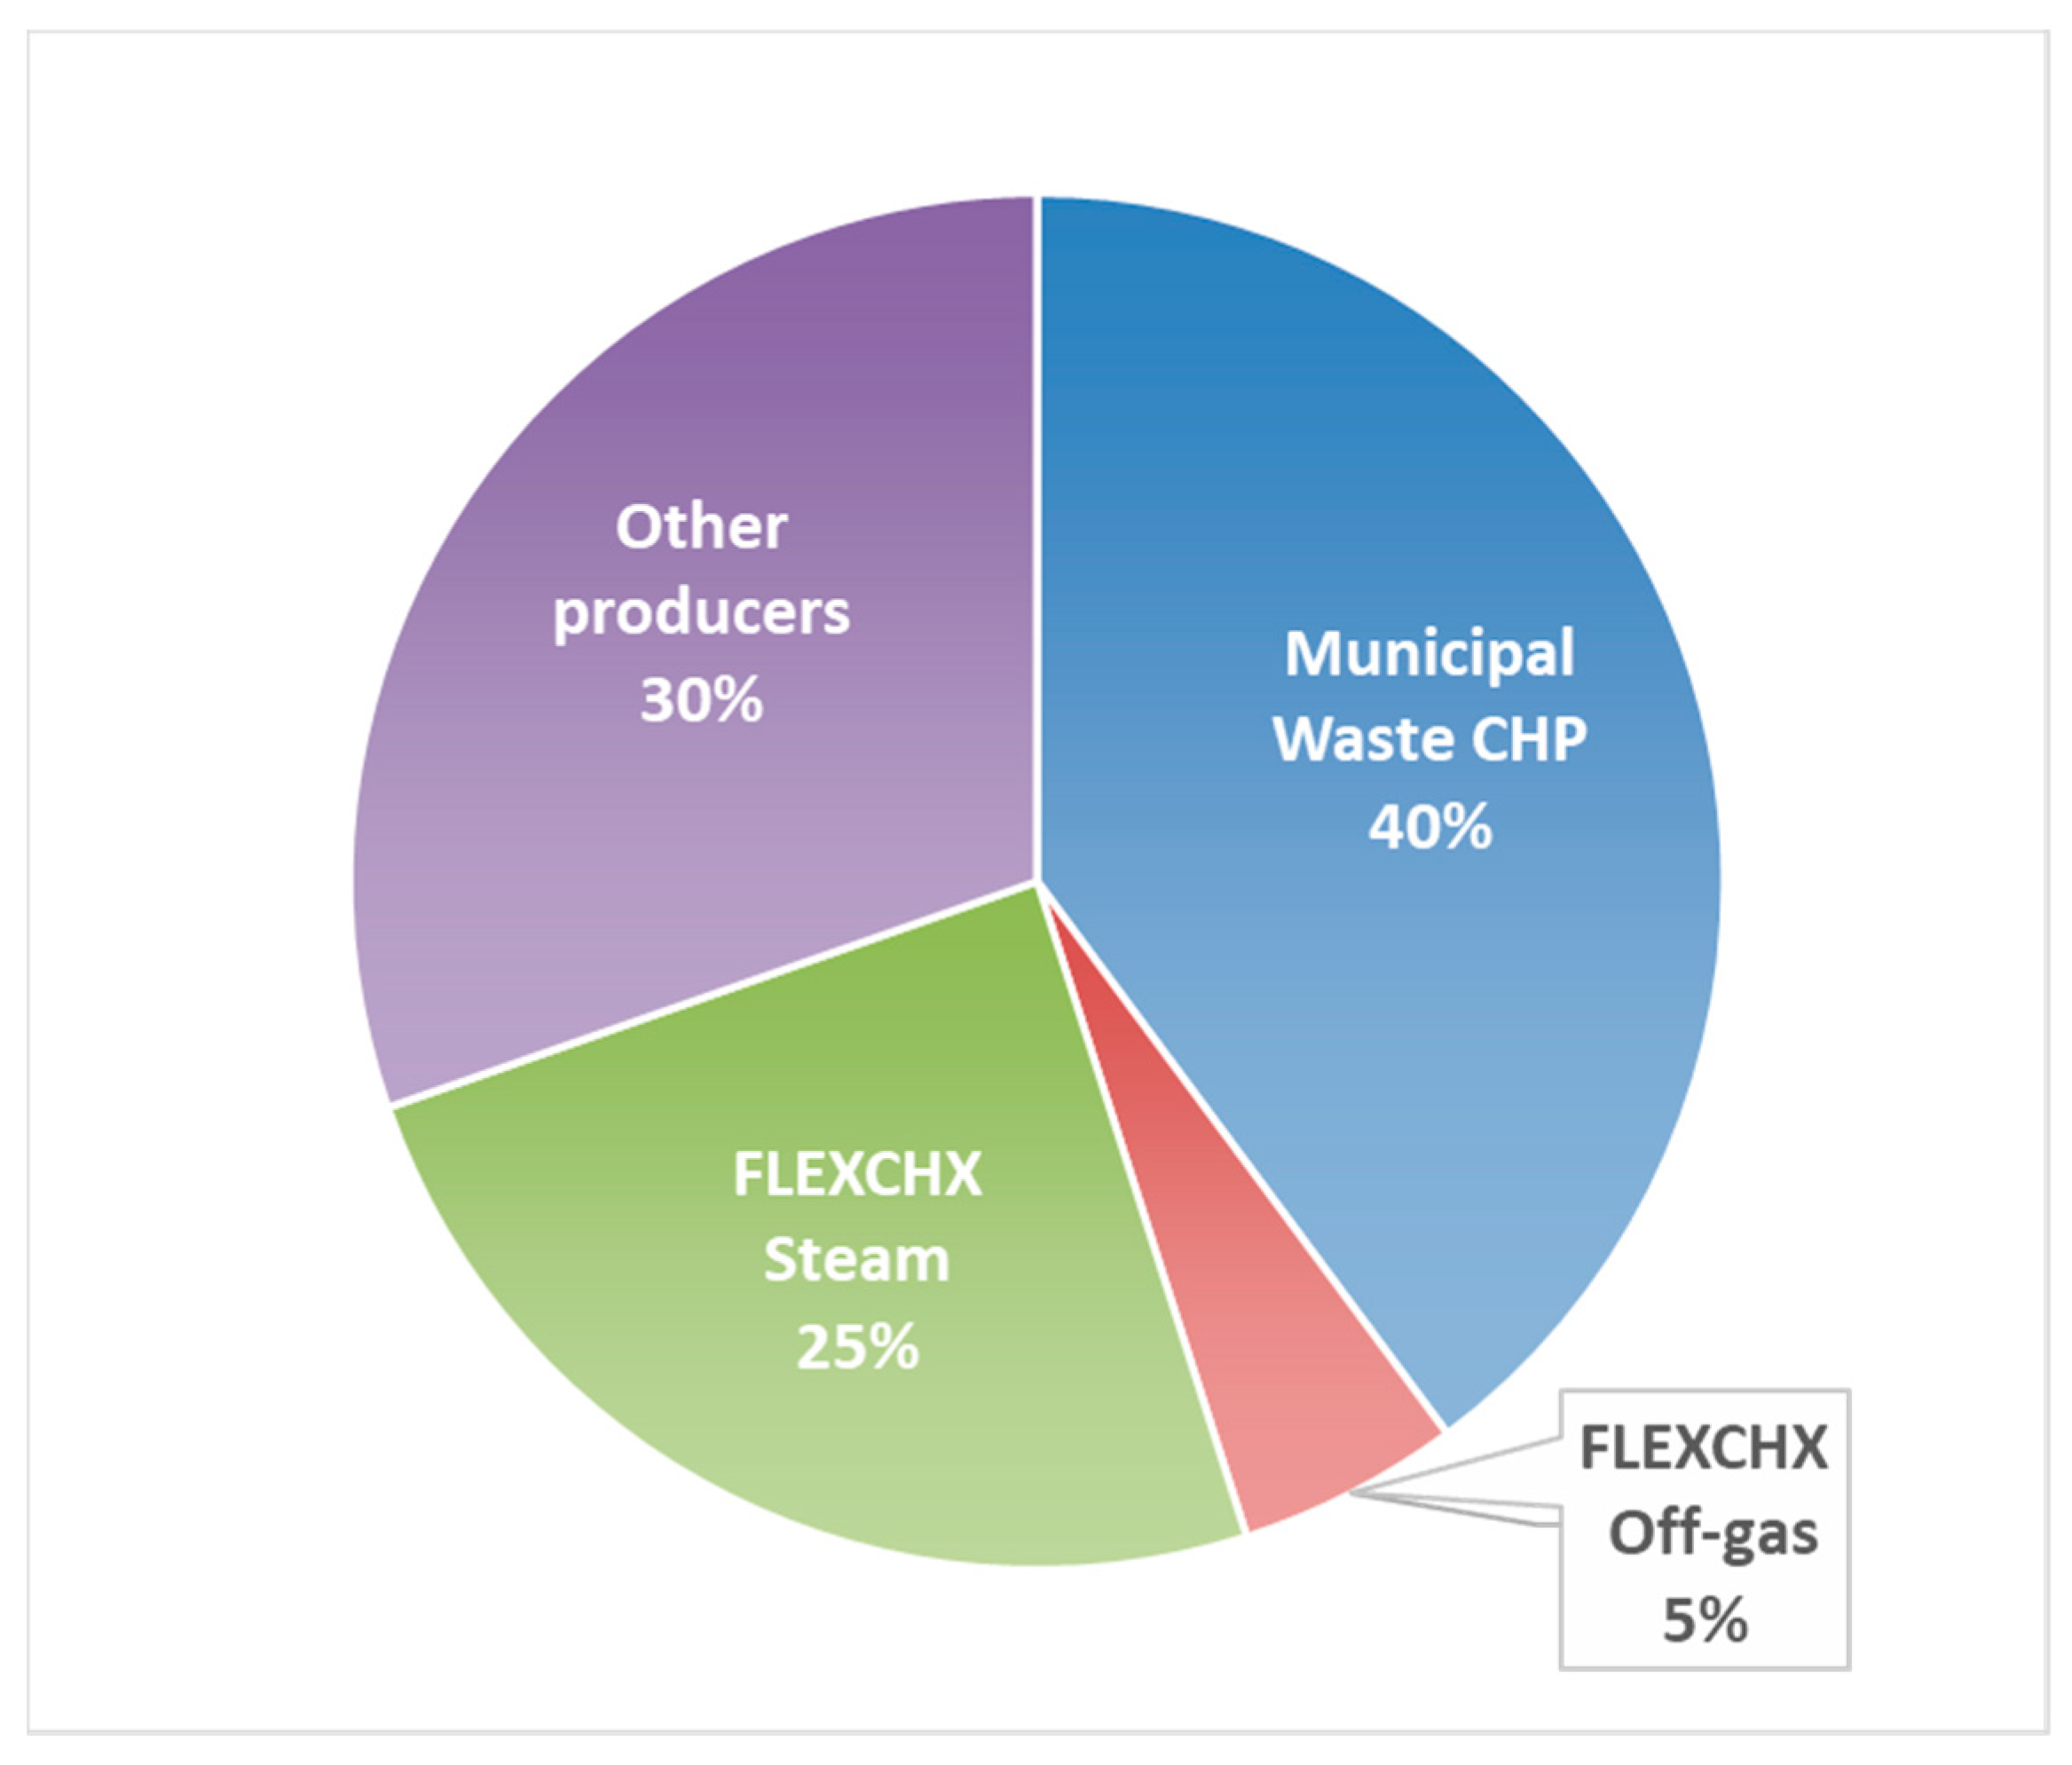
4.5. Heat Production in Kaunas District Heating System and FLEXCHX Contribution

The heat production regime in the district heating system of Kaunas in 2040 in the case of Scenario-1_7 is shown in Figure 14. The structure of heat produced is represented in Figure 15.
In 2040, about 1095 GWh of heat energy will be produced in the DH system of the Kaunas DH system. The largest producer will be the Kaunas cogeneration plant using municipal waste, which will supply about 440 GWh of heat to the grid. The second in terms of heat production could be the FLEXCHX unit. The amount of heat produced from FLEXCHX by-products would reach 328 GWh. This would account for almost 30% of all energy supplied to the DH system. Most of this heat, or 270 GWh, would come from the steam supply. This would account for 82% of the heat produced from FLEXCHX by-products. The volume of energy produced by other heat producers would be in the range of 4–8%. This entails that FLEXCHX, as a heat producer, would satisfy almost the entire base load of the Kaunas DH system.

5. Conclusions

This work looks at the economic viability of the novel concept of using waste heat from the flexible Fischer–Tropsch (FT) process (FLEXCHX) in the existing district heating network. To assess FLEXCHX ability to compete with existing biomass and waste (booth heat only boilers and CHPs), two MESSAGE models were used: the Lithuanian power system model for electricity price estimation was soft linked to high definition Kaunas DH system used to assess if different options of FLEXCHX operation could outcompete existing heat generation sources available in the Kaunas DH. The techno-economic data of the FLEXCHX technology were estimated using a process simulation conducted in Aspen Plus V10. The economic viability of FLEXCHX was evaluated by comparing the total operating costs of the Kaunas DH system (including investment costs, fuel expenses, and variable and fixed O&M costs) between different FLEXCHX scenarios (Cases 1–3) and a reference case where FLEXCHX was not available. The economic attractiveness was expressed in terms of total savings, if any, over the duration of the study period between the different cases where FLEXCHX was available and the system cost without FLEXCHX. Based on the assumptions and data discussed above, the following conclusions can be made:
  • FLEXCHX technology can be successfully integrated into existing district heating systems in Northern Europe and compete successfully with other district heat sources including biomass heat-only boilers and CHPs, as well as municipal waste incineration CHPs. Based on our results from the Kaunas DH system example, the installed capacity of FLEXCHX may be limited by the base load heat demand during off-peak season and is sensitive to the available market and the price of FT C5+ liquids: only at prices above 100 EUR/MWh, FLEXCHX is economically viable.
  • FLEXCHX technology, if incorporated into the DH system, could increase the overall efficiency of biomass utilization compared to conventional biomass boiler or CHP systems and create opportunities to participate in three energy markets: heat, electricity, and newly forming second-generation biofuel markets.
  • In the Kaunas DH system example, the maximum installed capacity of FLEXCHX technology is estimated to be around 100 MW if high FT C5+ liquid prices prevail (ranging from 111.5 EUR/MWh to 132.2 EUR/MWh). In this case, by-products from the FLEXCHX technology could provide about 25% of the total heat supplied to the Kaunas DH system.
  • Comparing the residential and industrial heat demand, the largest cost savings in the Kaunas case study are observed in the case of scenario 7 (FLEXCHX technology is designed for constant output of the main product when the by-products of the technology are used by the industrial consumer). In this case, up to EUR 200 mil. could be saved during the study period (compared to regular biomass use case).
  • The main operational mode of the FLEXCHX technology is operating according to Case 2 mode (biomass with O2/steam gasification and recycling of FT tail gas); however, in periods when the electricity market price stays low, Case 3 (biomass gasification boosted by electrolysis) becomes more attractive.
  • The use of biomass gasification supported by hydrogen (Case 3) was marginal in the Lithuanian Kaunas DH system case due to the lack of prolonged periods of low electricity market price. However, in the situation when the share of intermittent renewable generation would rise faster than projected in this work, an additional benefit of surplus electricity could be utilized for increasing the efficiency of the FLEXCHX process. Based on the conditions of the Kaunas DH system and Lithuanian power market forecasts, it is not expedient to implement FLEXCHX technology, which is focused on the constant mode of biomass use. Although the maximum amount of FT C5+ is obtained for the biomass used in this mode of operation, it remains uneconomical because the high volatility of electricity market prices results in low utilization of the electrolysis unit, thus increasing the overall production costs.

Author Contributions

Conceptualization, A.G., E.K. and M.K.; Methodology, A.G.; Software, A.G. and E.N.; Validation, A.G. and D.T.; Formal analysis, A.G. and E.N.; Investigation, A.G. and D.T.; Resources, E.K.; Data curation, A.G., F.H. and E.N.; Writing—original draft, A.G. and D.T.; Writing—review & editing, A.G., E.K., M.K., F.H., V.L., N.S., R.S., E.N. and D.T.; Visualization, A.G. and D.T.; Supervision, A.G. and N.S.; Project administration, E.K. and N.S.; Funding acquisition, E.K. and N.S. All authors have read and agreed to the published version of the manuscript.

Funding

This research has received funding from the European Union’s Horizon 2020 research and innovation program under Grant Agreement No. 763919.

Data Availability Statement

Data are contained within the article.

Conflicts of Interest

Author Esa Kurkela and Minna Kurkela are employed by VTT Technical Research Centre of Finland Ltd. The remaining authors declare that the research was conducted in the absence of any commercial or financial relationships that could be construed as a potential conflict of interest.

Abbreviations

EUEuropean Union
RED III Revised Renewable Energy directive (EU/2023/2413) entered into force 20 November 2023
REPowerEU Package of European Commission proposals to end reliance on fossil fuels before 2030 in response to the 2022 Russian invasion of Ukraine
ReFuelEU AviationEU regulation aiming to increase the use of sustainable aviation fuels
ReFuelEU MaritimeEU regulation aiming to increase the share of renewable and low-carbon fuels in the fuel mix of international shipping
FT Fischer–Tropsch
FLEXCHX the flexible Fischer–Tropsch
DH District heating
CHP Combined heat and power plant
GHG greenhouse gas
NECP National Energy and Climate Plan
RES Renewable energy source
UN United nations
FT C5+ Mixture of liquid and solid-like hydrocarbons obtained by FT process
MESSAGE Model for Energy Supply System Alternatives and their General Environmental Impacts
MWh Megawatt hour
O&M Operation and maintenance cost (fixed and/or variable)
CO2 Carbon dioxide
CO2 eqv Carbon dioxide equivalent (used for measuring GHG emissions)

Appendix A

Table A1. Techno-economic parameters of heat-producing technology groups in Kaunas district heating system.
Technology TypeTechnology GroupPlant FactorOperation TimeLifetimeInvestment CostFixed CostConstruction TimeEfficiencyVariable Costs
[years][EUR/kW][EUR/kW][years]Electricity in Condensing ModeElectricity in CHP ModeHeat [EUR/kWyr]
CHP unitsKaunas CHP plant, PT-6010.912 30140081.3030.2580.2110.6857.209
Kaunas CHP plant, PT-1000.3100.2840.525
Petrasiunai PP10.781734261.1020.2190.2190.58126.499
Biomass CHP10.9203240278.5230.1720.1670.83281.470
Municipal waste CHP10.9306250269.68 259.5630.2390.2320.754206.780
Gas boilersPetrasiunai PP gas boilers10.680.0010.0011 0.920.00876
Silkas plant gas boiler10.920106.11 0.9111.598
Gas boilers10.92027.85.81 0.93 110.705
Gas boilers in Petrasiunai PP and Kaunas CHP plant0.8450.9109.96.11 0.911.116 2
New Pergale plant gas boilers10.92029.55.71 0.928.195
A.Juozapaviciaus pr. 23a plant boilers10.92034.80.3481 0.90.00876
Biomass boilers10.915289.615.061 1.03 321.725 4
Solar collectors1130581.401 14.993
Heat pumpsAbsorption heat pump10.9425114832.965 2.0950
Conventional heat pump10.9425136731.625 4.680
EconomizersCondensing economizer10.92010.70.051 1.080.00876
Economizers in the Inkaras plant10.91532.40.331 1.250.00876
Economizers in Silkas plant10.91532.80.331 1.230.00616
Economizers in Pergale plant10.92010.50.051 1.10.00876
Economizers in Petrasiunai plant10.920106.21.061 1.20.00964
1 Efficiency for Pergale plant boilers No1-3 2*SCHNEIDER and BOSCH UT-M64 is 0.88 and 0.91 for Pergale plant boiler No4 DKVR-20-13-250. 2 Variable costs for Petrasiunai PP PTVM-100 boiler No1 11.11644; for Petrasiunai PP PTVM-100 boiler No2 11.1252; for Kaunas CHP PP PTVM100 boilers No1-2 11.13396; and for Kaunas CHP PP PTVM100 boilers No3-4 11.14272. 3 Efficiency for Silkas plant boilers is 0.93; for Petrasiunai PP boilers 0.858; for Inkaras plant boilers 0.824. 4 Variable costs for Inkaras plant boilers is 21.72; for Petrasiunai PP boilers 21.57; for Silkas plant boilers 21.82; for Ekopartneris plant boilers 21.46; for Idex Taika plant boilers 21.81; and for Aldec General plant boilers 21.9.
Table A2. Recalculation of FLEXCHX cost from ASPEN to cost for Kaunas district heating system analysis model. The example is based on Case 3c (for 27.11 MW unit).
CostsCase 3c with Electrolyzer Costs IncludedCase 3c with Electrolyzer Cost ExcludedCost CATEGORY Assumed
Cost Fixed O&M CostVariable O&M CostFixed O&M CostVariable O&M Cost
Investment cost, EUR 114,938,586 88,656,886
Direct production costs
Operating labor [OL]1,064,82610,64,82601,064,8260Fix. cost
Operating supervision159,724159,7240159,7240Fix. cost
Maintenance labor1,034,4471,034,4470797,9120Fix. cost
Maintenance material1,034,4471,034,4470797,9120Fix. cost
Operating supplies310,334310,3340239,3740Fix. cost
Laboratory charges212,965212,9650212,9650Fix. cost
Raw materials and utilities35,248,1490763,7660763,766Var. cost
Revenue from by-products−6,154,6120000N/A
Indirect production costs
Insurances and taxes2,068,8952,068,89501,595,8240Fix. cost
Plant overhead costs1,355,3981,355,398.301,213,4770Fix. cost
General expenses
Administrative costs338,850338,849.60303,3690Fix. cost
Annuity10,569,0210.0000N/A
Interim result
Distribution and selling costs3,149,49603,149,49602,908,749Var. cost
Research and development costs2,099,6642,099,66401,939,166.40Fix. cost
Total 9,679,5513,913,2638,324,5493,672,516
Output capacity, MW 51.8 51.8
Product output, MWh 419,805 419,805
FLEXCHX (Cost used in Kaunas DH system model)
Investment costEUR/kW2218.0 1710.9
Fixed O&M costEUR/kW186.8 160.6
Variable O&M costEUR/MWh9.3 8.7
EUR/kW/y81.7 76.6
Investment cost with electrolyzerEUR114,938,586
Investment cost w/o electrolyzerEUR88,656,886
The investment cost for the electrolyzerEUR26,281,700.0
Electricity input to the electrolyzerMW47.3
Operation time within a yearHours8100.0
ELECTROLYZER (Cost used in Kaunas DH system model)
Investment costEUR/kW555.6
Fixed O&M costEUR/kW28.65
Variable costEUR/MWh0.63
EUR/kWyr5.50

References

  1. NOAA National Centers for Environmental Information. Monthly Global Climate Report for 2023; NOAA: Washington, DC, USA, 2024. [Google Scholar]
  2. European Environment Agency. Global Average Air Temperature Anomalies. Available online: https://www.eea.europa.eu/data-and-maps/daviz/global-average-air-temperature-anomalies-6#tab-dashboard-01 (accessed on 8 August 2024).
  3. Cook, J.; Nuccitelli, D.; Green, S.A.; Richardson, M.; Winkler, B.; Painting, R.; Way, R.; Jacobs, P.; Skuce, A. Quantifying the consensus on anthropogenic global warming in the scientific literature. Environ. Res. Lett. 2013, 2, 2–7. [Google Scholar] [CrossRef]
  4. Naomi, O. The Scientific Consensus on Climate Change. Science 2004, 306, 1686. [Google Scholar]
  5. IPCC. Summary for Policymakers. In Climate Change 2023: Synthesis Report. Contribution of Working Groups I, II and III to the Sixth Assessment Report of the Intergovernmental Panel on Climate Change; IPCC: Geneva, Switzerland, 2023. [Google Scholar]
  6. UN. Paris Agreement. STATUS. Available online: https://treaties.un.org/pages/ViewDetails.aspx?src=TREATY&mtdsg_no=XXVII-7-d&chapter=27&clang=_en (accessed on 8 August 2024).
  7. UN. Paris Agreement; UN: Paris, France, 2015. [Google Scholar]
  8. Latvia and the European Commission. Intended Nationally Determined Contribution of the EU and Its Member States; EU: Ryga, Latvia, 2015. [Google Scholar]
  9. IPCC. 2006 IPCC Guidelines for National Greenhouse Gas Inventories; UN: Geneva, Switzerland, 2006. [Google Scholar]
  10. European Commission. Communication from the Commission to the European Parliament, the European Council, the Council, the European Economic and Social Committee and the Committee of the Regions, The European Green Deal, Brussels, 11.12.2019 COM(2019) 640 Final; European Commission: Brussels, Belgium, 2019. [Google Scholar]
  11. European Commission. Regulation (EU) 2021/1119 of the European Parliament and of the Council of 30 June 2021 Establishing the Framework for Achieving Climate Neutrality and Amending Regulations (EC) No 401/2009 and (EU) 2018/1999 (‘European Climate Law’). 2021. Available online: https://eur-lex.europa.eu/eli/reg/2021/1119/oj (accessed on 8 September 2024).
  12. European Commission. National Energy and Climate Plans. 2023. Available online: https://commission.europa.eu/energy-climate-change-environment/implementation-eu-countries/energy-and-climate-governance-and-reporting/national-energy-and-climate-plans_en (accessed on 8 September 2024).
  13. European Commission. Communication from the Commission to the European Parliament, the European Council, the Council, the European Economic and Social Committee and the Committee of the Regions, REPowerEU Plan, COM(2022) 230 Final; European Commission: Brussels, Belgium, 2022. [Google Scholar]
  14. European Parliament and the Council. Directive (EU) 2023/2413 of the European Parliament and of the Council, Amending Directive (EU) 2018/2001, Regulation (EU) 2018/1999 and Directive 98/70/EC as Regards the Promotion of Energy from Renewable Sources, and Repealing Council Directive (EU) 201; European Commission: Brussels, Belgium, 2023. [Google Scholar]
  15. European Commission. ReFuelEU Aviation. Available online: https://ec.europa.eu/commission/presscorner/detail/en/ip_23_2389 (accessed on 8 September 2024).
  16. Council of the European Union. FuelEU Maritime Initiative: Council Adopts New Law to Decarbonise the Maritime Sector. Available online: https://www.consilium.europa.eu/en/press/press-releases/2023/07/25/fueleu-maritime-initiative-council-adopts-new-law-to-decarbonise-the-maritime-sector/ (accessed on 8 September 2024).
  17. IEA. CO2 Emissions in 2022; IEA: Paris, France, 2023. [Google Scholar]
  18. Eurostat, Greenhouse Gas Emissions by Source Sector. 2024. Available online: https://ec.europa.eu/eurostat/databrowser/view/env_air_gge__custom_12545162/default/table?lang=en (accessed on 25 July 2024).
  19. WEForum. The European Union Has Cut Greenhouse Gas Emissions in Every Sector—Except This One; WEForum: Cologny, Switzerland, 2022. [Google Scholar]
  20. European Commission. A European Strategy for Low-Emission Mobility; European Commission: Brussels, Belgium, 2016. [Google Scholar]
  21. European Commission. Communication from the Commission to the European Parliament, the Council, the European Economic and Social Committee and the Committee of the Regions, Powering a Climate-Neutral Economy: An EU Strategy for Energy System Integration (COM(2020) 299f); European Commission: Brussels, Belgium, 2023. [Google Scholar]
  22. UN. Transforming Our World: The 2030 Agenda for Sustainable Development; UN: Addis Ababa, Ethiopia, 2015. [Google Scholar]
  23. Samavati, M.; Santarelli, M.; Martin, A.; Nemanova, V. Production of Synthetic Fischer–Tropsch Diesel from Renewables: Thermoeconomic and Environmental Analysis. Energy Fuels 2017, 32, 1744–1753. [Google Scholar] [CrossRef]
  24. Peduzzi, E.; Boissonnet, G.; Haarlemmer, G.; Maréchal, F. Thermo-economic analysis and multi-objective optimisation of lignocellulosic biomass conversion to Fischer–Tropsch fuels. Sustain. Energy Fuels 2018, 2, 1069–1084. [Google Scholar] [CrossRef]
  25. Stefano, P.; Francesco, P.; Baratieri, M. Energy and exergy analysis of different biomass gasification coupled to Fischer-Tropsch synthesis configurations. Energy 2022, 249, 123642. [Google Scholar]
  26. Köfinger, M.; Schmidt, R.R.; Basciotti, D.; Terreros, O.; Baldvinsson, I.; Mayrhofer, J.; Moser, S.; Tichler, R.; Pauli, H. Simulation based evaluation of large scale waste heat utilization in urban district heating networks: Optimized integration and operation of a seasonal storage. Energy 2018, 159, 1161–1174. [Google Scholar] [CrossRef]
  27. Ziemele, J.; Dace, E. An analytical framework for assessing the integration of the waste heat into a district heating system: Case of the city of Riga. Energy 2022, 254, 124285. [Google Scholar] [CrossRef]
  28. Fang, H.; Xia, J.; Zhu, K.; Su, Y.; Jiang, Y. Industrial waste heat utilization for low temperature district heating. Energy Policy 2013, 62, 236–246. [Google Scholar] [CrossRef]
  29. Pelda, J.; Stelter, F.; Holler, S. Potential of integrating industrial waste heat and solar thermal energy into district heating networks in Germany. Energy 2020, 203, 117812. [Google Scholar] [CrossRef]
  30. Böhm, H.; Moser, S.; Puschnigg, S.; Zauner, A. Power-to-hydrogen & district heating: Technology-based and infra-structure-oriented analysis of (future) sector coupling potentials. Int. J. Hydrogen Energy 2021, 46, 31938–31951. [Google Scholar]
  31. Golmohamadi, H.; Larsen, K.G.; Jensen, P.G.; Hasrat, I.R. Integration of flexibility potentials of district heating systems into electricity markets: A review. Renew. Sustain. Energy Rev. 2022, 159, 112200. [Google Scholar] [CrossRef]
  32. Egeskog, A.; Hansson, J.; Berndes, G.; Werner, S. Co-generation of biofuels for transportation and heat for district heating systems—An assessment of the national possibilities in the EU. Energy Policy 2009, 37, 5260–5272. [Google Scholar] [CrossRef]
  33. Ilic, D.D.; Dotzauer, E.; Trygg, L.; Broman, G. Integration of biofuel production into district heating–part I: An evaluation of biofuel production costs using four types of biofuel production plants as case studies. J. Clean. Prod. 2014, 69, 176–187. [Google Scholar] [CrossRef]
  34. Ljungstedt, H.; Pettersson, K.; Harvey, S. Evaluation of opportunities for heat integration of biomass-based Fischer–Tropsch crude production at Scandinavian kraft pulp and paper mill sites. Energy 2013, 62, 349–361. [Google Scholar] [CrossRef]
  35. Kurkela, E.; Kurkela, M.; Frilund, C.; Hiltunen, I.; Rollins, B.; Steele, A. Flexible Hybrid Process for Combined Production of Heat, Power and Renewable Feedstock for Refineries. Johns. Matthey Technol. Rev. 2021, 65, 333–345. [Google Scholar] [CrossRef]
  36. Kurkela, E.; Kurkela, M.; Hiltunen, I. Production of synthesis gas from biomass residues by staged fixed-bed gasifi-cation-results from pilot test campaigns. Chem. Eng. Trans. 2021, 86, 7–12. [Google Scholar]
  37. Skvorčinskienė, R.; Striūgas, N.; Galinis, A.; Lekavičius, V.; Kurkela, E.; Kurkela, M.; Lukoševičius, R.; Radinas, M.; Šermukšnienė, A. Renewable transport fuel production combined with cogeneration plant operation and waste heat re-covery in district heating system. Renew. Energy 2022, 189, 952–969. [Google Scholar] [CrossRef]
  38. Shimomura, M.; Keeley, A.R.; Matsumoto, K.; Tanaka, K.; Managi, S. Beyond the merit order effect: Impact of the rapid expansion of renewable energy on electricity market price. Renew. Sustain. Energy Rev. 2024, 189, 114037. [Google Scholar] [CrossRef]
  39. Pažėraitė, A.; Lekavičius, V.; Gatautis, R. District heating system as the infrastructure for competition among producers in the heat market. Renew. Sustain. Energy Rev. 2022, 169, 112888. [Google Scholar] [CrossRef]
  40. Gardumi, F.; Keppo, I.; Howells, M.; Pye, S.; Avgerinopoulos, G.; Lekavičius, V.; Galinis, A.; Martišauskas, L.; Fahl, U.; Korkmaz, P.; et al. Carrying out a multi-model integrated assessment of European energy transition pathways: Challenges and benefits. Energy 2022, 258, 124329. [Google Scholar] [CrossRef]
  41. Hast, A.; Syri, S.; Lekavičius, V.; Galinis, A. District heating in cities as a part of low-carbon energy system. Energy 2018, 152, 627–639. [Google Scholar] [CrossRef]
  42. IAEA. Modelling Nuclear Energy Systems with MESSAGE: A User’s Guide; IAEA: Vienna, Austria, 2007. [Google Scholar]
  43. Aspen Technology. Aspen Plus User Guide Version 10.2; Aspen Technology: Cambridge, MA, USA, 2000. [Google Scholar]
  44. Rodríguez, R.A.; Becker, S.; Andresen, G.B.; Heide, D.; Greiner, M. Transmission needs across a fully renewable European power system. Renew. Energy 2014, 63, 467–476. [Google Scholar] [CrossRef]
  45. Bahar, H.; Sauvage, J. Cross-Border Trade in Electricity and the Development of Renewables-Based Electric Power: Lessons from Europe. ECD Trade Environ. Work. Pap. 2013. [Google Scholar] [CrossRef]
  46. Casula, L.; D’AMico, G.; Masala, G.; Petroni, F. Performance estimation of a wind farm with a dependence structure between electricity price and wind speed. World Econ. 2020, 43, 2803–2822. [Google Scholar] [CrossRef]
  47. Acaroğlu, H.; Márquez, F.P.G. Comprehensive Review on Electricity Market Price and Load Forecasting Based on Wind Energy. Energies 2021, 14, 7473. [Google Scholar] [CrossRef]
  48. Kolb, S.; Dillig, M.; Plankenbühler, T.; Karl, J. The impact of renewables on electricity prices in Germany—An update for the years 2014–2018. Renew. Sustain. Energy Rev. 2020, 134, 110307. [Google Scholar] [CrossRef]
  49. Prol, J.L.; Steininger, K.W.; Zilberman, D. The cannibalization effect of wind and solar in the California wholesale electricity market. Energy Econ. 2020, 85, 104552. [Google Scholar] [CrossRef]
  50. Dong, S.; Li, H.; Wallin, F.; Avelin, A.; Zhang, Q.; Yu, Z. Volatility of electricity price in Denmark and Sweden. Energy Procedia 2019, 158, 4331–4337. [Google Scholar] [CrossRef]
  51. Zhang, T.; Tang, M. Solar surge and cost shifts: Heterogenous effects of redistribution in the electricity bills in Japan. Energy Econ. 2024, 137, 107806. [Google Scholar] [CrossRef]
  52. Johnson, E.P.; Oliver, M.E. Renewable Generation Capacity and Wholesale Electricity Price Variance. Energy J. 2019, 40, 143–168. [Google Scholar] [CrossRef]
  53. Schöniger, F.; Morawetz, U.B. What comes down must go up: Why fluctuating renewable energy does not necessarily increase electricity spot price variance in Europe. Energy Econ. 2022, 111, 106069. [Google Scholar] [CrossRef]
  54. Zang, G.; Sun, P.; Elgowainy, A.A.; Bafana, A.; Wang, M. Performance and cost analysis of liquid fuel production from H2 and CO2 based on the Fischer-Tropsch process. J. CO2 Util. 2021, 46, 101459. [Google Scholar] [CrossRef]
  55. Martinelli, M.; Gnanamani, M.K.; LeViness, S.; Jacobs, G.; Shafer, W.D. An overview of Fischer-Tropsch Synthesis: XtL processes, catalysts and reactors. Appl. Catal. A Gen. 2020, 608, 117740. [Google Scholar] [CrossRef]
  56. Jovan, D.J.; Dolanc, G. Can Green Hydrogen Production Be Economically Viable under Current Market Conditions. Energies 2020, 13, 6599. [Google Scholar] [CrossRef]
  57. Sneum, D.M.; González, M.G.; Gea-Bermúdez, J. Increased heat-electricity sector coupling by constraining biomass use? Energy 2021, 222, 119986. [Google Scholar] [CrossRef]
  58. Habermeyer, F.; Kurkela, E.; Maier, S.; Dietrich, R. Techno-Economic Analysis of a Flexible Process Concept for the Production of Transport Fuels and Heat from Biomass and Renewable Electricity. Front. Energy Res. 2021, 9, 723774. [Google Scholar] [CrossRef]
Figure 1. The basic scheme for evaluation of the cost-effectiveness of the FLEXCHX technology in Lithuanian conditions.
Sustainability 16 08406 g001
Figure 2. The simplified diagram for the district heating system model.
Sustainability 16 08406 g002
Figure 3. Graphical representation of FLEXCHX technology operation modes in the mathematical model analyzing the operation and development of the Kaunas district heating system.
Sustainability 16 08406 g003
Figure 4. Structure of the mathematical model for analysis of the operation and development of the Lithuanian electricity system in a long-term perspective.
Sustainability 16 08406 g004
Figure 5. Dynamics of electricity generation in Lithuania when there are no restrictions on electricity trade.
Sustainability 16 08406 g005
Figure 6. Electricity price variation in moderate price variation case in 2040.
Sustainability 16 08406 g006
Figure 7. Dynamics of electricity generation in Lithuania corresponding to the case of declining import availability.
Sustainability 16 08406 g007
Figure 8. Electricity price variation in high price variation case in 2040.
Sustainability 16 08406 g008
Figure 9. Saved discounted cost of Kaunas DH system development and operation during the period from 2020–2050.
Sustainability 16 08406 g009
Figure 10. The installed capacity of FLEXCHX technology in scenarios analyzed when by-products are used for generating heat used by household consumers.
Sustainability 16 08406 g010
Figure 11. The installed capacity of FLEXCHX technology in scenarios analyzed when by-products are used for generating heat used by industrial consumers.
Sustainability 16 08406 g011
Figure 12. Operation regime of FLEXCHX technology in 2040, Scenario1_7.
Sustainability 16 08406 g012aSustainability 16 08406 g012b
Figure 13. Dependence of FLEXCHX operation on electricity market price in 2040, Scenario1_7. (Remark: a mirror principle is applied to the curve showing the electricity price for better clarity).
Sustainability 16 08406 g013
Figure 14. Heat production in Kaunas DH system in 2040, Scenario-1_7.
Sustainability 16 08406 g014
Figure 15. Structure of heat production in Kaunas DH system in 2040, Scenario-1_7.
Sustainability 16 08406 g015
Table 1. Fuel price assumptions in EUR/MWh.
2020–20242025–20292030–20392040–20492050–2060
Gas27.533.539.451.363.0
Heating oil41.250.058.976.696.8
Diesel35.843.551.266.696.0
Woodchips12.016.721.430.840.0
Municipal waste−9.7−11.1−12.4−15.2−17.9
Table 2. Definition of operational cases of FLEXCHX technology.
Global
FT CO conv. 0.80.80.8
FT Temp. [°C]230230230
FT pressure [bar]202020
Off-gas to steam eff. [%]909090
Steam to power eff. [%]353535
CaseCase 1Case 2Case 2c 1
FT CO conv.0.80.80.8
Biomass in [MW]464646
T Gasifier [°C]830830830
S/O gasifier1.772.52.5
S/O reformer0.8511
O2/(air + O2)0.42411
T reformer [°C]850850850
CO2 removal0.60.80.8
recycle rate00.850.85
Case Case 3Case 3c 1
H2/CO 1.81.8
Biomass in [MW] 2346
T Gasifier [°C] 830830
(S + CO2)/O gasifier 2.42.4
S/O reformer 11
O2/(air + O2) 11
T reformer [°C] 850850
CO2 removal 0.60.6
recycle rate 0.850.85
CO2/(CO2 + S) gasifier 0.940.94
PEM efficiency [% LHV] 0.7250.725
1 “c” denotes the constant input of biomass to FLEXCHX.
Table 3. Efficiencies of FLEXCHX technology in different operation modes [%].
Biomass Alone
CaseCase 1Case 2Case 2c
Fuel Efficiency47.658.858.8
Process Efficiency81.180.880.8
Carbon Efficiency30.137.337.3
Boosted by electrolysis
Case Case 3Case 3c
Fuel Efficiency 60.060.0
Process Efficiency 81.981.9
Carbon Efficiency 71.371.3
Table 4. Technical characteristics (inputs and outputs) of the FLEXCHX technology.
CaseInputOutputAlternative Operation Mode in the DH Model
BiomassElectricityFT C5+ LiquidsFT Off-GasSteam
MW (Share)MW (Share)MW (Share)MW (Share)MW (Share)
Variable biomass
input
Case 146.1
(0.920)
4.0
(0.080)
22.0
(0.438)
10.4
(0.208)
9.0
(0.180)
1
Case 246.1
(0.912)
4.4
(0.088)
27.1
(0.537)
2.2
(0.044)
12.3
(0.244)
2
Case 323.1
(0.477)
25.3
(0.523)
25.9
(0.536)
1.6
(0.033)
13.0
(0.270)
4
Constant biomass
input
Case 2c46.1
(0.912)
4.4
(0.088)
27.1
(0.537)
2.2
(0.044)
12.3
(0.244)
2
Case 3c46.1
(0.477)
50.6
(0.523)
51.8
(0.536)
3.2
(0.033)
26.1
(0.270)
4
Table 5. Economic parameters of FLEXCHX technology and electrolyzer used in the Kaunas DH system model.
ParameterVariable Biomass InputConstant Biomass Input
Case 1Case 2Case 3Case 2cCase 3c
FLEXCHX
Investment cost, EUR/kW35082871300632701711
Fixed O&M cost, EUR/kW220180188.1268.2160.6
Variable O&M cost, EUR/kWyr61.6453.4449.0274.4176.63
Variable O&M cost, EUR/MWh7.046.15.68.498.75
ELECTROLYZER
Investment cost *, EUR/kW 555.7 555.6
Fixed O&M cost *, EUR/kW 28.65 28.65
Variable O&M cost *, EUR/kWyr 5.51 5.51
Variable O&M cost *, EUR/MWh 0.63 0.63
Alternative operation mode in the DH system modelWith variable input124
With constant input 24
* Related to the electricity input of the electrolyzer.
Table 6. Characteristics of the scenarios analyzed.
Scenario
Nr.
Linked ToElectricity PricesBiomass Input
Public Heat SupplierIndustrial Heat SupplierModerate VariationBig VariationVaryingStable
1+ + +
2+ + +
3+ ++
4+ + +
5 ++ +
6 ++ +
7 + ++
8 + + +
Table 7. Product FT C5+ liquid prices assumed in calculations, EUR/MWh.
Identifier on the Right Side of Scenario Coding *12345678910
Product cost70.077.083.990.897.7104.6111.5118.4125.3132.2
* Scenario1_5 means the first scenario from Table 6, when the FT C5+ liquid price is 97.7 EUR/MWh.
Table 8. Energy balance of FLEXCHX technology in Scenario1_7, GWh.
Product203020402050Operation Mode
Biomass input---Case 1
Electricity input---
FT C5+ liquid output---
FT off-gas output---
Steam output---
Biomass input1215.841027.09380.00Case 2
Electricity input116.6898.5736.47
FT C5+ liquid output715.06604.05223.48
FT off-gas output58.0749.0518.15
Steam output325.38274.86101.69
Biomass input15.72107.4055.55Case 3
Electricity input17.63120.5062.33
FT C5+ liquid output17.55119.9062.02
FT off-gas output1.077.323.79
Steam output9.2162.9532.56
Biomass input1232.431134.49435.55Total
Electricity input134.41219.0798.80
FT C5+ liquid output733.06723.95285.50
FT off-gas output59.2156.3721.94
Steam output334.84337.82134.26
Table 9. Energy balance of FLEXCHX technology in Scenario3_10, GWh.
Product203020402050Operation Mode
Biomass input---Case 1
Electricity input---
FT C5+ liquid output---
FT off-gas output---
Steam output---
Biomass input1670.311310.661478.60Case 2
Electricity input160.29125.78141.90
FT C5+ liquid output982.34770.83869.59
FT off-gas output79.7762.6070.62
Steam output447.00350.75395.70
Biomass input5.67107.8498.96Case 3
Electricity input6.36121.00111.04
FT C5+ liquid output6.33120.40110.48
FT off-gas output0.397.356.75
Steam output3.3263.2158.01
Biomass input1677.231418.511577.56Total
Electricity input166.78246.78252.94
FT C5+ liquid output989.32891.22980.08
FT off-gas output80.2669.9577.36
Steam output450.68413.97453.71
Disclaimer/Publisher’s Note: The statements, opinions and data contained in all publications are solely those of the individual author(s) and contributor(s) and not of MDPI and/or the editor(s). MDPI and/or the editor(s) disclaim responsibility for any injury to people or property resulting from any ideas, methods, instructions or products referred to in the content.

