Article

Techno-Economic Assessment of Amine-Based Carbon Capture in Waste-to-Energy Incineration Plant Retrofit

1
Department of Civil and Mechanical Engineering, University of Cassino and Southern Lazio, 03043 Cassino, Italy
2
International Laboratory for Air Quality and Health, Queensland University of Technology, Brisbane, QLD 4000, Australia
*
Author to whom correspondence should be addressed.
Sustainability 2024, 16(19), 8468; https://doi.org/10.3390/su16198468 (registering DOI)
Submission received: 7 July 2024 / Revised: 10 September 2024 / Accepted: 17 September 2024 / Published: 29 September 2024
(This article belongs to the Topic CO2 Capture and Renewable Energy)

Abstract

:
This study offers a detailed techno-economic assessment of Carbon Capture (CC) integration in an existing Waste-to-Energy (WtE) incineration plant, focusing on retrofit application. Post-combustion carbon capture using monoethanolamine (MEA) was modeled for various low-scale plant sizes (3000, 6000, and 12,000 t of CO2 per year), using a process simulator, highlighting the feasibility and implications of retrofitting a WtE incineration plant with CC technology. The comprehensive analysis covers the design of the CC plant and a detailed cost evaluation. Capture costs range from 156 EUR/t to 90 EUR/t of CO2. Additionally, integrating the CO2 capture system reduces the overall plant absolute efficiency from 22.7% (without carbon capture) to 22.4%, 22.1%, and 21.5% for the different capture capacities. This research fills a gap in studying small-scale CC applications for the WtE incineration plants, providing critical insights for similar retrofit projects.

1. Introduction

Waste-to-Energy (WtE) incineration plants are crucial in modern waste management, processing non-recyclable waste and thus providing sanitary services to communities while generating electrical and thermal energy [1]. With approximately 500 plants across Europe treating nearly 100 million tonnes of municipal, commercial, and industrial residual waste annually [2], their impact toward sustainable waste management is significant. They contribute to reducing greenhouse gas emissions by limiting landfill use and thus reducing the associated methane emissions [3,4]. Looking to the future, WtE incineration plants could further minimize their carbon footprint by integrating Carbon Capture (CC) technologies. Such technologies could provide a potent means to achieve a negative balance in carbon dioxide emissions for WtE incineration [5]; indeed, integrating CC technologies not only reduces fossil-based CO2 emissions but also enables negative emissions by capturing and storing biogenic carbon from waste biomass combustion [6,7,8,9].
In a broader perspective, CC technologies are increasingly recognized as essential in mitigating climate change [10,11,12]. The International Energy Agency underlies the role of CC in achieving the Paris Agreement’s goal to limit global temperature increases to below 2 °C [13] and highlights CC as a key technology for significantly reducing emissions from large-scale energy systems [11]. The application of carbon capture technology requires combining with Storage (CCS) or Utilization (CCU). CCS involves removing CO2 from carbon sources and compressing it for storage underground [14], while CCU utilizes captured CO2 for conversion, focusing on incorporating CO2 into the carbon cycle, seeking a long-term sustainable path and generating economic benefits by using CO2, thereby reducing the overall cost of capture [15]. Both CCS and CCU share the initial step of CO2 capture, which requires particular attention due to its key role in the system’s overall effectiveness. Among CO2 capture configurations, several options are available, including pre-combustion, post-combustion, and oxyfuel technologies [16]. Post-combustion is most feasible for retrofitting existing plants [12,17], with absorption systems, particularly those using monoethanolamine (MEA) solutions, reaching commercialization due to their proven effectiveness [18,19,20,21].
While CC absorption systems are well-established in coal-fired power plants [22,23], only a few absorption plants have been integrated with WtE plants [24]. This disparity is also reflected in the scientific literature, which offers limited studies on the topic. Specifically, there is a notable gap in detailed techno-economic analyses of CO2 capture systems applied to WtE incineration plants. For instance, Bringezu [25] highlights the potential of CCU in a WtE incineration in utilizing CO2 as a raw material for polymer production. Additionally, Christensen and Bisinella [26] show how CCU can significantly reduce the climate change impacts of incineration while providing valuable carbon for various applications, investigating both the direct utilization and hydrogenation of CO2 to produce feedstock chemicals or fuels such as methane, methanol, dimethyl ether (DME) and formic acid. Similarly, Biasella et al. [27] highlight the significant climate change benefits of integrating CCS in WtE incineration, showing how this technology can reduce CO2 emissions by up to 700 kg CO2 per tonne of wet waste treated. These studies illustrate the energy and environmental benefits of integrating CC into WtE incineration plants without showing specific technological and economic aspects. Haaf et al. [28] conducted a study on the use of calcium looping cycles to remove CO2 in WtE incineration plants. The study provided a techno-economic analysis for a large-scale application with a capture of around 160 kt of CO2 annually. Lv et al. [29] explored the gasification of municipal solid waste (MSW) to produce syngas, followed by a chemical looping cycle for CO2 capture. However, this method requires building a new plant and cannot be used to retrofit an existing one. Additionally, Roussanaly et al. [30] compared three post-combustion solutions (MEA absorption, advanced amine absorption, and membrane separation) to determine their design and cost implications in full-scale CCS solutions in WtE incineration plants. However, the study did not provide specific technological aspects and considered a capture of a large-scale size of 400 kt CO2. Despite the recognized potential of CC in improving the environmental sustainability of WtE incineration plants, its feasibility at smaller scales remains underexplored. This is particularly relevant in countries like Italy, where the absence of geological storage options and a limited CO2 market (approximately 300 kt CO2 per year and already saturated [31]) prohibits the large-scale implementation of CC technologies. Our study addresses this gap by exploring the technological and economic feasibility of implementing low-scale CC systems in WtE incineration plants. While pilot projects like Twente in the Netherlands (capturing 3000 t of CO2 annually [32]), Fortum in Norway [33] and Saga City in Japan (with an annual capture of 2500 t of CO2) demonstrate the potential for small-scale CC implementations, they lack detailed exploration within the WtE context. However, these sizes can serve as a starting point for our analysis, aligning our study with the scale of existing pilot projects documented in the literature. The implementation of a small-scale carbon capture system within the WtE is also a response to the need to minimize the impact on the plant. This approach allows for an efficient integration with existing infrastructure, ensuring minimal impact while maintaining effectiveness of the carbon capture system.
This study presents the results of an assessment of the integration of post-combustion absorption technology using MEA in a real WtE incineration plant. The assessment is based on real operating data, which includes net power production, operating hours, flue gas flow rate, and flue gas compositions. This study aims to determine the technical and economic feasibility of a small-scale carbon capture system for various sizes (3000, 6000, and 12,000 t of CO2 per year) and provides valuable insights for similar implementations. Our study deals with the design and cost estimation of CC and provides a perspective on their integration of WtE incineration plants, whereas the potential end-uses of the captured CO2 are behind the scope of the paper.

2. Methodology

This section presents the methodology adopted for the design of the carbon capture system (scheme and simulation) and the cost estimation approach focusing on the existing WtE incineration plant.

2.1. Waste-to-Energy Incineration Plant

The WtE incineration plant selected in this study is located in Italy and produces electricity through the combustion of Solid Refuse Fuel (SRF). The facility has three incineration lines, with the carbon capture system hypothetically integrated into one of these lines. High-pressure steam is generated at conditions of 42 bar and 415 °C from the energy recovery system and is subsequently directed to a turbine for electricity production. The plant’s annual operational time is assumed to be 8000 h to account for any scheduled or unscheduled maintenance. The cooling system offers an average water temperature of 40 °C. Detailed characteristics of the facility, the average values of a typical year of flue gases produced, and the macro-composition of the flue gases are presented in Table 1.
After having passed thermal recovery, the flue gases generated by combustion move through an advanced flue gas treatment system, which is crucial to minimize the environmental impact [34,35]. The system includes the following components: (i) an electrostatic precipitator, which serves as the first stage in dust removal from the boiler flue gases; (ii) a dry reactor that employs sodium bicarbonate to eliminate acidic pollutants; (iii) a bag filter, acting as the second stage of the flue gas filtration post-reactor in dust removal; (iv) a DeNOX unit that utilizes Selective Catalytic Reduction (SCR) technology to reduce NOx emissions by injecting an ammoniacal solution counter-current to the flue gases. Continuous monitoring and analysis of the cleaned flue gases are performed to ensure agreement with regulatory emission standards. Contaminants and pollutants such as CO, NH3, NOx, and SOx were neglected.

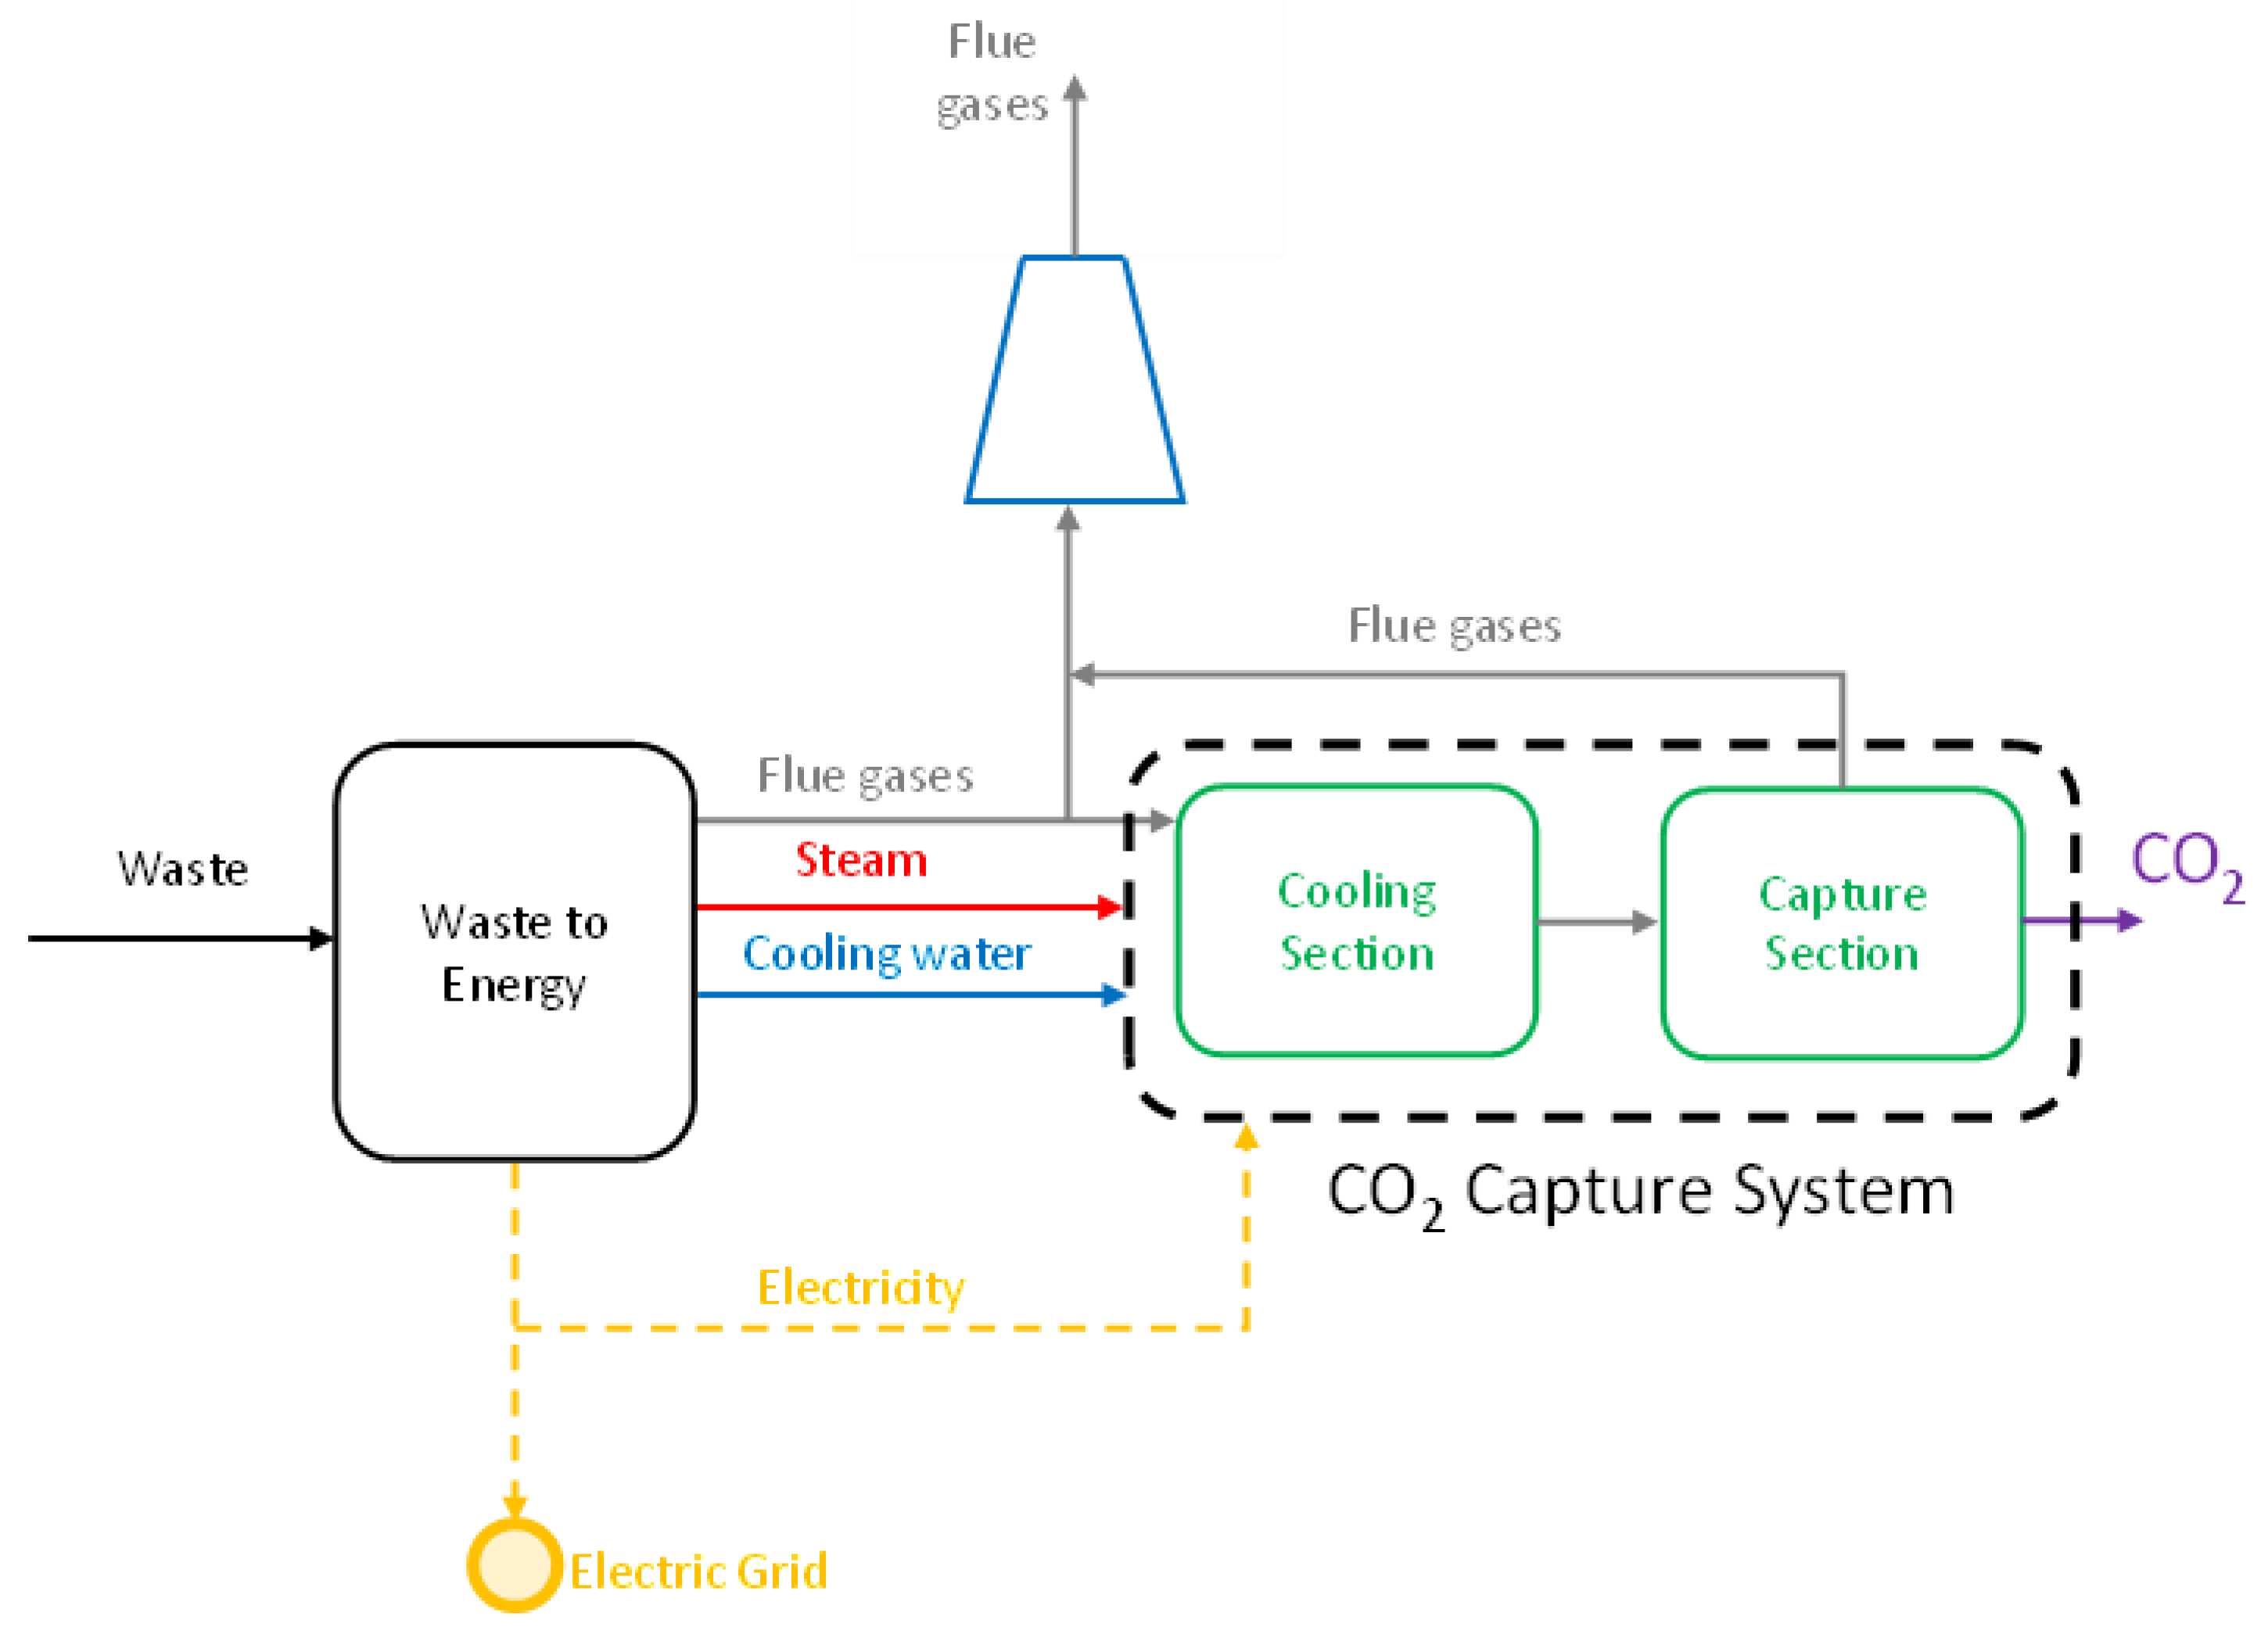
2.2. Carbon Capture System Scheme

Figure 1 provides a detailed overview of the carbon capture system integrated into the WtE plant. The process is divided into distinct phases, each with a specific role. Firstly, the flue gases produced in the WtE are cooled in the ‘Cooling Section’ to ensure an optimal temperature for the subsequent capture stage. Then, in the ‘Capture Section’, the CO2 from the cooled gases is effectively captured with the amine-based solvents. The electrical and thermal energy required for the capture process is directly sourced from the WtE plant.
Figure 2 shows in detail the components present in each section. The cooling section includes two circuits: a primary one dedicated to cooling the flue gases (in grey) and a secondary one used for the cold water (in blue). The main component is the Direct Contact Cooler (DCC, C-101), in which the water from the secondary circuit is used to lower the temperature of the flue gas (directed toward the absorber). The water that exits the DCC is then cooled via a local cooling circuit. In the capture section, the system includes two main components: the absorber (C-201) and the stripper (C-202). In the absorber (C-201), the carbon dioxide is transferred from the vapor/gas phase to the liquid by the reaction between the CO2 and the solvent. In the stripper (C-202), on the other hand, a reverse reaction regenerates the solvent, and CO2 is transferred back to the gaseous phase. A cross heat-exchanger (E-201) interconnects the two main components. This configuration differs from the classic absorption–regeneration process used in the literature [36,37,38,39,40,41] since the water from the condenser (E-203) is not recycled back to the top of the stripper as reflux but is instead directed to the water-wash (C-203). This choice is motivated by energy-saving reasons, which is in line with Madeddu et al. [42] and Oexmann and Kather [43]. Then, the CO2 captured is directed to the following section.
Typical values for the absorption efficiency range from 75% to 95% [12,44]. Considering the amount of CO2 needed and the fact that deep decarbonization of the process is not the goal of this work, a CO2 capture efficiency of 85% was chosen. We simulated a low-scale CC system of different sizes: 3000, 6000, and 12,000 t of CO2 per year. The choice of the CC system sizes considered here was based on the following considerations: the lowest size (3000 t CO2/y) was considered equal to those adopted in the above-mentioned pilot projects [32,33], whereas the highest size was limited to 12,000 t CO2/y in order to avoid extreme WtE efficiency reduction (please consider that the power required for a CC system is obtained from the extraction of turbine steam as described in Section 2.5). Considering the objective of efficiency and the size of the CC system, the flow was partialized as follows: 2.95% (i.e., 2538 Nm3/h), 5.90% (i.e., 5076 Nm3/h), and 11.80% (i.e., 10,151 Nm3/h) for 3000, 6000, and 12,000 t CO2/year plant size, respectively.

2.3. Carbon Capture System Simulation

The carbon capture system was modeled using Aspen Plus. The equipment size is crucial for the equipment cost [45], highlighting the importance of this factor in the design and economic feasibility. The design of the cooling and capture sections follows the approach delineated in the work of Madeddu et al. [42]. This involves designing a post-combustion CO2 capture facility utilizing MEA for reactive absorption and stripping, with a RedFrac model to determine the appropriate dimensions for both the absorption and stripping columns.
For the evaluation of thermodynamic properties in the liquid phase, the Electrolyte-Non-Random Two-Liquid (Electrolyte-NRTL) model was employed, given its suitability for describing the electrolytic interactions inherent to the CO2-MEA-H2O system [19,46,47,48,49,50,51,52,53,54]. In contrast, for the calculation of non-ideal behavior in the vapor/gas phase, the Redlich-Kwong Equation of State was implemented, which is consistent with findings in the existing literature [46,48,55].
Concerning chemical reactions, the model incorporates both kinetic and equilibrium reactions in line with the literature [48,52,54,56,57,58]. Specifically, the model considers a set of three equilibrium reactions (Equations (1)–(3)) and two kinetic reactions (Equations (4) and (5)):
2 H 2 O H 3 O + + O H
C O 2 + 2 H 2 O H C O 3 + H 3 O +
M E A + H C O 3 M E A C O O + H 2 O
M E A + H 3 O + M E A + + H 2 O
H C O 3 + H 2 O C O 3 2 + H 3 O +
For what concerns the equilibrium reactions, the equilibrium constants were determined according to Standard Gibbs free-energy change (Equation (6)):
K e q = e x p Δ G 0 R T L
where the values of the Δ G 0 are retrieved from the software database.
On the other hand, for kinetic reactions, the default expression in the software is the classic power law, where the kinetic constants are expressed utilizing the Arrhenius law (Equation (7)):
k = k 0 E a R T L
The models adopted for each component illustrated in Figure 2 are described below.
Fan (F-101): The pressure is set to overcome flue gas pressure drops passing through the DCC (C-101), absorber (C-201) and water-wash (C-203), with a required total pressure of 1.18 bar. The isentropic efficiency is set to ηis = 0.75.
DCC (C-101): The DCC is modeled using a RedFrac model. A packed column is selected. The cooling water temperature is set at 50 °C due to the availability of a heat exchanger for water cooling, which operates at 40 °C per the plant’s available temperature.
Absorber (C-201): The operational pressure within the absorber is set to 1.1 bar, and the lean solvent loading is fixed at 0.3 mol CO2/mol MEA, reflecting an average of values reported in the literature [37,38,59,60,61]. In line with the methodology defined by Madeddu et al. [42], the design of the absorber proceeds by first determining the minimum solvent flow rate L 0 m i n and the column diameter, assuming an infinite packing height. Subsequent steps include assessing the effective packing height, which considers a range of solvent flow rates using the equation L 0 e f f = 1 ÷ 2 · L 0 m i n . This is followed by analyzing the temperature profile of the liquid and the CO2 vapor composition to verify the absence of isothermal zones within the column, which is in line with Kvamsdal and Rochelle [49] and Seader et al. [39]. For our absorber, the effective packing height is chosen based on a liquid flow rate of 1.2 · L 0 m i n . This rate was carefully selected to ensure the absence of isothermal zones and proper CO2 vapor composition profiles within the column that ensure all sections of the column are working properly, without areas where no absorption reaction occurs. A packed column is selected for the absorber due to its higher contact area and lower pressure drop compared to plate columns, as suggested by Madeddu et al. [42].
Stripper (C-202): The stripper operates in combination with the reboiler (E-202) and the condenser (E-203). In typical operations, the stripper is set to a pressure above atmospheric levels. This approach is supported by the fact that the heat absorbed by CO2 in MEA is nearly double that required for the vaporization of water [62]. According to the Clausius–Clapeyron equation, the vapor pressure of CO2 increases more rapidly than that of water, requiring a higher operational pressure in the stripper compared to the absorber to achieve temperatures that are favorable for the selective transfer of CO2 over water. Nevertheless, the pressure is influenced by the degradation temperature of MEA, which must not exceed 110 °C in the reboiler to prevent solvent degradation [63]. Therefore, it is crucial to set the column pressure at the highest possible level that still ensures the solvent’s boiling point remains below its degradation temperature. For a 30 wt% MEA solution, this optimal pressure has been determined to be 1.8 bar, which has been accordingly established for the stripper’s operation [63]. The criterion for determining the minimum packing height is based on the analysis of liquid temperature profiles and temperature gradients (always maintained above 0.5 °C/m), following the methodology of Madeddu et al. [64]. Regarding the condenser temperature (E-203), given the availability of cooling water at 40 °C, it is set to 50 °C.
Water-Wash (C-203): The water-wash column is designed to recapture a portion of the vaporized solvent (MEA) from the flue gases leaving the absorber. In this configuration, MEA is physically reabsorbed by the condensed and make-up water, which together determine the solvent flow rate within this column. The maximum allowable concentration of MEA is set at 3 ppm, which is in line with the material safety data sheet from Dow Chemical Company [65]. The diameter of the column is equal to the absorber diameter since both the water-wash section and the absorber are inside the same vessel.
Exchangers: DCC Cooler (E-101), L-R exchange (E-201), Cooler (E-202), Condenser (E-203) and Reboiler (E-204): For the L-R exchange (E-201), the temperature is fixed to the boiling point since it is typical for the stripper to send the feed as a saturated liquid [39,41]. The heat transfer areas of the heat exchanger are calculated based on the duties obtained from the simulation and a temperature approach Δ t = 10 °C. Overall, the heat transfer coefficients are assumed to be: for the DCC cooler, 800 W/(m2K); for the lean-rich exchange, 500 W/(m2K); for the lean amine cooler, 800 W/(m2K); for the reboiler, 800 W/(m2K); for the condenser, 1000 W/(m2K) [66]. Shell and tube heat exchangers are considered in this study, particularly the BEM type for E-101, E-201, E-202 and E-203 and the BKE type for E-204.
Pump (P-101, P-201, P-202 and P-203): P-101 is configured with an output pressure of 4 bar, which is essential for water circulation within the cooling system. P-201 is configured with an output pressure of 7 bar to prevent CO2 flashing in the heat exchanger. P-202 and P-203 are set to operate at an output pressure of 6 bar. All these pumps are centrifugal types. Their isentropic efficiency is set to η i s = 0.75 .
Valve (V-101, V-201, V-202 and V-203): They are needed to equalize the stream pressure to the operating column to which they are fed.
Table 2 shows the simulation parameters for the CO2 capture system, valid for the three system sizes simulated.

2.4. Cost Estimation

This section presents the cost estimation approach for our amine-based carbon capture system, following the methodology presented by Ali et al. [67]. The estimation process is divided into capital cost (Capex) and operational cost (Opex) estimation, with each category requiring specific calculations and consideration.

2.4.1. Capital Cost (Capex) Estimation

It is essential to specify that in the Capex assessment, the initial focus is on the equipment purchase cost, followed by the installed equipment cost. The Aspen Process Economic Analyzer was utilized to estimate the purchase cost, whereas the Enhanced Detailed Factor method was used to estimate the installed cost. For the Capex estimation, we employed the Aspen Process Economic Analyzer, based on process simulation outcomes, to determine equipment costs. This tool provided cost data based on 2018 price levels within the European market. Meanwhile, the Enhanced Detailed Factor method, developed by Nils Henrick Eldrup at USN and Sintef Tel-Tek, is applied to estimate the installed costs in Norwegian Kroner (NOK). This method includes a comprehensive range of expenses, such as direct ( f d i r e c t ), engineering ( f e n g g ), administrative ( f e d m i n i s t r a t i o n ), commissioning ( f c o m m i s s i o n i n g ), and contingency costs ( f c o n t i n g e n c y ). A summary table of the applied factors is presented in Table A1.
In line with [67], the price obtained from Aspen in euros is converted to NOK, using the 2018 exchange rate, equal to 9.6 [68], as the Aspen database and coefficients are valid for that year. Furthermore, it is essential to consider the material; all components are made of stainless steel, whereas the method is valid for carbon steel. Therefore, as suggested by Ali et al. [69], we divide the price by corrective factors ( f m a t ) to account for the material: 1.3 for machined equipment (pumps, blowers and compressor) and 1.75 for welded equipment (columns and heat exchangers), as per Husebye et al. [70]. The method accounts for this by readjusting the coefficient ( f m a t ) in the price calculation. Then, the Equipment Installed Cost (EIC) for each piece of equipment is calculated:
E I C S S N O K = E q u i p m e n t   C o s t C S N O K ·   F T o t a l , S S
where F T o t a l , S S   is calculated by:
F T o t a l , S S = f T o t a l , C S + f m a t 1 · 1 + f p i p i n g
where F T o t a l , C S   is calculated by:
F T o t a l , C S = f d i r e c t + f e n g g + f e d m i n i s t r a t i o n + f c o m m i s s i o n i n g + f c o n t i n g e n c y
The Total Installed Cost (TIC) in NOK is the sum of all EICs, subsequently converted to euros using the 2018 exchange rate. Costs are updated to 2023 levels to reflect current economic conditions, considering European consumer price inflation, equal to 1.6% for 2019, 0.5% for 2020, 2.6% for 2021 and 8.8% for 2022 [71]. Additionally, the labor costs between Norway and Italy are adjusted, considering the ratio between Norway’s GDP per capita [72] and Italy’s GDP per capita [73]. This coefficient effectively reduces the costs by approximately 33%.
It is essential for plant cost evaluation to calculate the Annualized Capex cost using the equation proposed by Ali et al. [69], dependent on the interest rate (p) and plant operational lifetime (n):
A n n u a l i z e d   f a c t o r = n = 1 20 1 1 + p n
We consider an interest rate of 7.5% and a plant’s useful life of 20 years (2-year construction time and 18 years for operational lifetime). Using these values, we can calculate the Annualized Capex cost for the plant.
Then, the annualized installed cost (EUR/yr) is calculated by dividing the installed cost by the annualized factor:
A n n u a l i z e d   C a p e x y r = T o t a l   I n s t a l l e d   C o s t A n n u a l i z e d   f a c t o r

2.4.2. Operational Cost (Opex) Estimation

Opex includes both fixed and variable components. Fixed operating costs primarily involve maintenance, considered at 4% of Equipment Installed Cost (EIC) [67], and labor expenses, which are essential for the consistent functionality of the system. The variable operating costs, being a function of the amount of CO2 captured, cover consumption of utilities, such as electricity [74], steam, cooling water and make-up of demineralized water and MEA [67]. These costs are estimated based on utility consumption rates obtained from process simulations and the corresponding utility costs listed in Table 3. A key consideration is that the cost of electricity is equal to the revenue lost from not supplying it to the grid, and the cost associated with steam usage is linked to the lost opportunity for electricity production, reflecting the inherent trade-offs in utility utilization within the plan.
In our system, the steam required for releasing CO2 from the solvent is sourced from medium-pressure turbine steam. The cost of this steam is directly linked to energy commodity prices, such as loss of production. Consequently, the steam cost is estimated based on the electricity production lost due to this extraction.
All operating costs are calculated using the general expression:
Y e a r l y   U t i l i t y   C o s t y r = A n n u a l   c o n s u m p t i o n u n i t h r · O p e r e t i n g   h o u r s y e a r · U t i l i t y   p r i c e u n i t
where the unit can be in m3, kg or kWh.

2.5. Key Performance Indicators

In assessing the effectiveness of CO2 capture systems in the WtE incineration plant, our study focuses on two fundamental parameters as key performance indicators: global energy efficiency and CO2 capture cost. These key performance indicators are crucial for understanding such systems’ economic sustainability and energy impact. It is important to note that our calculation of efficiency does not reference the Best Available Techniques (BAT) [75], as BAT considerations are limited to thermal cycle efficiency and overlook the energy auto-consumption on the plant, making them unsuitable for an accurate efficiency estimation in our context. This distinction ensures a more accurate assessment of the real impact of CC technologies when integrated into WtE plants.
The global energy efficiency is calculated both excluding and including the integration of the CO2 capture system. Initially, efficiency is determined as the ratio of the net electric power (electricity generated from the WtE process and supplied to the grid) to the thermal input to the boiler. This thermal input is calculated based on the quantity of CDW burned and its lower heating value, as demonstrated in the following formula:
η   w i t h o u t   C O 2   c a p t u r e d   = W e Q t h
where We represents the net electric power in MWe, Qth is the thermal input to the boiler, calculated based on CDW combusted and its lower heating value, in MWth. Subsequently, the efficiency is recalculated to include the presence of the CO2 capture system, along with all associated losses or energy consumption.
η   w i t h   C O 2   c a p t u r e d = W e P o w e r   r e q u i r e d   b y   C a r b o n   C a p t u r e Q t h
where the power required for carbon capture is related to the extraction of steam from the turbine, the electrical energy consumed to operate the auxiliary equipment, and the energy used for cooling water systems. The cooling water system needs approximately 12 kWh of electrical energy to remove 465.5 kWh of thermal energy.
The CO2 capture cost is calculated by dividing the combination of annualized Capex and yearly Opex by the amount of CO2 captured, as shown in:
C O 2   c a p t u r e   c o s t t   C O 2 = A n n u a l i z e d   C A P E X   y r + Y e a r l y   O P E X   y r A m o u n t   o f   C O 2   c a p t u r e d   t y r
These key performance indicators offer a view of the system’s performance, enabling a balanced cost and energy efficiency assessment in integrating CO2 capture. It is important to note that achieving a low CO2 capture cost does not always imply high energy efficiency. Hence, assessing both aspects is essential for developing long-term sustainable solutions.

3. Results and Discussions

This section presents the findings of our study on the CO2 capture system, focusing on the key performance indicators of global energy efficiency and CO2 capture cost. The results are structured to first address the energy efficiency, examining how integrating CO2 capture impacts the overall energy balance of the WtE incineration processes, and then report the economic feasibility of CO2 capture, delineating the interaction between the capital and operational costs.

3.1. Global Energy Efficiency Results

Currently, the integration of the CO2 capture system into the operations of the WtE incineration plant has been quantitatively assessed for its impact on the plant’s efficiency. Indeed, extra energy is consumed by the capture process, which includes steam for the solvent, electricity for the auxiliary, and electricity for the cooling systems, as detailed in Table 4.
The extra energy consumed by the capture process leads to a reduction in the energy efficiency of the WtE plant as a function of the CO2 capture scales: without CO2 capture, the plant has an efficiency of 22.7%, which is within the typical WtE incineration efficiency range of 10–30% [75]. However, introducing the CO2 capture system results in a decline in efficiency as the size of the CO2 capture increases: the plant efficiency decreases to 22.4%, 22.1%, and 21.5%, respectively, at the capture levels of 3000, 6000, and 12,000 t of CO2/y. The decrease in efficiency is an unavoidable outcome of incorporating a capture system. For instance, Lawel et al. [61] observed a reduction in efficiency in coal-fired power plants, where efficiency might drop from 37.2% to 31.1% with a full-scale MEA absorption capture system. Similarly, Pettinau et al. [23] demonstrated an 8–12% reduction in power plant efficiency for a full-scale capture system. However, the impact decreases considerably when the goal is to capture smaller quantities of CO2, as indicated by our results. This smaller impact can make the use of a capture system more feasible in existing facilities, making it reasonable to implement such systems when the CO2 is direct to markets.

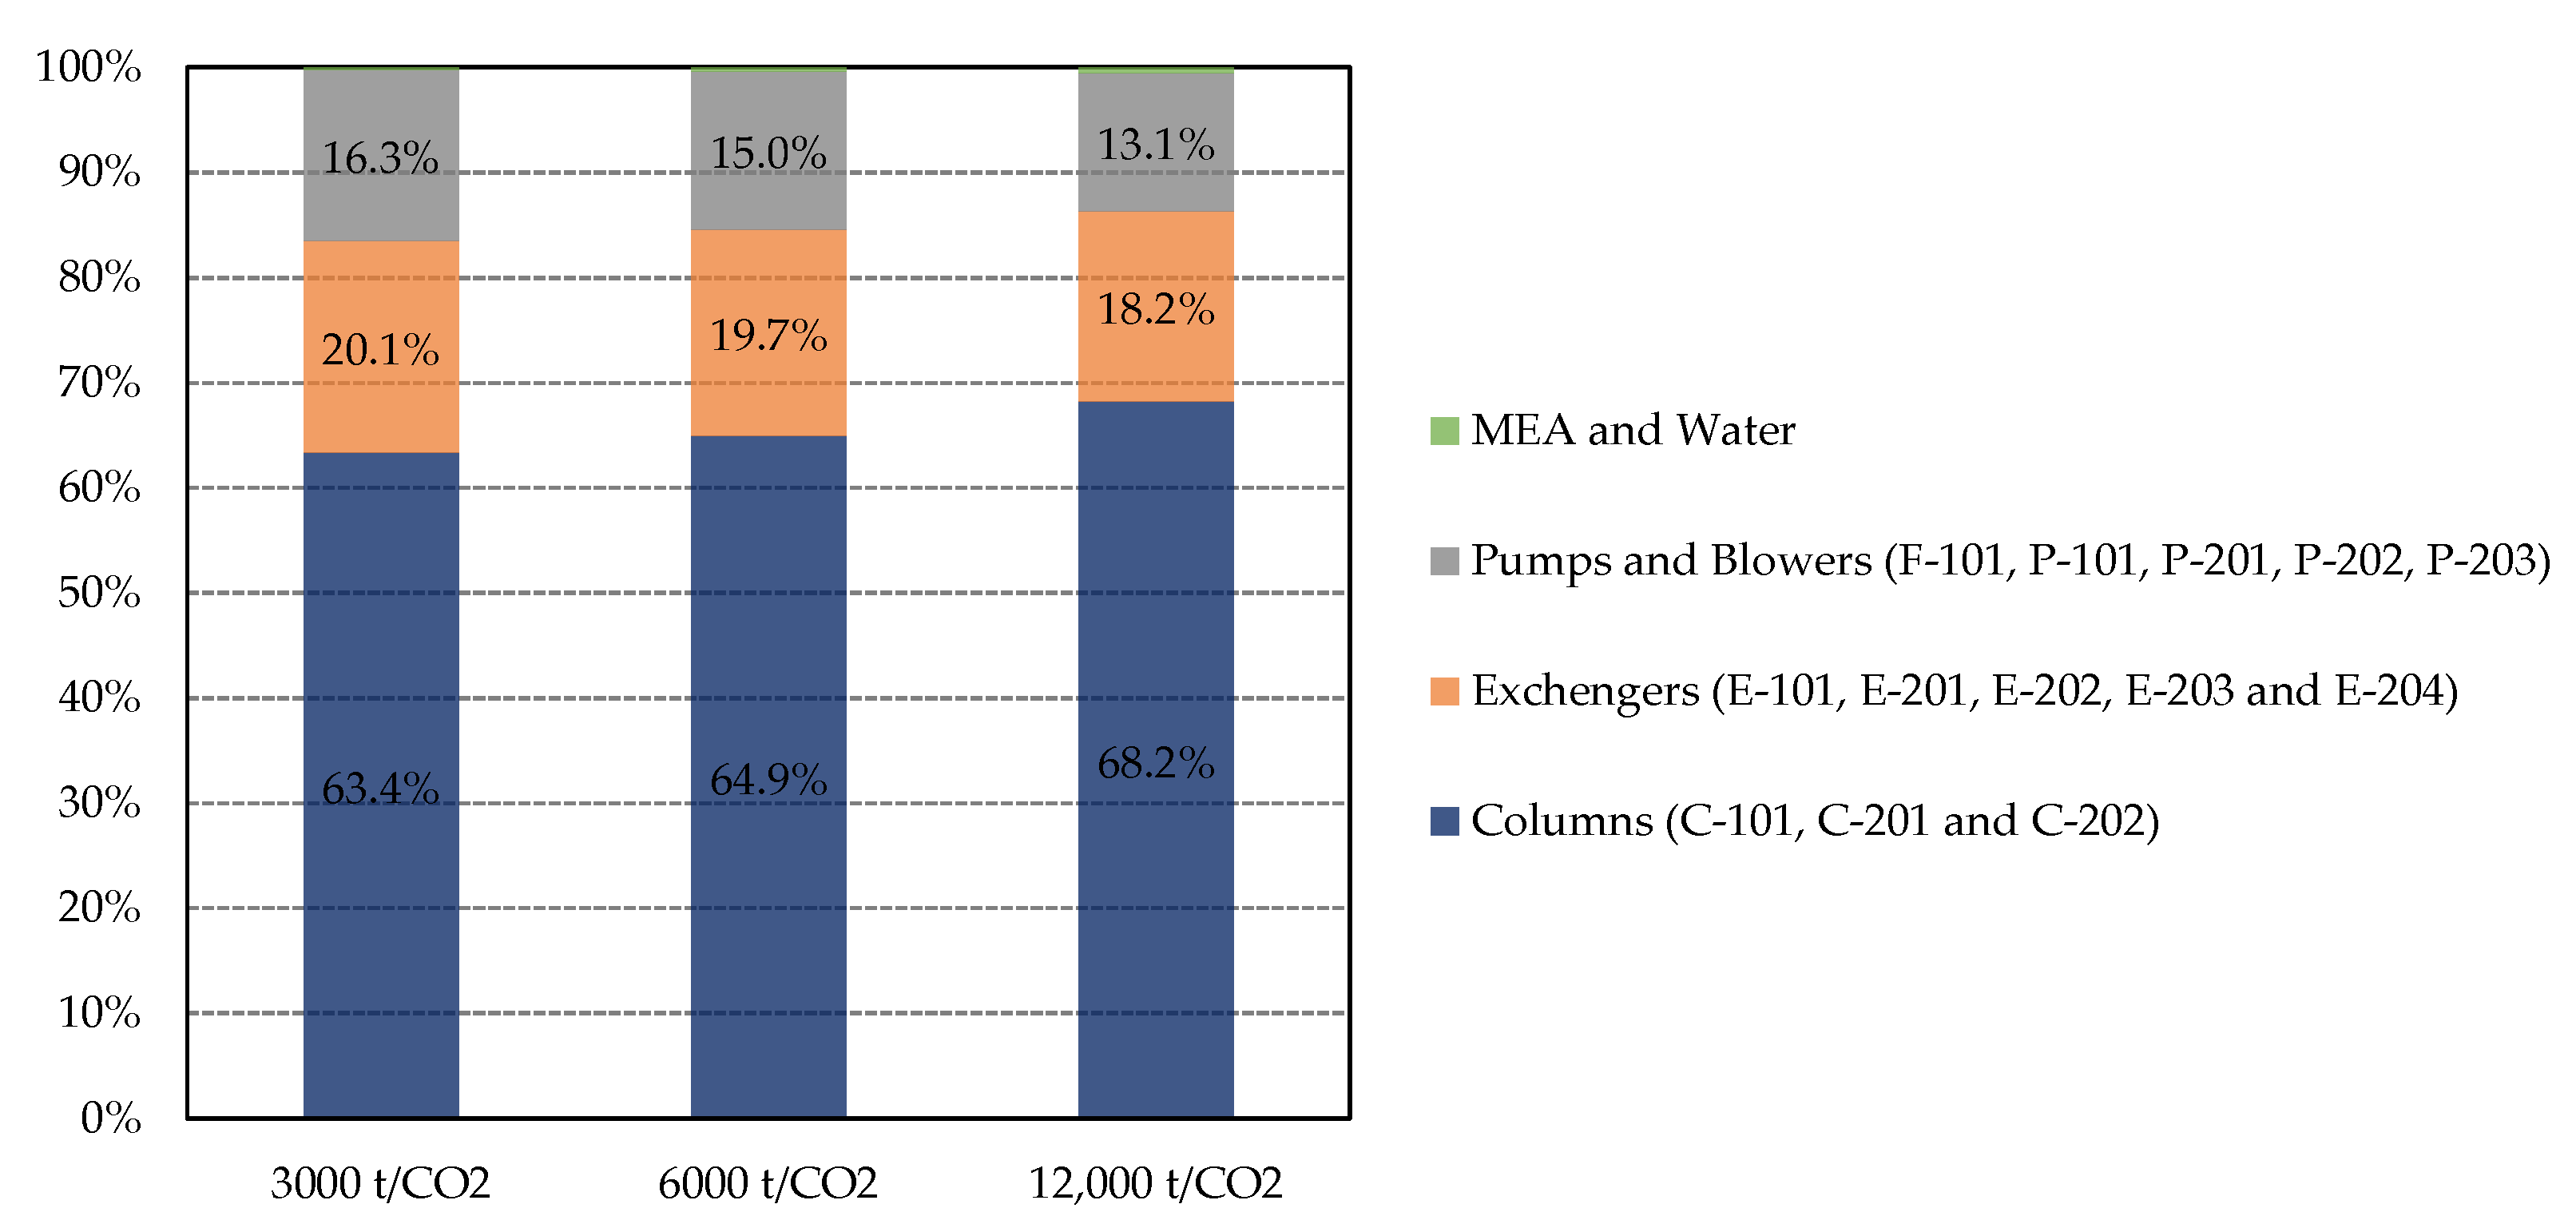
3.2. Cost Evaluation Results

The costs involved in installing a CO2 capture system at the WtE incineration plant are estimated to be EUR 2.5 M, EUR 3.0 M, and EUR 4.2 M for capturing 3000, 6000, and 12,000 t of CO2, respectively. Table A2 contains the detailed cost for each component across the three sizes of the simulated capture system. Figure 3a indicates, as expected, that the cost per ton of CO2 captured decreases as the capacity of the system increases, from 156 EUR/t to 90 EUR/t, demonstrating the efficiency achieved by scaling up the system. For capacities of 6000 and 12,000 t, the capital costs (Capex) are observed to be lower than the operational costs (Opex), with Capex at 49 EUR/t and 35 EUR/ton and Opex at 41 EUR/t (considering both Fixed and Variable Opex). This trend confirms the strategic benefit of large-scale CO2 capture.
In comparison to Ali et al.’s [67] study, which used the same approach to estimate the cost of carbon capture with MEA, our study found a higher cost per ton of CO2 captured. They reported a capture cost of 62.5 EUR/t CO2, significantly lower due to the economies of scale realized in their larger system. Their system captured approximately 945 kt of CO2 annually, which highlights the influence of scale on the total cost. On the other hand, our study used a small-scale system and thus had a higher cost per ton of CO2 captured.
In light of the captured cost observed in Figure 3a, categorized by Capex, Fixed and Variable Opex, Figure 3b illustrates the composition of variable costs. Steam and electricity emerge as the predominant costs, accounting for 86% of the Variable Opex, highlighting their crucial role in the operational cost, in line with findings in the existing literature [30,70]. Extracting steam from the medium-pressure turbine to regenerate solvent in the stripper represents a significant energy cost. The remaining 15% is distributed among cooling water and MEA. This cost distribution underlines the importance of optimizing thermal and electric utilities, which could result in substantial cost reductions. In line with this, the adoption of more thermally efficient solvents could improve operational efficiency by reducing the steam demand in the stripping process, thus providing an opportunity to decrease Variable Opex [76]. Moreover, with process integration techniques involving different CO2 capture configurations with electrical and heat integration, Variable Opex can be further reduced [37]. The focus on Variable Opex is particularly relevant since operational costs exceed Capex at the medium and highest capacity analyzed, further highlighting the significance of managing operational costs in the goal of cost-effective CO2 capture solutions.
Figure 4 presents the allocation of Capex for the different equipment within the CO2 capture system at three sizes. The analysis shows a distinct trend in Capex distribution as capacity increases. The proportion of Capex for columns C-101, C-201, and C-202 increases significantly, indicating a more substantial capital investment at larger scales, increasing from 63.4% to 68.2%. Exchangers (E-101, E-201, E-202, E-203, and E-204) and pumps and blowers (F-101, P-101, P-201, P-202, P-203) demonstrate a relatively stable Capex share, with slight decreases from 20.1% to 18.2% and 16.3% to 13.1%, respectively. The costs for MEA and the water used to fill the circuit are so negligible that they do not markedly affect the overall Capex distribution. The distribution of Capex, as depicted in Figure 4, indicates the varying cost implications of scaling up components in CO2 capture systems, providing essential guidance for capital allocation decisions in the design and expansion of such facilities, aligning with literature that highlights the absorber and stripper as the most costly components [42,70].

3.3. Limitations of the Study and Research Needs

The findings of this paper are of great interest as they attempt to fill a gap in studying small-scale CC applications for the WtEs, providing critical insights for similar retrofit projects. For the very first time, a detailed cost analysis for retrofitting WtEs with carbon capture systems is proposed. Nonetheless, a main limitation has to be pointed out: indeed, our analysis is confined solely to the CO2 capture section, without accounting for the post utilization (CCU) or storage (CCS) of the CO2 captured. Integrating these additional stages would result in increased costs, and a comprehensive and detailed cost assessment including CCU or CCS solutions could represent research that needs to be addressed in future studies. As an example, a rough estimate of including compression in the CO2 capture process could raise expenses, as suggested by Deng et al. [77], by approximately 15 EUR/t of CO2 captured, excluding transportation costs. On the other hand, converting CO2 into products like methane or methanol would necessitate extra equipment such as an electrolyzer for hydrogen production and a methanation section, significantly elevating the overall costs.
Furthermore, if WtE plants are incorporated into the Emissions Trading System as stipulated by the EU ETS Directive 2023/959 [78], they would be obligated to pay for their fossil CO2 emissions. In this scenario, the economic benefit of capturing and geologically storing CO2 (only fossil CO2 would qualify for exemption) should be considered, potentially offsetting some costs. Nonetheless, the current trading price of 80 EUR/t [79] would be not adequate to cover the expenses incurred for the CO2 capture section.
It is important to underline that the cost assessment provided may not fully reflect the potential economies associated with modular solutions currently available in the small-scale CC market. These modular solutions can offer significant cost reductions through simplifications in design, manufacturing, and implementation. The exclusion of these aspects represents a limitation of this study, and future research could further explore the economic impact of modularization on CO2 capture technologies.

4. Conclusions

This study provides a detailed techno-economic analysis of integrating an amine-based carbon capture system into WtE incineration plants, focusing on three different small-scale plant sizes (3000, 6000, and 12,000 t of CO2 per year).
The analysis shows that the viability of carbon capture in WtE plants heavily depends on the scale of implementation. The Capex costs for the capacities analyzed are EUR 2.5 M, EUR 3.0 M, and EUR 4.2 M, respectively. As the capacity increases, the costs per ton of CO2 captured decrease, indicating economies of scale, with the capture costs ranging from 156 EUR/t to 90 EUR/t of CO2. However, the cost per t of CO2 captured in WtE plants is consistently higher than the potential financial returns from CO2 emission exemptions in the Emission Trading System (ETS). This highlights a significant challenge to the financial sustainability of carbon capture technologies. Therefore, policy support and financial incentives could be necessary to bridge the economic gap in implementing carbon capture.
The operational costs, mainly attributed to steam and electricity, were found to be significant, accounting for a major portion of the variable Opex. This emphasizes the importance of optimizing thermal and electric utilities to achieve cost-effective CO2 capture solutions. Additionally, integrating the CO2 capture system reduces the overall plant absolute efficiency from 22.7% (without carbon capture) to 22.4%, 22.1%, and 21.5% for the different capture capacities.
The study’s findings are essential in comprehending the techno-economic viability of implementing carbon capture technologies in WtE incineration plants. It could serve as a crucial resource for similar implementations.

Author Contributions

Conceptualization, M.B.; methodology, M.B. and L.S.; investigation, M.B.; writing—original draft preparation, M.B.; writing—review and editing, M.B., L.S., G.C., F.A. and G.B.; supervision, L.S., G.C., F.A. and G.B. All authors have read and agreed to the published version of the manuscript.

Funding

This research was funded by Project ECS 0000024 “Ecosistema dell’innovazione—Rome Technopole” financed by EU in NextGenerationEU plan through MUR Decree n. 1051 23.06.2022 PNRR Missione 4 Componente 2 Investimento 1.5—CUP H33C22000420001.

Institutional Review Board Statement

Not applicable.

Informed Consent Statement

Not applicable.

Data Availability Statement

The data presented in this study are available on request from the corresponding author.

Conflicts of Interest

The authors declare no conflicts of interest.

Appendix A

Table A1. Enhanced Detailed Installation Factor Sheet for 2016–2018 (adapted from [67]).
kNOK0–2020–100100–500500–10001000–20002000–50005000–15,000>15,000
Equipment11111111
Erection/Installation0.890.470.250.180.140.110.100.08
Piping3.561.921.120.830.650.480.410.29
Electric1.030.710.480.410.340.280.250.18
Instrument3.561.921.120.830.650.480.410.29
Civil0.550.360.250.200.170.140.130.09
Steel &and Concrete1.791.170.790.640.550.430.390.28
Insulation0.670.340.180.140.110.090.050.04
Direct Cost13.057.895.194.233.613.012.742.25
Engineering Process1.230.430.240.180.150.130.110.09
Engineering Mechanical0.980.240.100.050.040.030.010.01
Engineering Piping1.080.580.340.250.180.140.130.09
Engineering Electric1.040.300.150.110.100.090.050.04
Engineering Instrument1.850.720.360.250.200.140.130.09
Engineering Civil0.390.110.040.030.030.010.010.01
Engineering Steel & Concrete0.580.240.130.100.090.050.050.04
Engineering Insulation0.270.090.030.010.010.010.010.01
Engineering Cost7.422.711.390.980.800.600.500.38
Procurement1.550.520.200.130.090.040.030.03
Project Control0.370.140.050.040.040.030.030.03
Site Management0.660.420.280.240.200.170.150.11
Project Management0.890.460.290.240.200.170.150.11
Administration Cost3.471.540.820.650.530.410.360.28
Commissioning0.720.330.170.100.100.050.050.04
Contingency4.992.551.571.241.060.870.780.64
Total Plant Cost, FTotal, CS29.6515.029.147.206.104.944.433.59
Table A2. Equipment sheet with installed cost.
3000 t CO2 Captured6000 t CO2 Captured12,000 t CO2 Captured
EquipmentMaterialPeculiarityEquipment Cost in
Aspen [EUR]
EIC for Italy
[kEUR]
PeculiarityEquipment Cost in
Aspen [EUR]
EIC for
Italy [kEUR]
PeculiarityEquipment Cost
in Aspen [EUR]
EIC for Italy
[kEUR]
F-101FanSS316 mDuty: 30 kW1095Duty: 55 kW1799Duty: 75 kW22130
P-101PumpSS316 mDuty: 1.5 kW877Duty: 3 kW1090Duty: 7.5 kW12115
E-101ExchangerSS316 wSurface: 14.6 m22094Surface: 29.3 m222103Surface: 60.3 m238178
C-101DCCSS316 wDiameter: 0.71 m
TT Height: 9.7 m
88418Diameter: 0.94 m
TT height: 10.4 m
169638Diameter: 1.4 m
TT height: 10.8 m
272881
C-201AbsorberSS316 wDiameter: 0.71 m
TT Height: 23.1 m
263854Diameter: 0.94 m
TT Height: 23.6 m
365975Diameter: 1.4 m
TT Height: 27.7 m
6091.626
C-202StripperSS316 wDiameter: 0.44 m
TT Height: 8.8 m
64303Diameter: 0.6 m
TT Height: 9.3 m
76358Diameter: 0.84 m
TT Height: 9.75 m
106402
P-201PumpSS316 mDuty: 3 kW983Duty: 7.5 kW11101Duty: 11 kW13122
P-202PumpSS316 mDuty: 2.2 kW878Duty: 4 kW1094Duty: 7.5 kW13119
P-203PumpSS316 mDuty: 0.75 kW873Duty: 0.75 kW873Duty: 0.75 kW873
E-201ExchangerSS316 wSurface: 9.3 m21989Surface: 18.6 m222103Surface: 37 m230140
E-202ExchangerSS316 wSurface: 16.9 m222103Surface: 33.9 m230140Surface: 67.6 m243202
E-203ExchangerSS316 wSurface: 3.9 m215116Surface: 7.6 m216123Surface: 15.4 m22094
E-204ExchangerSS316 wSurface: 10.2 m22198Surface: 20.9 m227128Surface: 40 m234160

References

  1. Astrup, T.; Møller, J.; Fruergaard, T. Incineration and Co-Combustion of Waste: Accounting of Greenhouse Gases and Global Warming Contributions. Waste Manag. Res. 2009, 27, 789–799. [Google Scholar] [CrossRef] [PubMed]
  2. Poretti, F.; Stengler, E. The Climate Roadmap of the European Waste-to-Energy Sector|The Path to Carbon Negative. SSRN J. 2022. [Google Scholar] [CrossRef]
  3. Cucchiella, F.; D’Adamo, I.; Gastaldi, M. Sustainable Management of Waste-to-Energy Facilities. Renew. Sustain. Energy Rev. 2014, 33, 719–728. [Google Scholar] [CrossRef]
  4. Wang, D.; Tang, Y.-T.; Long, G.; Higgitt, D.; He, J.; Robinson, D. Future Improvements on Performance of an EU Landfill Directive Driven Municipal Solid Waste Management for a City in England. Waste Manag. 2020, 102, 452–463. [Google Scholar] [CrossRef]
  5. Christensen, T.H.; Gentil, E.; Boldrin, A.; Larsen, A.W.; Weidema, B.P.; Hauschild, M. C Balance, Carbon Dioxide Emissions and Global Warming Potentials in LCA-Modelling of Waste Management Systems. Waste Manag. Res. 2009, 27, 707–715. [Google Scholar] [CrossRef]
  6. Creutzig, F.; Ravindranath, N.H.; Berndes, G.; Bolwig, S.; Bright, R.; Cherubini, F.; Chum, H.; Corbera, E.; Delucchi, M.; Faaij, A.; et al. Bioenergy and Climate Change Mitigation: An Assessment. GCB Bioenergy 2015, 7, 916–944. [Google Scholar] [CrossRef]
  7. Gough, C.; Upham, P. Biomass Energy with Carbon Capture and Storage (BECCS or Bio-CCS). Greenh. Gases 2011, 1, 324–334. [Google Scholar] [CrossRef]
  8. Materazzi, M.; Chari, S.; Sebastiani, A.; Lettieri, P.; Paulillo, A. Waste-to-Energy and Waste-to-Hydrogen with CCS: Methodological Assessment of Pathways to Carbon-Negative Waste Treatment from an LCA Perspective. Waste Manag. 2024, 173, 184–199. [Google Scholar] [CrossRef]
  9. Pour, N.; Webley, P.A.; Cook, P.J. Potential for Using Municipal Solid Waste as a Resource for Bioenergy with Carbon Capture and Storage (BECCS). Int. J. Greenh. Gas. Control 2018, 68, 1–15. [Google Scholar] [CrossRef]
  10. C2ES. CCUS Technology Is Essential to the Success of the Paris Agreement—Center for Climate and Energy Solutions; C2ES: Arlington, VA, USA, 2016. [Google Scholar]
  11. IEA. Energy Technology Perspectives—Special Report on Carbon Capture Utilisation and Storage—CCUS in Clean Energy Transitions; International Energy Agency: Paris, France, 2020. [Google Scholar]
  12. Metz, B.; Davidson, O.; de Coninck, H.; Loos, M.; Meyer, L. Special Report on Carbon Dioxide Capture and Storage—The Intergovernmental Panel on Climate Change (IPCC); Cambridge University Press: Cambrige, UK; New York, NY, USA, 2005. [Google Scholar]
  13. Paris Agreement International Agreements. Council Decision 2016/1841 of 5 October 2016 on the Conclusion, on Behalf of the European Union, of the Paris Agreement Adopted under the United Nations Framework Convention on Climate Change. Off. J. Eur. Union 2016. [Google Scholar]
  14. Golombek, R.; Kverndokk, S.; Greaker, M.; Ma, L. The Transition to Carbon Capture and Storage Technologies. SSRN J. 2021. [Google Scholar] [CrossRef]
  15. IEA. Putting CO2 to Use: Creating Value from Emissions; International Energy Agency: Paris, France, 2019; Available online: https://www.iea.org/Reports/Putting-Co2-to-Use (accessed on 8 April 2024).
  16. Thomas, A., II; Leila, H.; Pranav, M.; Ikenna, O. Comparison of CO2 Capture Approaches for Fossil-Based Power Generation: Review and Meta-Study. Processes 2017, 5, 44. [Google Scholar] [CrossRef]
  17. Leung, D.Y.C.; Caramanna, G.; Maroto-Valer, M.M. An Overview of Current Status of Carbon Dioxide Capture and Storage Technologies. Renew. Sustain. Energy Rev. 2014, 39, 426–443. [Google Scholar] [CrossRef]
  18. Bui, M.; Gunawan, I.; Verheyen, V.; Feron, P.; Meuleman, E.; Adeloju, S. Dynamic Modelling and Optimisation of Flexible Operation in Post-Combustion CO2 Capture Plants—A Review. Comput. Chem. Eng. 2014, 61, 245–265. [Google Scholar] [CrossRef]
  19. Plaza, J.M.; Wagener, D.V.; Rochelle, G.T. Modeling CO2 Capture with Aqueous Monoethanolamine. Energy Procedia 2009, 1, 1171–1178. [Google Scholar] [CrossRef]
  20. Tan, L.S.; Shariff, A.M.; Lau, K.K.; Bustam, M.A. Factors Affecting CO2 Absorption Efficiency in Packed Column: A Review. J. Ind. Eng. Chem. 2012, 18, 1874–1883. [Google Scholar] [CrossRef]
  21. Wang, M.; Lawal, A.; Stephenson, P.; Sidders, J.; Ramshaw, C. Post-Combustion CO2 Capture with Chemical Absorption: A State-of-the-Art Review. Chem. Eng. Res. Des. 2011, 89, 1609–1624. [Google Scholar] [CrossRef]
  22. Oh, S.-Y.; Yun, S.; Kim, J.-K. Process Integration and Design for Maximizing Energy Efficiency of a Coal-Fired Power Plant Integrated with Amine-Based CO2 Capture Process. Appl. Energy 2018, 216, 311–322. [Google Scholar] [CrossRef]
  23. Pettinau, A.; Ferrara, F.; Tola, V.; Cau, G. Techno-Economic Comparison between Different Technologies for CO2-Free Power Generation from Coal. Appl. Energy 2017, 193, 426–439. [Google Scholar] [CrossRef]
  24. Wienchol, P.; Szlęk, A.; Ditaranto, M. Waste-to-Energy Technology Integrated with Carbon Capture—Challenges and Opportunities. Energy 2020, 198, 117352. [Google Scholar] [CrossRef]
  25. Bringezu, S. Carbon Recycling for Renewable Materials and Energy Supply: Recent Trends, Long-Term Options, and Challenges for Research and Development. J. Ind. Ecol. 2014, 18, 327–340. [Google Scholar] [CrossRef]
  26. Christensen, T.H.; Bisinella, V. Climate Change Impacts of Introducing Carbon Capture and Utilisation (CCU) in Waste Incineration. Waste Manag. 2021, 126, 754–770. [Google Scholar] [CrossRef] [PubMed]
  27. Bisinella, V.; Hulgaard, T.; Riber, C.; Damgaard, A.; Christensen, T.H. Environmental Assessment of Carbon Capture and Storage (CCS) as a Post-Treatment Technology in Waste Incineration. Waste Manag. 2021, 128, 99–113. [Google Scholar] [CrossRef]
  28. Haaf, M.; Anantharaman, R.; Roussanaly, S.; Ströhle, J.; Epple, B. CO2 Capture from Waste-to-Energy Plants: Techno-Economic Assessment of Novel Integration Concepts of Calcium Looping Technology. Resour. Conserv. Recycl. 2020, 162, 104973. [Google Scholar] [CrossRef]
  29. Lv, L.; Zhang, Z.; Li, H. SNG-Electricity Cogeneration through MSW Gasification Integrated with a Dual Chemical Looping Process. Chem. Eng. Process.-Process Intensif. 2019, 145, 107665. [Google Scholar] [CrossRef]
  30. Roussanaly, S.; Ouassou, J.A.; Anantharaman, R.; Haaf, M. Impact of Uncertainties on the Design and Cost of CCS From a Waste-to-Energy Plant. Front. Energy Res. 2020, 8, 17. [Google Scholar] [CrossRef]
  31. Bertone, M.; Stabile, L.; Buonanno, G. An Overview of Waste-to-Energy Incineration Integrated with Carbon Capture Utilization or Storage Retrofit Application. Sustainability 2024, 16, 4117. [Google Scholar] [CrossRef]
  32. Huttenhuis, P.; Roeloffzen, A.; Versteeg, G. CO2 Capture and Re-Use at a Waste Incinerator. Energy Procedia 2016, 86, 47–55. [Google Scholar] [CrossRef]
  33. Fagerlund, J.; Zevenhoven, R.; Thomassen, J.; Tednes, M.; Abdollahi, F.; Thomas, L.; Nielsen, C.J.; Mikoviny, T.; Wisthaler, A.; Zhu, L.; et al. Performance of an Amine-Based CO2 Capture Pilot Plant at the Fortum Oslo Varme Waste to Energy Plant in Oslo, Norway. Int. J. Greenh. Gas Control 2021, 106, 103242. [Google Scholar] [CrossRef]
  34. Dal Pozzo, A.; Capecci, S.; Cozzani, V. Techno-Economic Impact of Lower Emission Standards for Waste-to-Energy Acid Gas Emissions. Waste Manag. 2023, 166, 305–314. [Google Scholar] [CrossRef]
  35. Vehlow, J. Air Pollution Control Systems in WtE Units: An Overview. Waste Manag. 2015, 37, 58–74. [Google Scholar] [CrossRef] [PubMed]
  36. Alie, C.; Backham, L.; Croiset, E.; Douglas, P.L. Simulation of CO2 Capture Using MEA Scrubbing: A Flowsheet Decomposition Method. Energy Convers. Manag. 2005, 46, 475–487. [Google Scholar] [CrossRef]
  37. De Miguel Mercader, F.; Magneschi, G.; Sanchez Fernandez, E.; Stienstra, G.J.; Goetheer, E.L.V. Integration between a Demo Size Post-Combustion CO2 Capture and Full Size Power Plant. An Integral Approach on Energy Penalty for Different Process Options. Int. J. Greenh. Gas Control 2012, 11, S102–S113. [Google Scholar] [CrossRef]
  38. Nittaya, T.; Douglas, P.L.; Croiset, E.; Ricardez-Sandoval, L.A. Dynamic Modeling and Evaluation of an Industrial-Scale CO2 Capture Plant Using Monoethanolamine Absorption Processes. Ind. Eng. Chem. Res. 2014, 53, 11411–11426. [Google Scholar] [CrossRef]
  39. Seader, J.D.; Henley, E.J.; Roper, D.K. Separation Process Principles: Chemical and Biochemical Operations, 3rd ed.; Wiley: Hoboken, NJ, USA, 2011; ISBN 978-0-470-48183-7. [Google Scholar]
  40. Singh, D.; Croiset, E.; Douglas, P.L.; Douglas, M.A. Techno-Economic Study of CO2 Capture from an Existing Coal-Fired Power Plant: MEA Scrubbing vs. O2/CO2 Recycle Combustion. Energy Convers. Manag. 2003, 44, 3073–3091. [Google Scholar] [CrossRef]
  41. Sinnott, R. Coulson and Richardson’s Chemical Engineering; Elsevier: Amsterdam, The Netherlands, 2005; ISBN 978-0-08-041865-0. [Google Scholar]
  42. Madeddu, C.; Baratti, R.; Errico, M. CO2 Capture by Reactive Absorption-Stripping: Modeling, Analysis and Design, 1st ed.; Springer Briefs in Energy; Springer International Publishing: Cham, Switzerland, 2019; ISBN 978-3-030-04579-1. [Google Scholar]
  43. Oexmann, J.; Kather, A. Post-Combustion CO2 Capture in Coal-Fired Power Plants: Comparison of Integrated Chemical Absorption Processes with Piperazine Promoted Potassium Carbonate and MEA. Energy Procedia 2009, 1, 799–806. [Google Scholar] [CrossRef]
  44. Notz, R.; Mangalapally, H.P.; Hasse, H. Post Combustion CO2 Capture by Reactive Absorption: Pilot Plant Description and Results of Systematic Studies with MEA. Int. J. Greenh. Gas Control 2012, 6, 84–112. [Google Scholar] [CrossRef]
  45. Smith, R. Chemical Process Design and Integration; John Wiley&Sons Ltd.: Hoboken, NJ, USA, 2005. [Google Scholar]
  46. Austgen, D.M.; Rochelle, G.T.; Peng, X.; Chen, C.C. Model of Vapor-Liquid Equilibria for Aqueous Acid Gas-Alkanolamine Systems Using the Electrolyte-NRTL Equation. Ind. Eng. Chem. Res. 1989, 28, 1060–1073. [Google Scholar] [CrossRef]
  47. Biliyok, C.; Lawal, A.; Wang, M.; Seibert, F. Dynamic Modelling, Validation and Analysis of Post-Combustion Chemical Absorption CO2 Capture Plant. Int. J. Greenh. Gas Control 2012, 9, 428–445. [Google Scholar] [CrossRef]
  48. Errico, M.; Madeddu, C.; Pinna, D.; Baratti, R. Model Calibration for the Carbon Dioxide-Amine Absorption System. Appl. Energy 2016, 183, 958–968. [Google Scholar] [CrossRef]
  49. Kvamsdal, H.M.; Rochelle, G.T. Effects of the Temperature Bulge in CO2 Absorption from Flue Gas by Aqueous Monoethanolamine. Ind. Eng. Chem. Res. 2008, 47, 867–875. [Google Scholar] [CrossRef]
  50. Lawal, A.; Wang, M.; Stephenson, P.; Yeung, H. Dynamic Modelling of CO2 Absorption for Post Combustion Capture in Coal-Fired Power Plants. Fuel 2009, 88, 2455–2462. [Google Scholar] [CrossRef]
  51. Liu, Y.; Zhang, L.; Watanasiri, S. Representing Vapor−Liquid Equilibrium for an Aqueous MEA−CO2 System Using the Electrolyte Nonrandom-Two-Liquid Model. Ind. Eng. Chem. Res. 1999, 38, 2080–2090. [Google Scholar] [CrossRef]
  52. Moioli, S.; Pellegrini, L.A.; Gamba, S. Simulation of CO2 Capture by MEA Scrubbing with a Rate-Based Model. Procedia Eng. 2012, 42, 1651–1661. [Google Scholar] [CrossRef]
  53. Posch, S.; Haider, M. Dynamic Modeling of CO2 Absorption from Coal-Fired Power Plants into an Aqueous Monoethanolamine Solution. Chem. Eng. Res. Des. 2013, 91, 977–987. [Google Scholar] [CrossRef]
  54. Razi, N.; Svendsen, H.F.; Bolland, O. Validation of Mass Transfer Correlations for CO2 Absorption with MEA Using Pilot Data. Int. J. Greenh. Gas Control 2013, 19, 478–491. [Google Scholar] [CrossRef]
  55. Lawal, A.; Wang, M.; Stephenson, P.; Koumpouras, G.; Yeung, H. Dynamic Modelling and Analysis of Post-Combustion CO2 Chemical Absorption Process for Coal-Fired Power Plants. Fuel 2010, 89, 2791–2801. [Google Scholar] [CrossRef]
  56. Aboudheir, A.; Tontiwachwuthikul, P.; Chakma, A.; Idem, R. Kinetics of the Reactive Absorption of Carbon Dioxide in High CO2-Loaded, Concentrated Aqueous Monoethanolamine Solutions. Chem. Eng. Sci. 2003, 58, 5195–5210. [Google Scholar] [CrossRef]
  57. Meldon, J.H.; Morales-Cabrera, M.A. Analysis of Carbon Dioxide Absorption in and Stripping from Aqueous Monoethanolamine. Chem. Eng. J. 2011, 171, 753–759. [Google Scholar] [CrossRef]
  58. Tobiesen, F.A.; Svendsen, H.F.; Juliussen, O. Experimental Validation of a Rigorous Absorber Model for CO2 Postcombustion Capture. AIChE J. 2007, 53, 846–865. [Google Scholar] [CrossRef]
  59. Abu-Zahra, M.R.M.; Schneiders, L.H.J.; Niederer, J.P.M.; Feron, P.H.M.; Versteeg, G.F. CO2 Capture from Power Plants. Int. J. Greenh. Gas Control 2007, 1, 37–46. [Google Scholar] [CrossRef]
  60. Cau, G.; Tola, V.; Deiana, P. Comparative Performance Assessment of USC and IGCC Power Plants Integrated with CO2 Capture Systems. Fuel 2014, 116, 820–833. [Google Scholar] [CrossRef]
  61. Lawal, A.; Wang, M.; Stephenson, P.; Obi, O. Demonstrating Full-Scale Post-Combustion CO2 Capture for Coal-Fired Power Plants through Dynamic Modelling and Simulation. Fuel 2012, 101, 115–128. [Google Scholar] [CrossRef]
  62. Freguia, S.; Rochelle, G.T. Modeling of CO2 Capture by Aqueous Monoethanolamine. AIChE J. 2003, 49, 1676–1686. [Google Scholar] [CrossRef]
  63. Davis, J.; Rochelle, G. Thermal Degradation of Monoethanolamine at Stripper Conditions. Energy Procedia 2009, 1, 327–333. [Google Scholar] [CrossRef]
  64. Madeddu, C.; Errico, M.; Baratti, R. Process Analysis for the Carbon Dioxide Chemical Absorption–Regeneration System. Appl. Energy 2018, 215, 532–542. [Google Scholar] [CrossRef]
  65. Dow Chemical Company. The Dow Chemical Company Material Safety Data Sheet: Monoethanolamine (Online); The Dow Chemical Company: Midland, MI, USA, 2023. [Google Scholar]
  66. Øi, L.E. Removal of CO2 from Exhaust Gas. Doctoral Thesis, Telemark University College, Porsgrunn, Norway, 2012. [Google Scholar]
  67. Ali, H.; Eldrup, N.H.; Normann, F.; Skagestad, R.; Øi, L.E. Cost Estimation of CO2 Absorption Plants for CO2 Mitigation—Method and Assumptions. Int. J. Greenh. Gas Control 2019, 88, 10–23. [Google Scholar] [CrossRef]
  68. CEIC Norway Foreign Exchange Rate: Norges Bank: Average: Euro. 2023. Available online: https://www.ceicdata.com/en/norway/foreign-exchange-rate/foreign-exchange-rate-norges-bank-average-euro (accessed on 2 March 2024).
  69. Ali, H.; Eldrup, N.H.; Normann, F.; Andersson, V.; Skagestad, R.; Mathisen, A.; Øi, L.E. Cost Estimation of Heat Recovery Networks for Utilization of Industrial Excess Heat for Carbon Dioxide Absorption. Int. J. Greenh. Gas Control 2018, 74, 219–228. [Google Scholar] [CrossRef]
  70. Husebye, J.; Brunsvold, A.L.; Roussanaly, S.; Zhang, X. Techno Economic Evaluation of Amine Based CO2 Capture: Impact of CO2 Concentration and Steam Supply. Energy Procedia 2012, 23, 381–390. [Google Scholar] [CrossRef]
  71. Macrotrends Inflation European Union Inflation Rate 1960–2023. Available online: https://www.macrotrends.net/ (accessed on 2 March 2024).
  72. Macrotrends GDP Norway 2023. Available online: https://www.macrotrends.net/global-metrics/countries/NOR/norway/gdp-gross-domestic-product (accessed on 5 March 2024).
  73. Macrotrends GDP Italy 2023. Available online: https://www.macrotrends.net/global-metrics/countries/ITA/italy/gdp-gross-domestic-product (accessed on 5 March 2024).
  74. GME Gestore Mercati Energetici. 2023. Available online: https://mercatoelettrico.org/It/Tools/Accessodati.aspx?ReturnUrl=%2fIt%2fStatistiche%2fME%2fDatiSintesi.Aspx (accessed on 15 March 2024).
  75. Neuwahl, F.; Cusano, G.; Benavides, J.G.; Holbrook, S.; Roudier, S. Best Available Techniques (BAT) Reference Document for Waste Inceneration—JRC Science for Policy Report; Publications Office of the European Union: Luxembourg, 2019. [Google Scholar]
  76. Tobiesen, F.A.; Haugen, G.; Hartono, A. A Systematic Procedure for Process Energy Evaluation for Post Combustion CO2 Capture: Case Study of Two Novel Strong Bicarbonate-Forming Solvents. Appl. Energy 2018, 211, 161–173. [Google Scholar] [CrossRef]
  77. Deng, H.; Roussanaly, S.; Skaugen, G. Techno-Economic Analyses of CO2 Liquefaction: Impact of Product Pressure and Impurities. Int. J. Refrig. 2019, 103, 301–315. [Google Scholar] [CrossRef]
  78. European Parliament Directive (EU) 2023/959 of the European Parliament and of the Council of 10 May 2023, Which Modifies the Directive 2003/87/EC Establishing a System for Greenhouse Gas Emission Allowance Trading within the Union and Decision (EU) 2015/1814 Concerning the Establishment and Operation of a Market Stability Reserve for the Union Greenhouse Gas Emission Trading System, Is Also Known as EU ETS Directive. Off. J. Eur. Union 2023.
  79. Sandbag Carbon Price for the EU Emissions Trading System. 2024. Available online: https://sandbag.be/Carbon-Price-Viewer/ (accessed on 19 March 2024).
Figure 1. Flow diagram of CO2 capture system integrated with a WtE incineration plant.
Sustainability 16 08468 g001
Figure 2. Absorption and desorption process for CO2 removal with MEA technology.
Sustainability 16 08468 g002
Figure 3. (a) Cost of CO2 captured: capital cost (Capex) alongside operational costs (Opex), both fixed and variable, at different capture capacities. (b) Variable Opex costs: percentages indicating the cost contributions of MEA, cooling water, electricity, and steam to the overall variable Opex for CO2 capture.
Sustainability 16 08468 g003
Figure 4. Impact of different equipment on the total cost (Capex): MEA and water, pumps and blowers, exchangers, and columns, at different capture capacities.
Sustainability 16 08468 g004
Table 1. Characteristics of Waste-to-Energy incineration plant and macro-composition of the flue gases. The values presented refer to the average of a typical year.
ParameterUnitValue
Operative timeh/y8000
CO2 emissiont/y119,747
Flue gas temperature°C131.5
Flue gas pressurebar1.006
Biomass-derived%58
SRF (Solid Refuse Fuel) t/h12.5
Net electrical powerMW10.8
Flow rateNm3/h86,027
CO2vol.%8.9
O2vol.%10.3
H2Ovol.%14.0
N2vol.%66.8
Table 2. Simulation parameters for a CO2 capture plant—valid for various system sizes.
Simulation ParameterUnitValue
Flue gas temperature from the process°C131.5
Absorber: inlet flue gases temperature°C52
Absorber: inlet flue gases pressurebar1.13
Lean solvent: temperature°C50
Lean solvent: pressurebar1.1
Lean Solvent: MEA ContentMass-%30
Lean Solvent: CO2 ContentMass-%6.5
Stripper: inlet rich temperature°C98
Stripper: pressurebar1.8
Reboiler: temperature°C120
Exchanger: ΔT°C10
Table 3. Assumptions and Opex costs adopted to estimate the cost of the proposed CC system.
ParameterUnitValue
Plant lifeyear20
Interest rate%7.5
Currency conversionNOK/€9.6
Operating hours per yearh8000
CO2 removal efficiency%85
Maintenance% of EIC4
Electricity€/MWh128
Steam€/t12.1
Cooling water€/m30.038
Demineralized water€/m32
MEA€/m31866
Table 4. Power required from CO2 capture system as a function of the CC system size.
SizeAuxiliary
[MW]
Steam
[MW]
Cooling Water
[MW]
3000 t CO2 captured0.030.080.01
6000 t CO2 captured0.050.150.02
12,000 t CO2 captured0.100.310.05
Disclaimer/Publisher’s Note: The statements, opinions and data contained in all publications are solely those of the individual author(s) and contributor(s) and not of MDPI and/or the editor(s). MDPI and/or the editor(s) disclaim responsibility for any injury to people or property resulting from any ideas, methods, instructions or products referred to in the content.

