Article

Analysis and Prediction of Atmospheric Environmental Quality Based on the Autoregressive Integrated Moving Average Model (ARIMA) Model in Hunan Province, China

1
School of Resources and Environment, Hunan University of Technology and Business, Changsha 410205, China
2
Hunan Provincial Ecological Environment Monitoring Center, Changsha 410014, China
*
Author to whom correspondence should be addressed.
Sustainability 2024, 16(19), 8471; https://doi.org/10.3390/su16198471 (registering DOI)
Submission received: 5 August 2024 / Revised: 18 September 2024 / Accepted: 23 September 2024 / Published: 29 September 2024
(This article belongs to the Section Air, Climate Change and Sustainability)

Abstract

:
Based on the panel data of atmospheric environmental pollution in Hunan Province from 2016 to 2023, the autoregressive integrated moving average model (ARIMA) is introduced to evaluate and predict the current status of atmospheric environmental quality in Hunan Province of China, and the constructed ARIMA model has an excellent prediction effect on the atmospheric environmental quality in Hunan Province. The following conclusions are obtained through the prediction and analysis based on the ARIMA model: (1) the atmospheric environmental quality in Hunan Province shows a year-on-year improvement trend; (2) the ARIMA model prediction method is reliable and effective and can accurately analyze and predict the concentrations of air pollutants (PM2.5, PM10, SO2, and CO) and atmospheric environmental quality, and the prediction results show that the outdoor air quality of Hunan Province will improve gradually each year from 2024 to 2028; (3) this study contributes a better understanding of the ambient air quality in Hunan Province during 2016–2023 and provides good forecasting results for air pollutants during the period of 2024–2028.

1. Introduction

The urbanization process in the context of carbon-neutral targets is having a profound impact on the socio-political and productive life and ecological environment of the global community [1,2,3]. By 2050, 68% of the world’s population will live in urban areas, compared to more than 55% currently [4]. This trend is particularly evident in fast-growing developing countries, where the desire for economic development and investment in infrastructure are driving significant population migration from rural to urban areas [5]. As the second largest economy in the world, China has made significant gains in urbanization, increasing the urbanization rate from 17.92% in 1978 to 66.16% in 2023 in more than 40 years, but there is still a large gap between these data and the 80% urbanization rate in the developed countries in Europe and the United States, which suggests that there is still a lot of potential for China’s urbanization process to grow. As one of the important provinces in central China, Hunan Province is vigorously implementing the governmental strategy of the rise of the central region [6]. The urbanization rate of Hunan Province in 2023 was 61.16%, which was lower than the national average (66.16%), implying that Hunan Province has more potential for urbanization. However, the process of rapid urbanization will also bring significant external pressures and impacts on the ecosystem, most notably in the form of increased levels of air pollution [7,8]. Outdoor atmospheric pollution is one of the biggest environmental threats to public health. More than 90% of the world’s population lives in areas with polluted air, which causes more than 10% of global deaths [9]. Developing countries face enormous challenges in managing urban air pollution, including limited regulatory instruments, limited financial inputs, insufficient resources, and population pressure [10,11].
With the rapid economic development since 1978, air pollution prevention and control in Hunan Province are putting great pressure on government departments to achieve high-quality economic development while ensuring the improvement of environmental quality [12]. Air pollution in Hunan Province is mainly caused by a combination of vehicle emissions, industrial production, and other anthropogenic sources [13]. Atmospheric pollutants such as particulate matter (PM2.5 and PM10), ozone (O3), sulfur dioxide (SO2), nitrogen dioxide (NO2), and carbon monoxide (CO) are all considered to be hazardous to human health [14]. The accurate prediction of air pollutants is important for the development and implementation of air pollution prevention strategies [15]. Current methods of predicting air pollutant concentrations mainly include deterministic and statistical methods; deterministic methods focus on understanding the temporal and geographic variability of pollutants, while statistical methods use a variety of techniques to simulate changes of air pollutants [16]. By using accurate prediction methods, policymakers can provide targeted adjustments and interventions in pollution prevention and control actions, urban development planning and urban management practices [17,18,19,20].
A significant amount of research work has been carried out in the prediction of atmospheric pollutants all around the world. Some of the methods used in this field include land use regression [21,22,23], satellite remote sensing [24,25,26,27], artificial neural networks [28,29,30,31], deep learning [32,33,34,35], and machine learning [36,37,38,39]. One classical statistical method, ARIMA, and its hybrid models have often been adopted and applied to outdoor air pollution prediction, such as PM10 [40], PM2.5 [41], O3 [42], CO [43], NO2 [44], and SO2 [45] prediction. Most of the above studies were conducted at the urban scale for short-term air pollutant prediction [46] due to the difficulty of data collection [47] and the many factors affecting air pollution prediction [48]. Regional and even national air pollutant prediction methods and their results are very useful and valuable for policymakers and stakeholders in the implementation of their work.
In China, it is noteworthy that forecasting efforts using simple and practical statistical models to predict air pollutant levels in provincial areas are relatively rare. Taking the prediction of atmospheric pollutants in Hunan Province as the object, this study satisfied the urgent need for accurate prediction models of atmospheric environmental quality in governmental decision-making departments so as to effectively solve the conflict between economic development and air pollution control [18,20,49]. Therefore, the main objective of this study is to use the autoregressive integrated moving average model (ARIMA) to predict the levels of air pollutants in Hunan Province, which not only fills the current gap in air pollution prediction by a simple statistical model but also provides useful information and a simple prediction method for decision-making by the governmental administration.
This study is significant because it makes a notable contribution, especially by filling the relevant research gap by predicting the atmospheric environmental quality in Hunan Province, China [50,51,52]. In addition, this study adopted the ARIMA statistical model, which not only helps policymakers to make decisions but also establishes a benchmark for future air pollution control targets. Through in-depth analyses, this study presents valuable insights that provide policymakers and environmental stakeholders with prediction methods to effectively mitigate air pollution. The paper is well structured, starting with an introductory section, followed by the construction of the database and methodology, the presentation of the prediction results and discussion, and finally the conclusion, which suggests potential future research directions.

2. Materials and Methods

2.1. Study Area

Hunan Province (108°47′~114°15′ E, 24°38′~30°08′ N) is located in the central region of China, in the transition zone from the Yunnan–Guizhou Plateau to the Jiangnan Hills and the Nanling Mountains to the Jianghan Plain, spanning the Yangtze River and Pearl River systems, with a subtropical monsoon climate, cold winters and hot summers, variable spring temperatures, steep autumn temperatures, rainy springs and summers, and dry autumns and winters. The average precipitation for many years has been 1450 mm, the average annual temperature is generally 16 to 19 °C, and the annual frost-free period is 253–311 days. Hunan Province is a major province in the central region of China; the total economic output is located in the country’s top ten, and with modern petrochemicals, green mining, food processing, light industry and textile, engineering machinery, and rail transport equipment industries, ecological and environmental pollution are more serious. In recent years of carrying out the work of air pollution control, Hunan Province has invested a lot of human and material resources, although the effect of governance has improved significantly, but O3 and other atmospheric indicators show a year-on-year upward trend. The prevention and control of air pollution need continued investment and attention.

2.2. Data Sources

The daily data of air pollutant parameters (PM10, PM2.5, O3, SO2, NO2 and CO) in the 14 cities of Hunan province from 1 January 2016 to 31 August 2024 were obtained from the Hunan Provincial Environmental Monitoring General Station and reviewed for validity.

2.3. Research Methods

2.3.1. Data Pre-Processing

Six air pollutants (PM10, PM2.5, O3, SO2, NO2 and CO) were analyzed using the mean and standard deviation methods for data pre-processing [48]; see Formulas (1) and (2).
x ¯ = 1 n i = 1 n x i
s = i = 1 n x i x ¯ 2 n 1
where xi is original data, x ¯ is the mean value of xi; s is standard deviation of xi; and n is the data length.
Due to some of the missing data in the study, the six air pollutant parameters are missing to a very small extent; missing data are used in IBM SPSS Statistics 22.0 “proximity of the point of linear trend” interpolation to make up for this, and the maximum value, the minimum value, the mean value, the outlier, the standard deviation and other data characteristics of the dataset during 2016–2023 were analyzed and treated using Microsoft Excel 2021, the details of which are shown in Table 1.

2.3.2. ARIMA Model

ARIMA is one of the most common time series forecasting analyses in statistical modelling [53]. ARIMA is the model created by transforming a non-stationary time series into a stationary time series and then regressing the dependent variable only on its lagged value and on the present and lagged values of the random error term [54]. ARIMA’s basic principle is to consider the data series of the predicted object over time as a random sequence and use a certain mathematical model to approximate the description of this sequence. The ARIMA model, once identified, can predict the future values from the past values of the time series, as well as the present values. The ARIMA model consists of an autoregressive process AR(p), a moving average process MA(q), an autoregressive moving average process ARMA(p,q), and an integrated moving average autoregressive process ARIMA(p,d,q), depending on whether or not the original series is smooth and on the portion included in the regression. The basic steps of ARIMA modelling are shown in Figure 1.
The smooth series, after differencing the series, can be fitted for prediction using the ARIMA model, which is mathematically described as Formula (3):
d y t = θ 0 + i = 1 p i d y t 1 + j = 1 q θ j ε i 1
where yt is the original time series and ∆dyt denotes the smooth series of yt after d differencing. εi denotes the zero-mean white noise random error series. ∅i (i = 1, 2, …, p) and θj (j = 1, 2, …, q) are the model parameters, and p and q are the model orders.

3. Results and Discussion

3.1. Evaluation of the Quality of Atmospheric Environment in Hunan Province

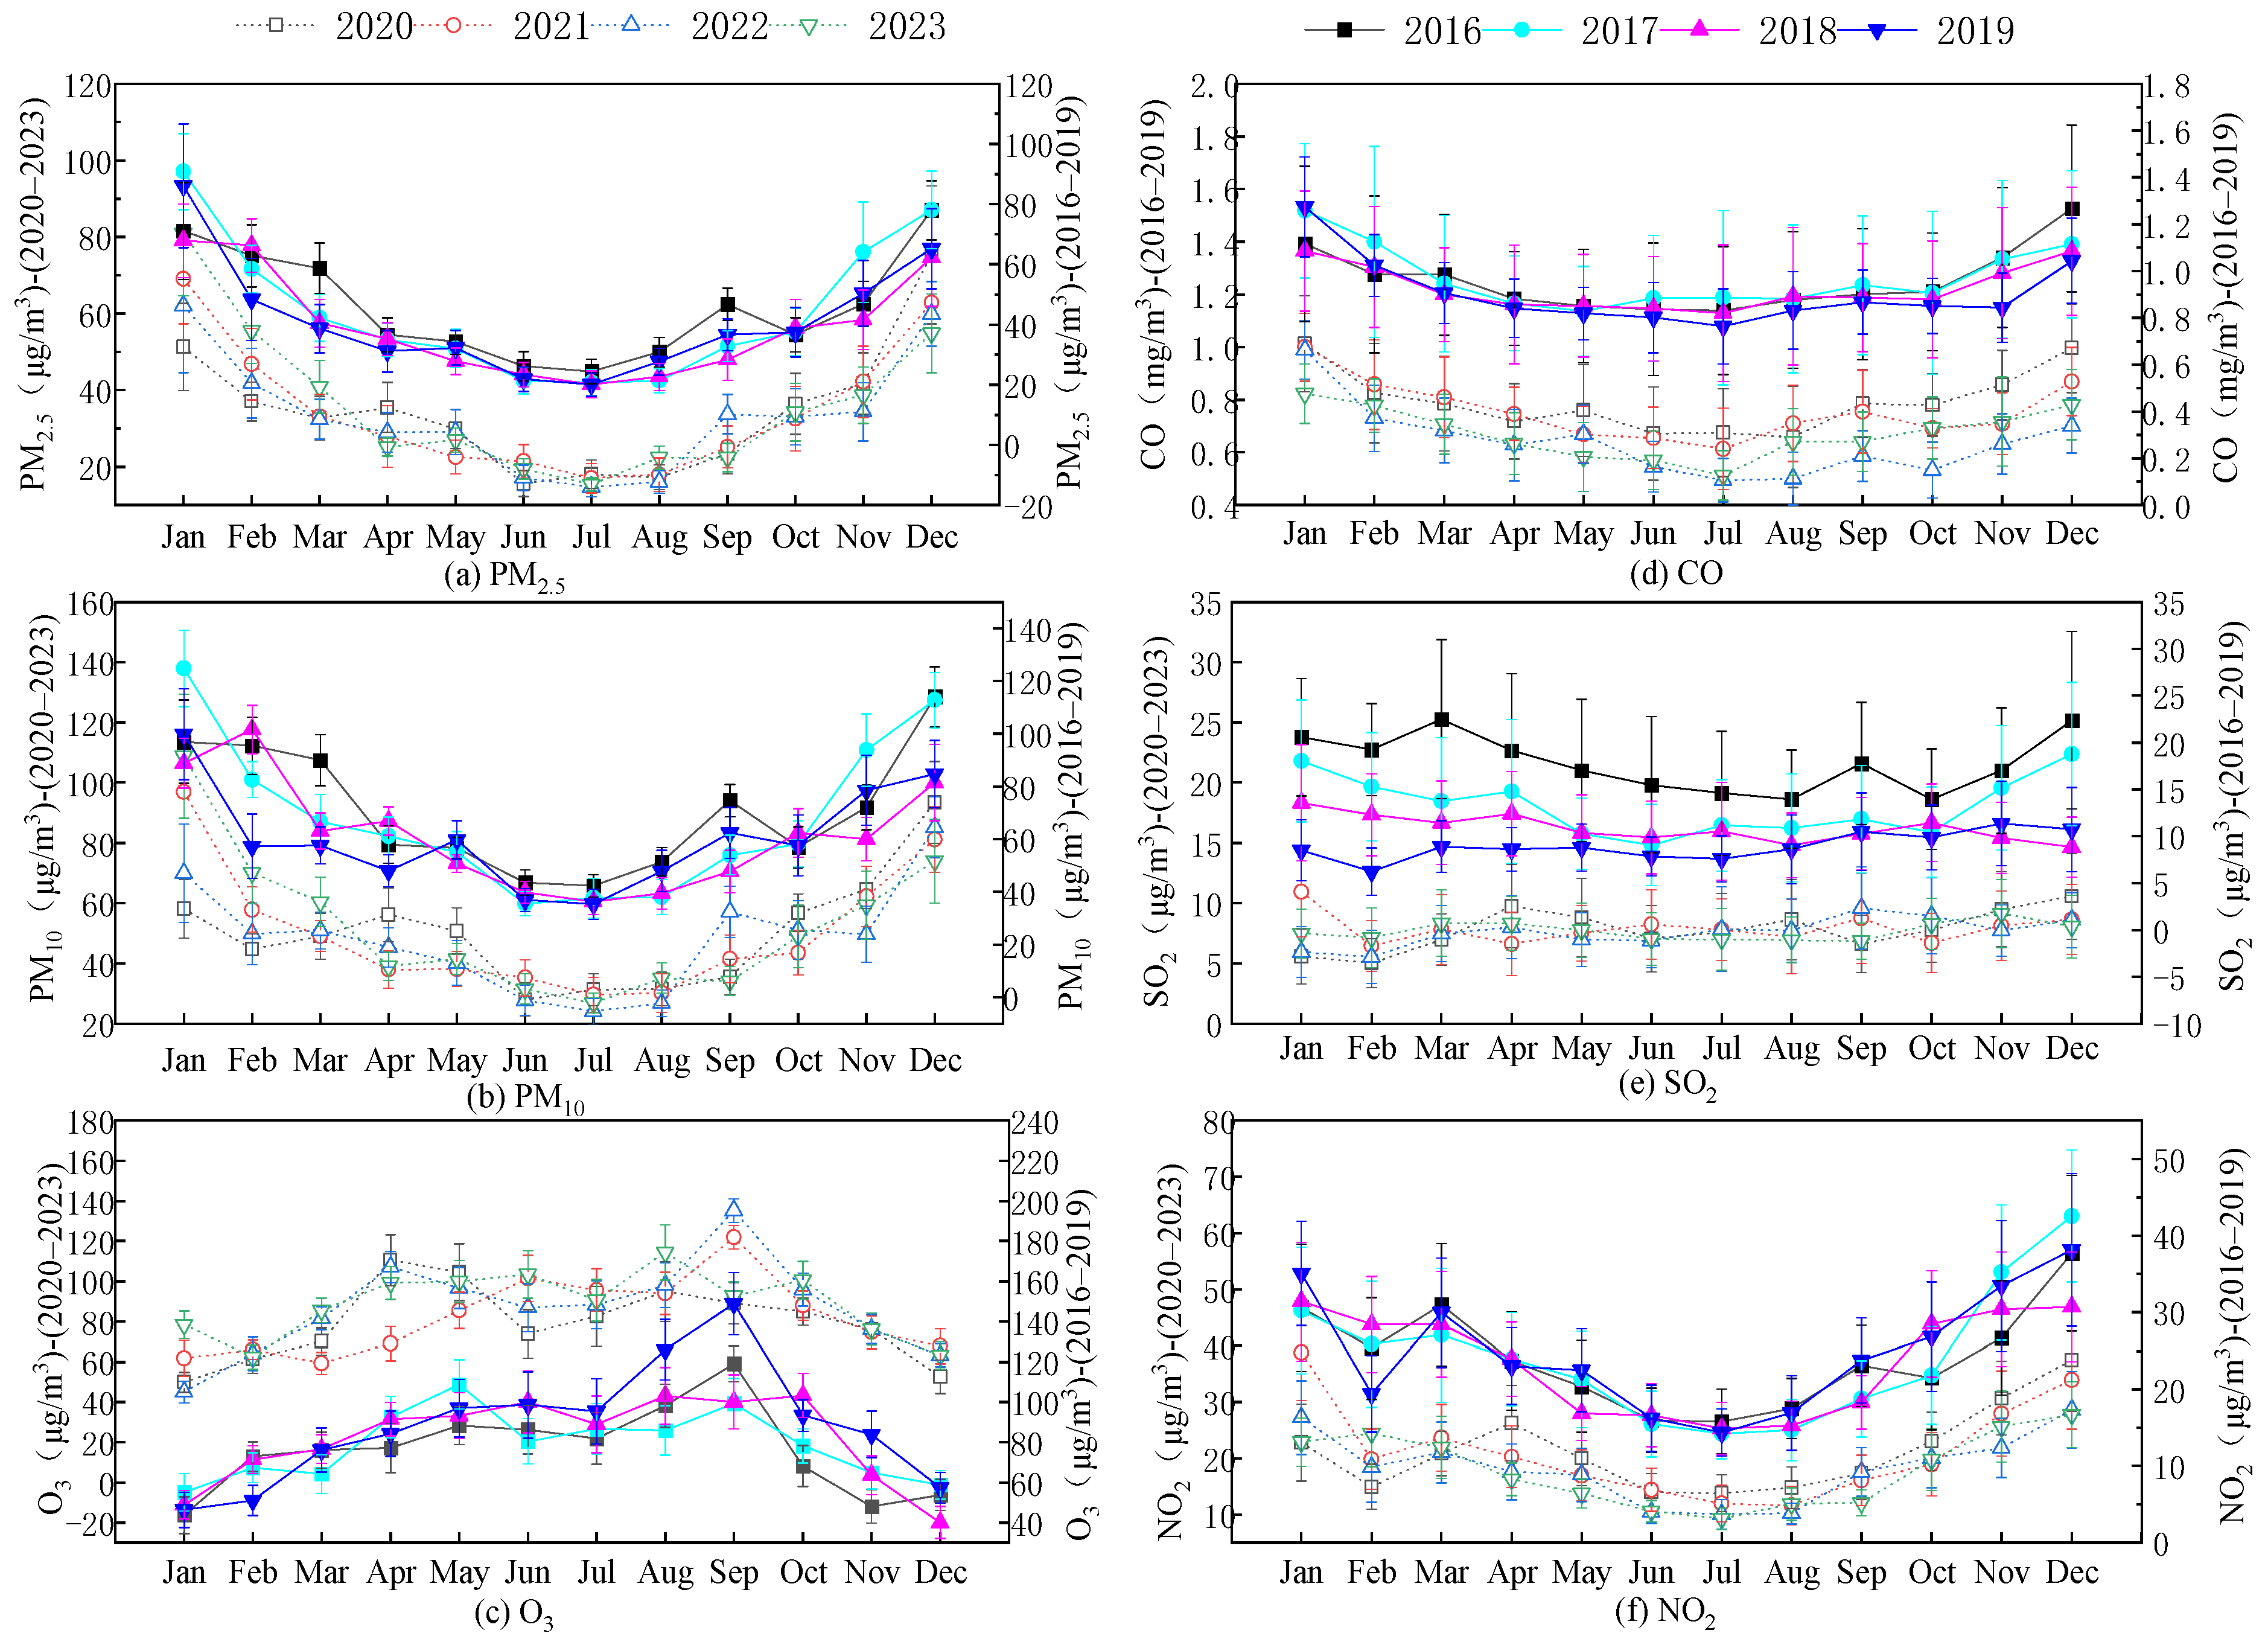
The trend of major air pollutants in Hunan Province from 2016 to 2023 is shown in Figure 2, in which the parameters of PM10, PM2.5, SO2, NO2, and CO show a decreasing and then increasing trend with the increase in months, and the parameter of O3 shows an increasing and then decreasing trend with the increase in months. Meanwhile, in order to show the effect of seasonal changes on the main air pollutants, the sample data were tested and analyzed using the mean square deviation method, as shown in Table 1, in which the traditional seasonal divisions were used: March–May, June–August, September–November, and December–February as spring, summer, autumn, and winter, respectively [55].
As shown in Table 2 and Figure 2, the monthly change curves of PM10, PM2.5, SO2, NO2, and CO, basically show a “V”-shaped distribution, which is low in spring and summer and high in autumn and winter; On the contrary, the monthly change curve of the O3 pollutant shows an “M”-type distribution, which is low in summer and high in spring, autumn, and winter. As the main pollutants in Hunan Province, particulate matter (PM10 and PM2.5) and O3 show the phenomenon of the two being inversely proportional to each other. During the period of 2016–2023, the changes in the annual mean values of the main air pollutants (PM10, PM2.5, SO2, NO2 and CO) show a decreasing trend over the year, and it is worth mentioning that the changes in the annual mean values of O3 show an increasing trend year by year. This phenomenon may be due to the fact that high levels of particulate matter (PM10 and PM2.5) promote the refraction and scattering effects of sunlight, which to some extent accelerate the photochemical reaction of O3 and indirectly contribute to the decrease in the O3 pollution level.
In summary, the overall atmospheric environmental quality in Hunan Province from 2016 to 2023 shows a year-on-year decreasing trend, and the trend of the atmospheric environmental quality index (AQI) is shown in Figure 3, with a concave non-linear distribution of the monthly AQI curve from 2016 to 2023, and the inter-annual and monthly trend of the AQI value varies greatly, showing a gradual decreasing trend over the years [16]. It can be seen that the environmental protection investment of the local government departments and industrial enterprises has been effective in promoting the improvement in atmospheric environmental quality in Hunan Province of China over the years [37].

3.2. Predicted Results of Atmospheric Quality

3.2.1. Construction of ARIMA Models

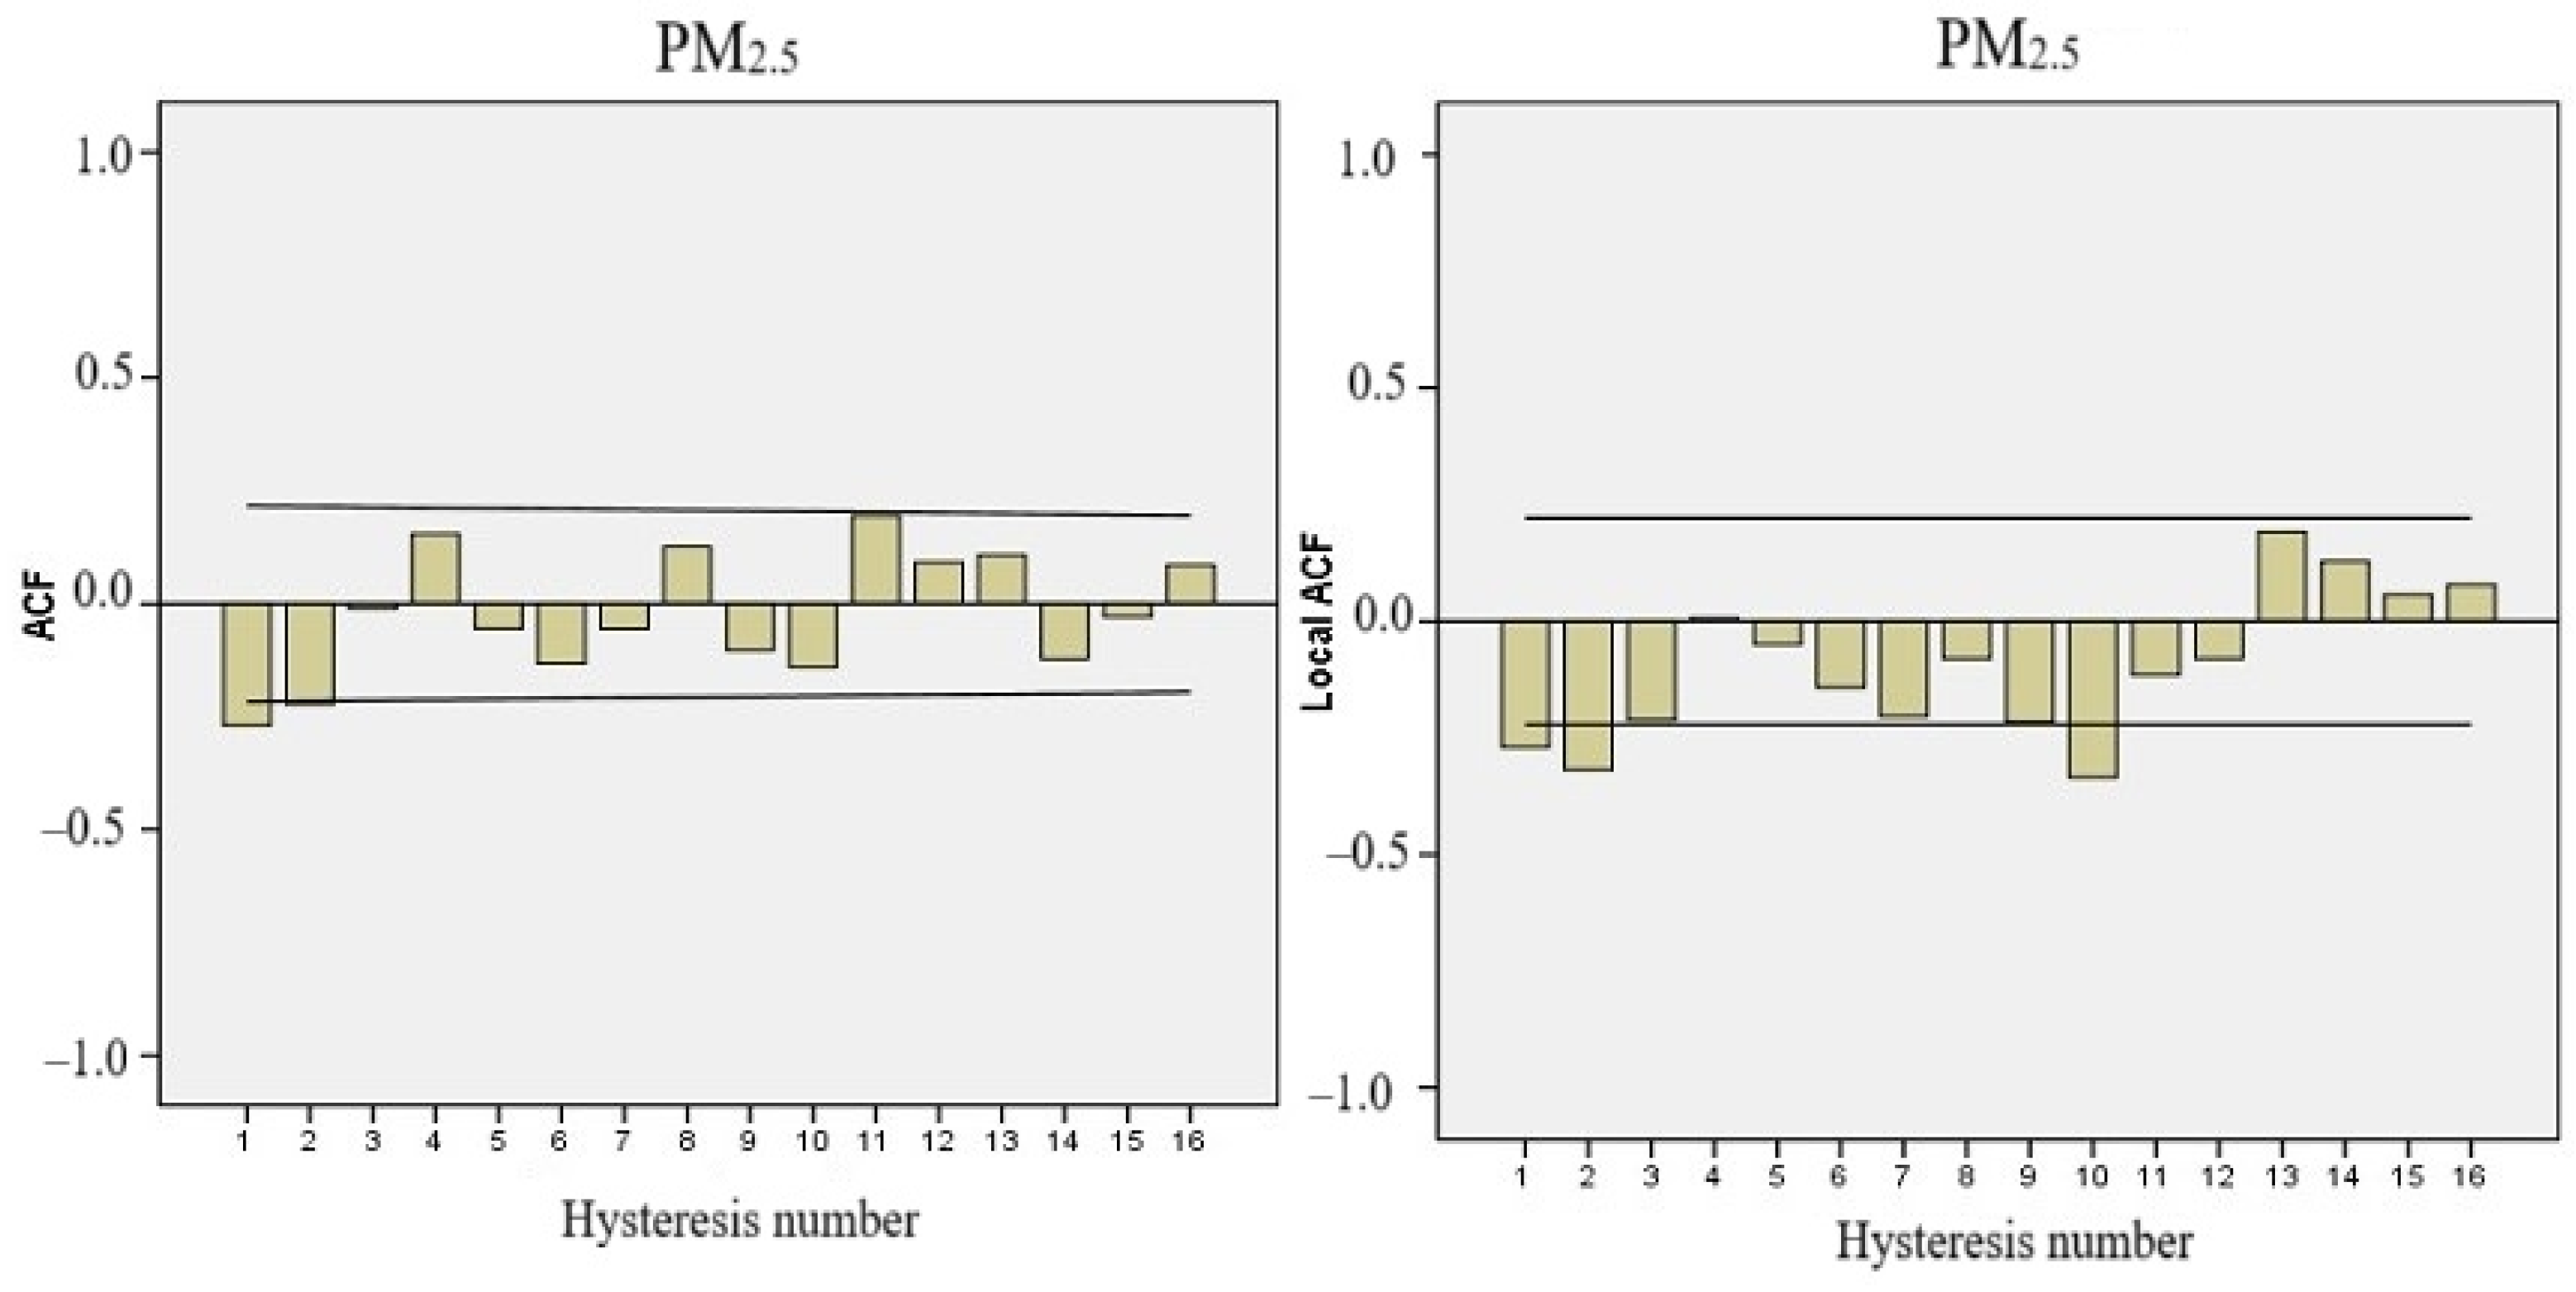
Combined with the characteristics of relatively stable ambient air quality and sufficient data, the ARIMA model was used to predict and analyze the monthly average concentrations of air pollutants, such as PM10, PM2.5, O3, SO2, NO2, and CO, for the period of 2016–2023 in Hunan Province. Before modelling, it is necessary to set the order of the ARIMA (p,d,q) model; firstly, one analyzes whether the time change law of the parameters is smooth or not through the time series and then determines the value of the d order; secondly, based on the nature of the ARIMA model, the partial autocorrelation plot of the ARIMA (p,q) model has the property of truncation of the p order; thirdly, the autocorrelation plot has the property of dragging the tail of the q order according to the nature of the autocorrelation plot with the partial autocorrelation; finally, the order of the model is determined based on the trailing and truncated tail nature of the autocorrelation and partial autocorrelation plots. Taking the fixed order of ARIMA model of PM2.5 as an example, firstly, it is clarified that the time series of PM2.5 has temporal smoothness at the order of 0, and secondly, PM2.5 has autocorrelation and partial autocorrelation at the order of 2 (see Figure 4), so the order of the constructed model is set to be ARIMA (2,0,2), and then mathematical modeling and prediction are carried out by using the SPSS 22 software [56].
According to the order of the time series smoothness, the order of autocorrelation plot, and the partial autocorrelation plot elimination, PM10, PM2.5, O3, NO2, SO2, and CO were subjected to a fixed order and a t-test, and the results are shown in Table 3.
According to the modelling and model test results of the main air pollutants in Hunan Province shown in Table 3, the R2 values of the above six parameters varied within the range of 0.697~0.918, indicating that the constructed ARIMA models of the six air pollutants achieved good simulation results, and at the same time, the test p-value was greater than 0.05, which indicated that the data series of the six air pollutants were non-linear and non-stationary. SPSS 22 software was used to fit and train the model on the monthly data from 2016 to 2023, and the numerical changes in the six air pollutants had a strong temporal sequence, there were obvious seasonal changes in each year, and, considering this situation, different seasonal models were used in the prediction to set the order and prediction.

3.2.2. The Predictive Results Based on the ARIMA Model

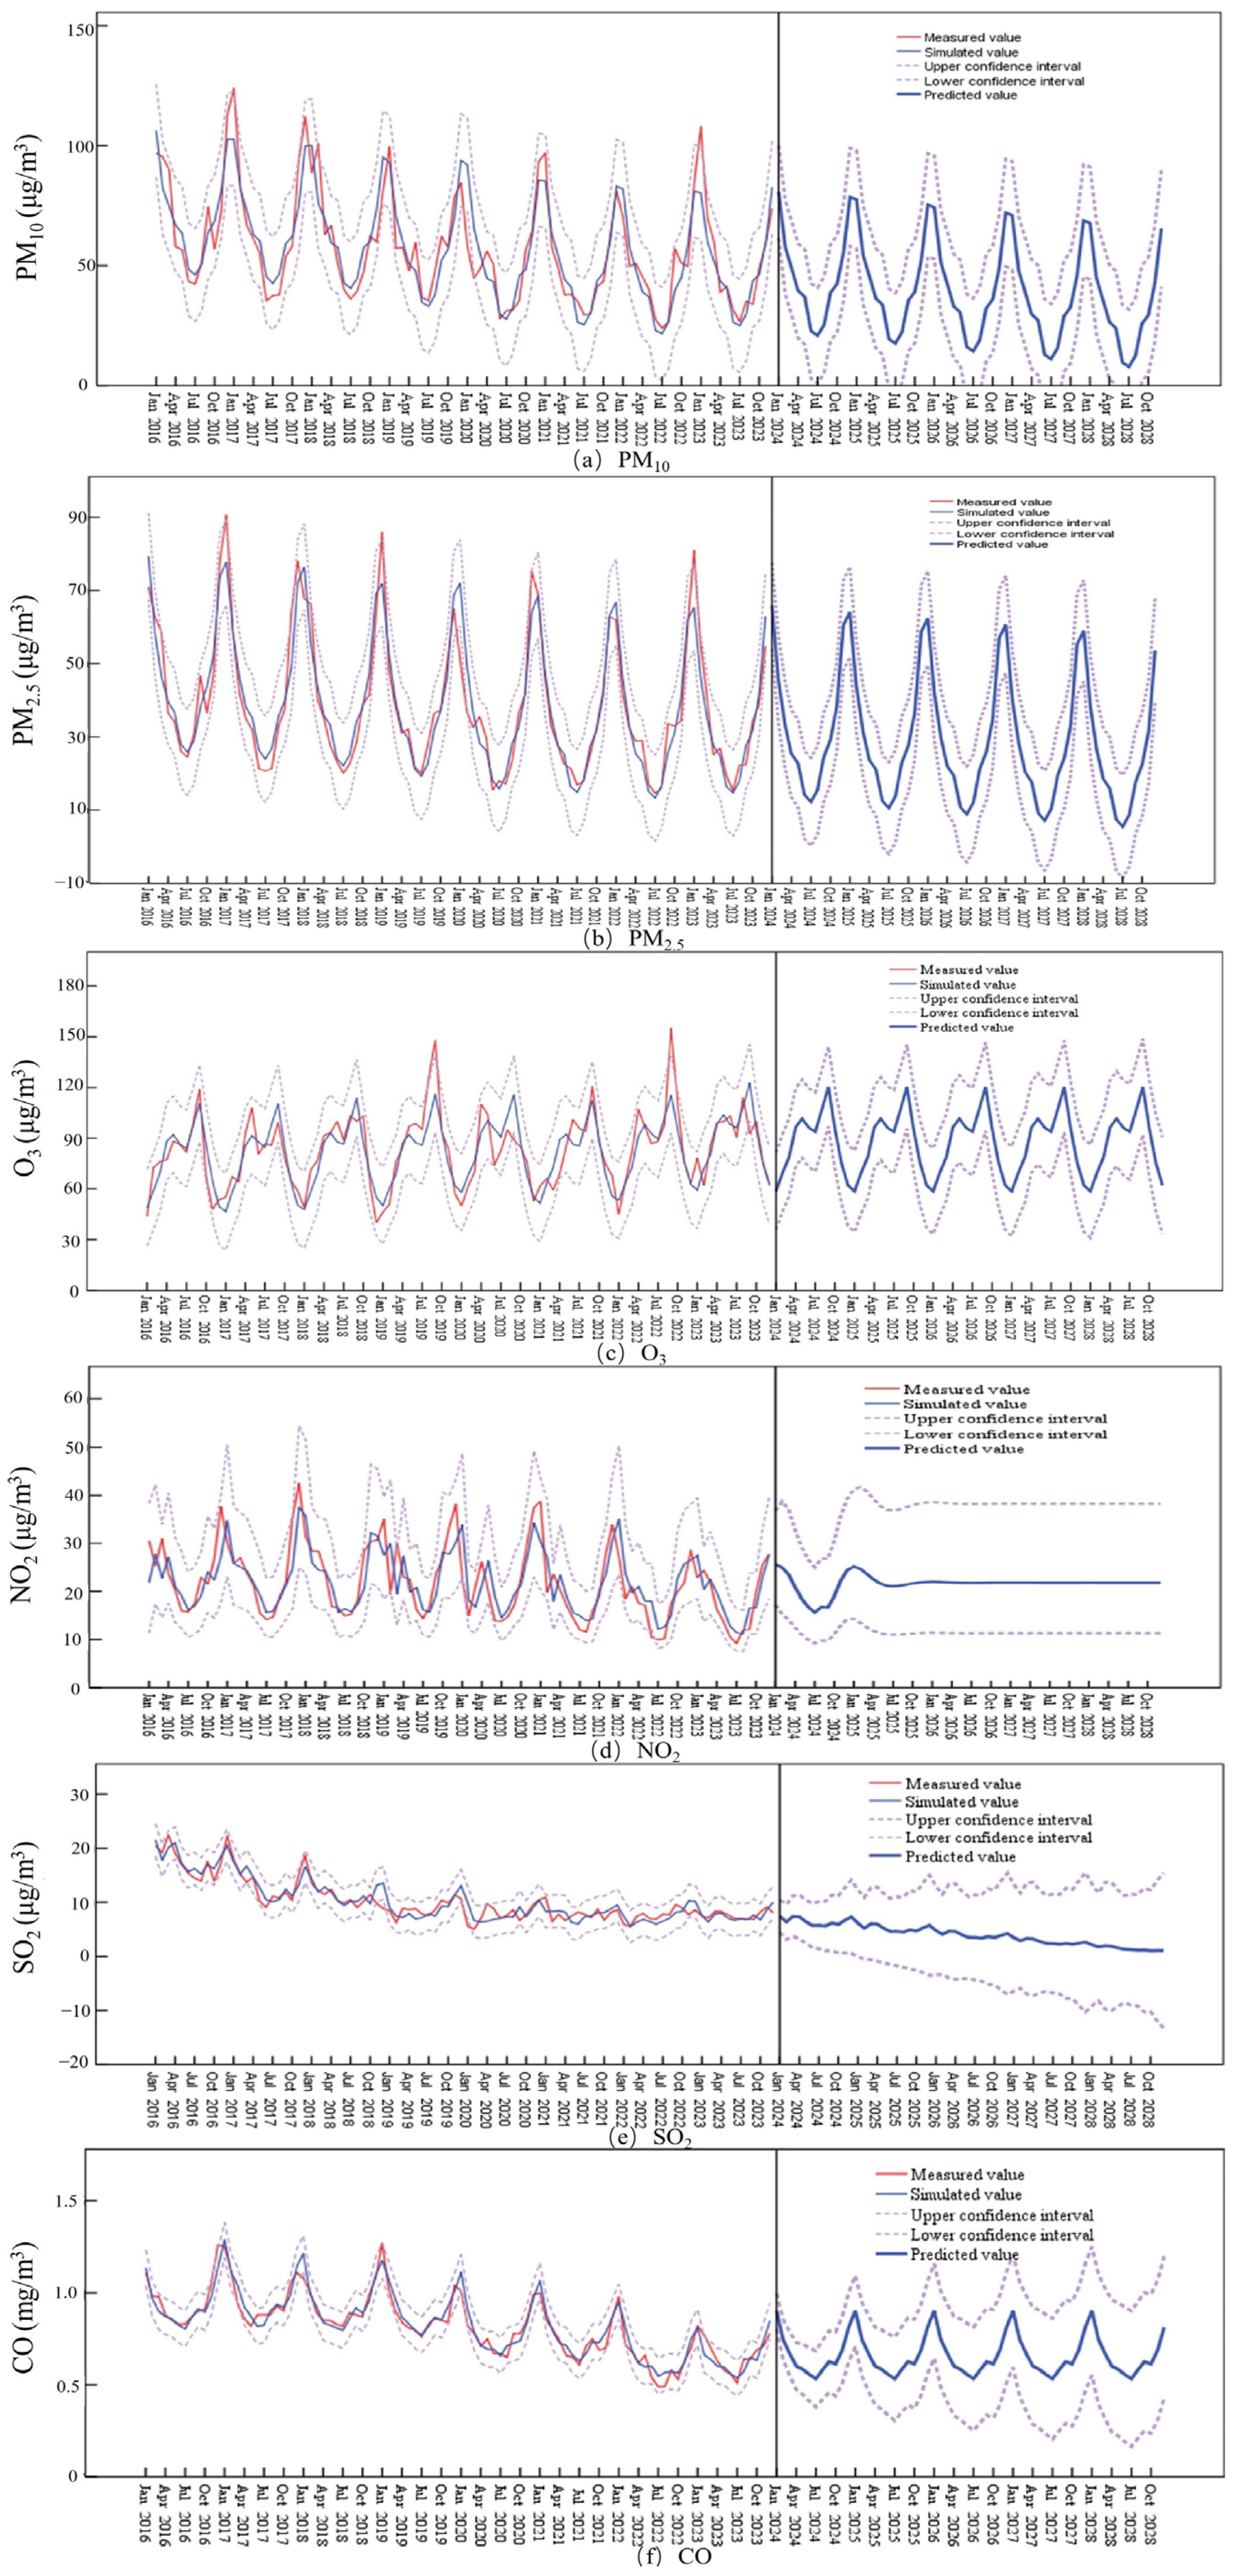
Based on the historical data of atmospheric pollutants in Hunan Province from 2016 to 2023, the corresponding ARIMA models were constructed, and then the trends of air pollutants were predicted from 2024 to 2028, as shown in Figure 5. It is obvious that, except for NO2 and SO2, the prediction results of the remaining air pollutants still have obvious seasonality.
(1)
Prediction curves of PM2.5 and PM10
Particulate matter parameters are largely indicative of the quality of the atmospheric environment, and the predicted results of particulate matter parameters can provide useful information about air pollution control measures and strategies. The Class I/II standards of ambient air quality for PM10 and PM2.5 in China are 40/70 μg/m3 and 15/35 μg/m3 (annual average values).As shown in Figure 5a,b, the predicted annual average values of PM10 and PM2.5 were maintained at 32.7–45.7 μg/m3 and 25.5–32.3 μg/m3, respectively, which satisfies the Class II standard of ambient air quality standards for China (PM10 ≤ 70 μg/m3 and PM2.5 ≤ 35 μg/m3).Although PM2.5 and PM10 show a clear trend of seasonal fluctuations during 2016–2023, the actual annual average values of these two parameters are decreasing with the years; the predicted curves of PM2.5 and PM10 during the period of 2024–2028 likewise show regular seasonal changes, and their predicted annual averages show a decreasing trend over the years.
(2)
Prediction curve of O3
From Figure 5c, it can be seen that O3 shows an obvious trend of seasonal fluctuation during the period of 2016–2023, but unlike the decreasing trend of particulate matter PM2.5 over the years, the actual annual mean value of O3 increases with the years, and its predicted annual average value fluctuates within 58.6–120.5 μg/m3, which satisfies the Class II standard of ambient air quality standards for China (O3-8 h ≤ 160 μg/m3). The predicted results of O3 during 2024–2028 also show regular seasonal changes, and its predicted annual mean value shows a yearly incremental trend. According to the historical data of air contaminants in Hunan Province from 2016 to 2023, O3 has become the major pollutant other than PM2.5 in Hunan Province, and if this containment can be accurately predicted, it can provide valuable information for policymakers and stakeholders to develop comprehensive and focused interventions.
(3)
Prediction curve of NO2
From Figure 5d, it can be seen that NO2 shows irregular fluctuations during 2016–2023, and the seasonal trend is not obvious; the forecasting plot of NO2 based on the ARIMA model in 2024–2028 is linearly distributed, and its predicted annual average value is maintained at 21.8 μg/m3. According to the historical data of air contaminants in Hunan Province from 2016 to 2023, NO2 is able to stably maintain the Class I standard of ambient air quality standards for China (NO2 ≤ 40 μg/m3), which shows that NO2 is not a key air pollutant that affects the quality of ambient air in Hunan Province.
(4)
Prediction curve of SO2
From Figure 5e, it can be seen that SO2 showed non-linear fluctuations during 2016–2023, and the seasonal trend was not clear, but the annual mean value of SO2 showed a yearly decreasing trend; the predicted results about the annual mean value of SO2 showed a yearly decreasing trend from 2024–2028, with small irregular fluctuations in the local area. Based on the historical data of air pollutants in Hunan Province from 2016 to 2023, SO2 is able to stably maintain the Class I standard of ambient air quality standard for China (SO2 ≤ 20 μg/m3), which shows that SO2 is not a vital air pollutant affecting the quality of the atmospheric environment in Hunan Province.
(5)
Prediction curve of CO
As can be seen from Figure 5f, CO shows more obvious seasonal changes during 2016–2023, and the annual mean value of CO shows a decreasing trend year by year; the predict results for the annual mean value of CO in 2024–2028 show obvious seasonal trends, and the annual mean value basically stays at 0.75 mg/m3. Based on the historical data of the main air pollutants in Hunan Province during 2016–2023, CO can stably maintain the Class I standard of ambient air quality for China (CO ≤ 4 mg/m3). It is inferred that CO is able to stably maintain the Class I standard of the ambient air quality for China [57] (which shows that CO is not a key air pollutant affecting the quality of the atmospheric environment in Hunan Province, China.
Above all, PM10, PM2.5, and O3 are major air pollutants for impacting the ambient air quality of Hunan province; meanwhile, the annual average values of NO2, SO2, and CO are in a relatively safe range. Therefore, when the policymakers develop pollution control decisions, they only need to maintain the original inputs and measures for NO2, SO2, and CO pollution control, but there is an urgent need to pay more attention on the prevention and control of major pollutants PM10, PM2.5, and O3.

3.3. Discussion

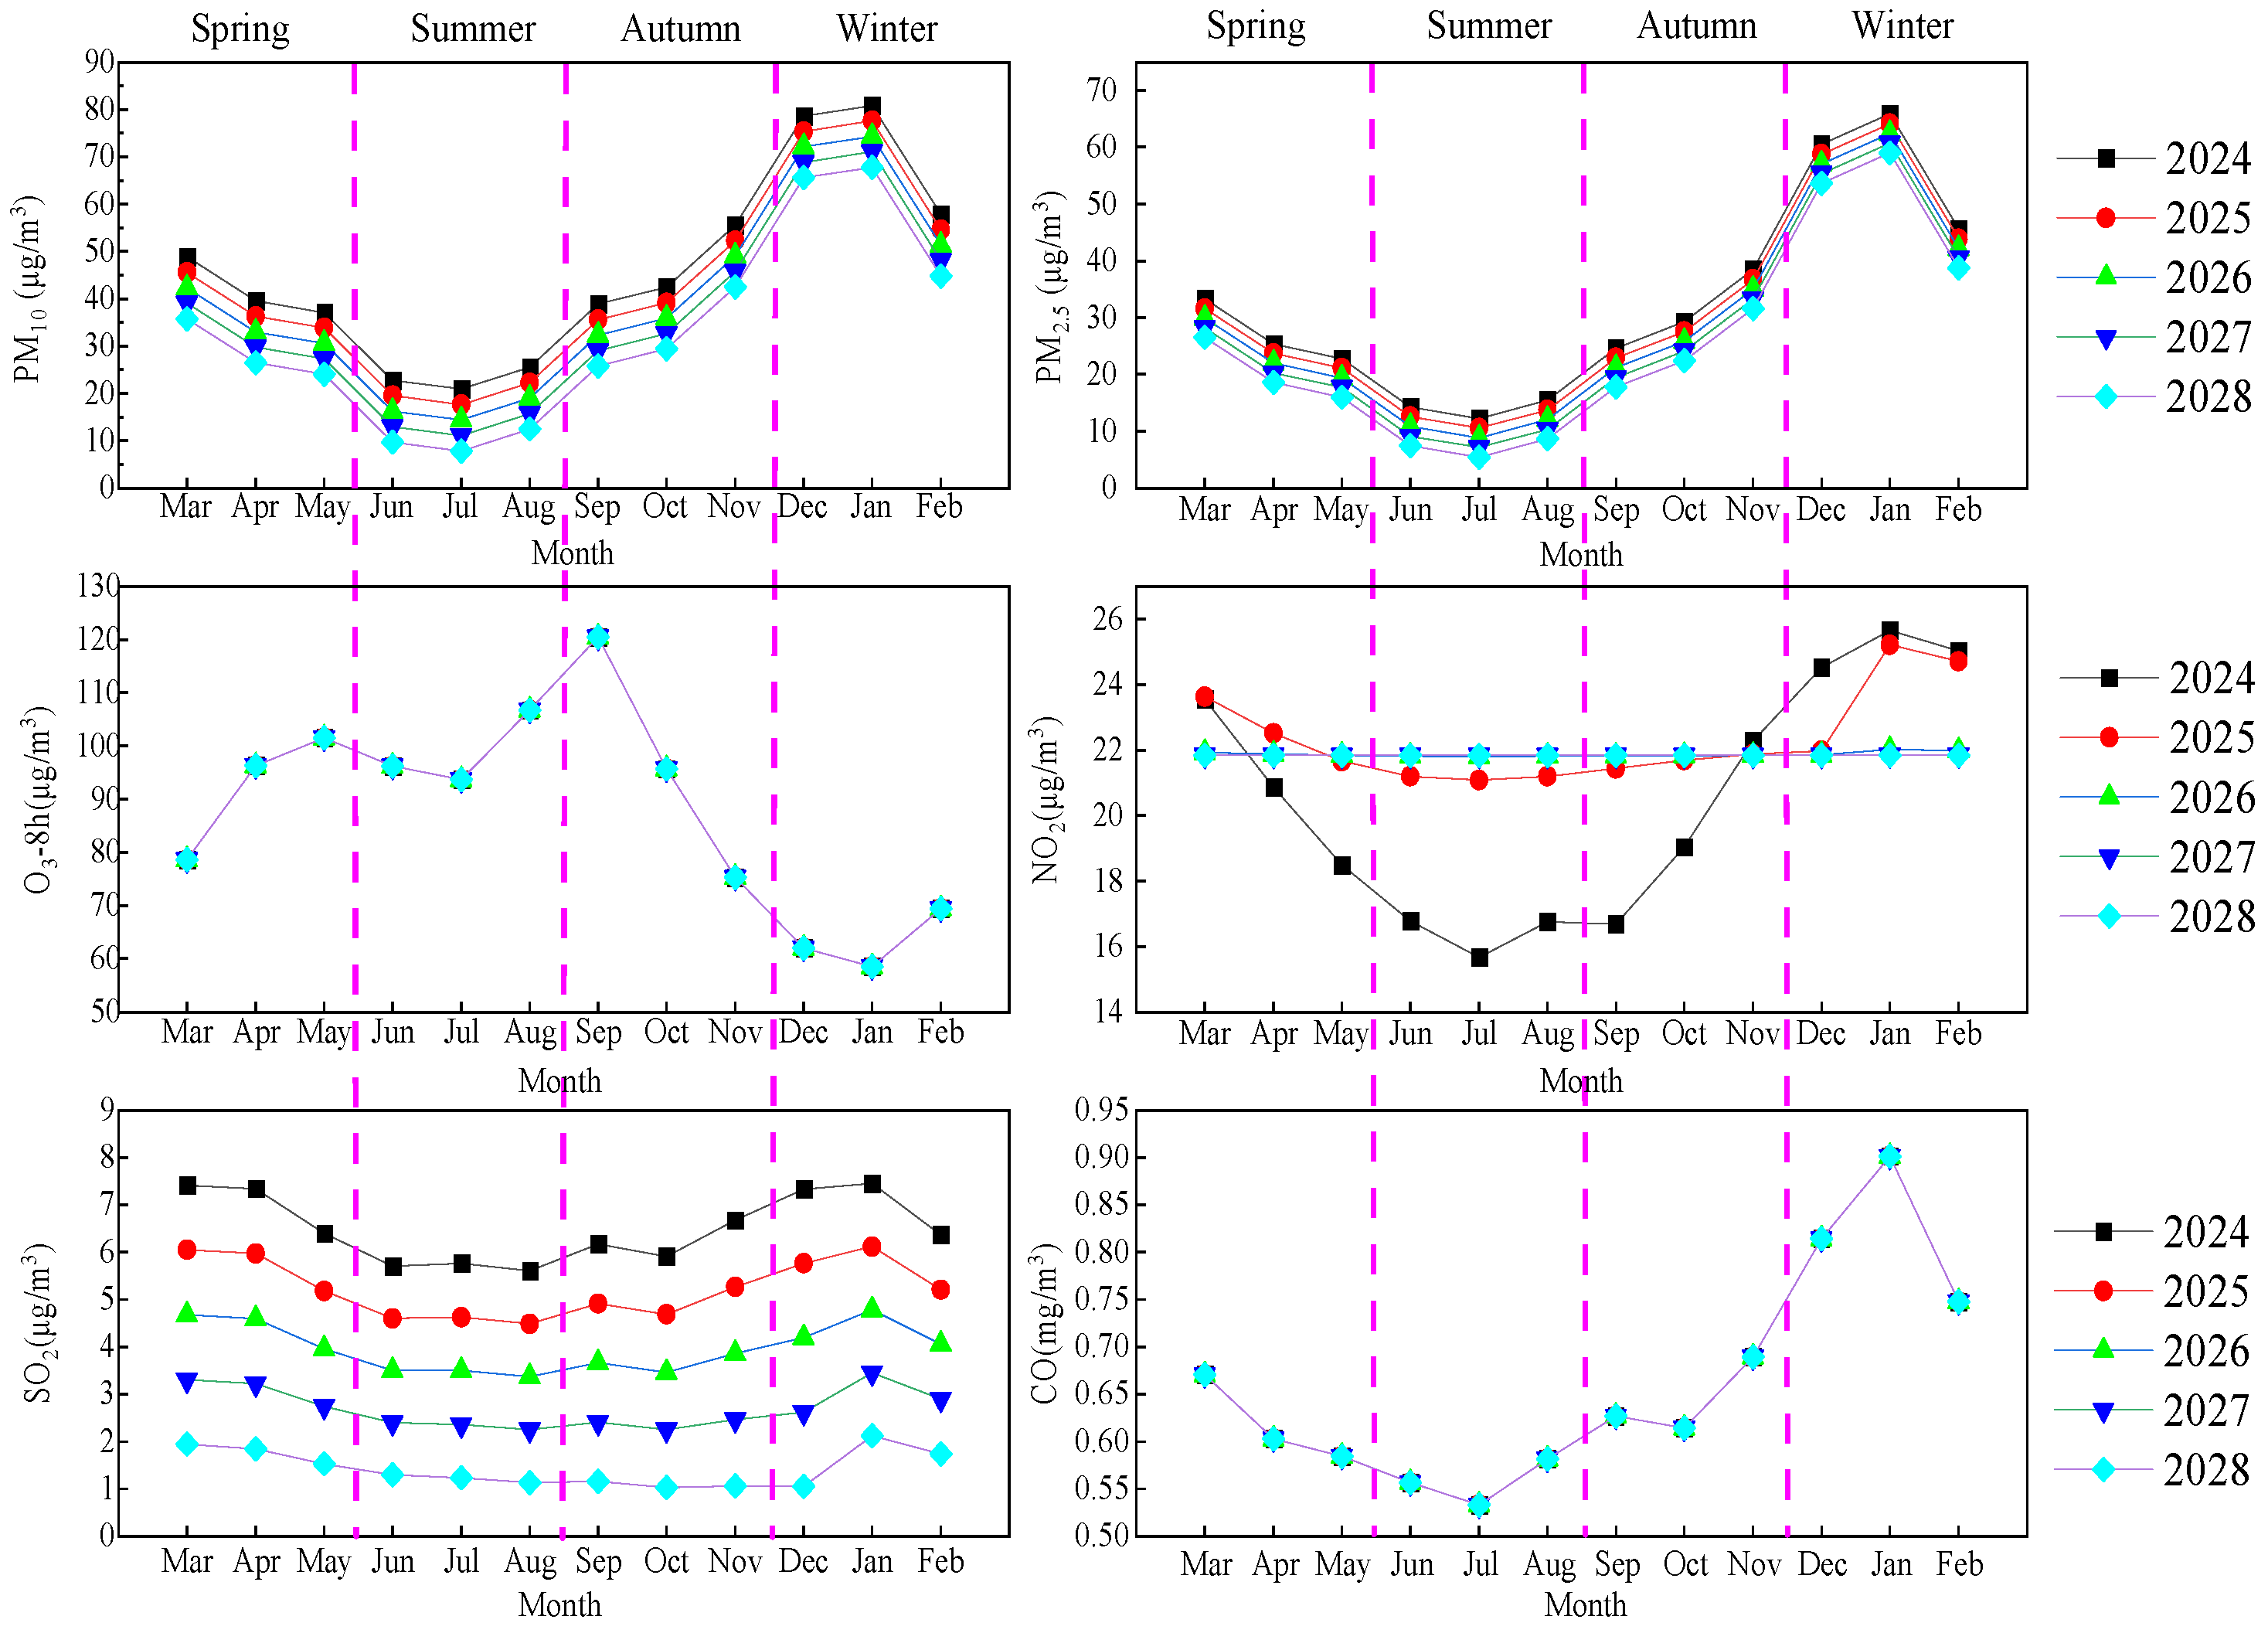
Figure 6 illustrates the monthly trends using the ARIMA model for the period 2024–2028. As can be seen from Figure 6, the inter-monthly trends of PM10 and PM2.5 during the period of 2024–2028 are in the shape of an inverted “N” and show obvious seasonal variations, with the lowest level of particulate matter pollution in summer and the highest in winter; in contrast to the particulate matter parameters, the inter-monthly trends of O3 are almost completely opposite to those of PM10 and PM2.5, and the monthly predicted values of O3 in 2024–2028 do not change with the years. The inter-monthly trend of O3 is almost completely opposite to those of PM10 and PM2.5, showing an M-shape, and the monthly predicted values of O3 in 2024–2028 do not change with the years. The inter-monthly change in NO2 in 2024–2028 is the most distinctive feature, which shows obvious inter-monthly changes in 2024–2025, with the lowest NO2 concentration in summer and the highest NO2 concentration in winter. Meanwhile, the inter-monthly fluctuation trend of NO2 disappeared in 2026–2028, and the monthly predicted value of NO2 remained at 21.8 μg/m3 for the whole year. The inter-monthly change of SO2 was less fluctuating; it mainly showed the characteristics of low in summer and autumn, and high in spring and winter, and its monthly predicted value showed a decreasing trend over the year. In addition, the inter-monthly trend of CO during 2024–2028 was almost the same as that of the particulate matter parameters, with the difference that the monthly predicted value of CO remains unchanged during 2024–2028.
As shown in Table 4, during the period of 2024–2028, PM10, PM2.5, NO2, and SO2 show a decreasing trend over the years, but the predicted annual mean values of O3 and CO remain unchanged, which are maintained at 87.9 μg/m3 and 0.7 mg/m3, respectively. This phenomenon implies that the ARIMA model is insufficient for predicting the changes in O3 and CO in Hunan Province, and it is difficult for it to effectively predict the development trend of O3 and CO. According to the classification standard of ambient air quality standard for China [57], PM10, PM2.5, and O3 have reached the Class II standard stably, and the remaining indicators (NO2, SO2 and CO) were satisfied the Class I standard. It is worth mentioning that although the predicted value of O3 can meet the requirements of the Class II standard and even satisfies the Class I standard in the spring and winter of Hunan province, the measured value of O3 from 2016 to 2023 shows an increasing trend year by year, which is likely to be related to the decreasing concentration of PM2.5 over the years and the phenomenon of these two parameters (particle matter and O3) appearing to be inversely related to each other. With PM2.5 and PM10 decreasing over the years, O3-induced air pollution in the Hunan province region shows a yearly aggravating trend, and monthly predicted values of O3-8 h between 2024–2028 met the O3 limit value of the Class I ambient air quality standard (100 μg/m3) in most months, but it surpassed 100 μg/m3 in the summer and autumn of Hunan province, which only satisfied the Class II ambient air quality standard (160 μg/m3). In contrast, the CO parameter has a large gap between the predicted value (0.7 mg/m3) and the ambient air quality Class I standard (4.0 mg/m3), and the annual average value of CO between 2016–2023 is decreasing year by year, even though the forecasted trend of CO predicted by the ARIMA model only reflects seasonal fluctuations and inter-monthly differences, but the annual average value of CO in 2024–2028 should be maintained at the level of 0.7 mg/m3.
The decrease in PM10 and PM2.5 concentrations is conducive to the improvement in the overall air quality in Hunan Province, and the yearly increase in the O3 concentration represents the potential danger of ozone air pollution in Hunan Province falling from the Class I to Class II ambient air quality standard. In summary, PM10, PM2.5, and O3 will be the focus of air pollution prevention and control work in Hunan Province in the future. During the period of 2024–2028, Hunan Province should focus on the changes in the concentrations of PM2.5 and O3; increase the prevention of, control of, and reduction in the fine particulate matter-emitting industries and ozone precursor-emitting industries; strengthen the synergistic control of ozone and particulate matter; improve the joint prevention and control technology among government departments; cultivate the awareness of environmental protection responsibility among enterprises and residents [1]; improve the mass supervision mechanism [20]; and effectively improve the environmental and atmospheric governance ecosystem [58,59].

3.4. Model Validation

The accuracy of results for air pollutants for the period of January–August 2024 are supplied in Table 5 and were obtained by computing the difference between practical indicators and predicted indicators. As shown in Table 5, most of the indicators have a good accuracy except the NO2 and O3 indicators. This is mainly due to the fact that the R2 values of the ARIMA model for NO2 and O3 were below 0.8. It can be seen that to improve the accuracy of the ARIMA model predictions of O3 and NO2, the subsequent construction of combined ARIMA models with other machine learning methods is needed to improve their accuracy and applicability. In summary, the prediction method based on the ARIMA model is simple and convenient, and it can be widely used in outdoor air quality assessment and monitoring.

4. Conclusions

(1)
The forecasting results of PM10, PM2.5, SO2, and CO were developed well with an R2 of 0.817~0.918 based on ARIMA model; meanwhile, the forecasting results of NO2 and O3 were less than satisfactory with an R2 of 0.697~0.723.
(2)
During the period of 2016–2023, the ambient air quality of Hunan province was maintained at a Class II range (AQI = 51–100). Meanwhile, PM10, PM2.5, and O3 in Hunan Province stably matched the Class II standard of ambient air quality for China; the rest of other air pollutants met the Class I standard.
(3)
PM10 and PM2.5 are major air containments for impacting the ambient air quality of Hunan Province; meanwhile, O3 is an air pollutant of major concern in the near future for Hunan Province; the contamination levels of NO2, SO2, and CO are in relatively safe ranges.
(4)
The ARIMA model prediction method is simple and convenient, and it can be widely used in outdoor air quality assessment.

Author Contributions

W.G. contributed to the conceptualisation, methodology development, data curation and analyses, visualization, and original manuscript drafting. T.X. contributed to the methodology development, resource allocation, data curation and analyses, and reviewing the manuscript. L.Z. contributed to data curation and analyses and reviewing the manuscript. H.L. contributed to funding acquisition and reviewing the manuscript. S.G. contributed to the conceptualisation, project administration, and reviewing the manuscript. All authors have read and agreed to the published version of the manuscript.

Funding

This research was funded by Hunan Provincial Department of Education (HNJG-2022-0212).

Data Availability Statement

The data presented in this study are available on request from the corresponding author.

Conflicts of Interest

The authors declare no conflicts of interest.

Abbreviations

The following abbreviations are used in this manuscript:
ARIMAAutoregressive integrated moving average
AQIAir quality index
PM10Respirable particulate matter
PM2.5Fine particulate matter
O3-8 hAverage of the maximum consecutive eight-hour ozone concentration in 24 h daily

References

  1. Gu, C.; Hu, L.; Cook, I.G. China’s urbanization in 1949–2015: Processes and driving forces. Chin. Geogr. Sci. 2017, 27, 847–859. [Google Scholar] [CrossRef]
  2. Gu, C. Urbanization: Processes and driving forces. Sci. China-Earth Sci. 2019, 62, 1351–1360. [Google Scholar] [CrossRef]
  3. Yang, S. The specific historical process of urbanization in China. Vopr. Istor. 2023, 1, 172–179. [Google Scholar] [CrossRef]
  4. Goldstone, J.A. The New Population Bomb The Flour Megatrends That Will Change the World. Foreign Aff. 2010, 89, 31–42. [Google Scholar]
  5. Ding, X.; Zhong, W.; Shearmur, R.G.; Zhang, X.; Huisingh, D. An inclusive model for assessing the sustainability of cities in developing countries—Trinity of Cities’ Sustainability from Spatial, Logical and Time Dimensions (TCS-SLTD). J. Clean. Prod. 2015, 109, 62–75. [Google Scholar] [CrossRef]
  6. Han, B.; Ma, Z.; Liu, Y.; Wang, M.; Lin, Y. Effect of Urban-Rural Income Gap on the Population Peri-Urbanization Rate in China. Land 2021, 10, 1255. [Google Scholar] [CrossRef]
  7. Zhang, H.; Ma, R.; Cui, L.; Tian, G.; Ma, Z. Exploring the impacts of energy and environmental constraints on China’s urbanization process. Comput. Ind. Eng. 2022, 169, 108170. [Google Scholar] [CrossRef]
  8. Zhou, W.-Y.; Yang, W.-L.; Wan, W.-X.; Zhang, J.; Zhou, W.; Yang, H.-S.; Yang, H.; Xiao, H.; Deng, S.-H.; Shen, F.; et al. The influences of industrial gross domestic product, urbanization rate, environmental investment, and coal consumption on industrial air pollutant emission in China. Environ. Ecol. Stat. 2018, 25, 429–442. [Google Scholar] [CrossRef]
  9. Gryech, I.; Asaad, C.; Ghogho, M.; Kobbane, A. Applications of machine learning & Internet of Things for outdoor air pollution monitoring and prediction: A systematic literature review. Eng. Appl. Artif. Intell. 2024, 137–143, 109182. [Google Scholar] [CrossRef]
  10. Shen, L.; Shuai, C.; Jiao, L.; Tan, Y.; Song, X. Dynamic sustainability performance during urbanization process between BRICS countries. Habitat Int. 2017, 60, 19–33. [Google Scholar] [CrossRef]
  11. Xu, W.; Yao, L.; Fu, X.; Wang, Y.; Sun, S. Response of PM2.5 variations to changing urbanization process in different climatic backgrounds of China. Urban Clim. 2022, 45, 101273. [Google Scholar] [CrossRef]
  12. Tang, X.; Chen, X.; Tian, Y. Chemical composition and source apportionment of PM2.5—A case study from one year continuous sampling in the Chang-Zhu-Tan urban agglomeration. Atmos. Pollut. Res. 2017, 8, 885–899. [Google Scholar] [CrossRef]
  13. Dai, S.; Chen, X.; Liang, J.; Li, X.; Li, S.; Chen, G.; Chen, Z.; Bin, J.; Tang, Y.; Li, X. Response of PM2.5 pollution to meteorological and anthropogenic emissions changes during COVID-19 lockdown in Hunan Province based on WRF-Chem model. Environ. Pollut. 2023, 331, 121886. [Google Scholar] [CrossRef] [PubMed]
  14. Chen, X.; Li, X.; Liang, J.; Li, X.; Li, S.; Chen, G.; Chen, Z.; Dai, S.; Bin, J.; Tang, Y. Causes of the unexpected slowness in reducing winter PM2.5 for 2014-2018 in Henan Province. Environ. Pollut. 2023, 319, 120928. [Google Scholar] [CrossRef] [PubMed]
  15. Li, J.; Dai, Y.; Zhu, Y.; Tang, X.; Wang, S.; Xing, J.; Zhao, B.; Fan, S.; Long, S.; Fang, T. Improvements of response surface modeling with self-adaptive machine learning method for PM2.5 and O3 predictions. J. Environ. Manag. 2022, 303, 114210. [Google Scholar] [CrossRef]
  16. Song, Y.; Liu, B.; Chen, X.; Liu, J. Atmospheric Pollution Mapping of the Yangtze River Basin: An AQI-Based Weighted Co-Word Analysis. Int. J. Environ. Res. Public Health 2020, 17, 817. [Google Scholar] [CrossRef]
  17. Chakraborty, D.; Elhegazy, H.; Elzarka, H.; Gutierrez, L. A novel construction cost prediction model using hybrid natural and light gradient boosting. Adv. Eng. Inform. 2020, 46, 101201. [Google Scholar] [CrossRef]
  18. Shi, T.; Hu, Y.; Liu, M.; Li, C.; Zhang, C.; Liu, C. How Do Economic Growth, Urbanization, and Industrialization Affect Fine Particulate Matter Concentrations? An Assessment in Liaoning Province, China. Int. J. Environ. Res. Public Health 2020, 17, 5441. [Google Scholar] [CrossRef]
  19. Wang, J.; He, D. Sustainable urban development in China: Challenges and achievements. Mitig. Adapt. Strateg. Glob. Chang. 2015, 20, 665–682. [Google Scholar] [CrossRef]
  20. Huang, Z.; An, X.; Cai, X.; Chen, Y.; Liang, Y.; Hu, S.; Wang, H. The impact of new urbanization on PM2.5 concentration based on spatial spillover effects: Evidence from 283 cities in China. Sustain. Cities Soc. 2023, 90, 104386. [Google Scholar] [CrossRef]
  21. Basagana, X.; Rivera, M.; Aguilera, I.; Agis, D.; Bouso, L.; Elosua, R.; Foraster, M.; de Nazelle, A.; Nieuwenhuijsen, M.; Vila, J.; et al. Effect of the number of measurement sites on land use regression models in estimating local air pollution. Atmos. Environ. 2012, 54, 634–642. [Google Scholar] [CrossRef]
  22. Rivera, M.; Basagana, X.; Aguilera, I.; Agis, D.; Bouso, L.; Foraster, M.; Medina-Ramon, M.; Pey, J.; Kuenzli, N.; Hoek, G. Spatial distribution of ultrafine particles in urban settings: A land use regression model. Atmos. Environ. 2012, 54, 657–666. [Google Scholar] [CrossRef]
  23. Morley, D.W.; Gulliver, J. A land use regression variable generation, modelling and prediction tool for air pollution exposure assessment. Environ. Model. Softw. 2018, 105, 17–23. [Google Scholar] [CrossRef]
  24. Jiang, H.; Zheng, G.; Yi, Y.; Chen, D.; Zhang, W.; Yang, K.; Miller, C.E. Progress and Challenges in Studying Regional Permafrost in the Tibetan Plateau Using Satellite Remote Sensing and Models. Front. Earth Sci. 2020, 8, 560403. [Google Scholar] [CrossRef]
  25. Chen, D.; Zhong, Y.; Ma, A.; Zhang, L. Blurry dense object extraction based on buffer parsing network for high-resolution satellite remote sensing imagery. Isprs J. Photogramm. Remote Sens. 2024, 207, 122–140. [Google Scholar] [CrossRef]
  26. Muthukumar, P.; Cocom, E.; Nagrecha, K.; Comer, D.; Burga, I.; Taub, J.; Calvert, C.F.; Holm, J.; Pourhomayoun, M. Predicting PM2.5 atmospheric air pollution using deep learning with meteorological data and ground-based observations and remote-sensing satellite big data. Air Qual. Atmos. Health 2022, 15, 1221–1234. [Google Scholar] [CrossRef]
  27. Xue, T.; Zheng, Y.; Geng, G.; Zheng, B.; Jiang, X.; Zhang, Q.; He, K. Fusing Observational, Satellite Remote Sensing and Air Quality Model Simulated Data to Estimate Spatiotemporal Variations of PM2.5 Exposure in China. Remote Sens. 2017, 9, 221. [Google Scholar] [CrossRef]
  28. Azid, A.; Juahir, H.; Toriman, M.E.; Kamarudin, M.K.A.; Saudi, A.S.M.; Hasnam, C.N.C.; Aziz, N.A.A.; Azaman, F.; Latif, M.T.; Zainuddin, S.F.M.; et al. Prediction of the Level of Air Pollution Using Principal Component Analysis and Artificial Neural Network Techniques: A Case Study in Malaysia. Water Air Soil Pollut. 2014, 225, 2063. [Google Scholar] [CrossRef]
  29. Rahman, E.A.; Hamzah, F.M.; Latif, M.T.; Azid, A. Forecasting PM2.5 in Malaysia Using a Hybrid Model. Aerosol Air Qual. Res. 2023, 23, 230006. [Google Scholar] [CrossRef]
  30. de Lima, B.D.; de Cassia Marques Alves, R.; de Oliveira, G.G.; Paim, B.L. The performance of artificial neural networks for modeling daily concentrations of particulate matter from meteorological data. Environ. Monit. Assess. 2023, 195, 1305. [Google Scholar] [CrossRef]
  31. Guo, Q.; He, Z.; Wang, Z. Prediction of Hourly PM2.5 and PM10 Concentrations in Chongqing City in China Based on Artificial Neural Network. Aerosol Air Qual. Res. 2023, 23, 220448. [Google Scholar] [CrossRef]
  32. Muthukumar, P.; Nagrecha, K.; Comer, D.; Calvert, C.F.; Amini, N.; Holm, J.; Pourhomayoun, M. PM2.5 Air Pollution Prediction through Deep Learning Using Multisource Meteorological, Wildfire, and Heat Data. Atmosphere 2022, 13, 822. [Google Scholar] [CrossRef]
  33. Hu, K.; Guo, X.; Gong, X.; Wang, X.; Liang, J.; Li, D. Air quality prediction using spatio-temporal deep learning. Atmos. Pollut. Res. 2022, 13, 101543. [Google Scholar] [CrossRef]
  34. Liao, Q.; Zhu, M.; Wu, L.; Pan, X.; Tang, X.; Wang, Z. Deep Learning for Air Quality Forecasts: A Review. Curr. Pollut. Rep. 2020, 6, 399–409. [Google Scholar] [CrossRef]
  35. Sun, K.; Tang, L.; Qian, J.; Wang, G.; Lou, C. A deep learning-based PM2.5 concentration estimator. Displays 2021, 69, 102072. [Google Scholar] [CrossRef]
  36. Peng, J.; Han, H.; Yi, Y.; Huang, H.; Xie, L. Machine learning and deep learning modeling and simulation for predicting PM2.5 concentrations. Chemosphere 2022, 308, 136353. [Google Scholar] [CrossRef]
  37. Wang, S.; Ren, Y.; Xia, B. Estimation of urban AQI based on interpretable machine learning. Environ. Sci. Pollut. Res. 2023, 30, 96562–96574. [Google Scholar] [CrossRef]
  38. Masih, A. Machine learning algorithms in air quality modeling. Glob. J. Environ. Sci. Manag.-Gjesm 2019, 5, 515–534. [Google Scholar] [CrossRef]
  39. Mendez, M.; Merayo, M.G.; Nunez, M. Machine learning algorithms to forecast air quality: A survey. Artif. Intell. Rev. 2023, 56, 10031–10066. [Google Scholar] [CrossRef]
  40. Aladağ, E. Forecasting of particulate matter with a hybrid ARIMA model based on wavelet transformation and seasonal adjustment. Urban Clim. 2021, 39, 100930. [Google Scholar] [CrossRef]
  41. Zhao, L.; Li, Z.; Qu, L. Forecasting of Beijing PM2.5 with a hybrid ARIMA model based on integrated AIC and improved GS fixed-order methods and seasonal decomposition. Heliyon 2022, 8, e12239. [Google Scholar] [CrossRef] [PubMed]
  42. Pyae, T.S.; Kallawicha, K. First temporal distribution model of ambient air pollutants (PM2.5, PM10, and O3) in Yangon City, Myanmar during 2019–2021. Environ. Pollut. 2024, 347, 123718. [Google Scholar] [CrossRef] [PubMed]
  43. Yang, C.-H.; Chen, P.-H.; Wu, C.-H.; Yang, C.-S.; Chuang, L.-Y. Deep learning-based air pollution analysis on carbon monoxide in Taiwan. Ecol. Inform. 2024, 80, 102477. [Google Scholar] [CrossRef]
  44. Al Yammahi, A.; Aung, Z. Forecasting the concentration of NO2 using statistical and machine learning methods: A case study in the UAE. Heliyon 2023, 9, 125–134. [Google Scholar] [CrossRef] [PubMed]
  45. Luo, J.; Gong, Y. Air pollutant prediction based on ARIMA-WOA-LSTM model. Atmos. Pollut. Res. 2023, 14, 101761. [Google Scholar] [CrossRef]
  46. Li, Y.; Liu, B.; Xue, Z.; Zhang, Y.; Sun, X.; Song, C.; Dai, Q.; Fu, R.; Tai, Y.; Gao, J.; et al. Chemical characteristics and source apportionment of PM2.5 using PMF modelling coupled with 1-hr resolution online air pollutant dataset for Linfen, China. Environ. Pollut. 2020, 263, 114532. [Google Scholar] [CrossRef]
  47. Rahman, M.; Rashid, F.; Kumar, D.; Habib, M.A.; Ullah, A. Dataset of air pollutants (PM2.5, PM10, CO) concentrations in the export processing area of Dhaka, Bangladesh. Data Brief 2024, 55, 110594. [Google Scholar] [CrossRef]
  48. Bose, A.; Chowdhury, I.R. Towards cleaner air in Siliguri: A comprehensive study of PM2.5 and PM10 through advance computational forecasting models for effective environmental interventions. Atmos. Pollut. Res. 2024, 15, 101976. [Google Scholar] [CrossRef]
  49. Liu, X.; Sun, T.; Feng, Q. Dynamic spatial spillover effect of urbanization on environmental pollution in China considering the inertia characteristics of environmental pollution. Sustain. Cities Soc. 2020, 53, 101903. [Google Scholar] [CrossRef]
  50. Han, F.; Lu, X.; Xiao, C.; Chang, M.; Huang, K. Estimation of Health Effects and Economic Losses from Ambient Air Pollution in Undeveloped Areas: Evidence from Guangxi, China. Int. J. Environ. Res. Public Health 2019, 16, 2707. [Google Scholar] [CrossRef]
  51. Gunasekar, S.; Kumar, G.J.R.; Agbulu, G.P. Air Quality Predictions in Urban Areas Using Hybrid ARIMA and Metaheuristic LSTM. Comput. Syst. Sci. Eng. 2022, 43, 1271–1284. [Google Scholar] [CrossRef]
  52. Ramadan, M.S.; Abuelgasim, A.; Al Hosani, N. Advancing air quality forecasting in Abu Dhabi, UAE using time series models. Front. Environ. Sci. 2024, 12, 1393878. [Google Scholar] [CrossRef]
  53. Wang, P.; Zhang, H.; Qin, Z.; Zhang, G. A novel hybrid-Garch model based on ARIMA and SVM for PM2.5 concentrations forecasting. Atmos. Pollut. Res. 2017, 8, 850–860. [Google Scholar] [CrossRef]
  54. Liu, H.; Wu, H.; Lv, X.; Ren, Z.; Liu, M.; Li, Y.; Shi, H. An intelligent hybrid model for air pollutant concentrations forecasting: Case of Beijing in China. Sustain. Cities Soc. 2019, 47, 101471. [Google Scholar] [CrossRef]
  55. Zhao, J.-H.; Feng, G.-L.; Zhi, R. Progresses and prospects in research on season division and seasonal changes in China. J. Trop. Meteorol. 2013, 19, 28–38. [Google Scholar]
  56. Cao, L.-T.; Liu, H.-H.; Li, J.; Yin, X.-D.; Duan, Y.; Wang, J. Relationship of meteorological factors and human brucellosis in Hebei province, China. Sci. Total Environ. 2020, 703, 135491. [Google Scholar] [CrossRef]
  57. GB3095-2012; Ambient Air Quality Standards. China Environmental Science Publishing House: Beijing, China, 2012.
  58. Lin, X.; Lu, C.; Song, K.; Su, Y.; Lei, Y.; Zhong, L.; Gao, Y. Analysis of Coupling Coordination Variance between Urbanization Quality and Eco-Environment Pressure: A Case Study of the West Taiwan Strait Urban Agglomeration, China. Sustainability 2020, 12, 2643. [Google Scholar] [CrossRef]
  59. Chen, Y.; Zhu, Z.; Cheng, S. Industrial agglomeration and haze pollution: Evidence from China. Sci. Total Environ. 2022, 845, 157392. [Google Scholar] [CrossRef]
Figure 1. Modelling steps of the ARIMA model.
Sustainability 16 08471 g001
Figure 2. Trends of the main air pollutants in Hunan Province of China during 2016–2023.
Sustainability 16 08471 g002
Figure 3. Trends in the quality of the atmospheric environment in Hunan Province of China during 2016–2023.
Sustainability 16 08471 g003
Figure 4. Autocorrelation and partial autocorrelation plots for PM2.5.
Sustainability 16 08471 g004
Figure 5. Forecasting curves of air contaminants during 2024–2028 by ARIMA.
Sustainability 16 08471 g005
Figure 6. Results of monthly forecasting of air pollutants during 2024–2028 by ARIMA.
Sustainability 16 08471 g006
Table 1. Key features of the dataset during 2016–2023 in Hunan Province, China.
ParameterPre-InterpolationPost-Interpolation
Number of CasesNumber of Missing Data Number of Cases Number of OutliersMinMaxMeanSD
PM1040,48742739,0001914414553.5128.53
PM2.540,60830639,1211793210235.2320.75
O340,908640,591323318582.1535.81
NO240,908639,607130715020.7610.07
SO240,906838,44824661228.864.63
CO40,908640,1068080.11.60.810.28
Table 2. Different quarterly changes in major air pollutants in Hunan Province.
ParameterUnitSpringSummerAutumnWinterMean Value
PM10μg/m353.8 ± 11.735.1 ± 6.957.6 ± 13.584.6 ± 21.357.8 ± 20.4
PM2.5μg/m333.7 ± 7.320.5 ± 4.137.3 ± 9.063.9 ± 13.638.9 ± 18.2
O3μg/m387.3 ± 14.394.0 ± 11.392.3 ± 25.558.4 ± 9.983.0 ± 16.6
NO2μg/m322.0 ± 4.413.8 ± 2.423.3 ± 5.828.9 ± 7.222.0 ± 6.2
SO2μg/m310.5 ± 4.19.1 ± 2.510.3 ± 3.011.0 ± 5.310.2 ± 0.8
COmg/m30.8 ± 0.10.7 ± 0.10.8 ± 0.11.0 ± 0.20.8 ± 0.1
Note: All of the data presented refer to 95% confidence intervals.
Table 3. ARIMA model ordination and test results for major air pollutants.
ParameterPM10PM2.5O3NO2SO2CO
ARIMA (p,d,q)(2,0,2)(2,0,2)(2,1,2)(2,1,2)(3,1,3)(2,1,2)
R20.8170.8960.7230.6970.8520.918
MSE9.7635.92811.4424.2741.5080.049
MAE7.5294.3638.6113.2441.1570.037
p value0.9520.9450.9640.9760.9190.971
Table 4. Predicted annual concentrations of air pollutants in Hunan Province, 2024–2028.
ParameterPM10PM2.5O3NO2SO2CO
Unitμg/m3μg/m3μg/m3μg/m3μg/m3mg/m3
202445.732.387.920.46.50.7
202542.530.687.922.35.20.7
202639.228.987.921.94.00.7
202735.927.287.921.82.70.7
202832.725.587.921.81.40.7
Table 5. The accuracy of air pollutants based on the ARIMA model for 2024.
IndicatorAccuracy R2ARIMA (p,d,q)
PM1092.4%0.817(2,0,2)
PM2.590.0%0.896(2,0,2)
O392.4%0.723(2,1,2)
NO267.7%0.697(2,1,2)
SO282.9%0.852(3,1,3)
CO94.1%0.918(2,1,2)
Disclaimer/Publisher’s Note: The statements, opinions and data contained in all publications are solely those of the individual author(s) and contributor(s) and not of MDPI and/or the editor(s). MDPI and/or the editor(s) disclaim responsibility for any injury to people or property resulting from any ideas, methods, instructions or products referred to in the content.