Evaluating Mitigation Effects of Urban Heat Islands in a Historical Small Center with the ENVI-Met® Climate Model


 and
and 
Abstract
:1. Introduction
2. Basis of Applied Method
- Shortwave and longwave radiation fluxes with respect to shading, reflection and re-radiation from building systems and the vegetation;
- Transpiration, evaporation and sensible heat flux from the vegetation into the air including full simulation of all plant physical parameters (e.g., photosynthesis rate);
- Surface and wall temperature for each grid point and wall;
- Water- and heat-exchange inside the soil system;
- Calculation of biometeorological parameters like Mean Radiant Temperature or Fanger’s Predicted Mean Vote (PMV) Value;
- Dispersion of inert gases and particles including sedimentation of particles on leaves and surfaces [12].
- The atmospheric model, which calculates the air movement, three-dimensional turbulence, temperature, relative humidity and takes into account obstacles such as buildings and vegetation. The maximal height of the model is 2500 m. The variation of radiation due to vegetation and shading is also considered.
- The surface model, which calculates the emitted long wave, and the reflected short wave radiation from the different surfaces, taking into account the incident long and shortwave radiation. It considers the albedo of the surfaces, the shading in function of the solar path and calculates the water vapor evaporation from the vegetation and the transpiration from the soil, taking into account the air flow-modifying effect of the vegetation. It is adapted to model flat surfaces.
- The vegetation model, which calculates the foliage temperature and the energy balance of the leaves taking into account the physiological and meteorological parameters. The vegetation is characterized by the normalized leaf area density (LAD) and the normalized root area density (RAD). The evaporation rate and the turbulence calculation are based on the airflow fields around the vegetation and the tree shape. The evaporation rate at the leaf surface, regulated by the stomata, is affected by the heat exchange between the leaf and its environment. The absorption characteristics of the foliage are calculated in function of the sunpath and the projected shade.
- The soil model, which calculates the thermo and hydrodynamic processes that take place in the soil. This model takes into account the combination of the natural and artificial surfaces of the urban quarter considered and it can also calculate heat exchanges between a water body and its environment.
- The biometeorological model, which is able to calculate the PMV index from the meteorological data [18].

- -
- dx = 4.50 m;
- -
- dy = 3.50 m;
- -
- dz = 1.20 m.
- ▪
- “H2”: thick bush , 2 m tall;
- ▪
- “xx”: grass, average density, 50 cm tall.
3. Case Studies
- Base Case: the model has been kicked off applying standard values of urban environment, especially regarding radiative properties of buildings:
- -
- Albedo roofs = 0.3;
- -
- Albedowalls = 0.2.
- Cool Case: it has been assumed that all the roofs have been covered with high-reflectance material:
- -
- Albedo roofs = 0.9;
- -
- Albedo walls = 0.2;
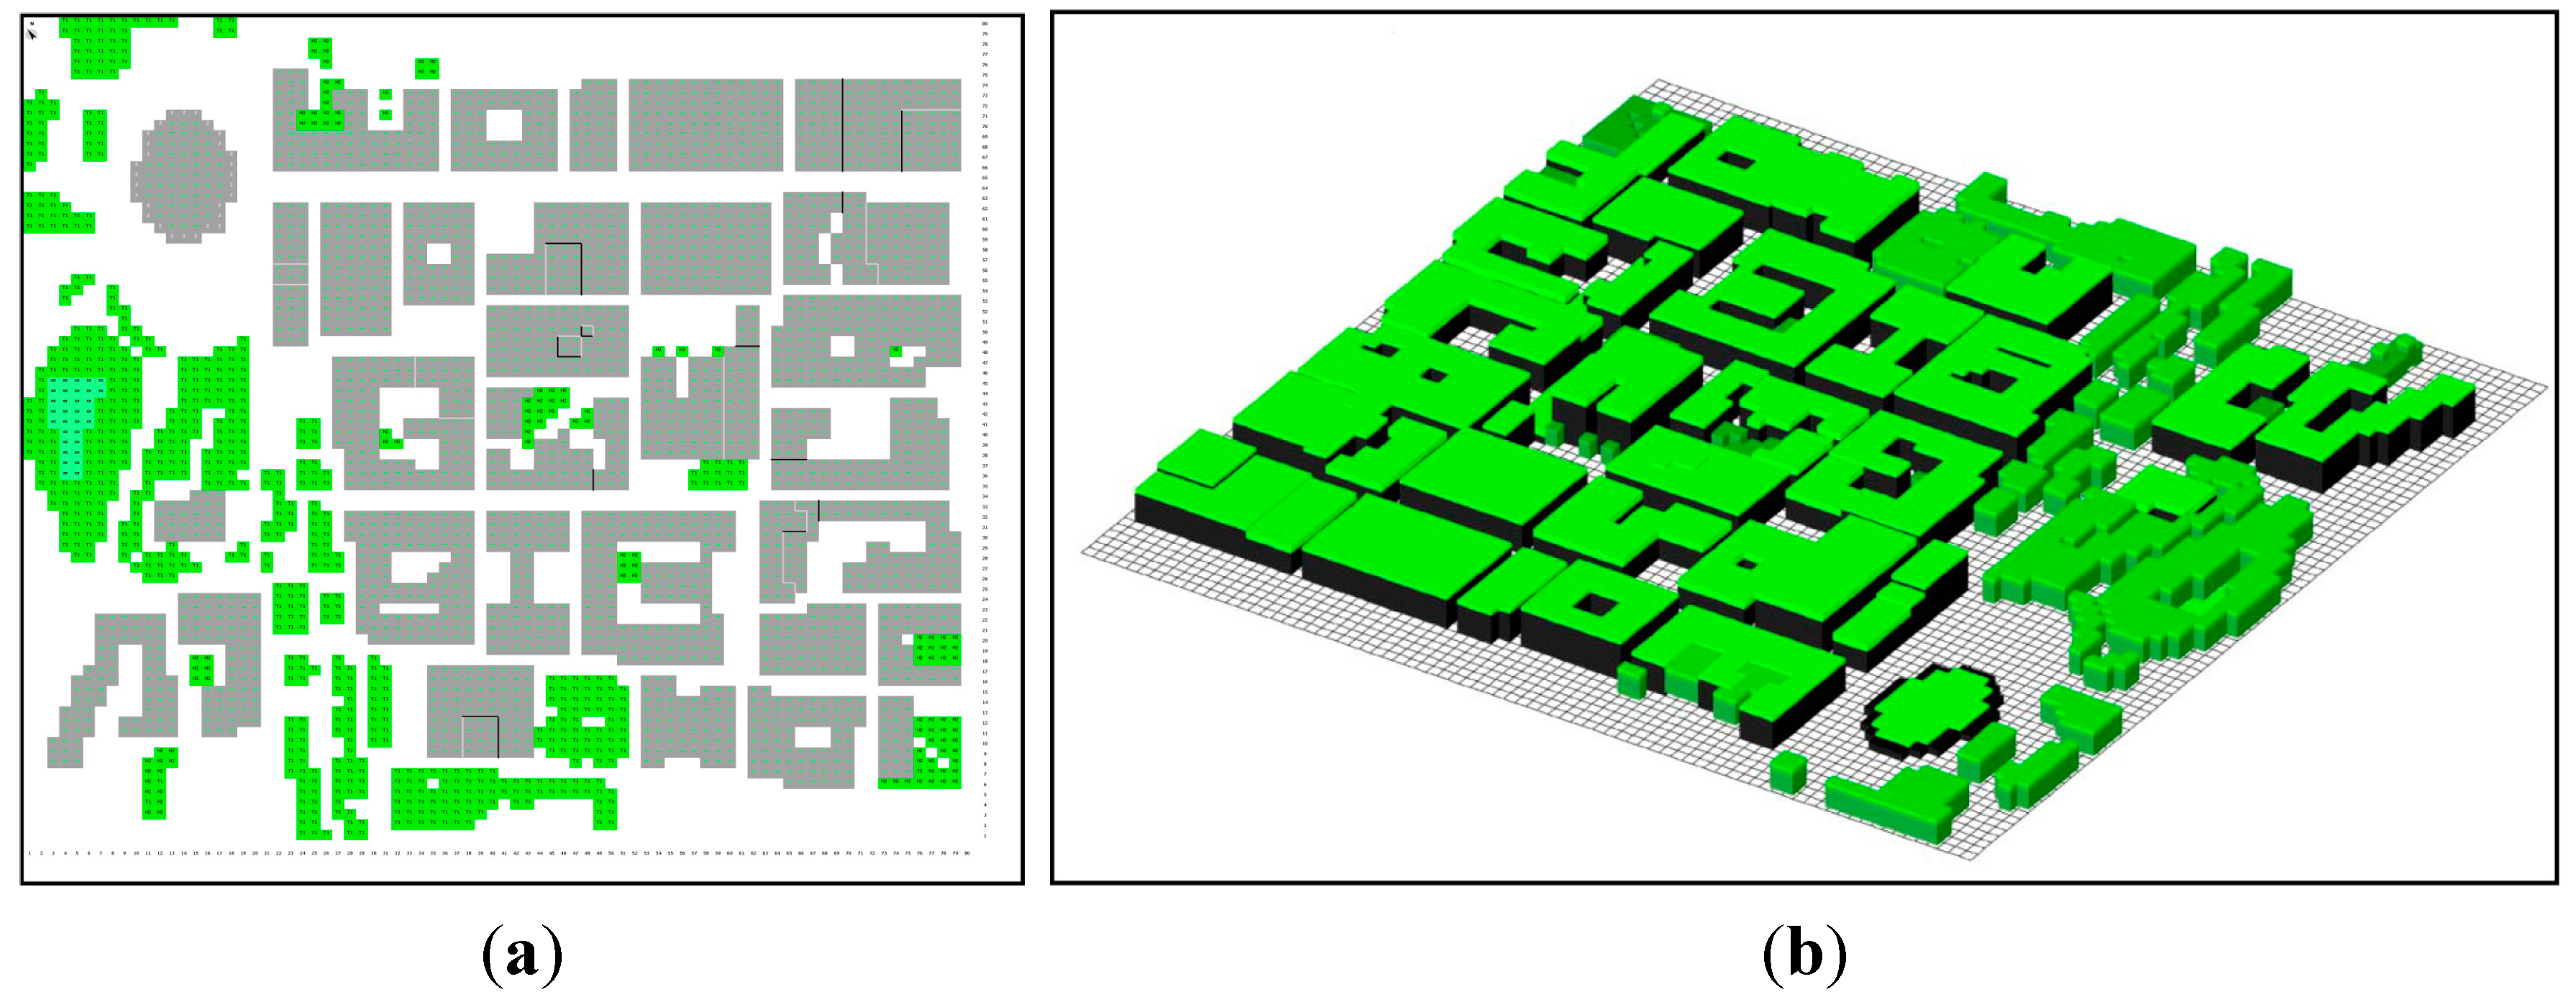
In order to build this simulation in ENVI-met® the same Input files of the Base Case have been employed, modifying only the Configuration File, which contains all the parameters set to the model (see Figure 2); - Green Case: a green roof, consisting of an average density 50 cm tall grass has been applied to all buildings. Radiative properties are almost the same as Base Case: the walls (and their albedo) are the same, while grass typical albedo is 0.26. In this case, not only a different Configuration File (as for the Cool Case) has been used but also a different Area Input file has been created, in order to include the newly added vegetation. A green roof is modeled into the software firstly by creating the building and then by creating vegetation in the cell that represents top-roof. The modified model is depicted in the following figures, both referred to the Green Case domain. Figure 3a) is a snapshot of the area input file, where the vegetation is defined but cannot be seen, while Figure 3b) is a 3D view taken from the output of the model.

4. Results
4.1. Atmospheric Temperature

4.1.1. Base Case
- ▪
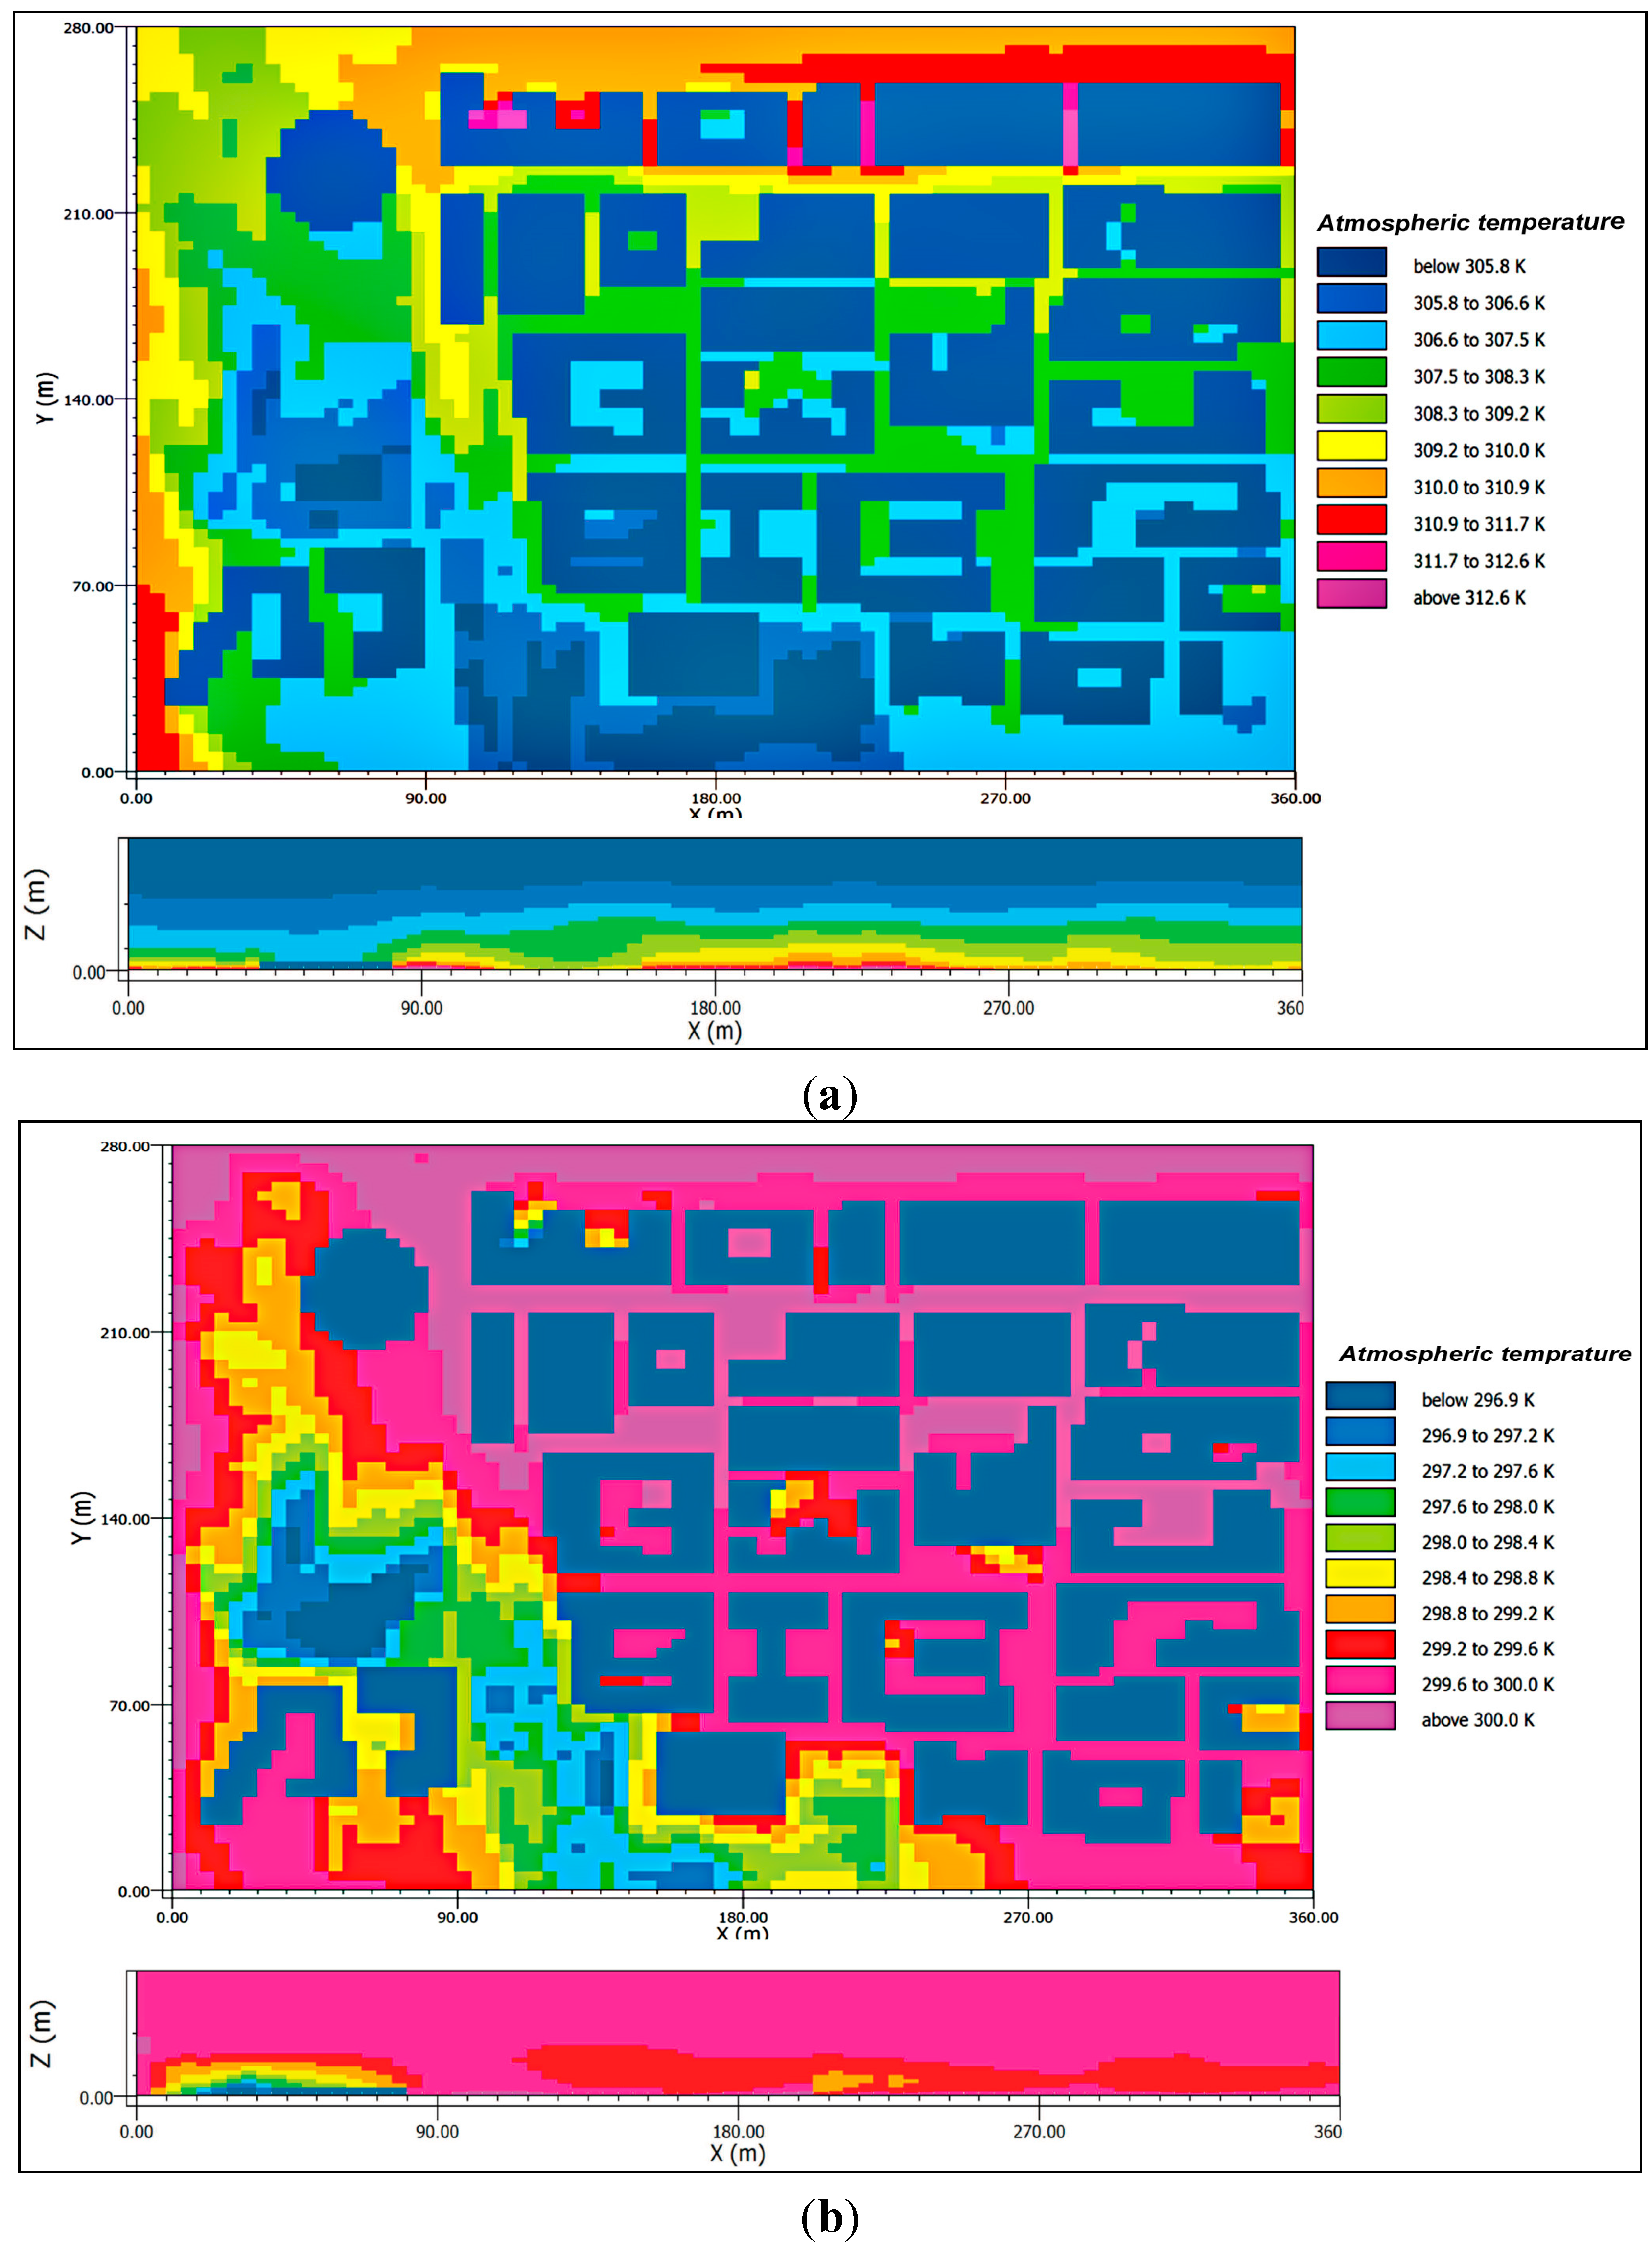
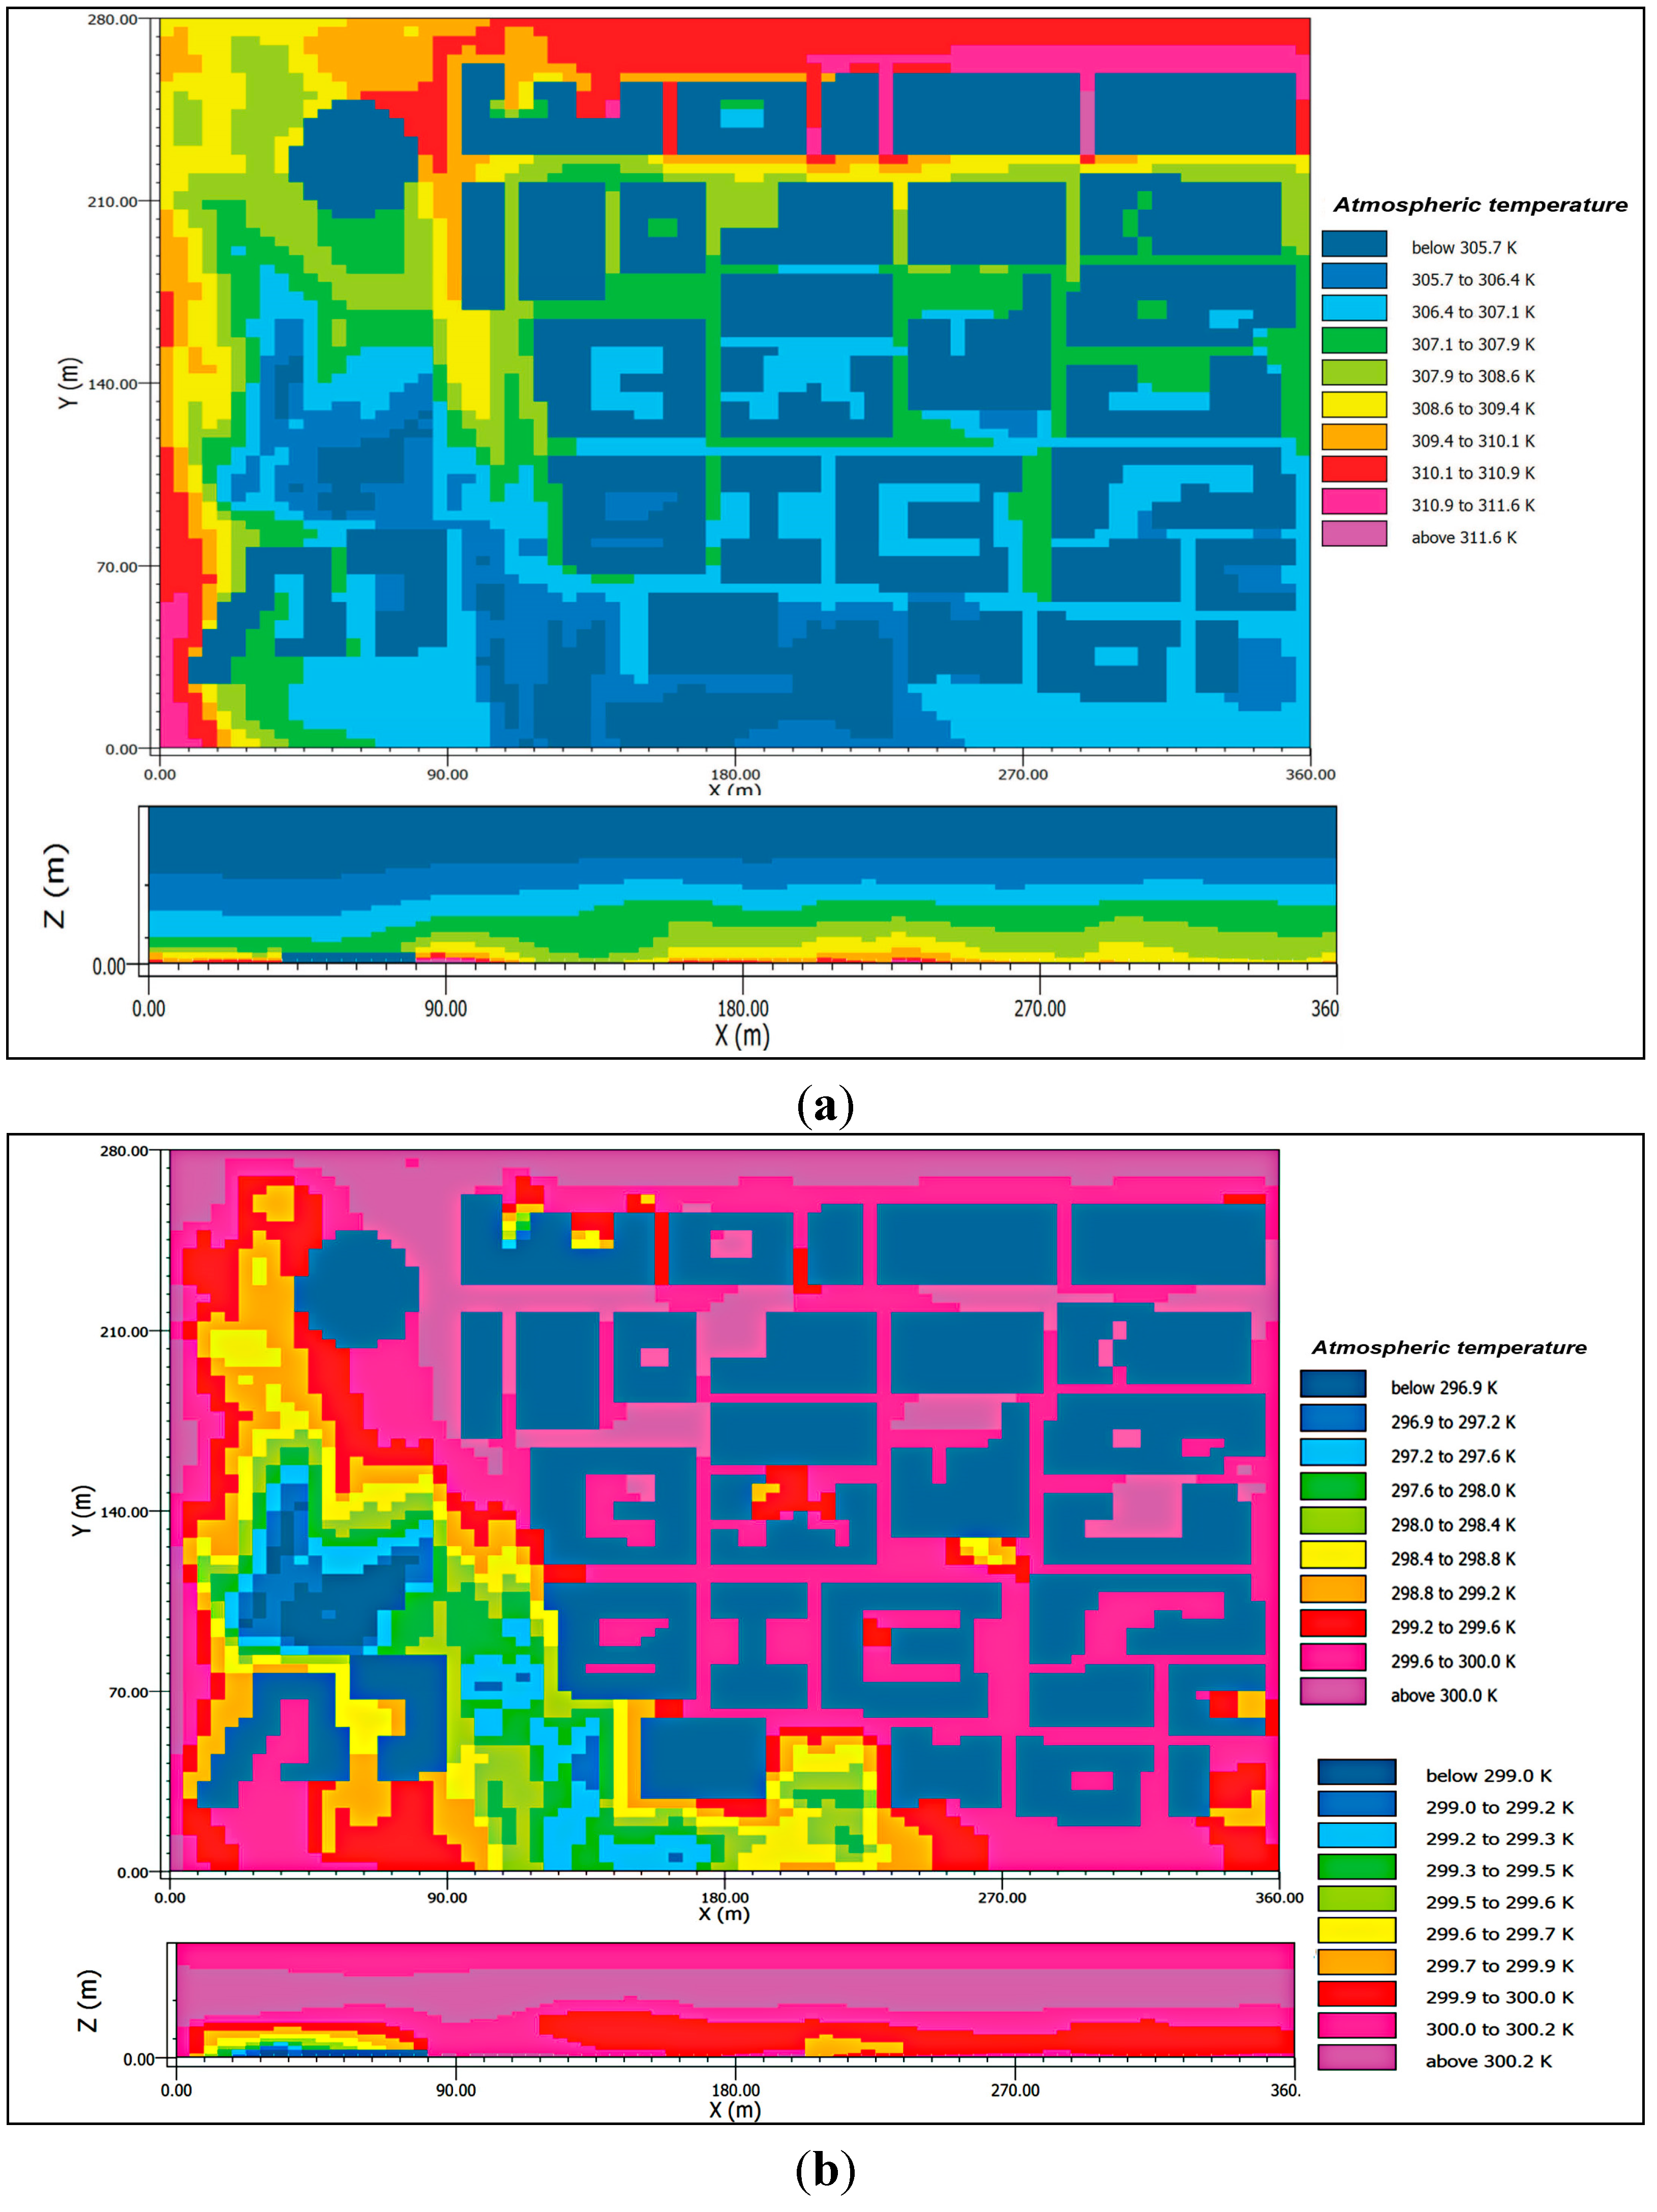
- 22 July 2013, 2:00 p.m.: the old town center main road and its crossing roads are the hottest zones, due to the presence of the urban canyon layout; as can be seen in Figure 4a, surroundings, which are less densely filled with buildings and have more vegetation, suffer milder effects. Maximum temperature is 312.5 K (39.3 °C), while minimum, recorded in densely vegetated areas, is 304.5 K (31.3 °C). Thus, maximum thermal gradient is 8 K;
- ▪
- 23 July 2013, 2:00 a.m.: an atmospheric urban heat island is clearly sketched (Figure 4b), with the area filled with buildings clearly warmer than open and vegetated areas. The atmospheric temperature is rather homogeneous inside the old town center, with a peak of 300.2 K (27.0 °C), while the minimum temperature, again recorded in southwest green area, is 296.3 K (23.1 °C), with a difference of almost 4 K. In the main road view, small warmer spots are present, close to buildings top, caused by thermal release of roofs which is higher than that of the walls (roofs usually have higher transmittance, and in other works simulation have been carried out with this assumption [13,17,20].


| Locations’ Characteristics. | ||
|---|---|---|
| Point | Name | Characteristics of Selected Location |
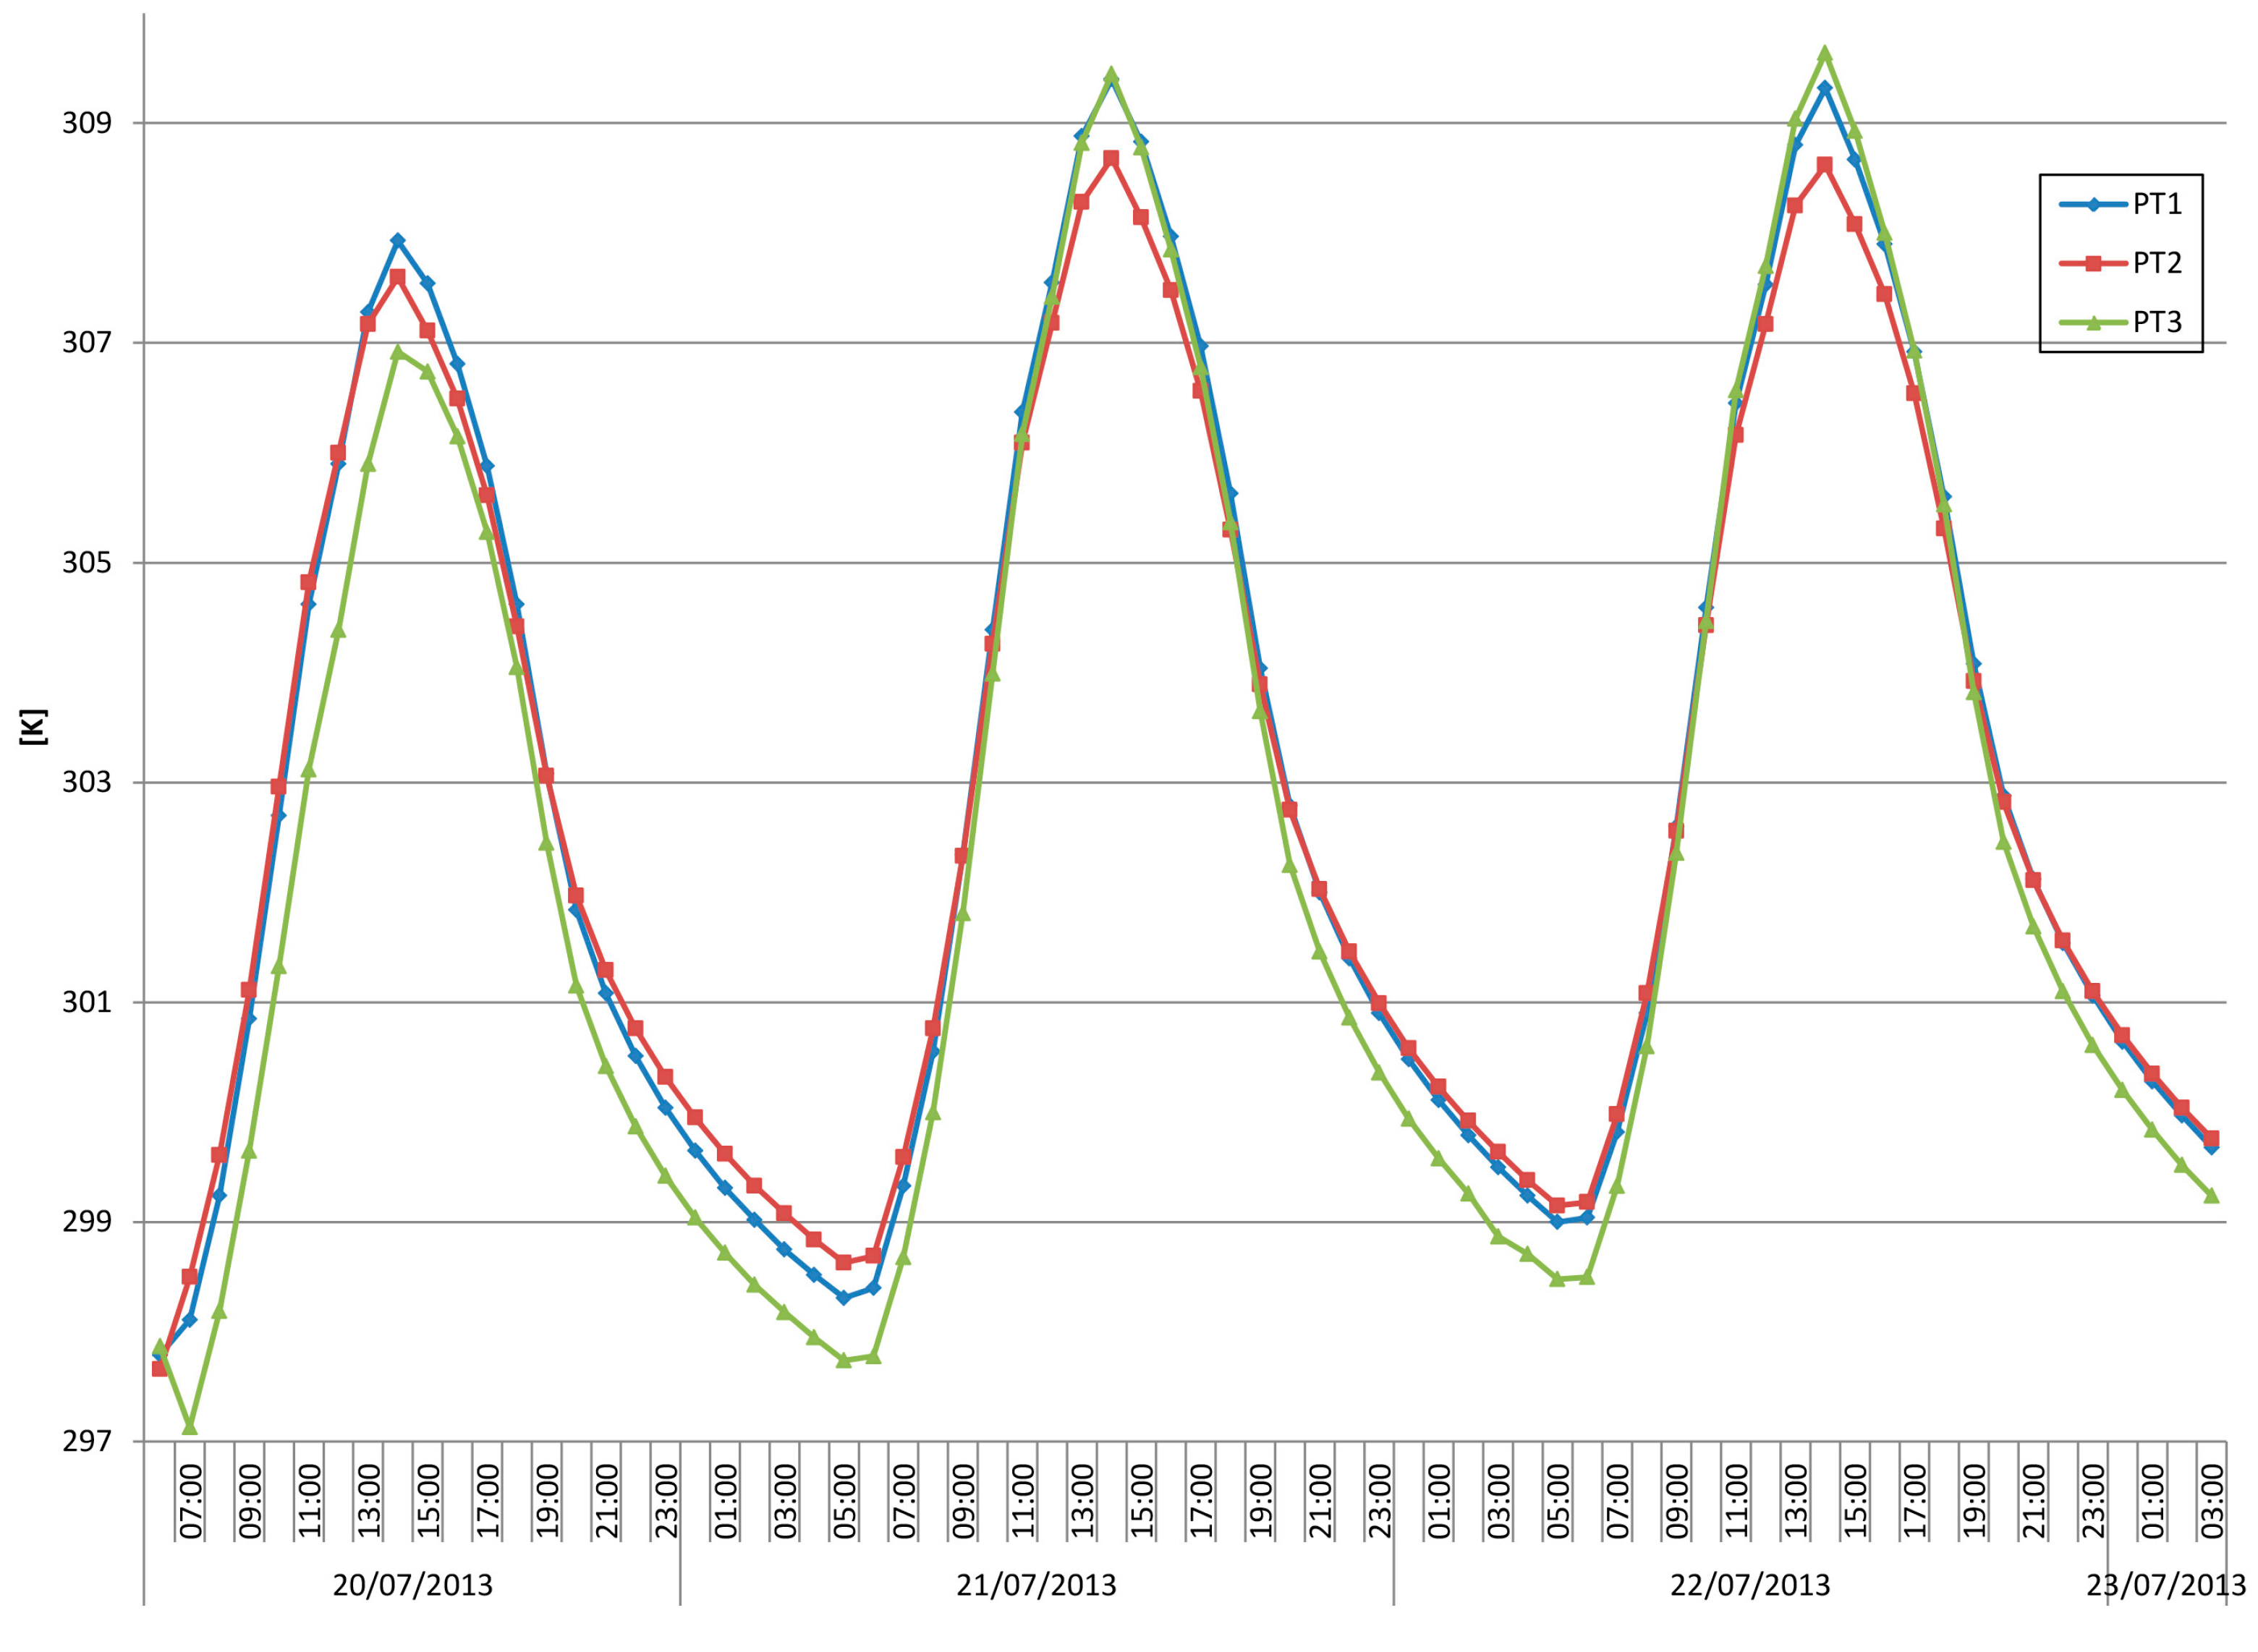
| 1 | Corso San Giorgio (main road–midway) | Dense urban area, well frequented |
| 2 | Corso San Giorgio (main road–end way) | Dense urban area, well frequented |
| 3 | Viale Crucioli | Public park, vegetated |

4.1.2. Cool Case
- ▪
- 22 July 2013, 2:00 p.m.: the atmospheric temperature (shown in Figure 6a) is really uneven with strong differences between built up areas and the green zone. Nevertheless, a general decrease in the temperature is recorded (0.5 K on average). Maximum temperature, in the urban canyon near main road, is 313.4 K (40.2 °C). Minimum temperature is 304.9 K (31.7 °C), as usual recorded in the vegetated area, and is higher than Base Case—One of the possible causes of this phenomenon is the increased diffuse radiation (due to the higher albedo of buildings), that could interfere with adjacent buildings or trees foliage, and cause indirect drawback like the increase of thermal load on pedestrians [21,22]. In our model, however, the height of the trees is smaller or at least equal to that of the roofs, with the only exception being a 3 m high building standing in the lower center part of the model. Therefore, the view factor between trees and roof is close to zero, and therefore the effect of roof reflection toward trees is minimal. This is confirmed by our model, which shows that solar diffuse radiation difference between cool and base case is minor than 10−4 W/m2. Another possible cause is the alteration of wind velocity, but in our model, wind velocity difference between cool and base is negligible, as it is less than 0.1 m/s. The possibility of local temperature increase, however, has been highlighted in previous works [23,24] and may be ascribed to vertical and horizontal mixing changes (not evaluated in the present work).
- ▪
- 23 July 2013, 2:00 a.m.: the atmospheric urban heat island is fully developed, with uniformity of values in the buildings area (see Figure 6b). There is not any substantial change with respect to the Base Case, since the utmost temperature difference between the two cases is 0.25 K, also due to the lack of irradiation. Minimum recorded temperature is 296.5 K (23.3 °C) while the maximum is 300.1 K (26.9 °C), with a thermal gradient of 3.6 K.
4.1.3. Green Case
- ▪
- 22 July 2013, 2:00 p.m.: even in this situation there is an improvement compared to the Base Case (see Figure 7a). In the built area, temperatures are up to 1.2 K lower than the Base Case. The lower temperature is 305 K (31.8 °C), the higher is 312.3 K (39.1 °C), with a difference of 7.3 K;
- ▪
- 23 July 2013, 2:00 a.m.: there is a nocturnal atmospheric UHI fully developed, with temperature reduction trend of few tenth of K, particularly in the lower right part of the model (Figure 7b). The higher temperature calculated is 300.1 K (26.9 °C), the minimum 296.5 K (23.3 °C), for a difference of 3.6 K.

4.2. Relative Humidity

- ▪
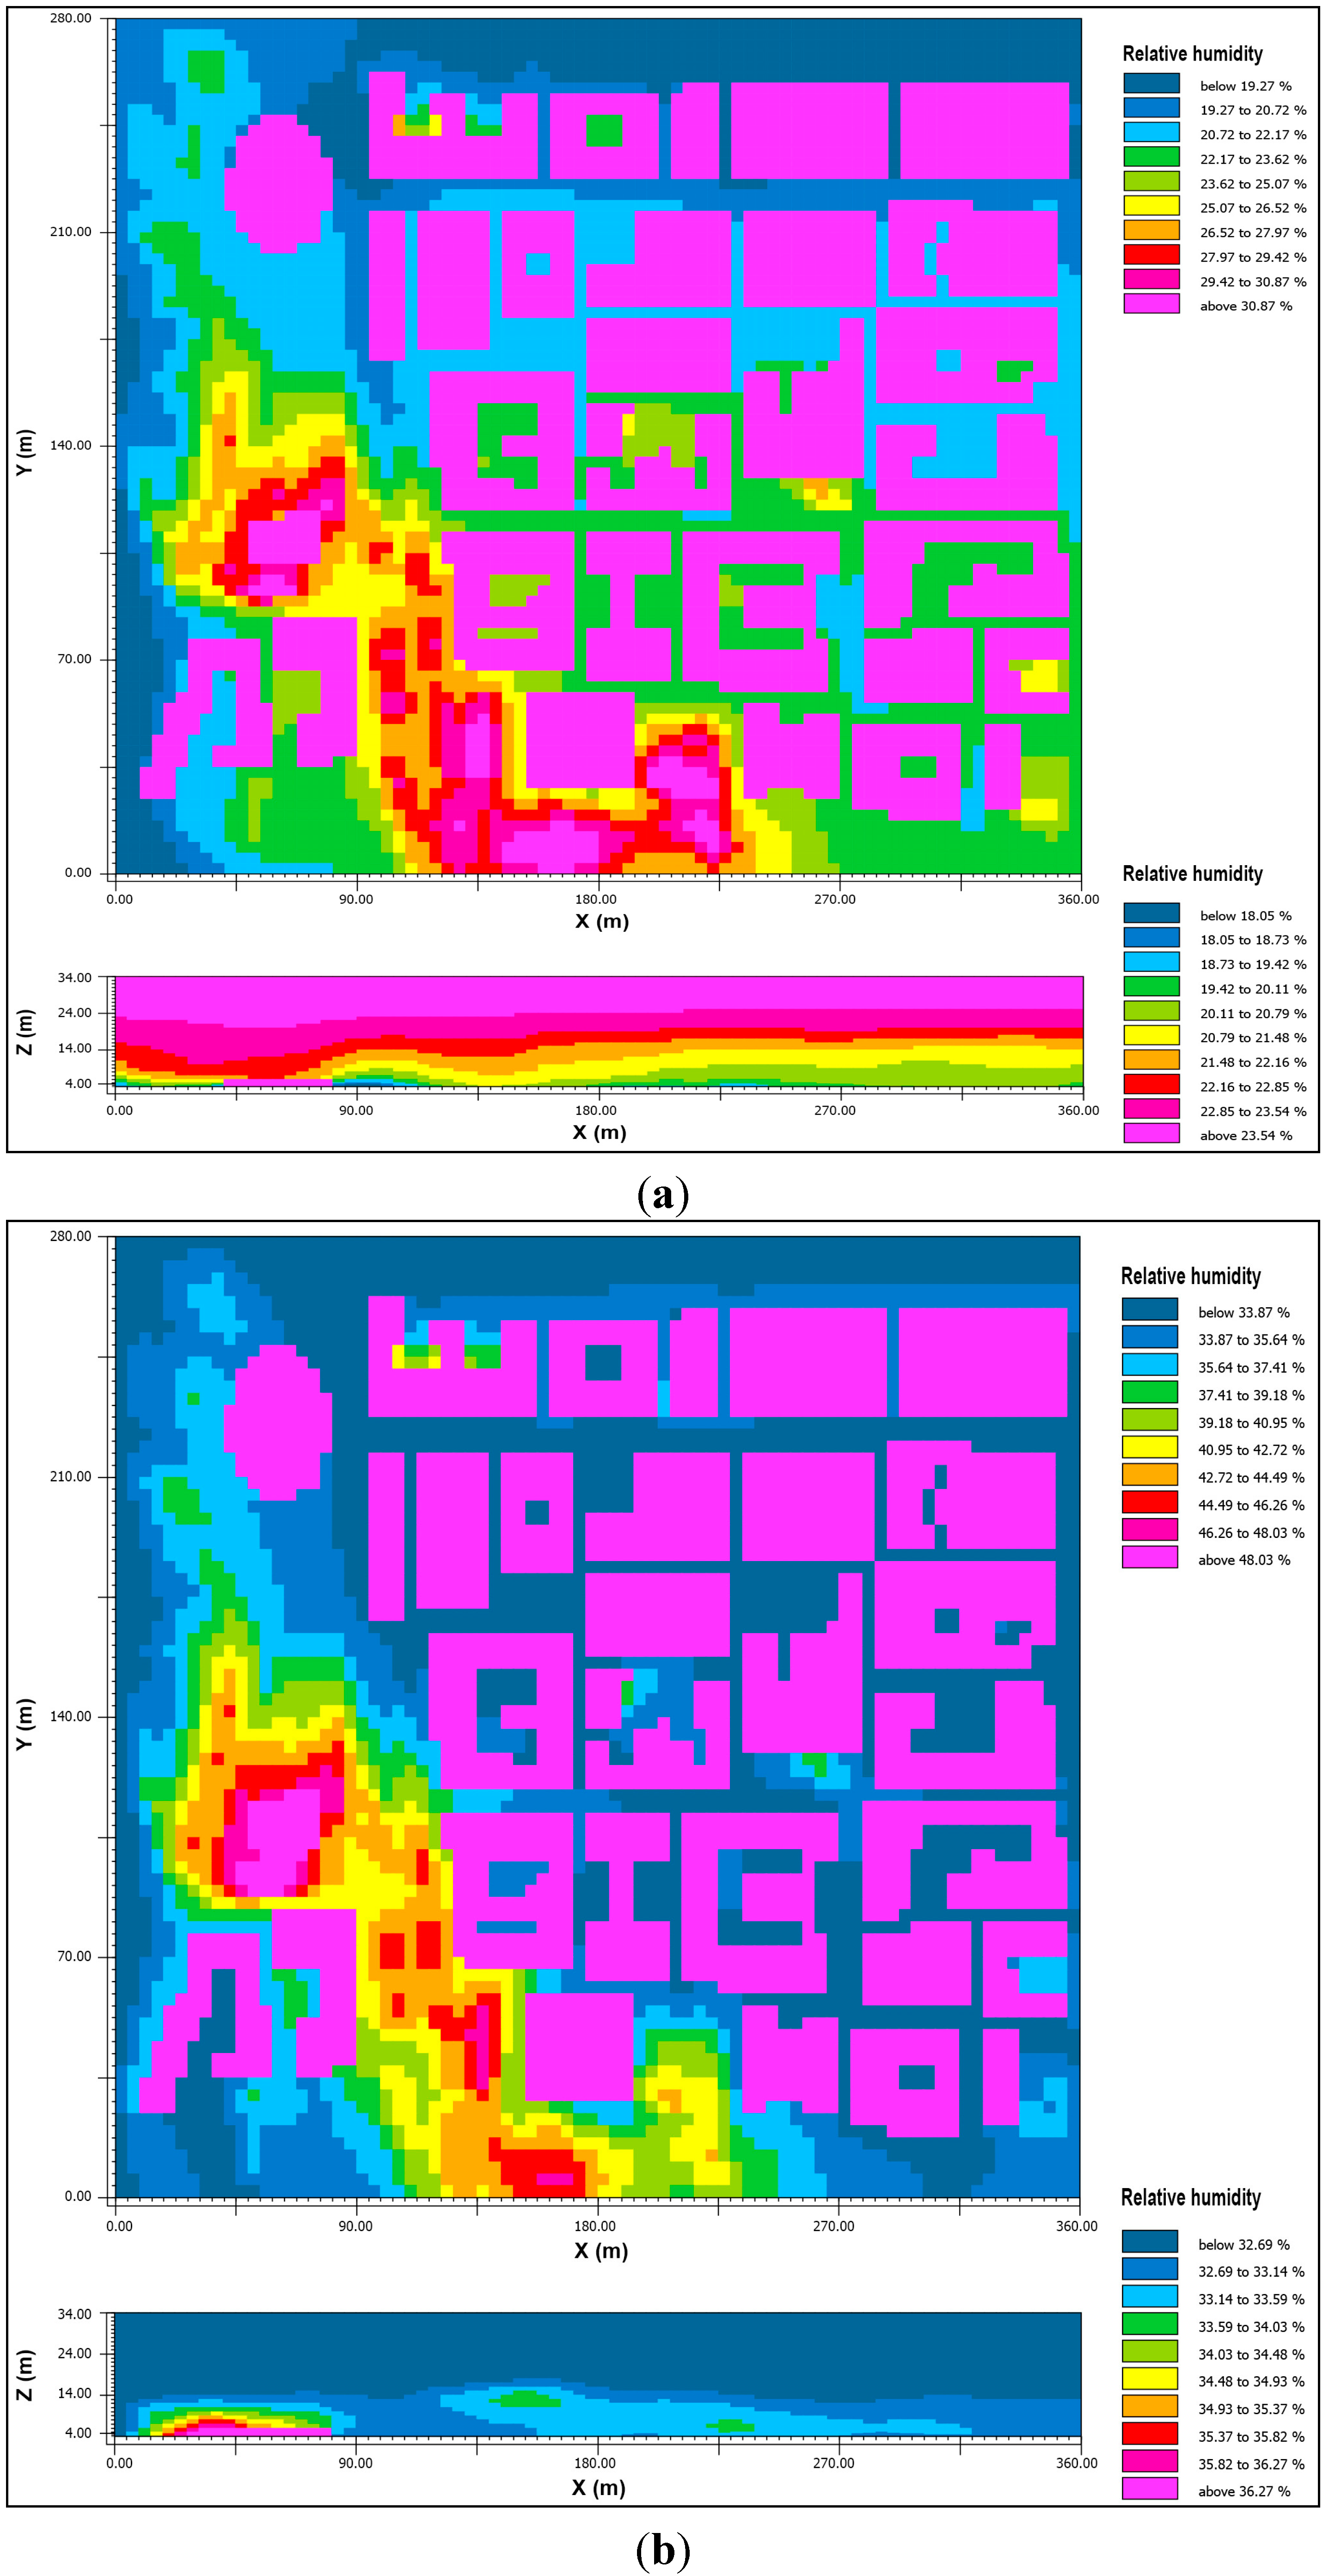
- 22 July 2013, 3:00 p.m.: there is an overall compensating trend of temperature effect. Colder areas are damper, too (which is not surprising, since these areas are characterized by vegetation and a source of humidity); warmer areas are drier. This fact tends to compensate for itself, and uniform thermal comfort (or discomfort) is perceived, even though humidity difference does not balance the high temperature difference. The maximum value, registered in vegetated area located at the bottom right in Figure 8, equals 33%, whereas the minimum value toward the main street is 18.5%, and it matches with the particular morphology: it is formed by a vegetative nucleus surrounded by three buildings, with less air renewal. The maximum difference calculated is 14.5%, substantial but not high.
- ▪
- 23 July 2013, 3:00 a.m.: as expected, nocturnal values are higher than daytime ones, even though the distribution of thermo hygrometric values in the zone has no relevant variations. Minimum humidity recorded is 33%, while maximum is 53%; so the highest difference is 20%, greater than the evening one. Even in this case, in absolute terms these values are not high.
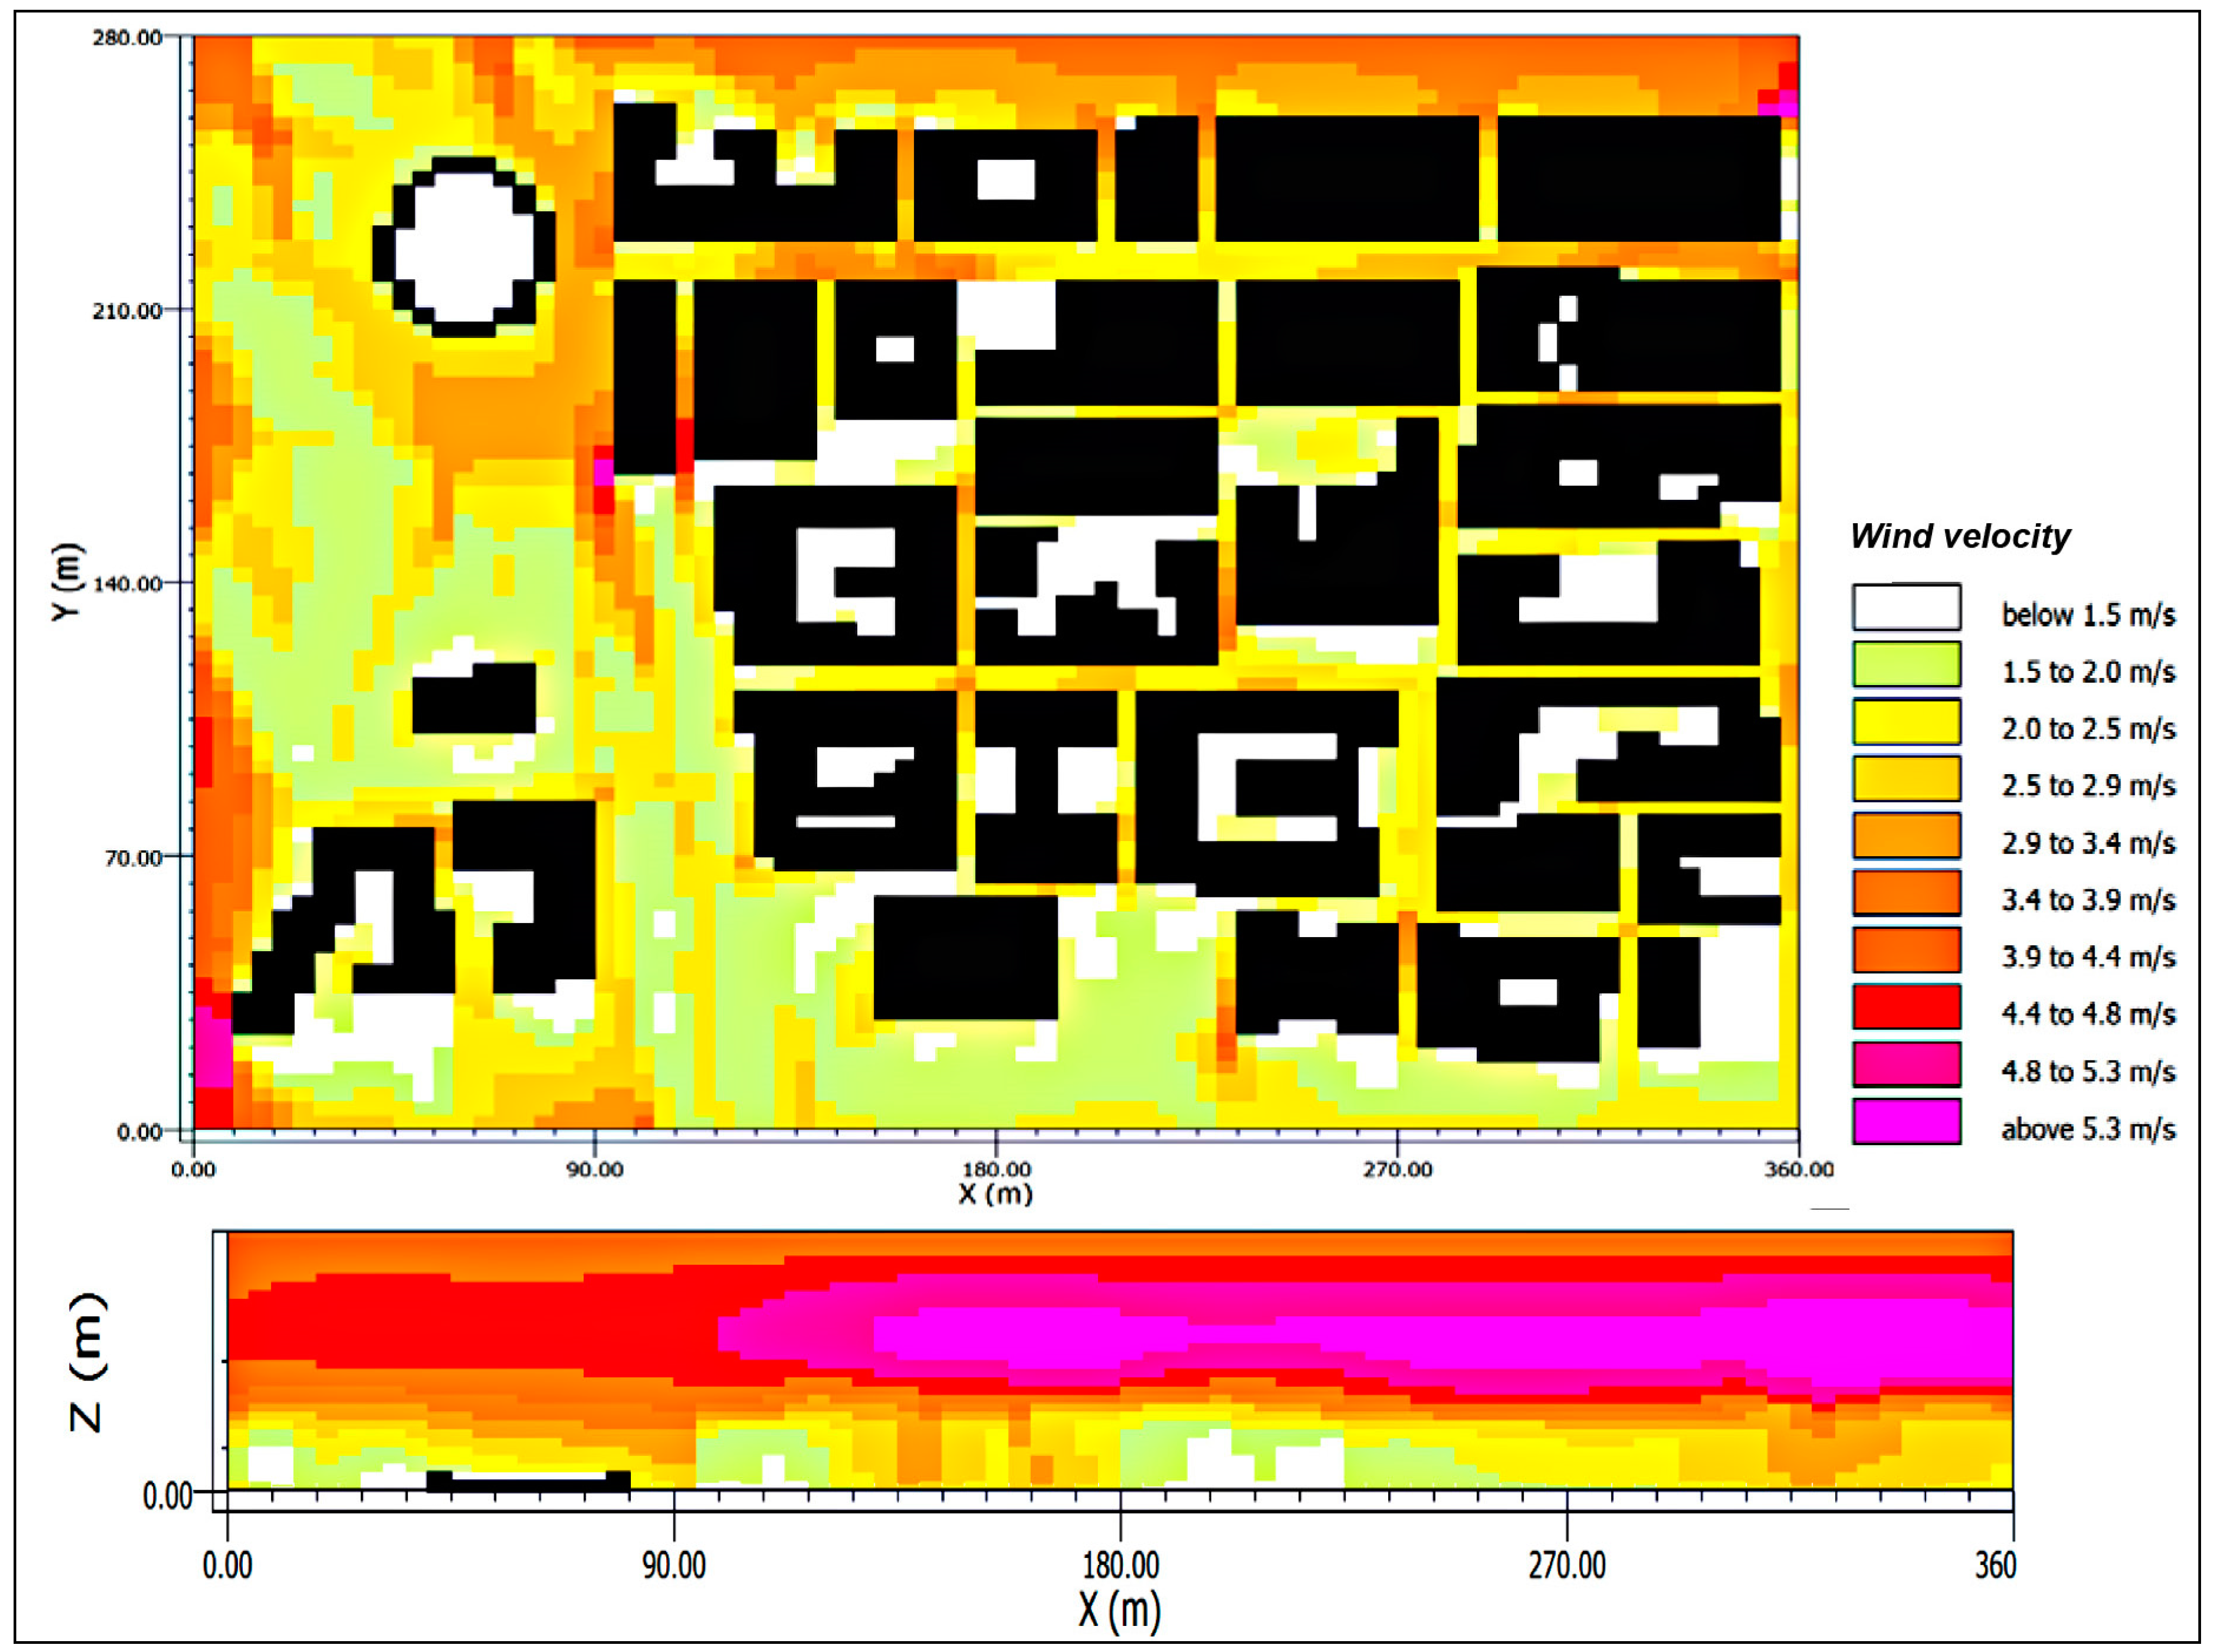
4.3. Windiness

5. Results Discussion and Conclusions
Author Contributions
Conflicts of Interest
References
- Taha, H. Urban climates and heat island: Albedo, evapotranspiration, and anthropogenic heat. Energy Build. 1997, 25, 99–103. [Google Scholar] [CrossRef]
- Akbari, H. Energy Saving Potentials and Air Quality Benefits of Urban Heat Island Mitigation; Lawrence Berkeley National Laboratory: Berkeley, CA, USA, 2005. [Google Scholar]
- Santamouris, M. Heat island research in Europe―the state of the art. J. Adv. Build. Energy Res. 2007, 1, 123–150. [Google Scholar] [CrossRef]
- Santamouris, M. Cooling the cities—A review of reflective and green roof mitigation technologies to fight heat island and improve comfort in urban environments. Solar Energy 2014, 103, 682–703. [Google Scholar] [CrossRef]
- Taleb, D.; Abu-Hijileh, B. Urban heat islands: Potential effect of organic and structured urban configurations on temperature variations in Dubai, UAE. Renew. Energy 2013, 50, 747–762. [Google Scholar] [CrossRef]
- Carfan, A.C.; Galvani, E.; Teixeira Nery, J. Study of thermal comfort in the City of São Paulo using ENVI-met model. Investig. Geogr. Bol. Inst. Geogr. UNAM 2012, 78, 34–47. [Google Scholar]
- Olivieri, F.; di Perna, C.; D’Orazio, M.; Olivieri, L.; Neila, J. Experimental measurements and numerical model for the summer performance assessment of extensive green roofs in a Mediterranean coastal climate. Energy Build. 2013, 63, 1–14. [Google Scholar]
- Palomo del Barrio, E. Analysis of the green roofs cooling potential in buildings. Energy Build. 1998, 27, 179–193. [Google Scholar]
- Castleton, H.F.; Stovin, V.; Beek, S.B.M.; Davison, J.B. Green roofs: Building energy savings and the potential for retrofit. Energy Build. 2010, 42, 1582–1591. [Google Scholar] [CrossRef]
- Synnefa, A.; Saliari, M.; Santamouris, M. Experimental and numerical assessment of the impact of increased roof reflectance on a school building in Athens. Energy Build. 2012, 55, 7–15. [Google Scholar] [CrossRef]
- Sproul, J.; Pun Wan, M.; Mandel, B.H.; Rosenfeld, A.H. Economic comparison of white, green, and black flat roofs in the United States. Energy Build. 2014, 71, 20–27. [Google Scholar]
- ENVI-met®! Available online: http://www.envi-met.com (accessed on 20 January 2014).
- Middel, A.; Häb, K.; Brazel, A.J.; Martin, C.A.; Guhathakurta, S. Impact of urban form and design on a mid-afternoon microclimate in Phoenix Local Climate Zones. Landsc. Urban Plan. 2014, 122, 16–28. [Google Scholar] [CrossRef]
- Yang, X.; Zhao, L.; Bruse, M.; Meng, Q. An integrated simulation method for building energy performance assessment in urban environments. Energy Build. 2012, 54, 243–251. [Google Scholar] [CrossRef]
- Huttner, S.; Bruse, M.; Dostal, P. Using ENVI-met to simulate the impact of global warming on the microclimate in central European cities. In Proceedings of the 5th Japanese-German Meeting on Urban Climatology, Albert-Ludwigs-University of Freiburg, Freiburg, Germany, October 2008; Mayer, H., Matzarakis, A., Eds.; Meteorological Institute Albert-Ludwigs-University of Freiburg: Freiburg, Germany; pp. 307–312.
- Ng, E.; Chen, L.; Wang, Y.; Yuan, C. A study on the cooling effects of greening in a high-density city: An experience from Hong Kong. Build. Environ. 2012, 47, 256–271. [Google Scholar] [CrossRef]
- Fahmy, M.; Hathway, A.; Pattacini, L.; Elwan, A. Environmental thermal impact assessment of regenerated urban form: A case study in Sheffield. In Proceedings of the World Renwable Energy Congress 2011, Linköping, Sweden, 8–11 March 2011.
- Szücs, A. Wind comfort in a public urban space―Case study within Dublin Docklands. Front. Archit. Res. 2013, 2, 50–66. [Google Scholar]
- The Hitchhiker’s Guide to ENVI-met. Available online: http://www.envi-met.info/hg2e/doku.php?id=kb:modelheight (accessed on 25 September 2014).
- Bruse, M.; Meng, Q.; Yang, X.; Zhao, L. Evaluation of a microclimate model for predicting the thermal behavior of different ground surfaces. Build. Environ. 2013, 60, 93–104. [Google Scholar] [CrossRef]
- Yaghoobian, N.; Kleissl, J. Effect of reflective pavements on building energy use. Urban Clim. 2012, 2, 25–42. [Google Scholar] [CrossRef]
- Erell, E.; Boneh, D.; Pearlmutter, D.; Bar-Kutiel, P. Effect of High-albedo Materials on Pedestrian Thermal Sensation in Urban Street Canyons in Hot Climates. In Proceedings of the PLEA2013―Sustainable Architecture for a Renewable Future, Munich, Germany, 10–12 September 2013.
- Synnefa, A.; Dandou, A.; Santamouris, M.; Tombrou, M.; Soulakellis, N. On the Use of Cool Materials as a Heat Island Mitigation Strategy. J. Appl. Meteorol. Climatol. 2008, 47, 2846–2856. [Google Scholar]
- Li, D.; Bou-Zeid, E.; Oppenheimer, M. The effectiveness of cool and green roofs as urban heat island mitigation strategies. Environ. Res. Lett. 2014. [Google Scholar] [CrossRef]
- Huttner, S.; Bruse, M. Numerical modeling of the urban climate―A preview on ENVI-met 4. In Proceedings of the Seventh International Conference on Urban Climate, Yokohama, Japan, 29 June–3 July 2009.
- ENVI-Labs. Available online: www.envi-met.com/labstart.htm (accessed on 25 September 2014).
© 2014 by the authors; licensee MDPI, Basel, Switzerland. This article is an open access article distributed under the terms and conditions of the Creative Commons Attribution license (http://creativecommons.org/licenses/by/4.0/).
Share and Cite
Ambrosini, D.; Galli, G.; Mancini, B.; Nardi, I.; Sfarra, S. Evaluating Mitigation Effects of Urban Heat Islands in a Historical Small Center with the ENVI-Met® Climate Model. Sustainability 2014, 6, 7013-7029. https://doi.org/10.3390/su6107013
Ambrosini D, Galli G, Mancini B, Nardi I, Sfarra S. Evaluating Mitigation Effects of Urban Heat Islands in a Historical Small Center with the ENVI-Met® Climate Model. Sustainability. 2014; 6(10):7013-7029. https://doi.org/10.3390/su6107013
Chicago/Turabian StyleAmbrosini, Dario, Giorgio Galli, Biagio Mancini, Iole Nardi, and Stefano Sfarra. 2014. "Evaluating Mitigation Effects of Urban Heat Islands in a Historical Small Center with the ENVI-Met® Climate Model" Sustainability 6, no. 10: 7013-7029. https://doi.org/10.3390/su6107013