Article

Ecosystem Services Evaluation and Its Spatial Characteristics in Central Asia’s Arid Regions: A Case Study in Altay Prefecture, China

College of Resources Science and Technology, Beijing Normal University, Beijing 100875, China
*
Author to whom correspondence should be addressed.
Sustainability 2015, 7(7), 8335-8353; https://doi.org/10.3390/su7078335
Submission received: 22 April 2015 / Revised: 15 June 2015 / Accepted: 19 June 2015 / Published: 29 June 2015

Abstract

:
Ecosystem services are important foundations to realize the sustainable development of economy and society. The question of how to quantitatively evaluate ecosystem services in a scientific way is a hot topic among international researchers. Studying the spatial characteristics of ecosystem services in arid regions can provide the theoretical and practical basis for coordinating a sustainable man-land relationship. Altay Prefecture of China, a typical arid region in Central Asia, was taken as the study area. It is on the Silk Road economic belt, which is a key region in the program of developing Western China. Three ecosystem services: water yield, soil conservation, and net primary productivity were quantitatively evaluated. The results show that (1) the spatial distribution pattern has a distinct characteristic of zonality; (2) mountain zone and mountain-oasis ecotone are the hotspots of ecosystem services; and (3) the correlation between water yield and net primary productivity shows a gradual increasing trend as altitude decreases. Objective analysis from the aspect of mechanism is given by discussing the causes of this particular pattern. It is found that altitude and slope have great influence on spatial distributions of ecosystem services, zones with the most amount of services are distributed in 1.5–2 km-altitude and 15–25°-slope. Different human activities in different regions and spatial distance decay of ecosystem services also contribute to the formation of spatial pattern. Thus, overgrazing, logging and mining are prohibited in mountain zones and mountain-oasis ecotones. Scholars are encouraged to focus on desert-ecosystem services in the future.

Graphical Abstract

1. Introduction

Prolonged destructive resource development has, in recent years, continuously diminished environmental quality due to insufficient knowledge of the ecosystem and its importance. Unreasonable land utilization has changed surface vegetation and has directly impacted the ecosystem’s structure, resulting in changes to regional material circulations and energy flows. The incurred ecological issues, including water shortage, the loss of water and soil, and reduced biodiversity, have intensified to the point that they seriously threaten regional sustainable development.
The ecosystem provides multiple functions through its exchanges of mass and energy with the external environment, and it provides various services to humankind. Ecosystem services comprise the benefits gained by humankind from the ecosystem and are at the forefront of international ecological research [1,2,3]. Throughout the world, a large number of studies have been conducted in regard to the definition [4,5,6], classification [7,8], and evaluation of ecosystem services [9,10,11]. Ecosystem services were regarded as the first key issues of ecology in “Ecological Research in the 21st Century” by the ESA (Ecological Society of America) in 2004 [12]. In 2006, the BES (British Ecological Society) organized scientists and government policy-makers, putting forward 100 ecosystem issues related to policy (14 themes), and the first theme is the study of ecosystem services [13]. In 2013, scientific evaluation of ecosystem services and their relationship with sustainable development were discussed at the 11th INTECOL Congress (Ecology: Into the next 100 years) [14].Currently, one of the greatest challenges in this aspect is how to quantitatively evaluate ecosystem services in a scientific manner [15,16,17]. In previous studies on ecosystem services, the results of economic-value assessment were often used to decide their importance, but such an approach cannot clearly show the different regional distribution laws of all services [18]. There are two main methods available for ecosystem service evaluation: the value method and mass method. The value method (or the area-equivalent method) is useful for comparisons between different services and can provide the basis for decision-makers within a short time. However, the repeated counting associated with regional differences results in difficult value determination, which makes the method disputable in terms of practical application [19]. The mass method includes the index classification system and ecological model simulation, which can objectively reflect the structure, functionality, and processes of an ecosystem, as well as its sustainability. The tendency to employ the mass method as a means to evaluate ecosystem services is new [20]. Martin and Crowder [21] use a lumped-parameter, dynamic open-access bioeconomic model to value a portion of ecosystem services when a commercial fishery is dependent on the quality of estuarine habitat. Willemen et al. [22] quantitatively evaluated seven ecosystem services in a rural area of the Netherlands by creating an index classification system and aggregating the services to identify and quantify multi-functionality, whereupon it was possible to prove that various ecosystem services affect each other in different ways on the landscape scale. Lü et al. [23] quantitatively evaluated the changes of main ecosystem services in China’s Loess Plateau from 2000 to 2008 using Universal Soil Loss Equation (USLE) and hydrological modeling. The results showed that China’s Grain-for-Green policy improved the region’s soil conservation, carbon-fixation, and grain-production functions, while its water yield decreased due to the increasing forestland areas and climate change. O’Farrell et al. [24] modeled and evaluated the water, grazing, and tourism services in South Africa by comparing ecosystem service hotspots with individual biodiversity priority areas, they concluded that regional scale (biome level) approaches must be combined with local level investigations. Zedler et al. [25] conducted a study on the carbon-fixation services of global wetland ecosystems and their function restoration and conducted the restoration according to local wetland conditions.
Arid regions refer to the regions where the annual precipitation is generally less than 200mm, evaporation is higher than precipitation and dryness is more than 2.0. In the narrow sense, the arid region of Central Asia only includes Kazakhstan, Uzbekistan, Kyrgyzstan, Turkmenistan, and Tajikistan. However, in terms of geography, Xinjiang Uygur Autonomous Region in China also belongs to this zone. Mountain-basin structure is a typical feature that distinguishes Central Asia’s arid region from other arid regions around the world. It is mainly characterized by the independent inland natural systems composed of glaciers, forests, grassland, oases, and deserts [26]. From an ecological perspective, Zhang [27] defined the arid region of Central Asia, with its complex landforms, featuring mountain and basin alternations, as a mountain-basin system (MBS). The MBS consists of mountainous vegetation zones (vertical zonation) and concentric annular basin vegetation zones (geology-topography). Therefore, it is a complex consisting of climatic and non-climatic (without the zonation feature) zones. Although there are vast differences among the three subsystems of MBS, they are not isolated systems. MBS is a compound system whose subsystems are connected together through material, energy, and information flows. The mountainous area provides rich saccharoid for the basin, which is an important parent material of oasis soil formation. Meanwhile, huge amounts of surface and underground water are taken to the basin, which determines the size and scope of natural oasis and influences the development potential of artificial oases. That contributes to the macro pattern of contradiction and coordination between oasis and desert in arid regions [28] (Figure 1). MBS is the typical composite structure of the ecosystem in Central Asia’s arid regions. The regions are on the Silk Road economic belt, put forward by Chinese government, and have strategic significance for China [29]. However, increasing population, integrated structure of farming and animal husbandry, irrational land use, and shortage of water resources leads to the deterioration of the ecological environment in an MBS [30]. Ecosystem service evaluation can reveal the impacts of the policy portfolio and land utilization on ecosystem, which helps standardize human development activities. Additionally, with the changes in human production and living behaviors, ecosystem function will be gradually improved, thereby encouraging a favorable cycle. Thus, study of ecosystem services evaluation has great significance for the ecological conservation and sustainable development of Central Asia’s arid regions.
Figure 1. Schema of landscape zones along the MBS.
Sustainability 07 08335 g001
First, three ecosystem services: water yield, soil conservation, and net primary productivity were quantitatively evaluated. Then, we pointed out the hotspots and analyzed the spatial characteristics of ecosystem services. Our research aims at proposing suitable suggestions for sustainable development and ecological conservation in Central Asia’s arid regions.

2. Materials and Methods
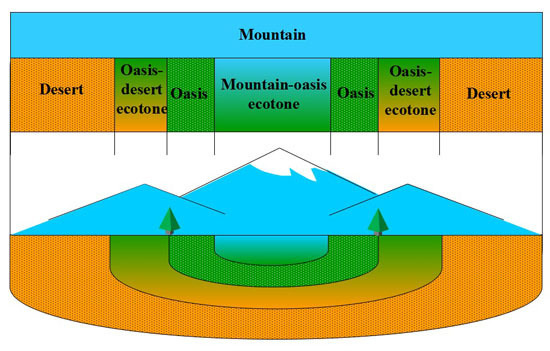
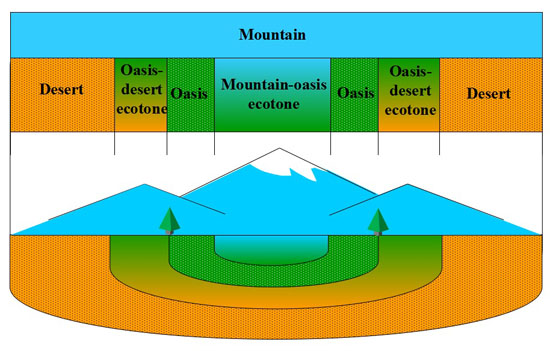
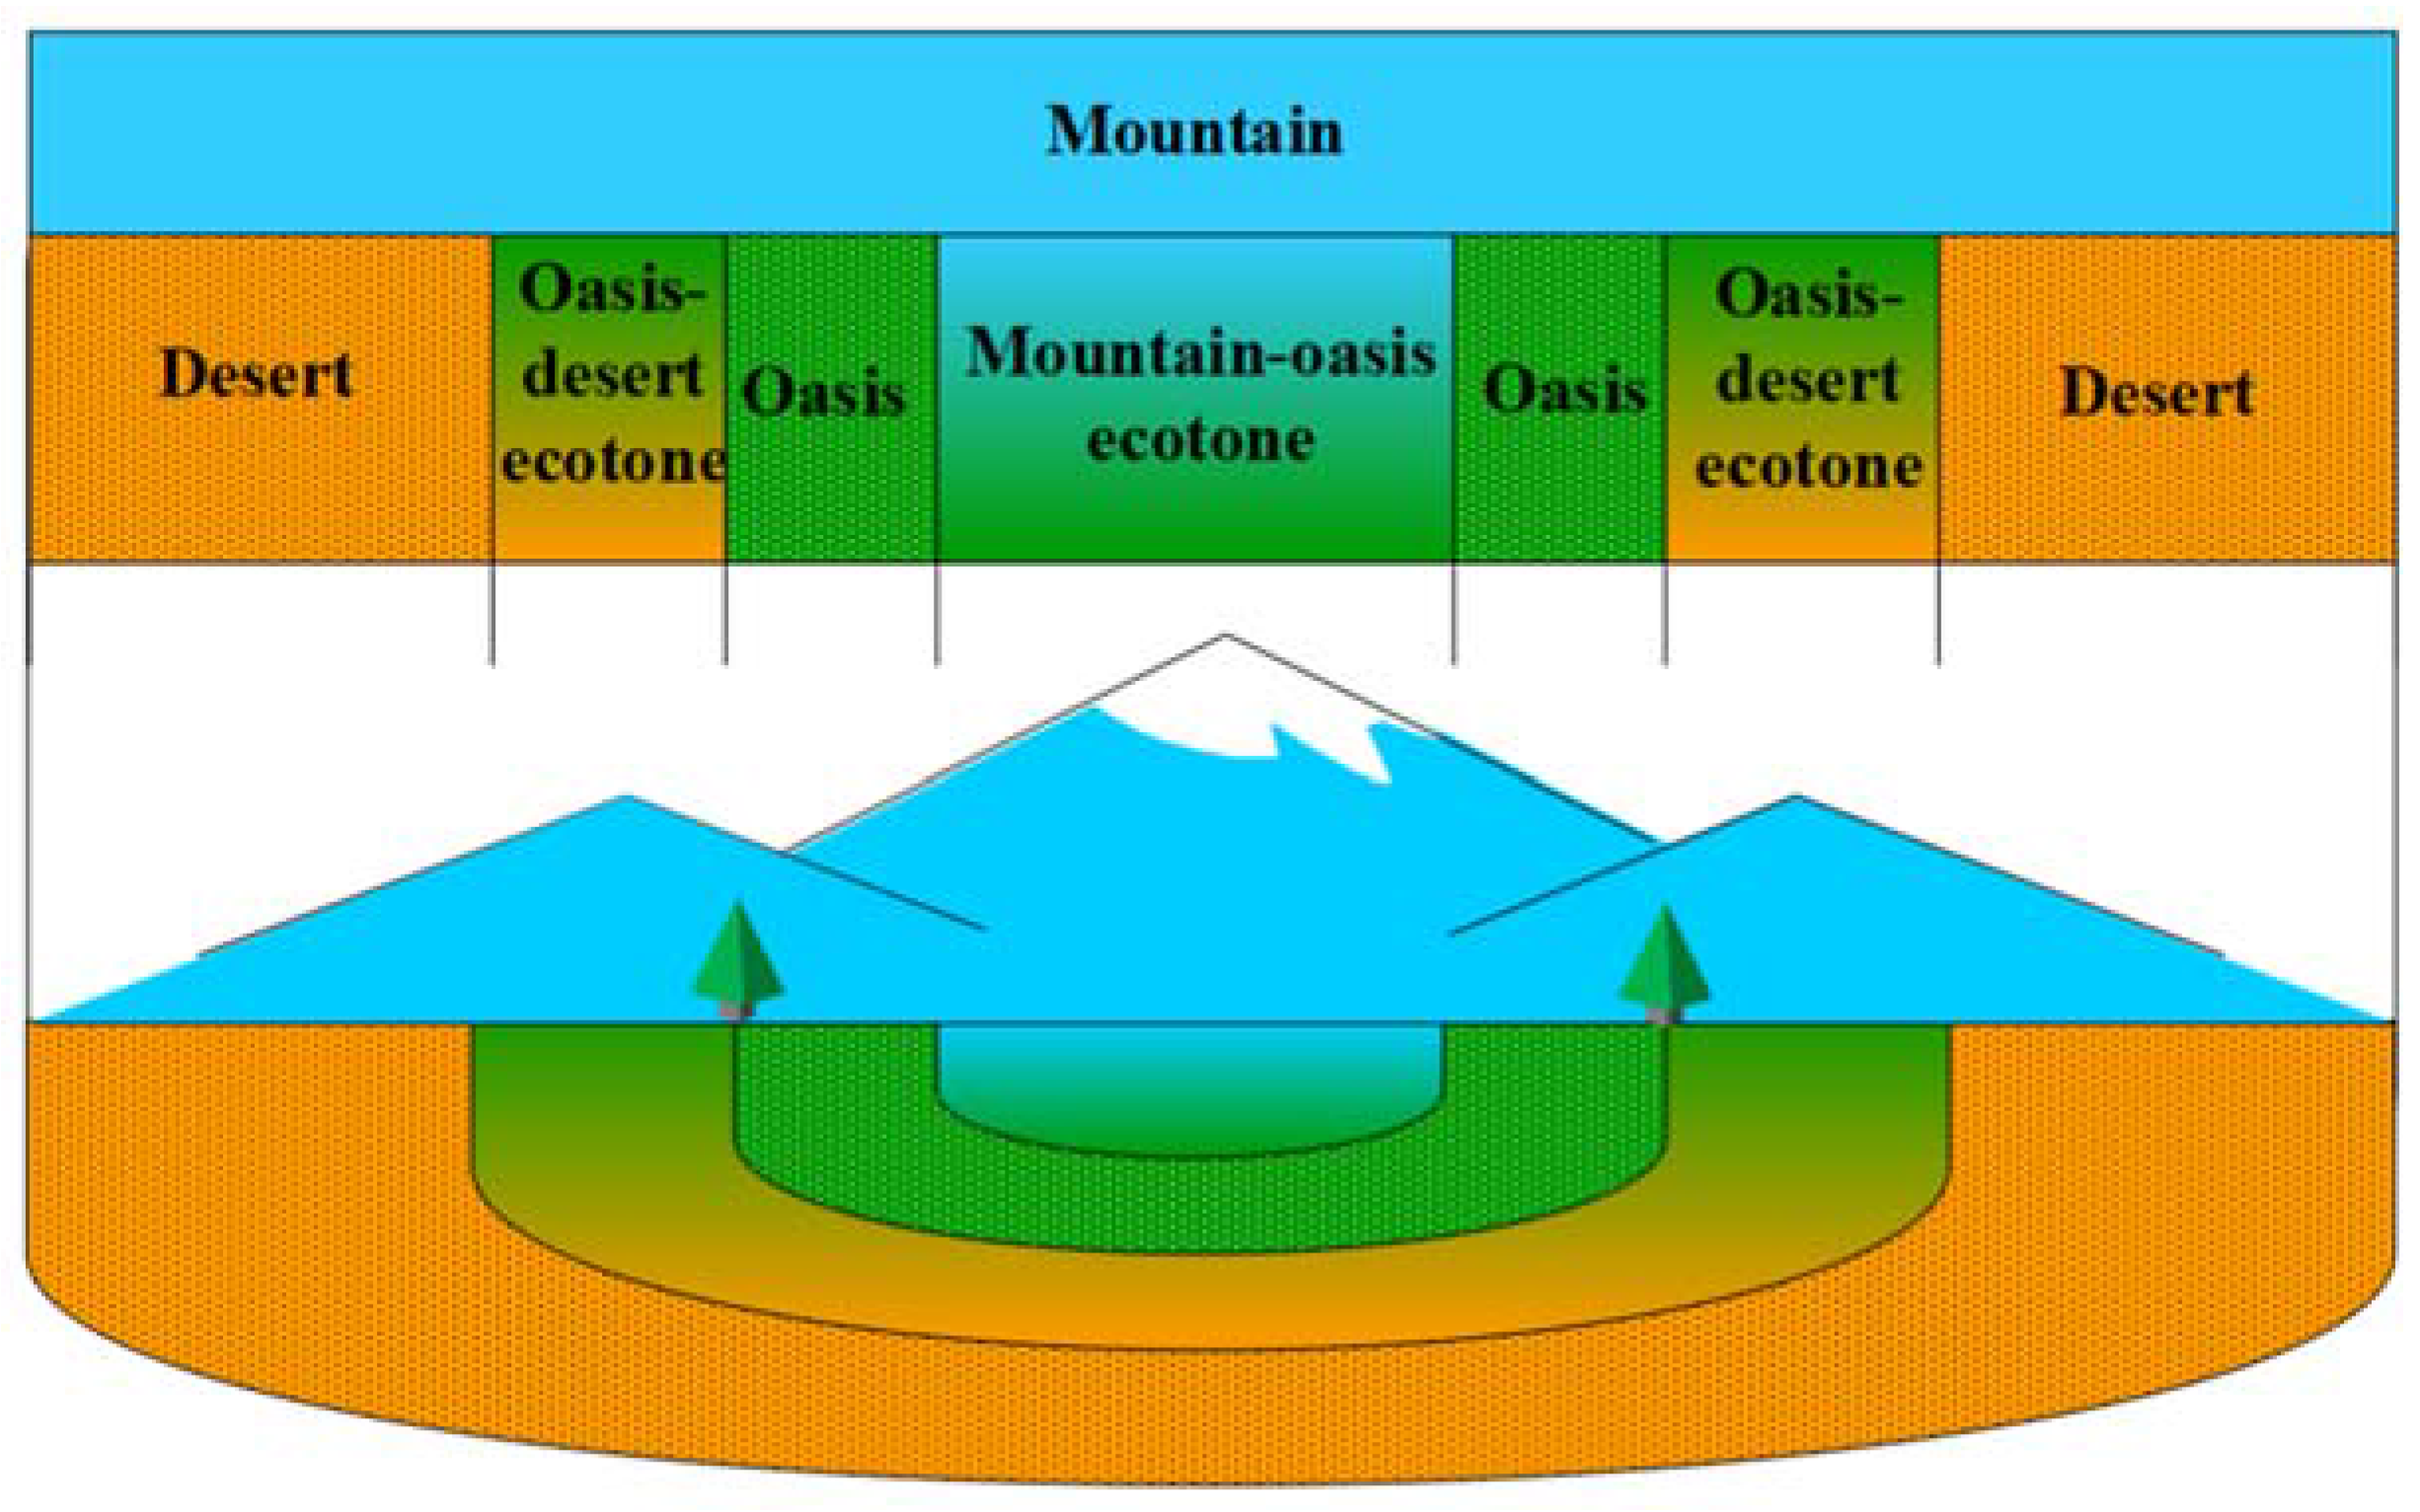
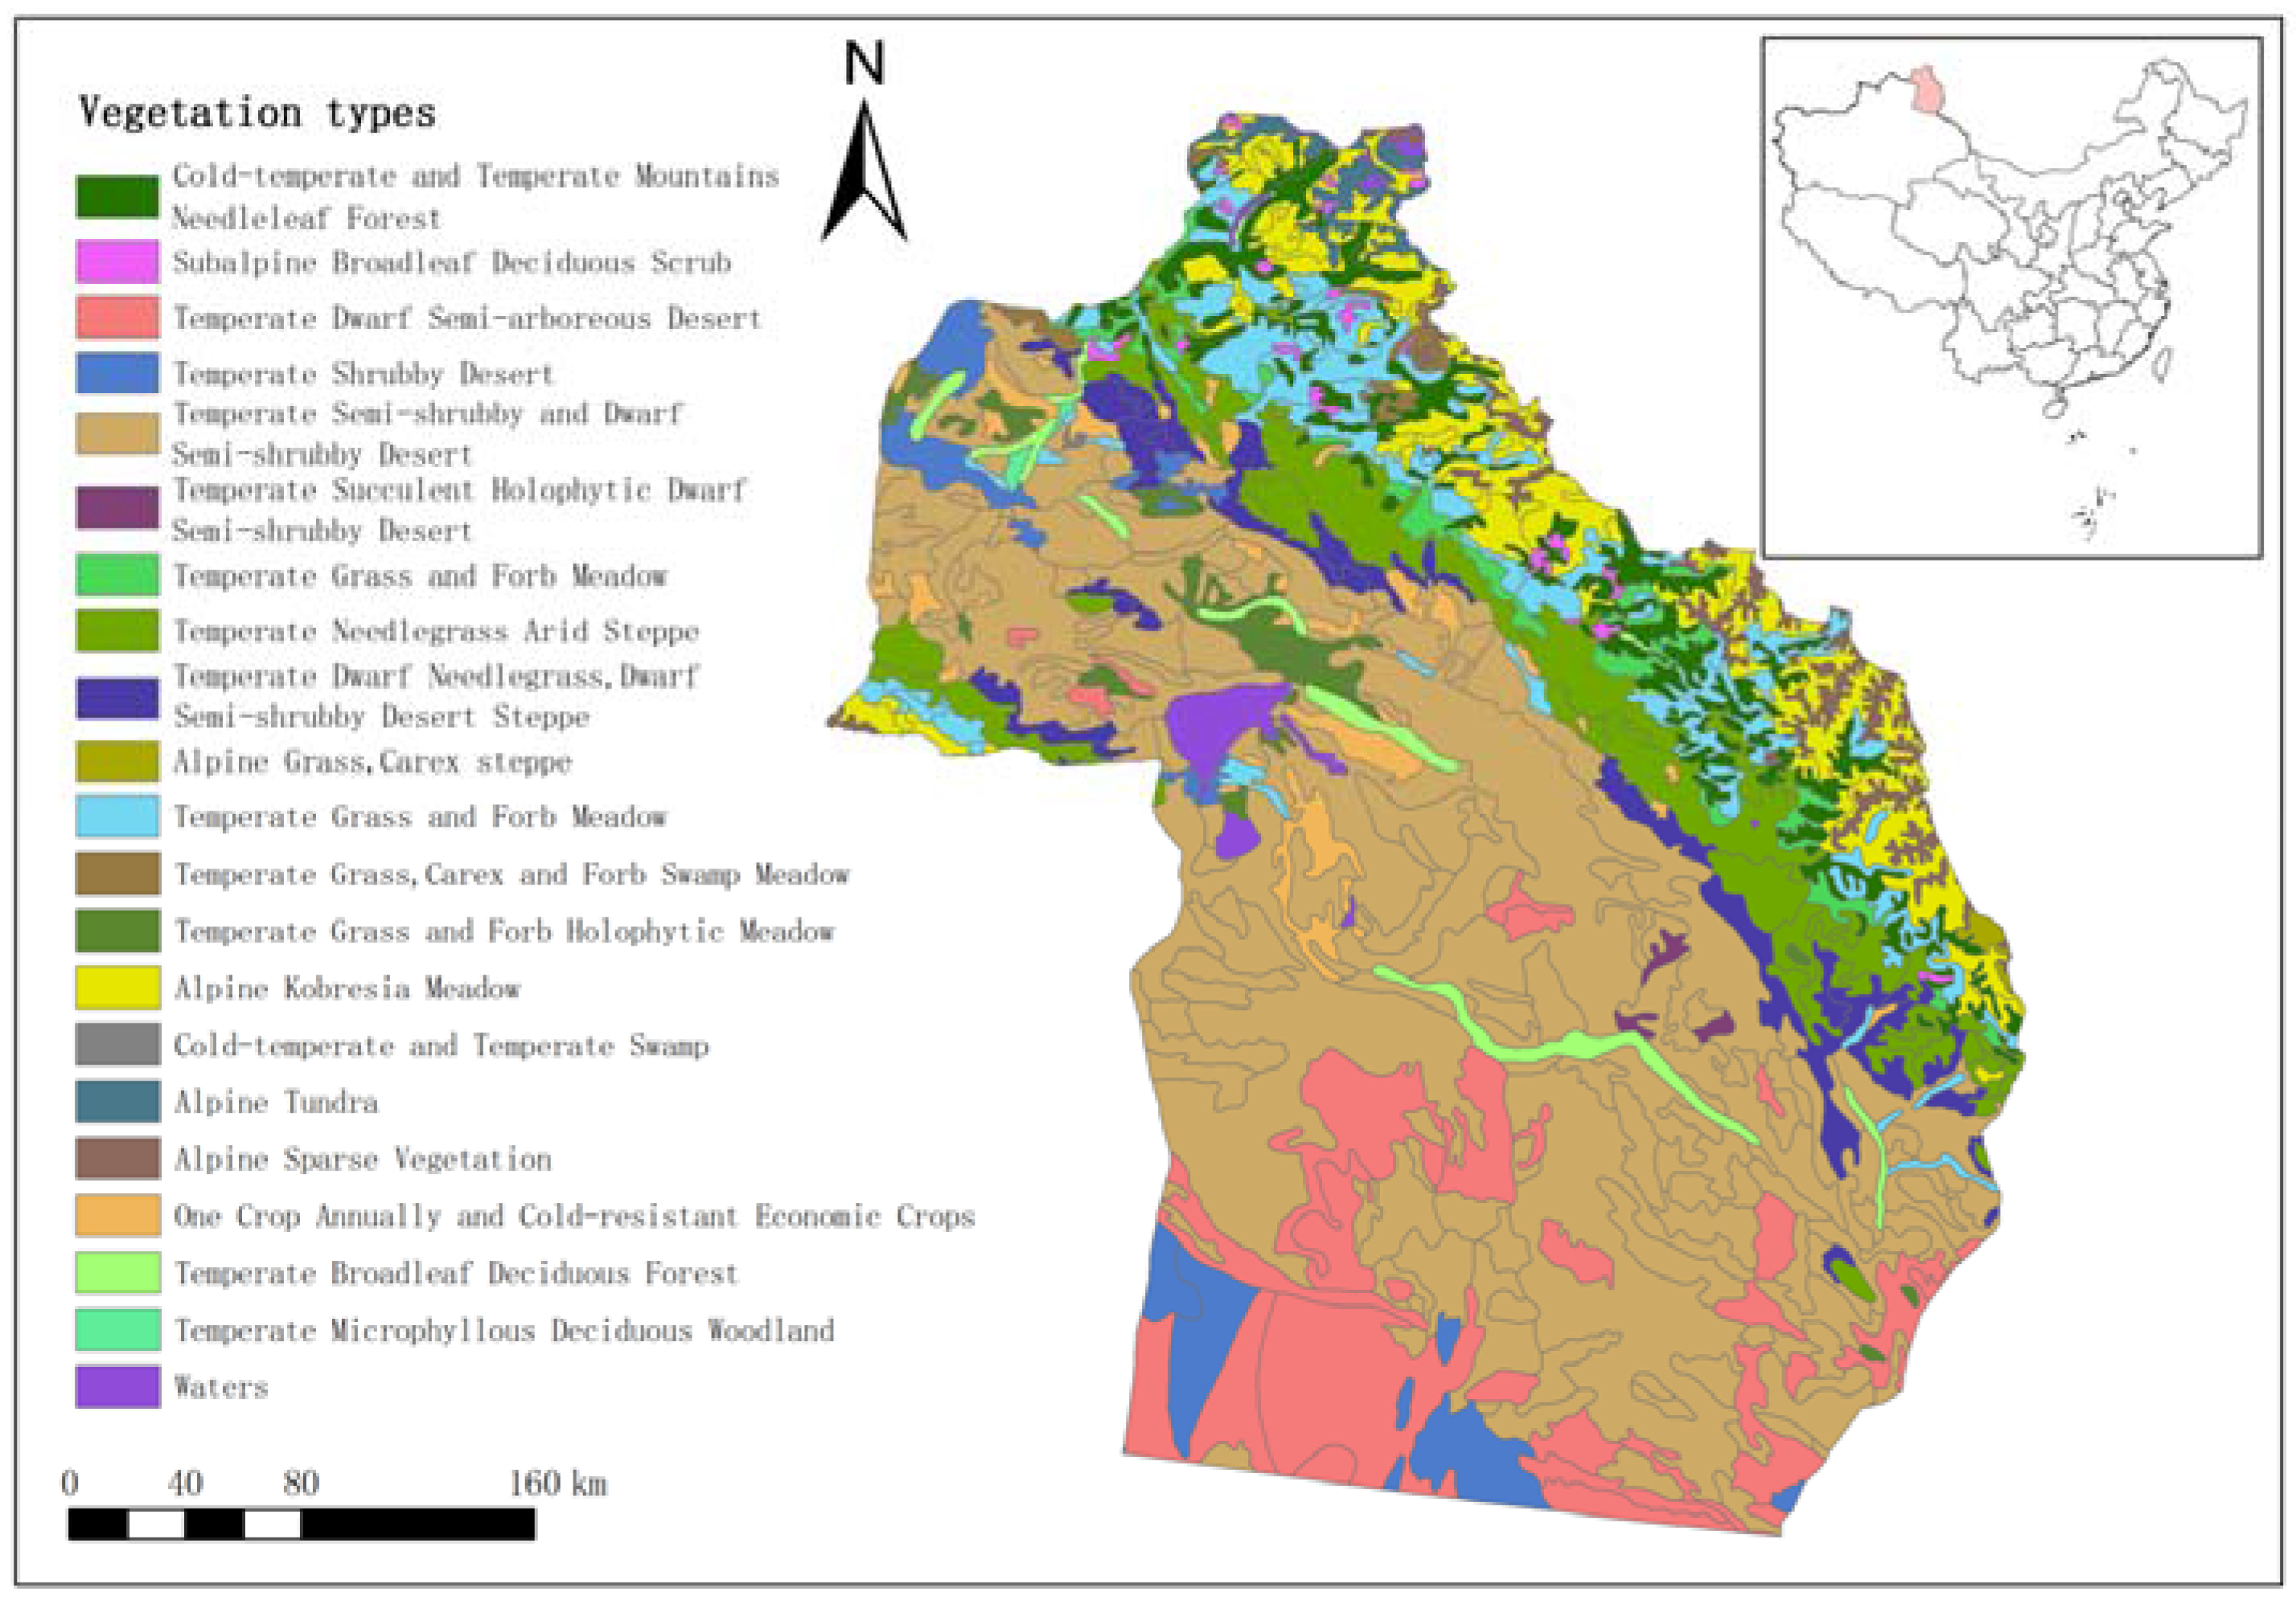
2.1. Study Area

Altay Prefecture, a border area in the north of Xinjiang Uygur Autonomous Region in China, is located at the southern foot of the Altai Mountains to the north of the Junggar basin, adjacent to Russia, Mongolia, and Kazakhstan (Figure 2). The area of Altay Prefecture is 118,000 km2 and the population is 663,400 (2012). It is in the semi-arid and arid climatic belt of the Temperate Climate Zone, and is located in the central part of mainland Asia, with complex landforms alternating between mountains and basin areas. Here, the winter is long and cold, and the summer is short and moderate in temperature; the annual average precipitation is 0–200 mm, while, in the mountainous zones, it is in the range of 400–600 mm (Table 1). Altay Prefecture is an important component of the desert ecosystem and a typical MBS in Northwest China.
Currently, many problems emerge in this region, such as grassland degradation, forests deforestation, land salinization, paludification, and desertification. Fragile ecological environment induced the serious imbalance of the nature-society-economy compound ecosystem, which has already become the bottleneck that restricts economic and social sustainable development.
Figure 2. Location and land cover of Altay Prefecture.
Sustainability 07 08335 g002
Table 1. Average value of main climate elements in every meteorological station in Altay Prefecture over a period of many years.
KabaheJeminayBuerjinFuhaiAltayFuyunQinghe
Latitude (N)48°03′47°26′47°42′47°07′48°44′46°59′46°40′
Longitude (E)86°24′85°52′86°52′87°28′88°05′89°31′90°23′
Altitude (m)534.5984.3475.6501.9736.5809.71220.3
Precipitation (mm)183.7206.3139120.7190.1185.8170.1
Temperature (°C)4.94.74.74.24.530.8

2.2. Data

The precipitation data for this study was obtained from the China Meteorological Data Sharing Service System [31]. The vegetation data set was provided by the Data Center for Resources and Environmental Sciences, Chinese Academy of Sciences (RESDC) [32]. The soil data were provided by the Environmental and Ecological Science Data Center for West China, National Natural Science Foundation of China [33]. DEM and NDVI data were obtained from the Geospatial Data Cloud [34]. LUCC (Land-Use and Land-Cover Change) data, nature-reserve data and base geography data of the study area were provided by the Data Sharing of Earth System Science, a national basic science and technology platform [35]. The monthly average rainfall dataset, monthly average temperature dataset, and daily average total radiation dataset were obtained from the Human-Earth System Database, which is an information project of the Chinese Academy of Sciences [36]. Data are for 2010.
The vector and raster data were converted to the Krasovsky_1940_Transverse_Mercator projection using the projection function of ArcGIS 9.3. Next, the cell-size of raster data was converted to 1 km × 1 km via resampling.

2.3. Methods

2.3.1. Water Yield

The rapid growth of the global population and frequent abnormal weather occurrences have led to increases in water demand and rapid deterioration of watershed environments [37,38]. The water-resource shortage has become an issue of global concern. Given the essential need to maintain the health of ecosystems, water conservation is an important function. Water conservation can block and store rainfall, purify water, and effectively conserve the water in the soil. The important factors influencing water resources in arid regions are precipitation and evaporation, thus, we choose water balance method to calculate water yield [39]. The annual water yield Q is calculated as:
Q = P E ± S P E
Assuming that water storage change ( S ) at regional scale is negligible [40]; P is the annual precipitation, which is from the interpolation of meteorological data. According to the findings of Zhou and Zhang [41], E is the actual evapotranspiration. The formula is as follows:
E ( x , t ) = { P ( x , t ) × R n ( x , t ) × [ P 2 ( x , t ) + R n 2 ( x , t ) + P ( x , t ) × R n ( x , t ) ] } / { [ P ( x , t ) + R n ( x , t ) ] × [ P 2 ( x , t ) + R n 2 ( x , t ) ] }
where P ( x , t )   and R n ( x , t ) are the precipitation and net solar radiation (MJ∙m-2) at the pixel x in month t .

2.3.2. Soil Conservation

Soil erosion results in a thinner, less fertile, and less productive soil layer. Additionally, large amounts of carried silt tend to clog and pollute rivers, lakes, and estuaries, causing more waste from farmlands, environmental deterioration, and natural disasters [42]. Soil erosion has become one of the most serious global issues due to the frequency of its occurrence, which is a great hindrance to economic development in mountainous regions [43]. Forest vegetation is the most important factor in effective soil conservation, and it exerts an obvious influence on soil erosion.
Altay Prefecture is located in the Mid-Temperate Continental Climate Zone. The coniferous forests therein play a very large role in soil conservation. We used the Revised Universal Soil Loss Equation (RULSE) to estimate potential and actual soil erosion, the difference between which is the conserved soil. Potential soil erosion refers to lost soil in cases where there are neither vegetation coverage nor conservation measures, while actual soil erosion refers to the lost soil calculated in cases where vegetation coverage and conservation measures exist.
The calculation formula is as follows:
A c = A r A
A =   R × K × L S × C × P
A r = R × K × L S
where A c is the conserved soil per unit area (t∙hm−2∙a−1); A is the actual soil erosion per unit area (t∙hm−2∙a−1); A r is the potential soil erosion per unit area (t∙hm−2∙a−1); R is the rainfall and runoff factor (MJ∙mm∙hm−2∙h−1); K is the soil erosion factor (t∙hm2∙h∙hm−2∙MJ−1∙mm−1); L S is the slope’s length-slope factor; C is the vegetation coverage factor and P is the soil and water-conservation measure factor. The model parameters are provided in Table 2.
Table 2. Parameters of soil erosion model in Altay Prefecture.
ParametersComputational method
R [44]
R = 0.207 P · I 60 / 100 1.205

Where P is the average annual rainfall, I 60 is the maximum annual rainfall in 60 minutes.
K [45]
K = { 0.2 + 0.3 × exp [ 0.0256 S A N ( 1 S I L / 100 ) ] }   [ S I L / ( C L A + S I L ) ] 0.3 × { 1 0.025 × C / [ C + exp ( 3.72 2.95 C ) ] } { 1 0.7 × S N 1 / [ S N 1 + exp 22.9 S N 1 5.51 ] }

Where S A N , S I L , C L A and C are the content of sand, silt, clay and organic, respectively.
LS [46,47]
L = ( λ / 22.13 ) m

Where λ is the slope length, m is the index of slope length.
S = { 10.8 s i n α + 0.03                                   α < 5 ° 16.8 s i n α 0.5                   5 α < 10 ° 21.9 s i n α 0.96                               α 10 °

Where α is the slope.
C [48]
C = { 1 f = 0               0.6508 0.3436 l n f 0 f 78.3 % 0 f 78.3 % }
f = ( N D V I N D V I S ) / ( N D V I V N D V I S )

Where f is the vegetation coverage, N D V I is the normalized differential vegetation index, N D V I S is the NDVI of bare land, N D V I V is the NDVI of full vegetation cover land.
P [49]
P = 0.2 + 0.03 β

Where β is the percentile slope gradient.

2.3.3. Net Primary Productivity

Net primary productivity refers to the quantity of organic matter accumulated by green plants per unit area per unit time, which reflects the productivity of vegetation under certain environmental conditions [50]. Typically, the climatic production potential model, ecosystem process model, and luminous energy utilization ratio model are used to calculate net primary productivity. We used the CASA (Carnegie-Ames-Stanford Approach) model. The concrete model is as follows [51]:
N P P ( x , t ) =   A P A R ( x , t ) ×   ε ( x , t )
where A P A R ( x , t ) and ε ( x , t ) , respectively, represent the photosynthetically active radiation (gC∙m−2∙month−1) and actual luminous energy utilization ratio (gC∙MJ−1) at the pixel x in month t .
A P A R ( x , t ) = S O L ( x , t ) ×   F P A R ( x , t ) × 0.5
F P A R ( x , t ) = [ F P A R ( x , t ) N D V I + F P A R ( x , t ) S R ] / 2
F P A R ( x , t ) N D V I = { [ N D V I ( x , t )   N D V I i ,   m i n ] × ( F P A R m a x F P A R m i n ) } / [ ( N D V I i , m a x N D V I i , m i n ) + F P A R m i n ]
F P A R ( x , t ) S R   = { [ S R ( x , t ) S R i , m i n ] × ( F P A R m a x F P A R m i n ) } /   [ ( S R i , m a x S R i , m i n ) + F P A R m i n ]
S R ( x , t ) = [ 1 + N D V I ( x , t ) ] / [ ( 1 N D V I ( x , t ) ) ]
where S O L ( x , t ) and F P A R ( x , t ) are the total solar radiation (gC∙m−2∙month−1) and photosynthetically active radiation proportions at the pixel x in month t , respectively, the constant of 0.5 is the proportion of effective solar radiation adsorbed by vegetation to total radiation; F P A R ( x , t ) N D V I and F P A R ( x , t ) S R are the photosynthetically active radiation proportions calculated according to the NDVI and EVI, respectively, 0.95 and 0.001 are assigned to F P A R m a x and   F P A R m i n , respectively, N D V I i , m a x and N D V I i , m i n are the maximum and minimum values of the vegetation type i , S R i , m a x and S R i , m i n are the quantile fractals of 95% and 5% of vegetation type i , N D V I ( x , t ) and S R ( x , t ) are the NDVI and EVI, respectively, at the pixel x in month t.
The findings of Potter et al. [52] show that the maximum luminous energy utilization ratio can be achieved only under ideal conditions, but under practical conditions it is limited by temperature and water content. The following formula expresses this relationship:
ε ( x , t ) = T ε 1 ( x , t ) × T ε 2 ( x , t ) × W ε ( x , t ) × ε m a x
T ε 1 ( x , t ) = 0.8 + 0.02 × T o p t ( x ) 0.0005 × [ T o p t ( x ) ] 2
T ε 2 ( x , t ) = 1.184 / { 1 + e x p [ 0.2 × ( T o p t ( x ) 10 T ( x , t ) ) ] } × 1 / { 1 + e x p [ 0.3 × ( T o p t ( x ) 10 + T ( x , t ) ) ] }
W ε ( x , t ) = 0.5 + 0.5 × E ( x , t ) / E p ( x , t )
where ε m a x is the maximum luminous energy utilization ratio(gC∙MJ-1); T ε 1 ( x , t ) , T ε 2 ( x , t ) and W ε ( x , t ) are the stress coefficient values of the maximum luminous energy utilization ratio at low temperature, at high temperature and in the event there is water content, respectively. We adopted the maximum luminous energy utilization ratio simulation values of different vegetation types given by Zhu et al. [51]. T o p t ( x ) is the most appropriate temperature for vegetation to grow, and it is defined as the monthly average temperature (°C) of a given area corresponding to the month in which the maximum value occurs in a year. If the month’s average temperature is –10 °C or below, the value of T ε 1 is 0, and the month’s average temperature T o p t ( x ) is 13 °C or 10 °C lower than the most appropriate temperature T o p t ( x ) in the year, then the month’s T ε 2 value is half of the value of T ε 2 when the monthly average temperature is the most appropriate temperature T o p t ( x ) . E ( x , t ) and E p ( x , t ) are the actual and potential evaporation rates, respectively.

2.3.4. Spatial Analysis

According to the method above, layers were substituted into the raster calculator in the spatial analysis function of ArcGIS 9.3 to obtain Figure 3. Table 2 was obtained through data statistics and unit conversion using zonal statistics in the spatial analysis function. Logistic regression model was used to analyze the relationship between ecosystem services. The grid cell of each service is 1 km × 1 km. In order to guarantee the accuracy of the results, values of all pixels are imported into the regression model instead of the sampling method.

3. Results

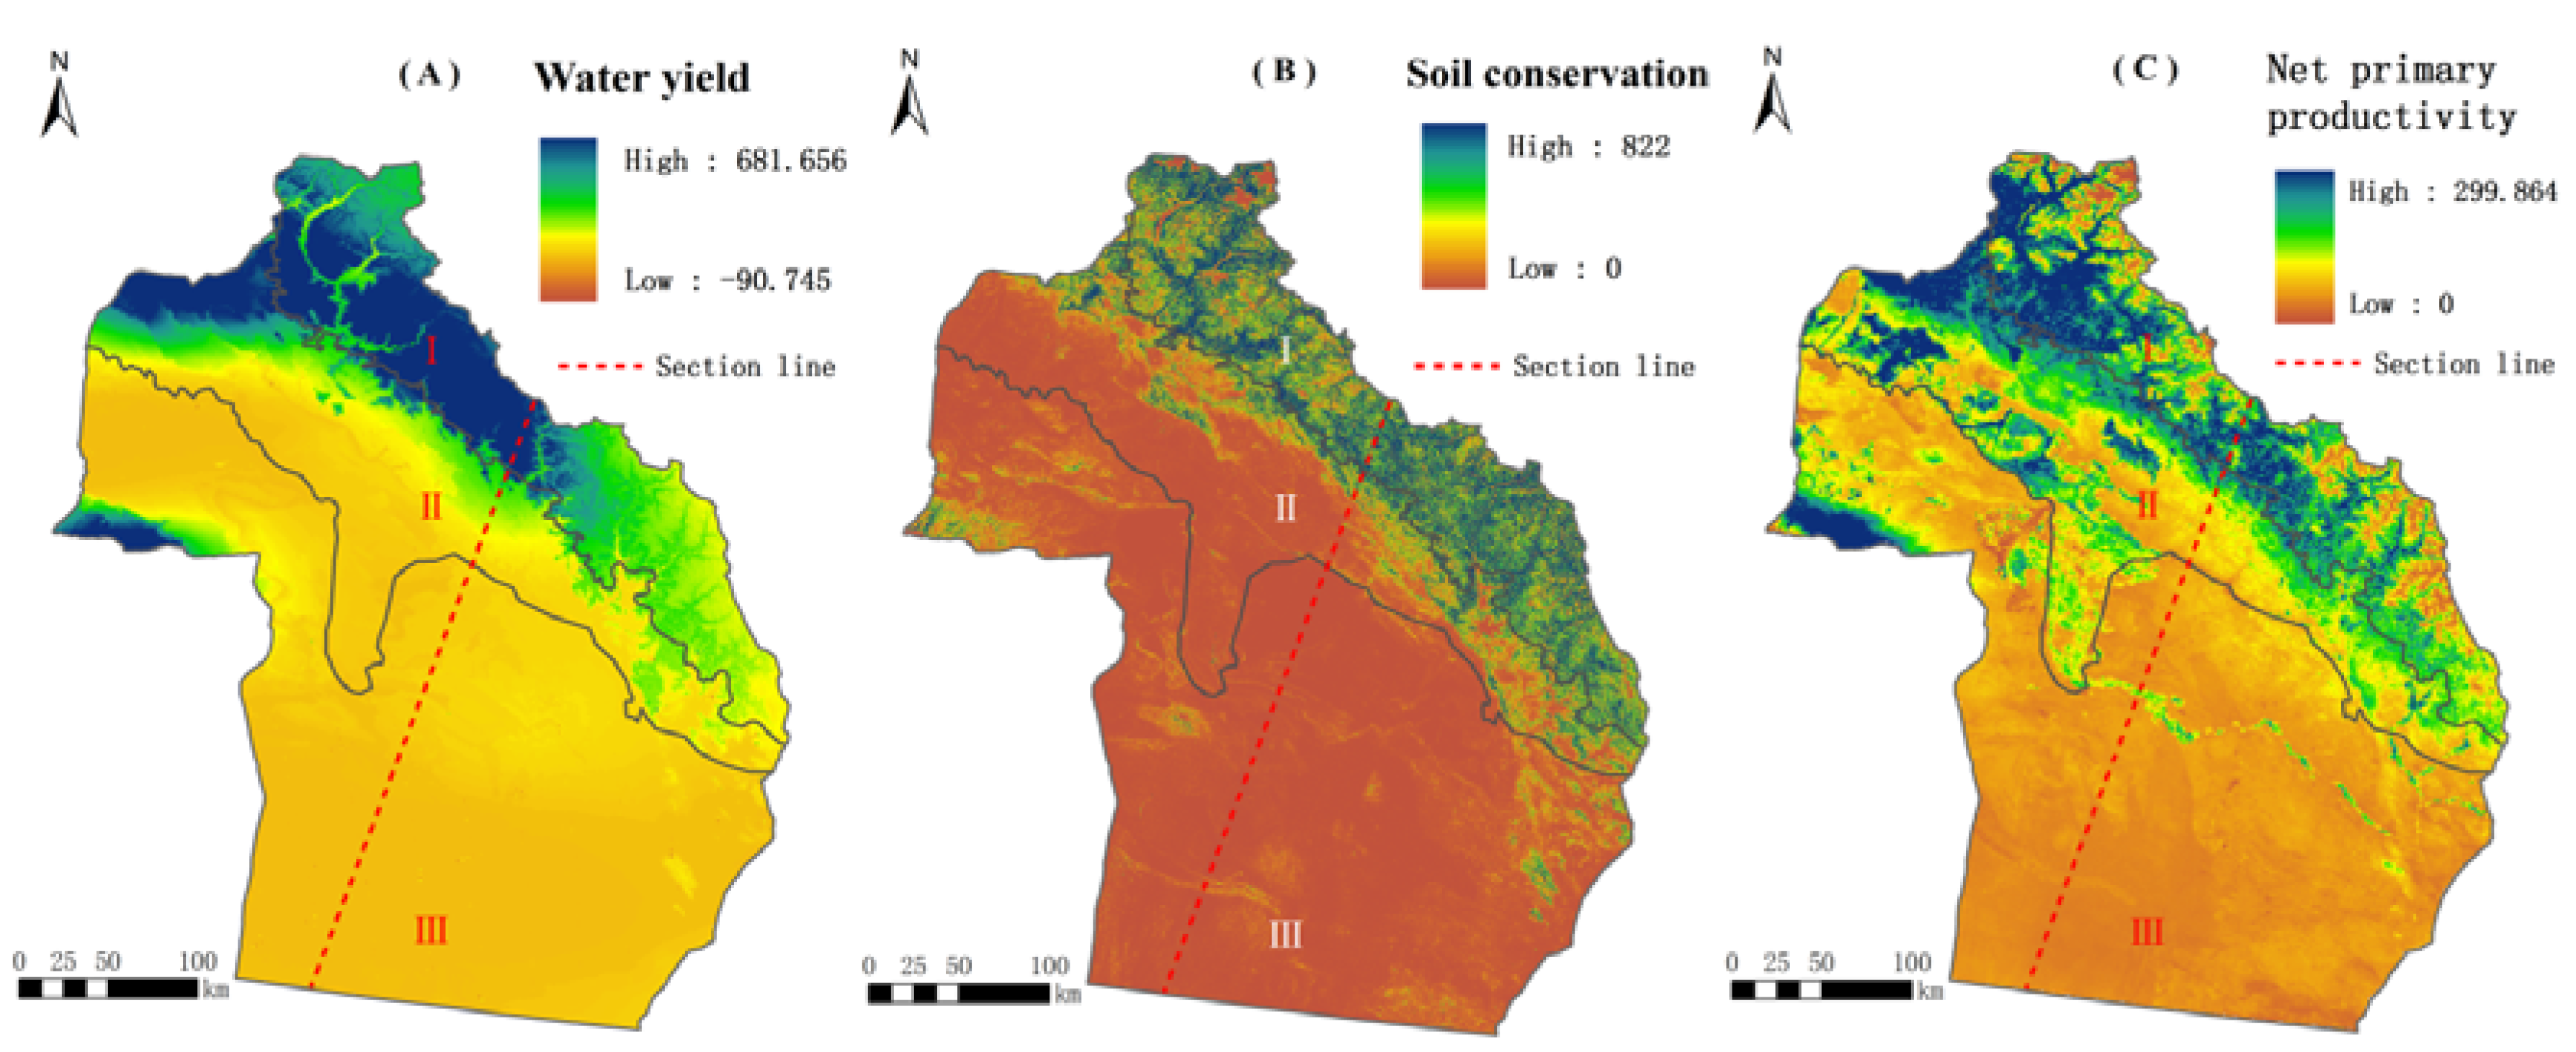
3.1. Spatial Distribution Patterns

The mountain zone has themost water yield, with 3.99 × 10⁹ m3 accounting for 56%, and oasis and desert zone accounts for 31% and 13%, respectively (Figure 3A and Table 3). Zones with more water yield are distributed in the mountain zone and mountain-oasis ecotone and are characterized by alpine Kobresia meadow and temperate needle-grass arid steppe. High vegetation coverage and low evaporation are the main reasons leading to such spatial distribution patterns. Alpine meadows have very high water cutoff and storage capacity and are precious "mountainous water reservoirs" in the region. The conserved water resources seep in the form of ground water and spill out in low-altitude oases to maintain the livelihood. However, if water conservation function is lost in the region, the natural mountainous water reservoirs would exert no buffering action upon melting glaciers and rainstorms, thus, causing flood disasters that could affect the livelihood and grain-production activities of the residents at the foot of the mountains. If the water from melting glaciers is not conserved throughout the year, droughts would ensue.
Soil conservation in mountain, oasis, and desert zones account for 67%, 21% and 12%, respectively (Figure 3B and Table 3). Zones with more conserved soil are distributed in the mountain zone and mountain-oasis ecotone. The main vegetation types include cold-temperate and temperate mountains needleleaf forest, alpine Kobresia meadow and alpine sparse vegetation. The region has the Altai Mountains as its screen in the north and is adjacent to the north edge of the Junggar Basin, so there is considerable climate difference between its southern and northern parts. The northern mountainous area features abundant rainfall, as well as infrequent and slight winds, while the southern plain area features low rainfall and frequent strong winds. If the soil conservation function is lost, the quaternary deposits on the steep slope would run down with water due to summer rainfall, glacial melting, etc., thus, bringing about geological disasters, such as landslide or mud and debris flow [53]. This is not only a great threat to the safety and property of people residing in the piedmont and oasis zones, but also a destructive factor for mountainous vegetation, thus, having an adverse impact on the water conservation service and perpetuating a vicious cycle.
Net primary productivity in mountain, oasis and desert zone account for 35%, 34% and 31%, respectively (Figure 3C and Table 3). However, the highest net primary productivity per unit area is in the mountain zone. Similarly, zones with more net primary productivity are distributed in the mountain zone and mountain-oasis ecotone, and the main vegetation types include cold-temperate and temperate mountains needle-leaf forest and temperate grass and forb meadow. The region has sufficient water and heat conditions, high vegetation coverage and less human development activity. Net primary productivity plays an irreplaceable role in adjusting the global carbon balance, alleviating the concentration increases of greenhouse gases, such as carbon dioxide, etc. Fossil-fuel burning and land cover change are changing the atmosphere’s composition, as well as the characteristics of the Earth’s surface, which absorbs or scatters solar radiation [54]. If the forests in the region were destroyed, not only net primary productivity, but also water yield, soil conservation, and other services would be adversely affected.
Figure 3. Spatial distribution patterns of ecosystem services in Altay Prefecture with resolution of 1 km (2010). (Ⅰ) Mountain zone; (Ⅱ) Oasis zone; (Ⅲ) Desert zone; (A) Water yield (mm·a−1); (B) Soil conservation (t·hm−2·a−1); (C) Net primary productivity (gC·m−2·a−1).
Sustainability 07 08335 g003
Table 3. Total and area-average amount of ecosystem services in the MBS (2010, Altay).
ZoneArea (km2)Percentage of total area (%)Water yield per unit area (m3·km-2)Total water yield (m3)Conserved soil per unit area (t·km-2)Total conserved soil (t)Net primary productivity per unit area (t·km-2)Total net primary productivity (t)
Mountain2.25 × 10418.981.78 × 1053.99 × 1091.32 × 1042.96 × 1081.33 × 1033.28 × 106
Oasis2.84 × 10423.997.64 × 1042.17 × 1093.36 × 1039.54 × 1070.11 × 1033.24 × 106
Desert6.75 × 10457.031.31 × 1048.84 × 1080.78 × 1035.24 × 1070.43 × 1022.88 × 106

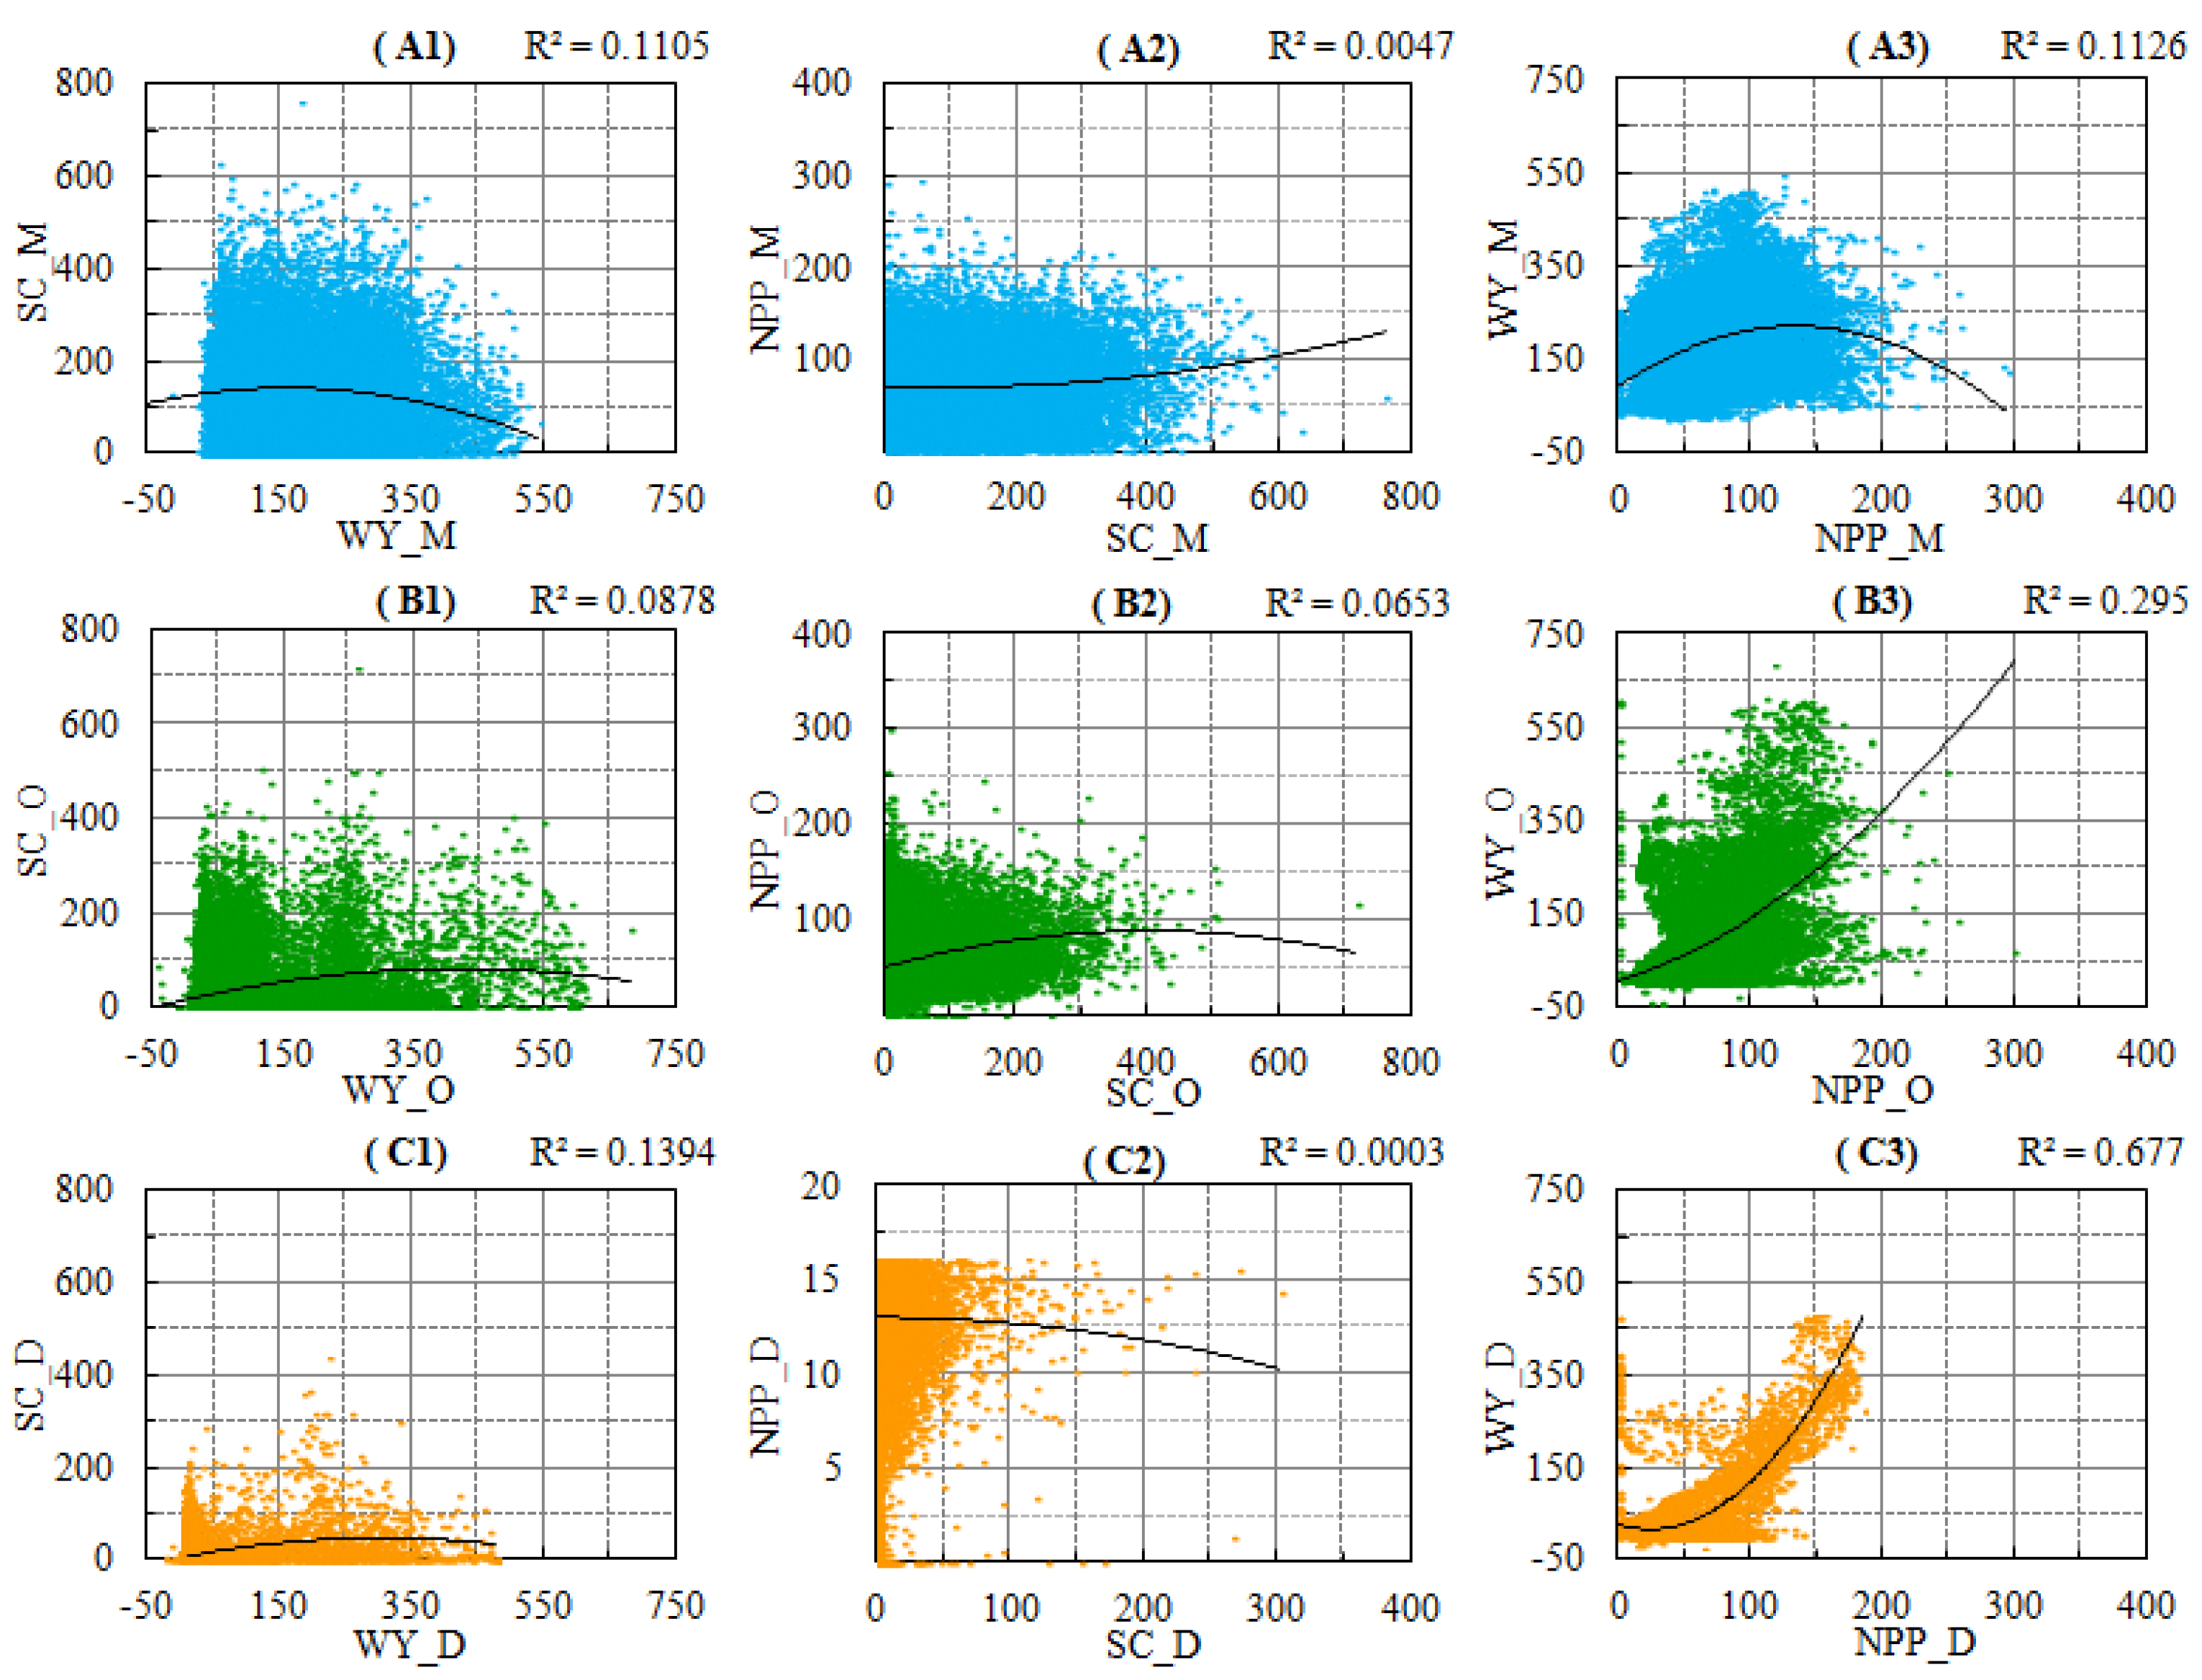
3.2. Spatial Correlations between Ecosystem Services

The interactions between multiple ecosystem services are usually trade-off and synergy. Trade-off is often seen as the inhibition effect of one or more services on the others, and the spatial pattern manifests the characteristics of high-value zone of a service and low-value zone of the others. Synergy refers to a high consistency in the spatial distributions of ecosystem services. The relationship between them is mutual benefit, and there is no high-value or low-value zone in spatial pattern [55]. As can be seen from Figure 4, there is a strong synergy correlation between water yield and net primary productivity in the desert zone (R2 > 0.5), a moderate correlation in the oasis zone, and a weak correlation in the mountain zone. Water is the leading factor restricting vegetation growth in the desert zone, which is different from the mountain zone and oasis zone. There are weak correlations between water yield and soil conservation in the mountain, oasis and desert zones, yet almost no correlation between soil conservation and net primary productivity in these zones. The correlations in the desert zone are stronger than the other zones.
Figure 4. Spatial corrections between ecosystem services in MBS. (p < 0.01). WY = Water yield; SC = Soil Conservation; NPP = NetPrimary Productivity; M = Mountain zone; O = Oasis zone; D = Desert zone.
Sustainability 07 08335 g004

4. Discussion

4.1. The Cause of the Unique Spatial Distributions of Ecosystem Services in MBS

Based on model evaluation, spatial distribution patterns of the three kinds of ecosystem services are analyzed. The results show that the mountain zone and the mountain-oasis ecotone are mainstays of ecosystem services, especially the latter. Vegetation coverage in the mountain zone is high, and the main vegetation types therein are coniferous forests and alpine meadows. The northern glaciers at high-altitude provide rich water and heat resources. Meltwater flows towards the southeast as altitude decreased, and biological species are abundant along the mainstream, especially in the eastern low-mountain zone due to water conservation. The mountainous-oasis ecotone is the link between ecosystem services and human well-being. It delivers ecological products to inhabitants by means of material and energy flows. It is also a natural screen that serves as a buffer between people and disasters, and can block any of the human-generated pollution from entering the mountain zone. This is a relationship pattern of source and sink. The mountain zone is the source of most ecosystem services, and the service is carried out through water flows, etc. The oasis zone is the sink where greater services are demanded because of intensive human activities. The mountain-oasis ecotone is the path connecting source and sink where materials and energy interact most frequently. Some reasons which may cause such a distribution pattern will be discussed below.

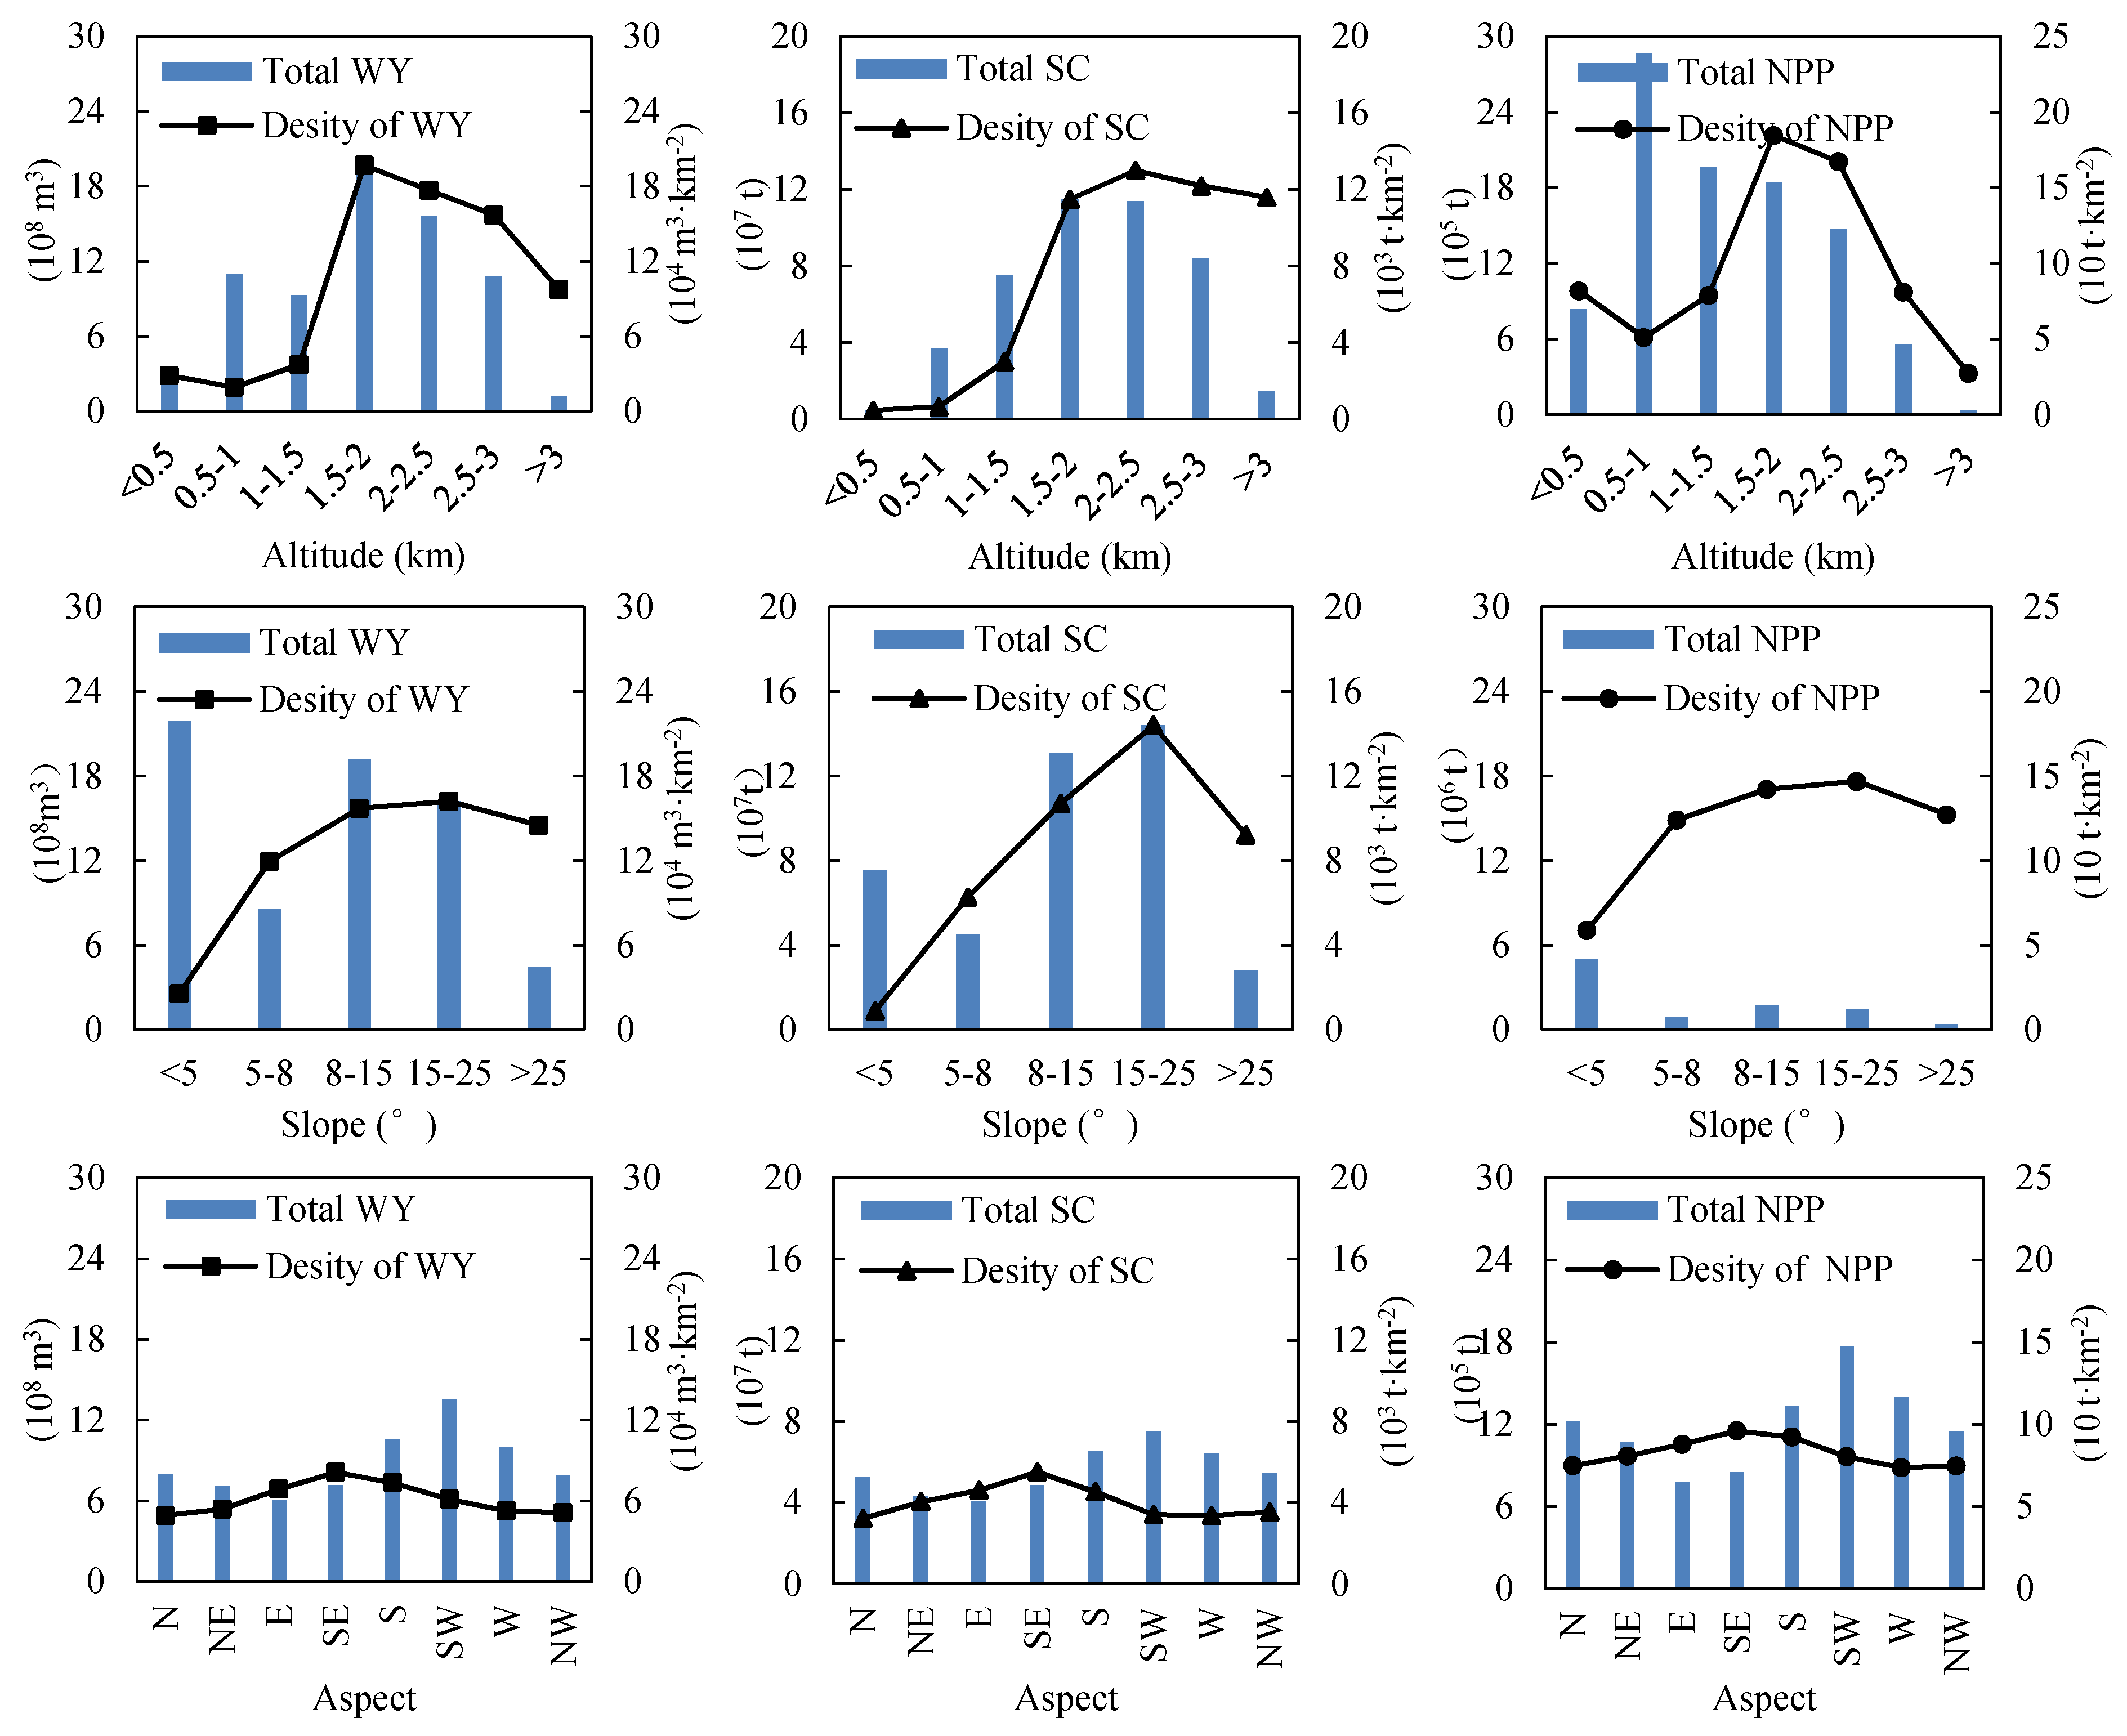
4.1.1. Topographical Factors

In terms of altitude, zones with the highest density of water yield and net primary productivity are distributed at 1.5–2 km-altitude. Taking river system into account, it is observed that these zones are distributed in the buffer of 0–5 km. Zones with the highest density of soil conservation are distributed at 2–2.5 km-altitude, followed by 1.5–2 km-altitude because of low temperature and high vegetation coverage throughout the year. From the view of the slope, zones with the highest density of water yield, soil conservation, and net primary productivity are all distributed at 15–25°-slope. Zones in <5°-slope have the most amount of water yield and net primary productivity, most of which are located in the desert zone. This illustrates that the habitat in the desert zone is bad, but the contributions to the arid region cannot be ignored. From the view of aspect, zones with the highest density of water yield, soil conservation, and net primary productivity are all distributed in the south, southeast, and southwest. As can be seen in Figure 5, altitude and slope have a great influence on the spatial distributions of ecosystem services, while the influence of aspect is smaller. Hotspots (high-value zones) of multiple services are obtained by overlaying the zones with 1.5–2 km-altitude, 15–25°-slope and aspects of south, southeast and southwest. Hotspots are distributed in the mountain-oasis ecotone and buffers of rivers in the low-mountain, and importance should be attached to the protection of this area.
Figure 5. Trends of total ecosystem services and density with topographical change. WY = Water Yield; SC = Soil Conservation;NPP = NetPrimary Productivity.
Sustainability 07 08335 g005

4.1.2. Spatial Heterogeneity of Ecosystem Services Caused by Human Activities

Ecosystem service is a result of the interaction between biophysics processes and socio-economic conditions [56]. Under the demands of human beings, the ecosystem turns its functions into services. The components, structure, and functions of the ecosystem have been influenced by human activities with the improvement of human’s ability to remake nature, which has seriously reduced service abilities [57]. Humans have different demands on resources, for example, pastures, wood, ore, and medical plants. The mountain zone has more amounts of ecosystem services because humans rarely step foot in. Since human activities appeared in the mountain-oasis zone, services have decreased. Herdsmen in Altay are accustomed to seasonal grazing, especially in spring and summer, so grassland and alpine meadows at high altitudes have suffered severe damage. Chinese Ephedra, Glycyrrhiza, Cistanche, etc., are precious wild plant resources for medical purposes, but most of them have suffered because of illegal behaviors, such as illegal gold mining and improper medical herb collection. The oasis is the congeries of population, providing food for human survival. In recent years, farmers and herdsmen have chopped down the forests in the ecotone in order to bring more land under cultivation and domestic animals have eaten large quantities of grass and seedlings, thus reducing their natural refreshing capacity and areas. Vegetation coverage reduction in the ecotone will lead to the disappearance of the ecological screen, which is very detrimental to the sustainable development of Altay Prefecture. Differences in human activities for exploiting natural resources are one of the main causes of different spatial distributions of services.

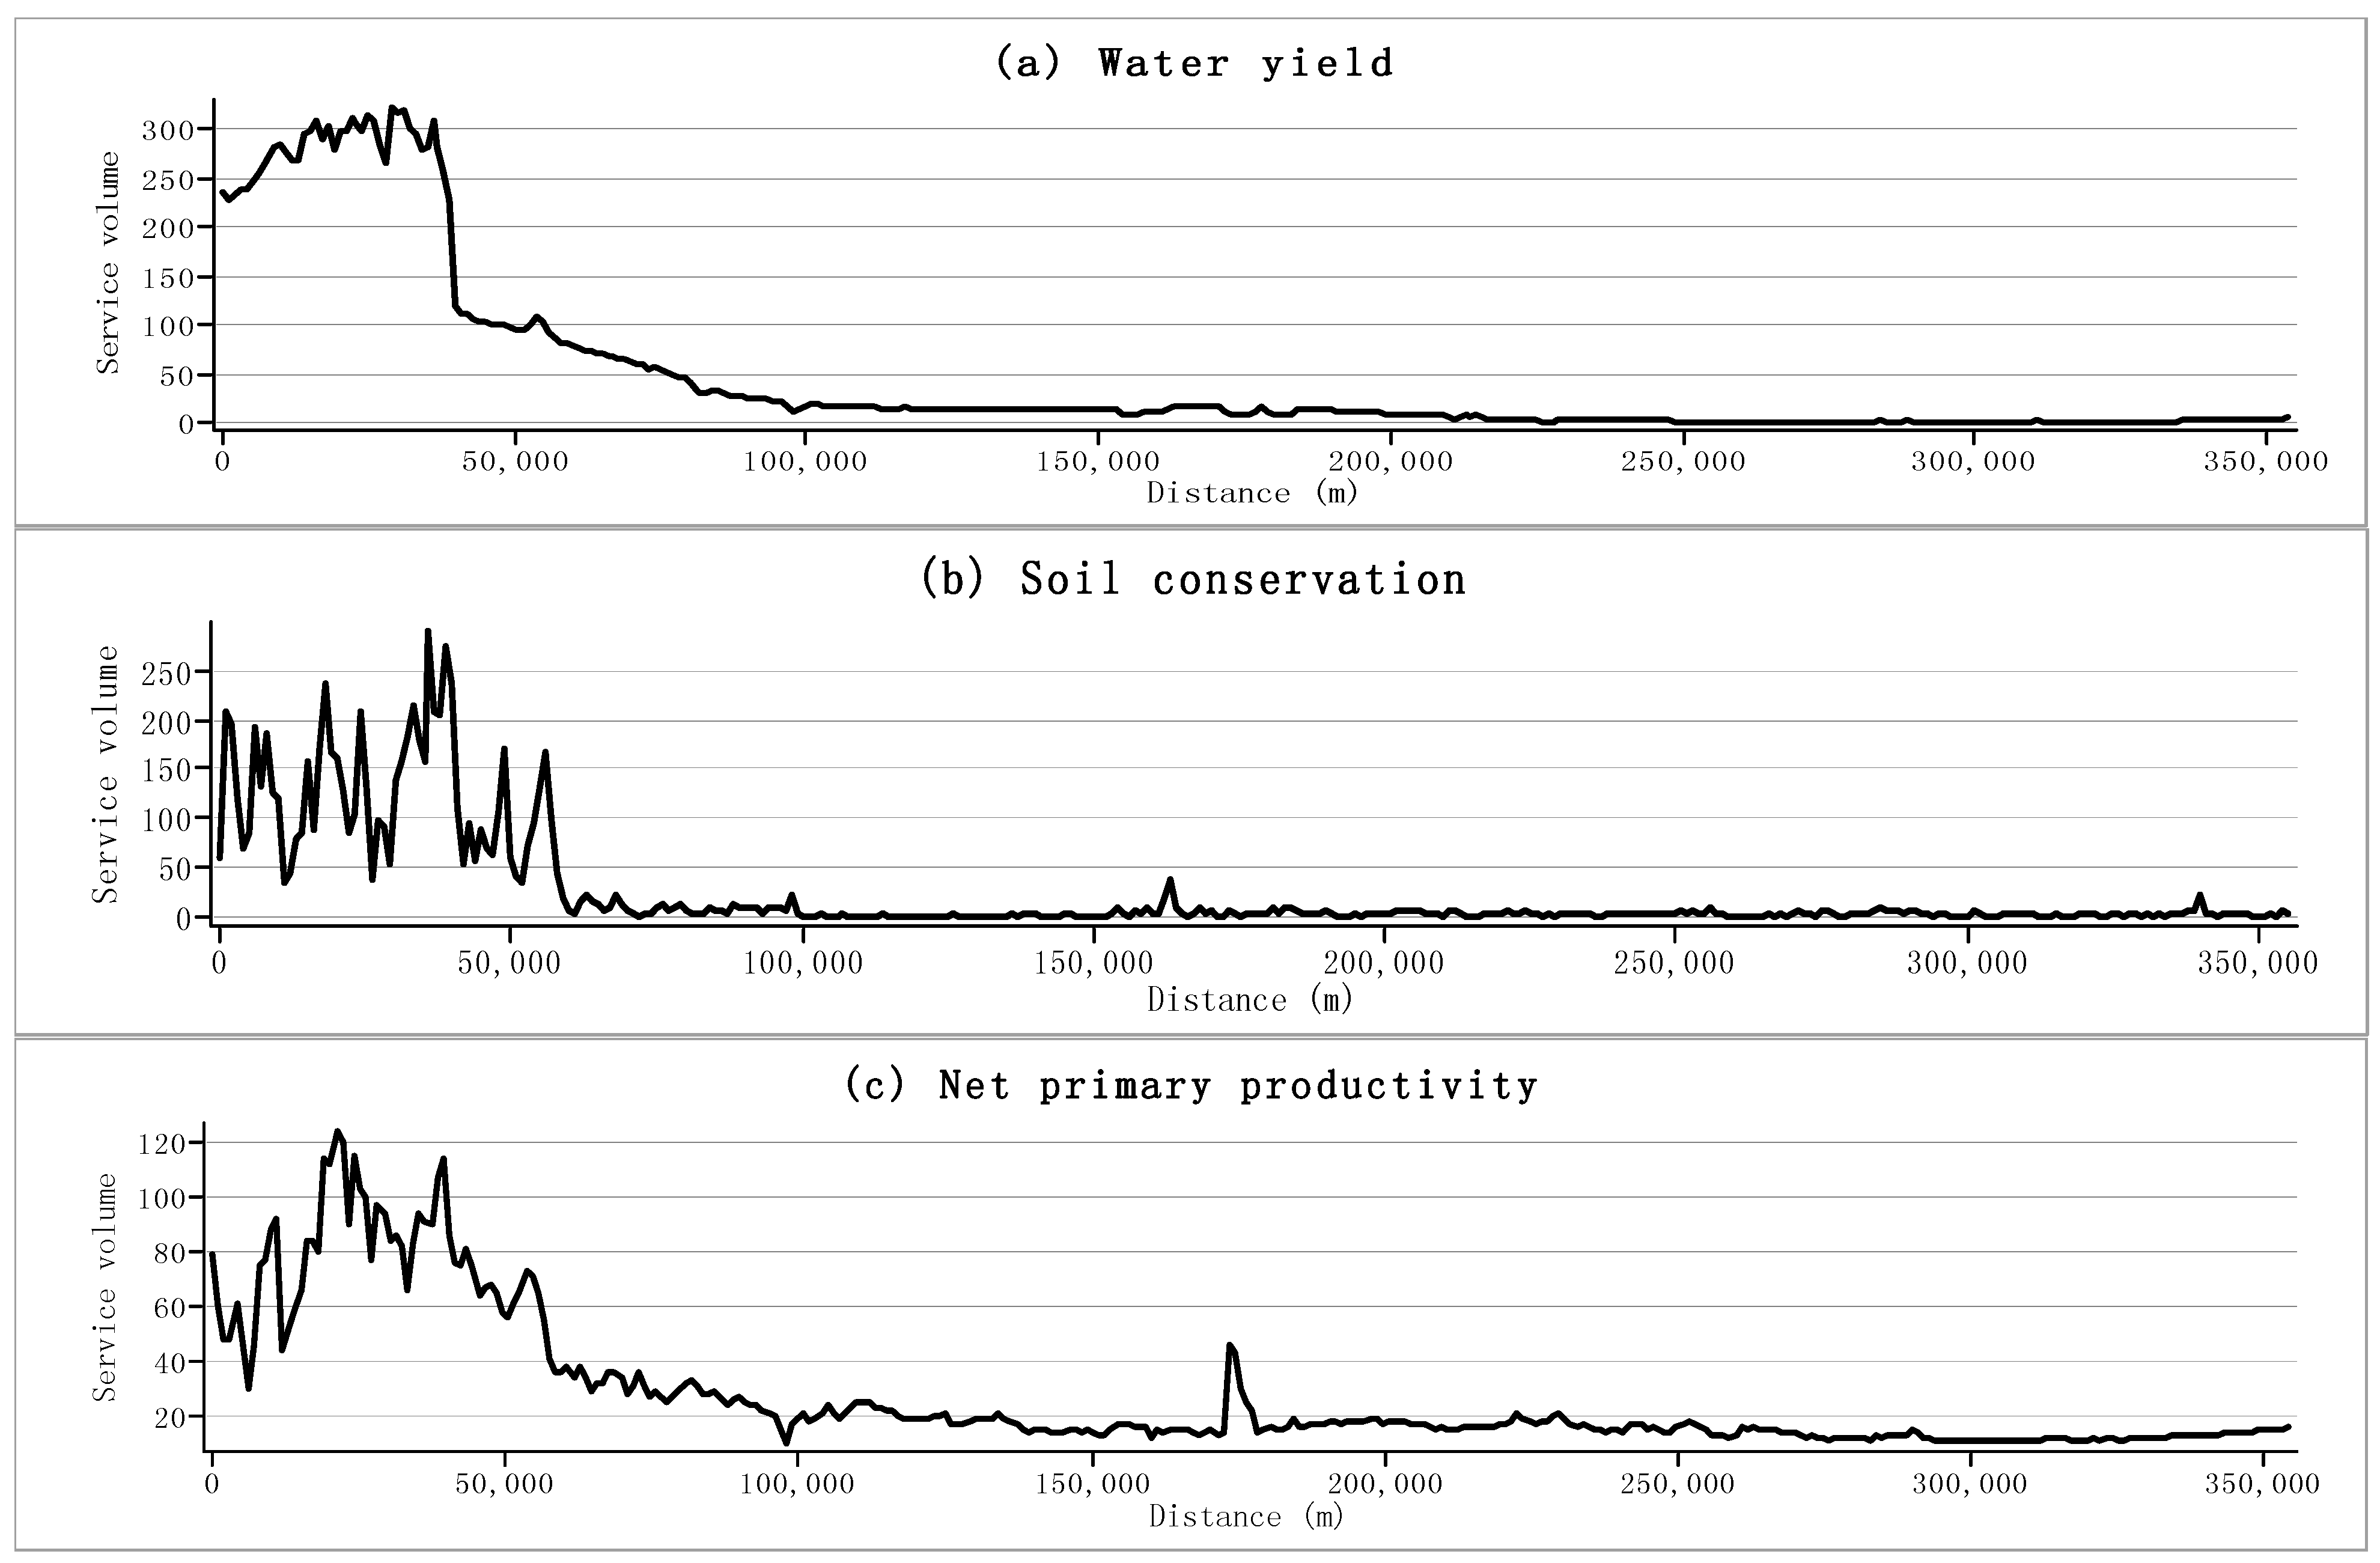
4.1.3. Spatial Distance Decay of Ecosystem Services

Due to the influence of natural factors and human activities, the intensity of some ecosystem services present apparent spatial distance decay [58]. For instance, the services of reducing waves and defending against storm surges decline significantly as the mangrove forests on tropical coastal tidal flats stretch away toward land. Large amount of water resource utilization in middle and lower reaches may reduce water supplies. The increase of distance will decrease the willingness to pay for entertainment and leisure services, etc. [55]. According to the topographical features of MBS, we analyzed the distance decay of three kinds of ecosystem services by selecting a typical area from north to south (Figure 3). With the increase of distance, three kinds of ecosystem services show pulsed decline (Figure 6). They sharply decrease at a 40 km-distance from the starting point of the profile where the junction of the mountain-oasis ecotone and oasis zone is located. This is related to the intensive human activities in the oasis zone. The change in characteristics of ecosystem services due to distance is a main cause of spatial heterogeneity.
Figure 6. Spatial distance decay of ecosystem services. (a) Water yield (mm·a−1); (b) Soil conservation (t·hm−2·a−1); (c) Net primary productivity (gC·m−2·a−1).
Sustainability 07 08335 g006

4.2. Study on Desert-Ecosystem Services Should Be Strengthened

The desert ecosystem is widely distributed in Central Asia’s arid regions. It is an important subsystem in the terrestrial ecosystem, yet it is the most fragile. The desert ecosystem contains an abundant and valuable gene bank of wildlife, and has formed its own unique ecosystem services. The services are not only the material foundation for the survival and development of humanity, but also provide an important guarantee for regional sustainable development. Thus far, ecosystem services of forest, grassland, farmland, and water have been intensively studied; nevertheless, very little attention has been paid to desert-ecosystem services [59]. For instance, Costanza et al. [2] estimated the value of global ecosystem services without the desert ecosystem. The research of Richardson [60], and Kroeger and Manalo [61] are the only two examples of international research regarding desert-ecosystem services valuation. We call for future research to focus on desert-ecosystem services.

5. Conclusions

The MBS in Altay Prefecture is a typical ecosystem structure in Central Asia’s arid regions, featuring mountain and basin alternations. Studies on ecosystem services in this region are very significant, but there are very few related studies. The distinct structure and function of the ecosystem in arid regions is the material base for the local people to survive and develop. It has important significance for enhancing our understanding of the importance of ecosystems, as well as the relationship between human well-being and services to quantitatively evaluate ecosystem services in Central Asia’s arid regions. Our study has the following characteristics: Firstly, evaluation models are used for ecosystem service evaluation to avoid the inflexible use of the value transfer method and objectively represent the ecosystem’s structure and functions. Secondly, the MBS theory was employed to examine ecosystem services to understand the forming and movement of ecosystem services from the aspects of structure and process, providing a basis for carrying out ecological conservation planning on a large scale. Additionally, GIS (Geographic Information System) is used to explore the cause of particular spatial distribution patterns, in terms of topographical factors, human activities, and spatial distance decay of services.The mountain zone is the source of most ecosystem services, where extensive exploitation is prohibited, especially logging and mining. The mountain-oasis ecotone is the hotspot of ecosystem services, which has provides delivery and ecological screening services, and overgrazing should be banned. Ecological protection has immense significance for regional sustainable development, so we encourage the local government to learn from successful experiences in the agricultural development of other arid regions (e.g., Negev Desert). Although the desert zone takes on sparse vegetation, water yield and net primary productivity are very considerable due to its large area. We suggest that scholars enhance studies on desert-ecosystem services to promote a harmonious development between human beings and nature.

Acknowledgments

This study was supported by National Science and Technology Support Plan of China (No. 2014BAC15B04). Hereby, we extend our thanks to China Meteorological Data Sharing Service System, Environmental and Ecological Science Data Centre for West China, Data Sharing Infrastructure of Earth System Science and Human-Earth System Database for their support in this study.

Author Contributions

Qi Fu designed and carried out the majority of the research with Bo Li. Linlin Yang and Zhilong Wu cooperated in the research, providing input throughout and reviewing details. Xinshi Zhang is the academic adviser. All authors wrote, reviewed, and commented on the manuscript. All authors read and approved the final manuscript.

Conflicts of Interest

The authors declare no conflict of interest.

References

  1. Daily, G.C. Nature’s Services: Societal Dependence on Natural Ecosystems; Island Press: Washington, D.C., USA, 1997; pp. 3–6. [Google Scholar]
  2. Costanza, R.; D’Arge, R.; de Groot, R.; Farber, S.; Grasso, M.; Hannon, B. The Value of the World’s Ecosystem Services and Natural Capital. Nature 1997, 387, 253–260. [Google Scholar] [CrossRef]
  3. MA (Millennium Ecosystem Assessment). Ecosystems and Human Well-Being; Island Press: Washington, D.C., USA, 2005; pp. 60–69. [Google Scholar]
  4. Kremen, C. Managing ecosystem services: What do we need to know about their ecology? Ecol. Lett. 2005, 8, 468–479. [Google Scholar] [CrossRef] [PubMed]
  5. Burkhard, B.; Fath, B.D.; Müller, F. Adapting the adaptive cycle: Hypotheses on the development of ecosystem properties and services. Ecol. Model. 2011, 222, 2878–2890. [Google Scholar] [CrossRef]
  6. Fu, B.; Wang, S.; Su, C.; Forsius, M. Linking ecosystem processes and ecosystem services. Curr. Opin. Environ. Sust. 2013, 5, 4–10. [Google Scholar] [CrossRef]
  7. Wallace, K.J. Classification of ecosystem services: Problems and solutions. Biol. Conserv. 2007, 139, 235–246. [Google Scholar] [CrossRef]
  8. De Groot, R.S.; Alkemade, R.; Braat, L.; Hein, L.; Willemen, L. Challenges in integrating the concept of ecosystem services and values in landscape planning, management and decision making. Ecol. Complex. 2010, 7, 260–272. [Google Scholar]
  9. Jansson, N.K.; Levin, S.; Lubchenco, J.; Mäler, K.G.; Simpson, D.; Starrett, D. The value of nature and the nature of value. Science 2000, 289, 395–396. [Google Scholar]
  10. Heal, G. Nature and the Marketplace: Capturing the Value of Ecosystem Services; Island Press: Washington, D.C., USA, 2000; pp. 265–294. [Google Scholar]
  11. Costanza, R.; de Groot, R.; Sutton, P.; van der Ploeg, S.; Andersond, S.J.; Kubiszewskia, I.; Farber, S.; Turner, R.K. Changes in the global value of ecosystem services. Global Environ. Chang. 2014, 26, 152–158. [Google Scholar] [CrossRef]
  12. Palmer, M.A.; Bernhardt, E.S.; Chornesky, E.A.; Collins, S.L.; Dobson, A.P.; Duke, C.S.; Gold, B.D.; Jacobson, R.; Kingsland, S.; Kranz, R.; et al. Ecological Science and Sustainability for A Crowded Planet; Ecological Society of America: Washington, D.C., USA, 2004. [Google Scholar]
  13. Sutherland, W.J.; Armstrong-brown, S.; Armsworth, P.R.; Tom, B.; Brickland, J.; Campbell, C.D.; Chamberlain, D.E.; Cooke, A.I.; Dulvy, N.K.; Dusic, N.R.; et al. The identification of 100 ecological questions of high policy relevance in the UK. J. Appl. Ecol. 2006, 43, 617–627. [Google Scholar] [CrossRef]
  14. Fang, X.N.; Zhao, W.W. Progress in the study of ecosystem services—A review of the 11th INTECOL Congress in 2013. Acta. Ecol. Sin. 2013, 33, 6736–6740. [Google Scholar] [CrossRef]
  15. Sagoff, M. The quantification and valuation of ecosystem services. Ecol. Econ. 2011, 70, 497–502. [Google Scholar] [CrossRef]
  16. Primmer, E.; Furman, E. Operationalising ecosystem service approaches for governance: Do measuring, mapping and valuing integrate sector-specific knowledge systems? Ecosyst. Serv. 2012, 1, 85–92. [Google Scholar] [CrossRef]
  17. Häyhä, T.; Franzese, P.P. Ecosystem services assessment: a review under an ecological-economic and systems perspective. Ecol. Model. 2014, 289, 124–132. [Google Scholar] [CrossRef]
  18. Ouyang, Z.Y.; Wang, X.K.; Miao, H.A. primary study on Chinese terrestrial ecosystem services and their ecological -economic values. Acta Ecol. Sin. 1999, 19, 607–613. [Google Scholar]
  19. Fu, B.J.; Zhang, L.W. Land-use change and ecosystem services: Concepts, methods and progress. Prog. Geog. 2014, 33, 441–446. [Google Scholar]
  20. Zhao, J.J.; Xiao, H.; Wu, G. Comparison analysis on physical and value assessment methods for ecosystems services. J. Appl. Ecol. 2000, 11, 290–292. [Google Scholar]
  21. Smith, M.D.; Crowder, L.B. Valuing ecosystem services with fishery rents: A lumped-parameter approach to hypoxia in the neuse river estuary. Sustainability 2011, 3, 2229–2267. [Google Scholar] [CrossRef]
  22. Willemen, L.; Hein, L.; van Mensvoort, M.E.F.; Verburg, P.H. Space for people, plants, and livestock? Quantifying interactions among multiple landscape functions in a Dutch rural region. Ecol. Indic. 2010, 10, 62–73. [Google Scholar] [CrossRef]
  23. Lü, Y.H.; Fu, B.J.; Feng, X.M.; Zeng, Y.; Liu, Y.; Chang, R.Y.; Sun, G.; Wu, B.F. A policy-driven large scale ecological restoration: quantifying ecosystem services changes in the Loess Plateau of China. Plos One. 2012, 7, e31782. [Google Scholar] [CrossRef] [PubMed]
  24. O’Farrell, P.J.; Reyers, B.; Le Maitre, D.C.; Milton, S.J.; Egoh, B.; Maherry, A.; Colvin, C.; Atkinson, D.; De Lange, W.; Blignaut, J.N. Multi-functional landscapes in semi arid environments: Implications for biodiversity and ecosystem services. Landsc. Ecol. 2000, 25, 1231–1246. [Google Scholar] [CrossRef]
  25. Zedler, J.B.; Kercher, S. Wetland resources: Status, trends, ecosystem services, and restorability. Annu. Rev. Env. Resour. 2005, 30, 39–74. [Google Scholar] [CrossRef]
  26. Chen, F.; Huang, W.; Jin, L.; Chen, J.; Wang, J. Spatiotemporal precipitation variations in the arid central Asia in the context of global warming. Sci. China Earth Sci. 2011, 54, 1812–1821. [Google Scholar] [CrossRef]
  27. Zhang, X.S. Ecological restoration and sustainable agricultural paradigm of mountain-oasis-ecotone-desert system in the north of the Tianshan Mountains. Acta Bot. Sin. 2001, 12, 1294–1299. [Google Scholar]
  28. Wang, R.H.; Ma, Y.J. Coupling relation among substance and energy as well as information in mountain-basin system in arid zone—taking mountainous system around Tarim Basin as an example. J. Mt. Sci. Engl. 2001, 19, 398–402. [Google Scholar]
  29. Li, Z.Y.; Pan, Z.P.; Qin, F.M.; Li, J.Y.; Han, J.; Meng, N. Silk Road economic belt: opportunities and challenges—A perspective of Xinjiang. J. Xinjiang Univ. 2013, 41, 1–3. [Google Scholar] [CrossRef]
  30. Chinese Academy of Sciences. Ecological conservation and new industry area construction consulting report about the socialist—realist system—North slope of Tianshan Mountains and the Junggar Desert. Bull. China. Acad. Sci. 2003, 3. Article 168. [Google Scholar]
  31. China Meteorological Data Sharing Service System. Available online: http://cdc.nmic.cn/home.do (accessed on 15 June 2015).
  32. Data Center for Resources and Environmental Sciences. Available online: http://www.resdc.cn (accessed on 15 June 2015).
  33. Environmental and Ecological Science Data Center for West China. Available online: http://westdc.westgis.ac.cn (accessed on 15 June 2015).
  34. Geospatial Data Cloud. Available online: http://www.gscloud.cn (accessed on 15 June 2015).
  35. Data Sharing of Earth System Science. Available online: http://www.geodata.cn (accessed on 15 June 2015).
  36. Human-Earth System Database. Available online: http://cdc.nmic.cn/home.do (accessed on 15 June 2015).
  37. Wiek, A.; Larson, K.L. Water, people, and sustainability—a systems framework for analyzing and assessing water governance regimes. Water Resour. Manag. 2012, 26, 315–371. [Google Scholar] [CrossRef]
  38. De Castro Carvalho, I.; Calijuri, M.L.; Assemany, P.P.; e Silva, M.D.F.M.; Neto, R.F.M.; da Fonseca Santiago, A.; de Souza, M.H.B. Sustainable airport environments: a review of water conservation practices in airports. Resour. Conserv. Recy. 2013, 74, 27–36. [Google Scholar] [CrossRef]
  39. Budyko, M.I. Climate and Life; Academic Press: San Diego, CA, USA, 1974; p. 508. [Google Scholar]
  40. Jia, X.; Fu, B.; Feng, X.; Hou, G.; Liu, Y.; Wang, X. The tradeoff and synergy between ecosystem services in the Grain-for-Green areas in northern Shaanxi, China. Ecol. Indic. 2014, 43, 103–113. [Google Scholar] [CrossRef]
  41. Zhou, G.S.; Zhang, X.S. Study on NPP of natural vegetation in China under global climate changes. Acta Phytoecol. Sin. 1996, 20, 11–19. [Google Scholar]
  42. Lantican, M.A.; Guerra, L.C.; Bhuiyan, S.I. Impacts of soil erosion in the upper manupali watershed on irrigated lowlands in the Philippines. Paddy Water Environ. 2003, 1, 19–26. [Google Scholar] [CrossRef]
  43. Pimentel, D.; Harvey, C.; Resosudarmo, P. Environmental and economic costs of soil erosion and conservation benefits. Science 1995, 267, 1117–1123. [Google Scholar] [CrossRef] [PubMed]
  44. Wischmeier, W.H.; Smith, D.D. Predicting Rainfall Erosion Loess: A Guide to Conservation Planning; Agricultural Handbook: Washington, D.C., USA, 1978; p. 537. [Google Scholar]
  45. Williams, J.R. The erosion-productivity impact calculator (EPIC) model: A case history. Philosophical Transactions of the Royal Society B. Biol. Sci. 1990, 329, 421–428. [Google Scholar] [CrossRef]
  46. McCool, D.K.; Brown, L.C.; Foster, G.R.; Mutchler, C.K.; Meyer, L.D. Revised slope steepness factor for the universal soil loss equation. Trans. ASAE. 1987, 30, 1387–1396. [Google Scholar] [CrossRef]
  47. Liu, B.; Nearing, M.A.; Risse, L.M. Slope gradient effects on soil loss for steep slopes. Trans. ASAE 1994, 37, 1835–1840. [Google Scholar] [CrossRef]
  48. Cai, C.F.; Ding, S.W.; Shi, Z.H.; Huang, L.; Zhang, G.Y. Study of applying USLE and geographical information system IDRISI to predict soil erosion in small watershed. J. Soil Water Conserv. 2000, 14, 19–24. [Google Scholar]
  49. Lufafa, A.; Tenywa, M.M.; Isabirye, M.; Majaliwa, M.J.G.; Woomer, P.L. Prediction of soil erosion in a lake victoria basin catchment using a GIS-based universal soil loss model. Agric. Syst. 2003, 76, 883–894. [Google Scholar] [CrossRef]
  50. Zhou, Z.X.; Li, J.; Feng, X.M. The value of fixing carbon and releasing oxygen in the Guanzhong-Tianshui economic region using GIS. Acta Ecol. Sin. 2013, 33, 2907–2918. [Google Scholar] [CrossRef]
  51. Zhu, W.Q.; Pan, Y.Z.; Zhang, J.S. Estimation of net primary productivity of Chinese terrestrial vegetation based on remote sensing. Chin. J. Plant Ecol. 2007, 31, 413–424. [Google Scholar]
  52. Potter, C.S.; Randerson, J.T.; Field, C.B.; Matson, P.A.; Vitousek, P.M.; Mooney, H.A.; Klooster, S.A. Terrestrial Ecosystem Production: A process model based on global satellite and surface data. Global Biogeochem. Cy. 1993, 7, 811–841. [Google Scholar] [CrossRef]
  53. Fu, Q. The Application of RS and GIS in the Risk Assessment of Calamities of Regional Landslides; Chengdu University of Technology: Chengdu, China, 2013; pp. 31–32. [Google Scholar]
  54. Ma, C.X.; Liu, J.J.; Kang, B.W.; Sun, S.H.; Ren, J.H. Evaluation of Forest Ecosystem Carbon Fixation and Oxygen Release Services in Shaanxi Province from1999 to 2003. Acta Ecol. Sin. 2010, 30, 1412–1422. [Google Scholar]
  55. Li, S.C. The Geography of Ecosystem Services; Beijing: Sciences Press: Beijing, China, 2014; p. 66. [Google Scholar]
  56. Wiggering, H.; Dalchow, C.; Glemnitz, M.; Helming, K.; Müller, K.; Schultz, A.; Stachow, U.; Zander, P. Indicators for multifunctional land use—Linking socio-economic requirements with landscape potentials. Ecol. Indic. 2006, 6, 238–249. [Google Scholar] [CrossRef]
  57. Vitousek, P.M.; Aber, J.D.; Howarth, R.W.; Likens, G.E.; Matson, P.A.; Schindler, D.W.; Schlesinger, W.H.; Tilman, D.G. Human alteration of the global nitrogen cycle: Sources and consequences. Ecol. Appl. 1997, 7, 737–750. [Google Scholar] [CrossRef]
  58. Kozak, J.; Lant, C.; Shaikh, S.; Wang, G. The geography of ecosystem service value: The case of the Des Plaines and Cache River Wetlands, Illinois. Appl. Geog. 2011, 31, 303–311. [Google Scholar] [CrossRef]
  59. Desert-ecosystem Services Monitoring and Evaluation Research Program. In Desert-Ecosystem Function Evaluation and Service Value Research; Sciences Press: Beijing, China, 2014; p. 3.
  60. Richardson, R.B. The Economic Benefits of California Desert Wildlands: 10 Years Since the California Desert Protection Act of 1994; The Wilderness Society: Washington, DC, USA, 2005. [Google Scholar]
  61. Kroeger, T.; Manalo, P. Economic Benefits Provided by Natural Lands: Case Study of California’s Mojave Desert; Defenders of Wildlife: Washington, DC, USA, 2007. [Google Scholar]

