1. Introduction
The Romanian society has advanced to embrace the concept of sustainability, in parallel to the multinational companies’ increasing sustainable organizational development awareness.
Generally perceived as being the characteristic of an activity without exhausting the available resources and perturb the environment, with the aim of preserving the development potential of future generations, sustainability is the constant coordinate of all the macro and micro activities.
This change in the trend of making decisions alters the traditional flows of production and expansion, taking in the consideration their impact on the environment protection and the general health level of the population.
This paper builds an Analytic Network Processes (ANP) model to capture the effect of integrating the sustainability concept in the flow of decision making for the future economic decisions regarding the market share of the Romanian producers of natural soft drinks. Although decision making using Analytic Hierarchy Processes (AHP) and ANP has been known for a long time, and applied in United States since Thomas Saaty introduced the concept in 1970 [
1] and started a long series of successful applications, this technique is largely-unknown in Romania. In this study, for the first time in Romania, the model was built and evaluated, with the collective contribution of the general managers of the main firms producing natural soft drinks on the Romanian market. Thus, the model presented has two major characteristics: first, it was derived through consensual discussions with the current influential decision makers in the natural soft drinks Romanian market and second, it was evaluated by the people responsible at the first or second layers of strategic economic decision regarding the future investments of these companies. A minor modification of a typical market share ANP model, where reference to the cluster gathering the main players on the Romanian natural soft drinks market was changed, allows for reading out the model’s evaluation for the share of importance of the main components of the sustainability concept as it is reflected in the existent state of the Romanian natural soft drink companies. This offers, through sensitivity analysis, the possibility to evaluate back the influence of the main players on the market on the two distinct concepts of sustainability: economic and food sustainability, as well as the influence of the available range of the projects over the same concepts. This way, it is possible to refine and redefine the distinctions between those two distinct categories in terms of the effects they produce.
2. The Romanian Market of Natural Soft Drinks: A Brief Overview
Sustainable marketing strategy is an emerging area and various concepts are attached, as presented in [
2]. A survey of the available databases together with a comprehensive literature review is available in the previous cited paper. Romania is still completely missing on the author’s list. By splitting the sustainable development in the food industry into the effects on costs in the long run and effects on food product quality through a category analysis, Malte and Zalewsky (2013) [
3] make the point that the restriction to regional suppliers and the focus on local markets belong to a niche strategy. Producing natural soft-drinks requires an updated technology. Since the year 2010, when financing through European projects stirred this kind of activity, the total number of firms entering the natural soft drinks Romanian market increased significantly. Thus, big producers of soft-drinks re-oriented their business, following changes in consumer behavior and decided to complete their portfolio with a niche business at a national level. The spectrum of this market is completed by a number of small firms which benefit from European investment funds supporting local initiatives. These small firms are the second layer in the attempt of a vertical integration, where the first layer is represented by the traditional plantations of different fruit trees.
This paper takes a step further and shows how sustainable marketing strategy can be embedded and evaluated with a multicriterial decision making procedure, namely ANP, applied to the natural soft drinks market. Although the Romanian market of natural soft drinks has recently been developed, there are already a large enough number of firms involved, as a result of either re-orienting their business following the corresponding changes in the consumer behavior or completing their portfolio with niche businesses at a national level. The lack of available market studies regarding this market conduced to a relative easy entrance, without major barriers, with a local, and at most regional, perspective of development. Generally speaking, the total number of firms entering the natural soft drinks market has significantly increased since the year 2010, when financing through the European projects favored this kind of activity on one hand, and on the other, the first initiatives on increasing the level of consumers’ awareness conduced to a superior level of knowledge about the benefits of consuming natural soft drinks. A supplementary motivation for entering in such a business was the successive removal of the seasonal dependencies. Since the competition for achieving a higher market share sharpened, the economic organizations became more and more aware of the necessity of a sustainable chain of production: production-distribution-consumption. In this sense, sustainability constitutes a specific instrument for increasing the market share and ensuring a competitive advantage for the participants.
3. The ANP Model for the Romanian Market Share of the Natural Soft Drinks: An Overview
A comprehensive overview of the principles and main applications of AHP/ANP was made available in Saaty’s recent paper [
4]; therefore, in this paper we will not dwell on the technicalities of building an ANP model, but on the particularities of the one in this paper.
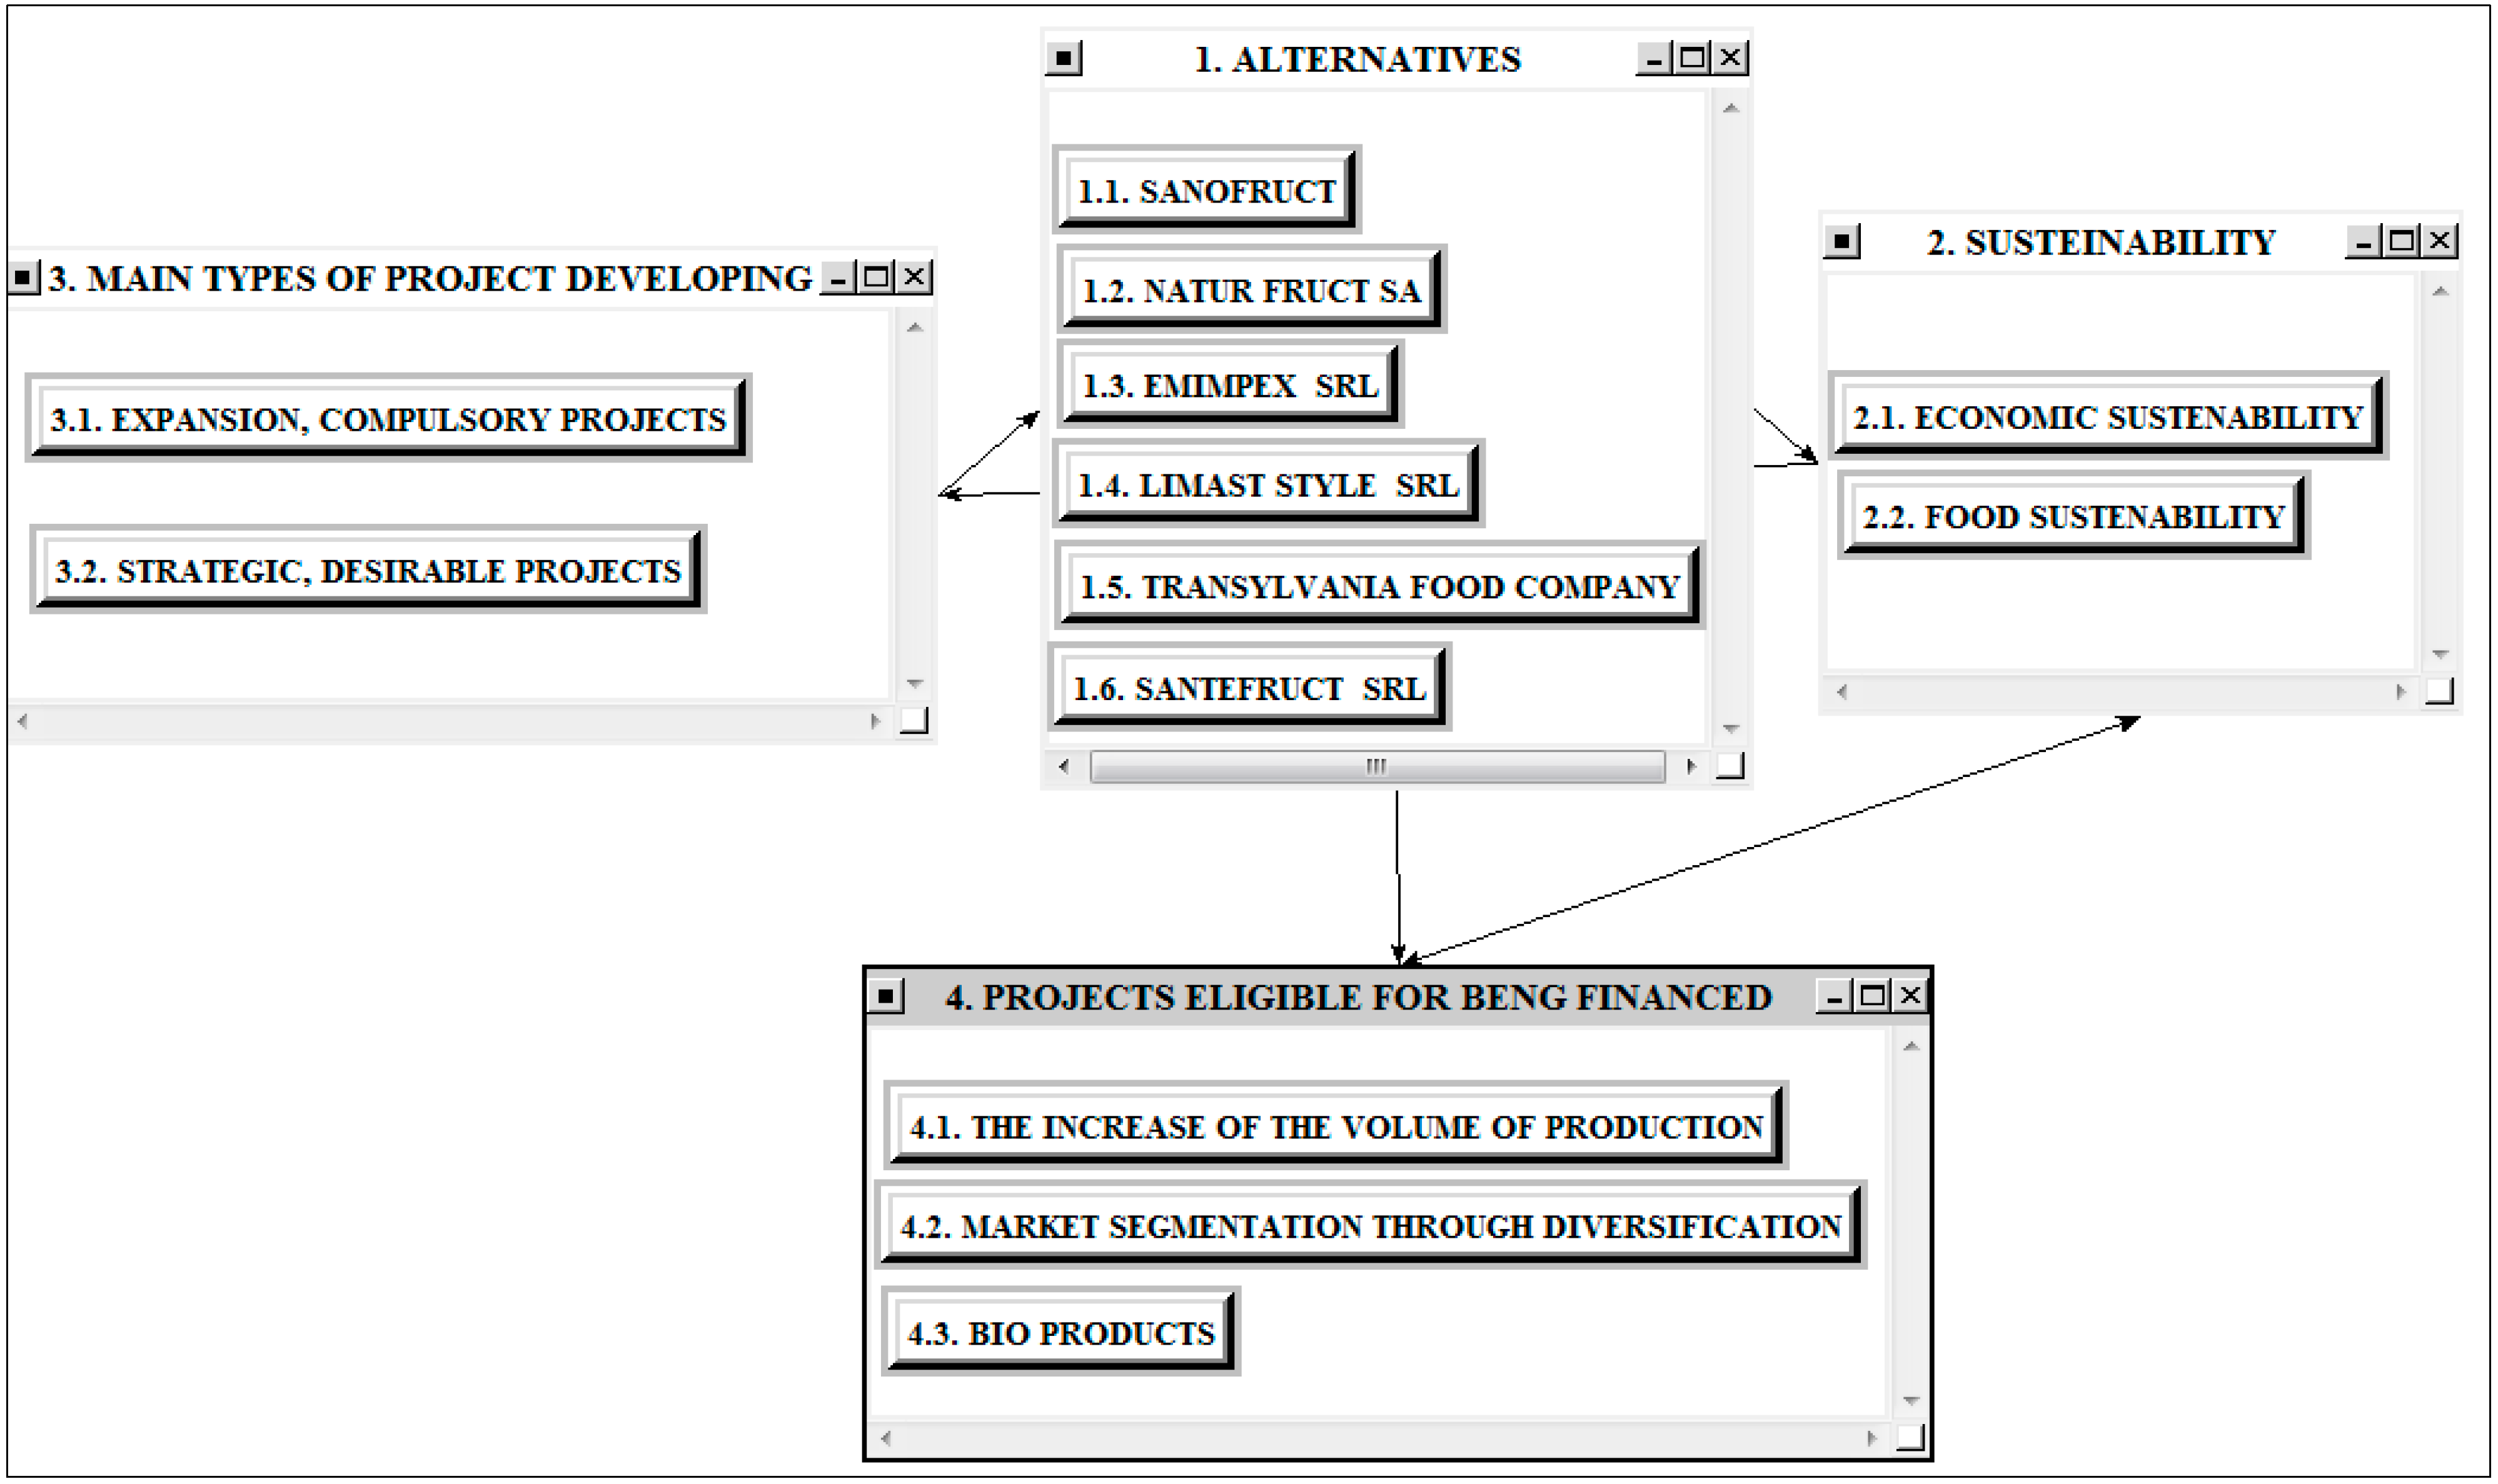
The ANP model consists of four main clusters. Clusters, nodes and connections were derived through several in-depth interviews with the managers of the 10 the largest producers of natural soft drinks in the Romanian market. Comparative judgments over the connected nodes were done in a general meeting of these managers, coordinated by the authors.
The first cluster is formed by the main firms producing natural soft drinks on the Romanian market and is referred to as “1. ALTERNATIVES”.
The second cluster is “2. SUSTENABILITY” and it is formed by two nodes: “2.1. ECONOMIC SUSTENABILITY “and “2.2. FOOD SUSTENABILITY”. The two concepts summarized by these two nodes are intangible ones, hard to quantify and complementary. Economic sustainability, according to the managers’ perceptions, can be regarded as in the sense that every firm considered in the previous cluster is willing to compete for a long term profitable presence on the market and a constant market share, and this implicitly assumes that every firm competes against the others for a better solution to the scarcity problem. Food sustainability refers to the spillover effect of joint population’s understanding of the necessity of consuming healthy products and the development of bio agriculture.
The third cluster is “3. MAIN TYPES OF PROJECT DEVELOPMENT” and it has two nodes; one is “3.1. EXPANSION, COMPULSORY PROJECTS” and the other is “3.2. STRATEGIC, DESIRABLE PROJECTS”. While firms are pairwise compared depending on their willingness to tackle in the close future either expansion or strategic projects, or both, in a variable proportion, the concept of sustainability in its both two aspects is interconnected with the two types of potential project development.
The available projects which qualify for financing are grouped in the fourth cluster, named 4. PROJECTS ELIGIBLE FOR BEING FINANCED and this cluster is formed by three nodes. The node “4.1. THE INCREASE OF THE VOLUME OF PRODUCTION” comprises the main alternatives through which the increase of the volume of production can be achieved, through the consideration of the next three aspects: the increase of the production capacities, the increase of the labor force involved and developing new units of production. The node “4.2. MARKET SEGMENTATION THROUGH DIVERSIFICATION” is formed, in its turn, by two actions: diversification of the packing system and diversification of the products. The third node in the fourth cluster is “4.3. BIO PRODUCTS” whose components are switching to new suppliers of certified bio-products and development through the establishment of own bio plantations. These nodes are representing the horizontal
versus vertical integration of the suppliers in a firm’s development. Being aware of the complexity of the terms involved, like for instance food sustainability, largely delimited in [
5], the whole ANP model was built in the most minimalist view, keeping in mind the scope, namely establishing the existent relative weight of importance of the economic
versus food sustainability in determining the market share of the main producers of natural soft drinks on the Romanian market, given the available range of development projects qualifying for being financed. Thus, other factors usually considered in ANP market models, like marketing strategies or characteristics of stores or merchandise were not considered. By doing so, the a-priori knowledge about what drives and is the source of the development of this kind of market was used for the model simplification. Connections between clusters and nodes were established only when there was consistent, expert knowledge about the relative importance of the categories compared. Thus, firms producing natural soft drinks were pair-wised compared with respect to the nodes 3.1. EXPANSION, COMPULSORY PROJECTS and 3.2. STRATEGIC, DESIRABLE PROJECTS since this kind of information is transparent and available, while the other way around, comparing the pairwise importance of the two kinds of potential projects for all the firms considered, was not possible. The managers participating at the construction and the evaluation of this model were not willing to reveal any information regarding their prospects for the future development. While the feedback connection between the cluster 2. SUSTENABILITY and the cluster 3. MAIN TYPES OF PROJECT DEVELOPMENT” is naturally understood and pairwise compared by the experts participating in this experiment, it was hard to find the patience to pairwise compare the existent firms with respect to details like bagging box of various capacities. When such a situation occurs, usually an equal weight of importance is automatically assigned and in such a situation, it is the number of equally important alternatives which is informative in itself. Once again, the fact that all the firms producing natural soft drinks exhibit a comparative behavior when considering alternative packaging was implicitly embedded through the consideration of the nodes representing the alternative packaging without going into the details of pairwise comparisons.
A representation of the main structure of the ANP model is given in
Diagram 1 below. It was constructed using the Super Decision software (available for free).
The four clusters with the included nodes are listed below:
Diagram 1.
The Analytical Network Process (ANP) model for the Romanian market share of the natural soft drinks.
Diagram 1.
The Analytical Network Process (ANP) model for the Romanian market share of the natural soft drinks.
| | 1. ALTERNATIVES | |
| 1.1. SANOFRUCT |
| 1.2. NATURFRUCT SA |
| 1.3. EMIMPEX SRL |
| 1.4. LIMAST STYLE SRL |
| 1.5. TRANSYLVANIA FOOD COMPANY |
| 1.6. SANTEFRCT SRL |
| 3. MAIN TYPES OF PROJECT DEVELOPING | | 2. SUSTENABILITY |
| 3.1. EXPANSION, COMPULSORY PROJECTS | 2.1. ECONOMIC SUSTENABILITY |
| 3.2. STRATEGIC, DESIRABLE PROJECTS | 2.2. FOOD SUSTAINABILITY |
| | 4. PROJECTS ELIGIBLE FOR BEING FINANCED | |
| 4.1. THE INCREASE OF THE VOLUME OF PRODUCTION |
| 4.2. MARKET SEGMENTATION THROUGH DIVERSIFICATION |
| 4.3. BIO PRODUCTS |
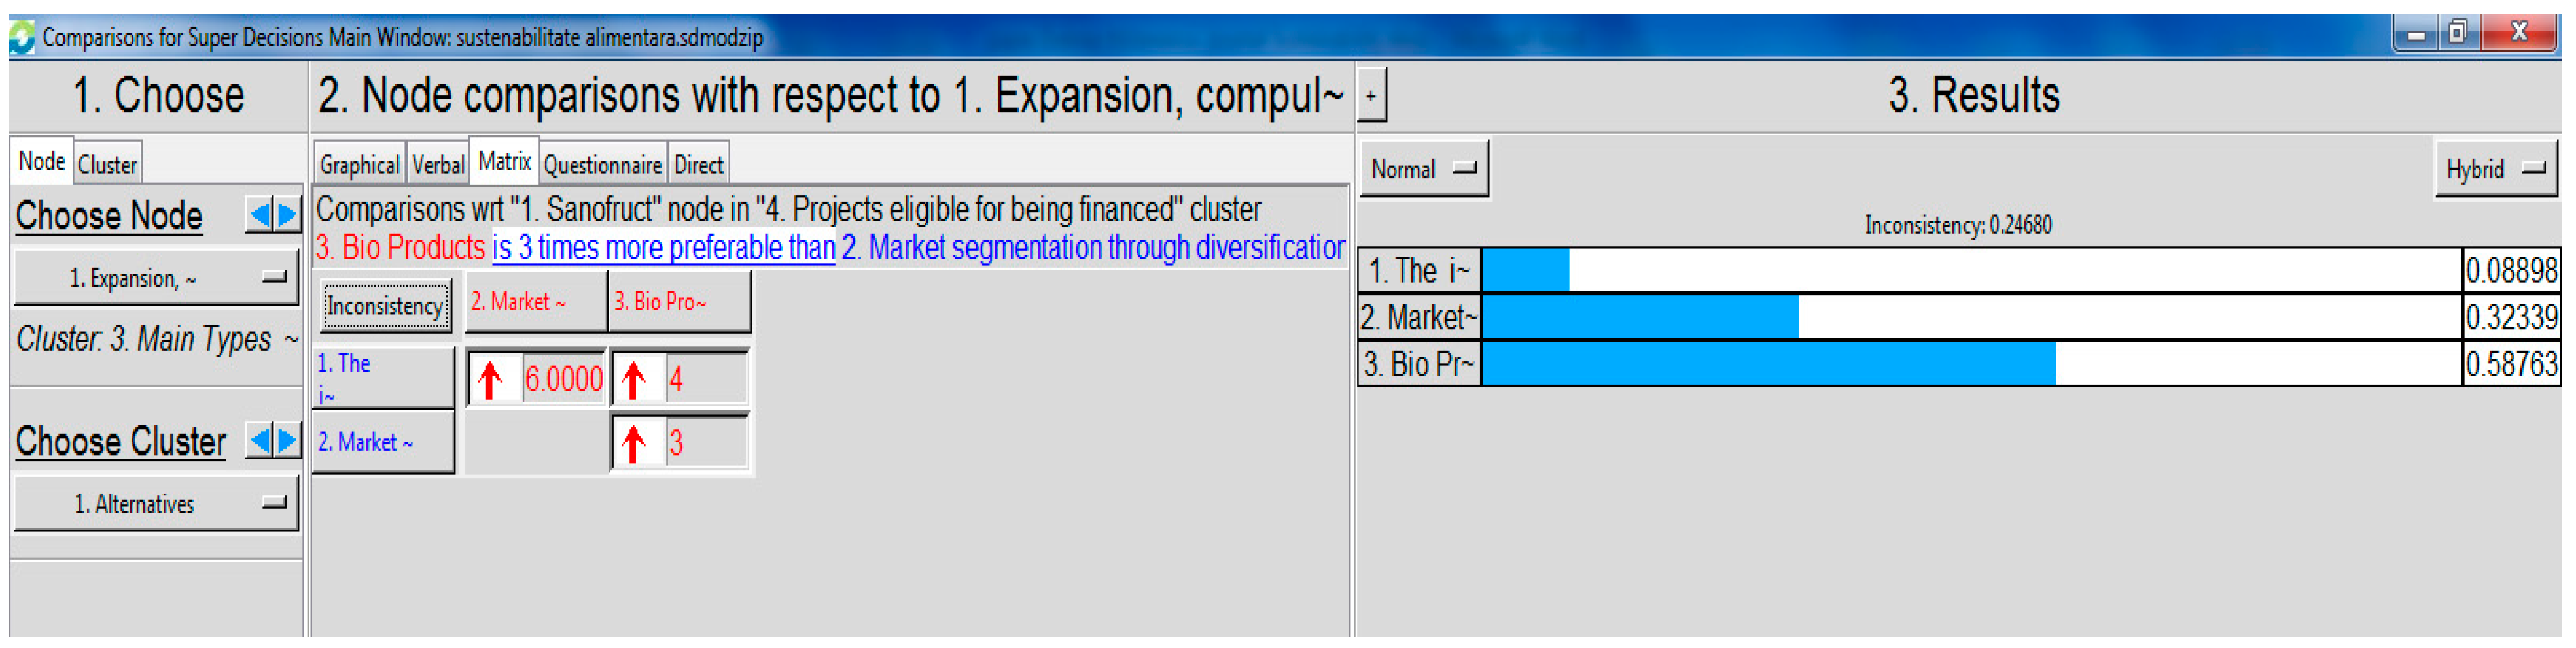
When the node 1.1 was connected with the nodes 2.1 and 2.2 with the rationale being the fact that the concepts of 2.1. ECONOMIC SUSTAINABILITY and 2.2. FOOD SUSTAINABILITY has to be pairwise compared, for their relative importance, from the point of view of the producer 1.1. SANOFRUCT. Therefore, the question asked was “from the point of view of the SANOFRUCT’s management, what is more important, the economic or the food sustainability?” After answering this question, the management was addressed with a second one: how important is your preferred choice to the other one? The options to this second question were: equally important (translated into a numerical value equal to one), slightly more important (2) and so on, up to extremely more important (9).
Pairwise comparisons with respect to the corresponding node were performed and every question was asked to either the CEO of the corresponding companies, or the person responsible for the investments, and this person came to an agreement with the CEO about the comparisons.
It is generally recommended that every decision matrix involved will have a consistency index less than 0.1. By using the inconsistency report, when this threshold was exceeded, the respondents were asked to revise their comparisons. Sometimes this was done, sometimes the experts maintained their views. We chose therefore to report the pairwise comparisons with the smallest consistency index achieved through consensus and a revision, no matter whether the threshold was exceeded or not. If data was available, then pairwise comparisons were introduced in the direct mode. A visual of how the model looks like implemented in Super Decisions Software, together with the connections discussed above is provided in
Figure 1 below.
Figure 1.
Decision model as in Super Decisions Software.
Figure 1.
Decision model as in Super Decisions Software.
An example of pairwise comparisons is shown in the
Figure 2.
Please note that although the inconsistency index is not below the so-called admissible range, the judgments were not changed. It is generally admitted that achieving a consistency index smaller than 0.1 at any cost is not necessarily conducing to a better priority vector; therefore, since the experts maintain their opinions regarding the pairwise comparisons, we kept that decision matrix as it was.
Figure 2.
Pairwise comparison.
Figure 2.
Pairwise comparison.
4. Results and Discussion
4.1. The ANP Synthesis
The overall synthetized priorities for the alternatives are shown in
Table 1. The limit matrix converged and the normal form of the priority vector showing the comparative importance is presented in the last column.
Table 1.
List of alternatives.
Table 1.
List of alternatives.
| Name | Normals |
|---|
| 1.1. SANOFRUCT | 0.102832 |
| 1.2. NATURFRUCT SA | 0.214226 |
| 1.3. EMIPEX SRL | 0.288369 |
| 1.4. LIMAST STYLE SRL | 0.103343 |
| 1.5. TRANSYLVANYA FOOD COMPANY | 0.222520 |
| 1.6. SANTEFRUCT SRL | 0.068710 |
The limit matrix, derived through increasing the weighted super matrix to enough large powers, as in the methodology of ANP, is shown in the
Table 2 below. Since all its columns are identical, only the first one is reported. The priority vectors for particular components can be derived accordingly.
So, for example, the importance of the 2.1. ECONOMIC SUSTENABILITY versus 2.2. FOOD SUSTENABILITY, under the 2. SUSTENABILITY cluster considered in this model can be derived through the normalization of the two components, whose relative importance is 0.083432 and 0.253918. The sum of these two is rounded to 0.338 and the weight of economic sustenability is 0.25 while the weight of food sustenability is 0.75. This can be interpreted in the sense that in establishing the Romanian market share of natural soft drinks, the concept of food sustenability is three times more influential than the concept of eonomic sustenability. Still, a word of warning should be adressed at this point. Before one becomes overoptimistic about the noble intentions of the main players on the Romanian natura soft drinks, or about the importance of food sustenability as expressed in plans to expand bio plantations or invest in technologies for handeling bio products, one should bear in mind the possibility that the managers are not very aware about the concept of economic sustenability, not very involved in saving not only natural resources and want to make their own chains of production more efficient. Once the awarnes about methods of optimizing flows of production and the possibility to invest into more expensive processsing equipments increases, their intentions to develop bio or traditional plantations in order to sustain their own production might decrease accordingly. Yet, since the components in the cluster 3. MAIN TYPES OF PROJECT DEVELOPING favor 3.2. STRATEGIC, DESIRABLE PROJECTS strategic, desirable projects (0.70) over 3.1. EXPANSION, COMPULSORY PROJECTS (0.30) and also, in the cluster 4. PROJECTS ELIGIBLE FOR BEING FINANCED the node corresponding to 4.3. BIO PRODUCTS have a weight of importance of 0.53 (while 4.2. MARKET SEGMENTATION THROUGH DIVERSIFICATION weights 0.21 and 4.1. THE INCREASE OF THE VOLUME OF PRODUCTION weights 0.26) all these toghether enhance the finding according to which food sustainability is indeed important and well undestood in determining the order among natural soft drinks producers. Thus, it becomes even more clear that an analysis taking into consideration interactions between theoretical conceps and options about specific plans for development for the main economic agents on the natural soft drinks market can indeed confirm that the food sustenability, as it is generally understood, is the main driver in the determination of the comparative weights of importance in the alternatives cluster.
Table 2.
Priorities vectors for alternatives and cluster components.
Table 2.
Priorities vectors for alternatives and cluster components.
| Cluster | Name | Normals |
|---|
| 1. ALTERNATIVES | 1.1. SANOFRUCT | 0.029735 |
| 1.2. NATUR FRUCT SA | 0.061945 |
| 1.3. EMIMPEX SRL | 0.083384 |
| 1.4. LIMASTYLE SRL | 0.029882 |
| 1.5. TRANSYLVANIA FOOD COMPANY | 0.064343 |
| 1.6. SANTEFRUCT SRL | 0.019882 |
| 2. SUSTAINABILITY | 2.1. ECONOMIC SUSTAINABILITY | 0.083432 |
| 2.2. FOOD SUSTEINABIITY | 0.253918 |
| 3. MAIN TYPES OF PROJECT DEVELOPING | 3.1. EXPANSION, COMPULSORY PROJECTS | 0.085479 |
| 3.2. STRATEGIC, DESIRABLE PROJECTS | 0.203677 |
| 4. PROJECTS ELIGIBLE FOR BEING FINANCED | 4.1. THE INCREASE OF THE VOLUME OF PRODUCTION | 0.021812 |
| 4.2. MARKET SEGMENTATION THROUGH DIVERSIFICATION | 0.017931 |
| 4.3. BIO PRODUCTS | 0.044594 |
In
Table 3 the normalized vector representing the relative importance of the six firms are presented, as derived from the ANP model and the actual market share, derived from normalizing the vector of absolute values for the sales. Afterwards we calculated the Saaty’s compatibility index (SCI), as a measure of the distance between two priority vectors. Values of SCI in the interval (1, 1.1) are an indicator of a close compatibility between the two priority vectors.
Saaty’s compatibility index (SCI) between the ANP weights and the actual market share as presented in
Table 3 is 1.11269.
This very good value for the compatibility index validates the construction of the model and the comparative pairwise judgments embedded and therefore the weights of importance for the intangible concepts participating in this model.
Table 3.
ANP weights of importance and the actual market share.
Table 3.
ANP weights of importance and the actual market share.
| Name | ANP Weights | the Actual Market Share | the Actual Volume Sales |
|---|
| 1.1. SANOFRUCT | 0.102784022 | 0.051877847 | 774,416.2 |
| 1.2. NATURFRUCT SA | 0.214283244 | 0.305278283 | 1,614,496 |
| 1.3. EMIMPEX SRL | 0.288397026 | 0.292240195 | 2,172,899 |
| 1.4. LIMAST STYLE SRL | 0.103302784 | 0.11898671 | 778,324.8 |
| 1.5. TRANSYLVANIA FOOD | 0.22254885 | 0.173314198 | 1,676,773 |
| 1.6. SANTE FRUCT SRL | 0.068684074 | 0.058302767 | 517,493.5 |
The weights of importance for the two components of the sustainability concept as well as for the types of the projects considered for future development by the firms considered are presented in
Table 4.
Table 4.
Priorities vectors for the components of the sustainability vectors.
Table 4.
Priorities vectors for the components of the sustainability vectors.
| Name | Normals |
|---|
| 2.1. ECONOMICAL SUSTAINABILITY | 0.24713206 |
| 2.2. FOOD SUSTAINABILITY | 0.75286794 |
| 3.1. EXPANSION, COMPULSORY PROJECTS | 0.29548 |
| 3.2. STRATEGIC, DESIRABLE PROJECTS | 0.70452 |
| 4.1. THE INCREASE OF THE VOLUME OF PRODUCTION | 0.2578 |
| 4.2. MARKET SEGMENTATION THROUGH DIVERSIFICATION | 0.21096 |
| 4.3. BIOPRODUCTS | 0.53125 |
One can directly observe that the concepts of food sustainability, developing strategic projects and enhancing the bio products through the establishment of their own bio plantations are strongly favored by all the firms included in this ANP model for the market share of the natural soft drinks in Romania. These findings lead in two directions. The first one points to how, through the construction of such an ANP model, it is possible to quantify the after–implementation effect of the European projects for sustainable development in agriculture, both in terms of enforcing the concept of sustainability, strategic projects and intentions to switch to bio-products. Thus, for the firms producing natural soft drinks considered in this paper, with a leading position on the market, the fact that it was possible to find a close correspondence between their actual market share and the one estimated by the ANP model validates the weights of importance of other intangible factors comprised. Further developments can be achieved through the inclusion of more details and the objectives of the allocated European funds. A comprehensive list of public organization sustainability indicators is available in [
6] and further developments might start from this revision. A second direction addresses the sensitivity analysis for a potentially more detailed ANP model. The sensitivity analysis for the ANP model presented in this paper is illustrated in the next subsection. If, through the inclusion of all natural soft drinks producers on the Romanian market and through the refinement of the nodes and clusters considered a close enough representation of the actual market share is not achieved, then through nodes’ sensitivity analysis we can point to alternative actions to be undertaken so that certain indicators reach some desired targets.
4.2. Sensitivity Analysis
Sensitivity analysis with respect to a particular node in the ANP model presented above is also done with the help of the Super Decisions software [
7]. The synthetized weights of importance depend on a sensitivity parameter,
alpha, whose value is set to 0.5 and interval of variation is zero to one. A value of 0.75 for the parameter alpha corresponds to a linear increase of 50% of this parameter while a value of 0.25 correspond to a linear decrease of 50% of this one. Nonlinear changes in the priority vectors for the nodes in the alternatives, with respect to a chosen node, correspond to linear changes in the control parameter
alpha. This parameter
alpha is like an anchor providing a measure for comparative judgments of the variations in the priority vectors with respect to a specific node.
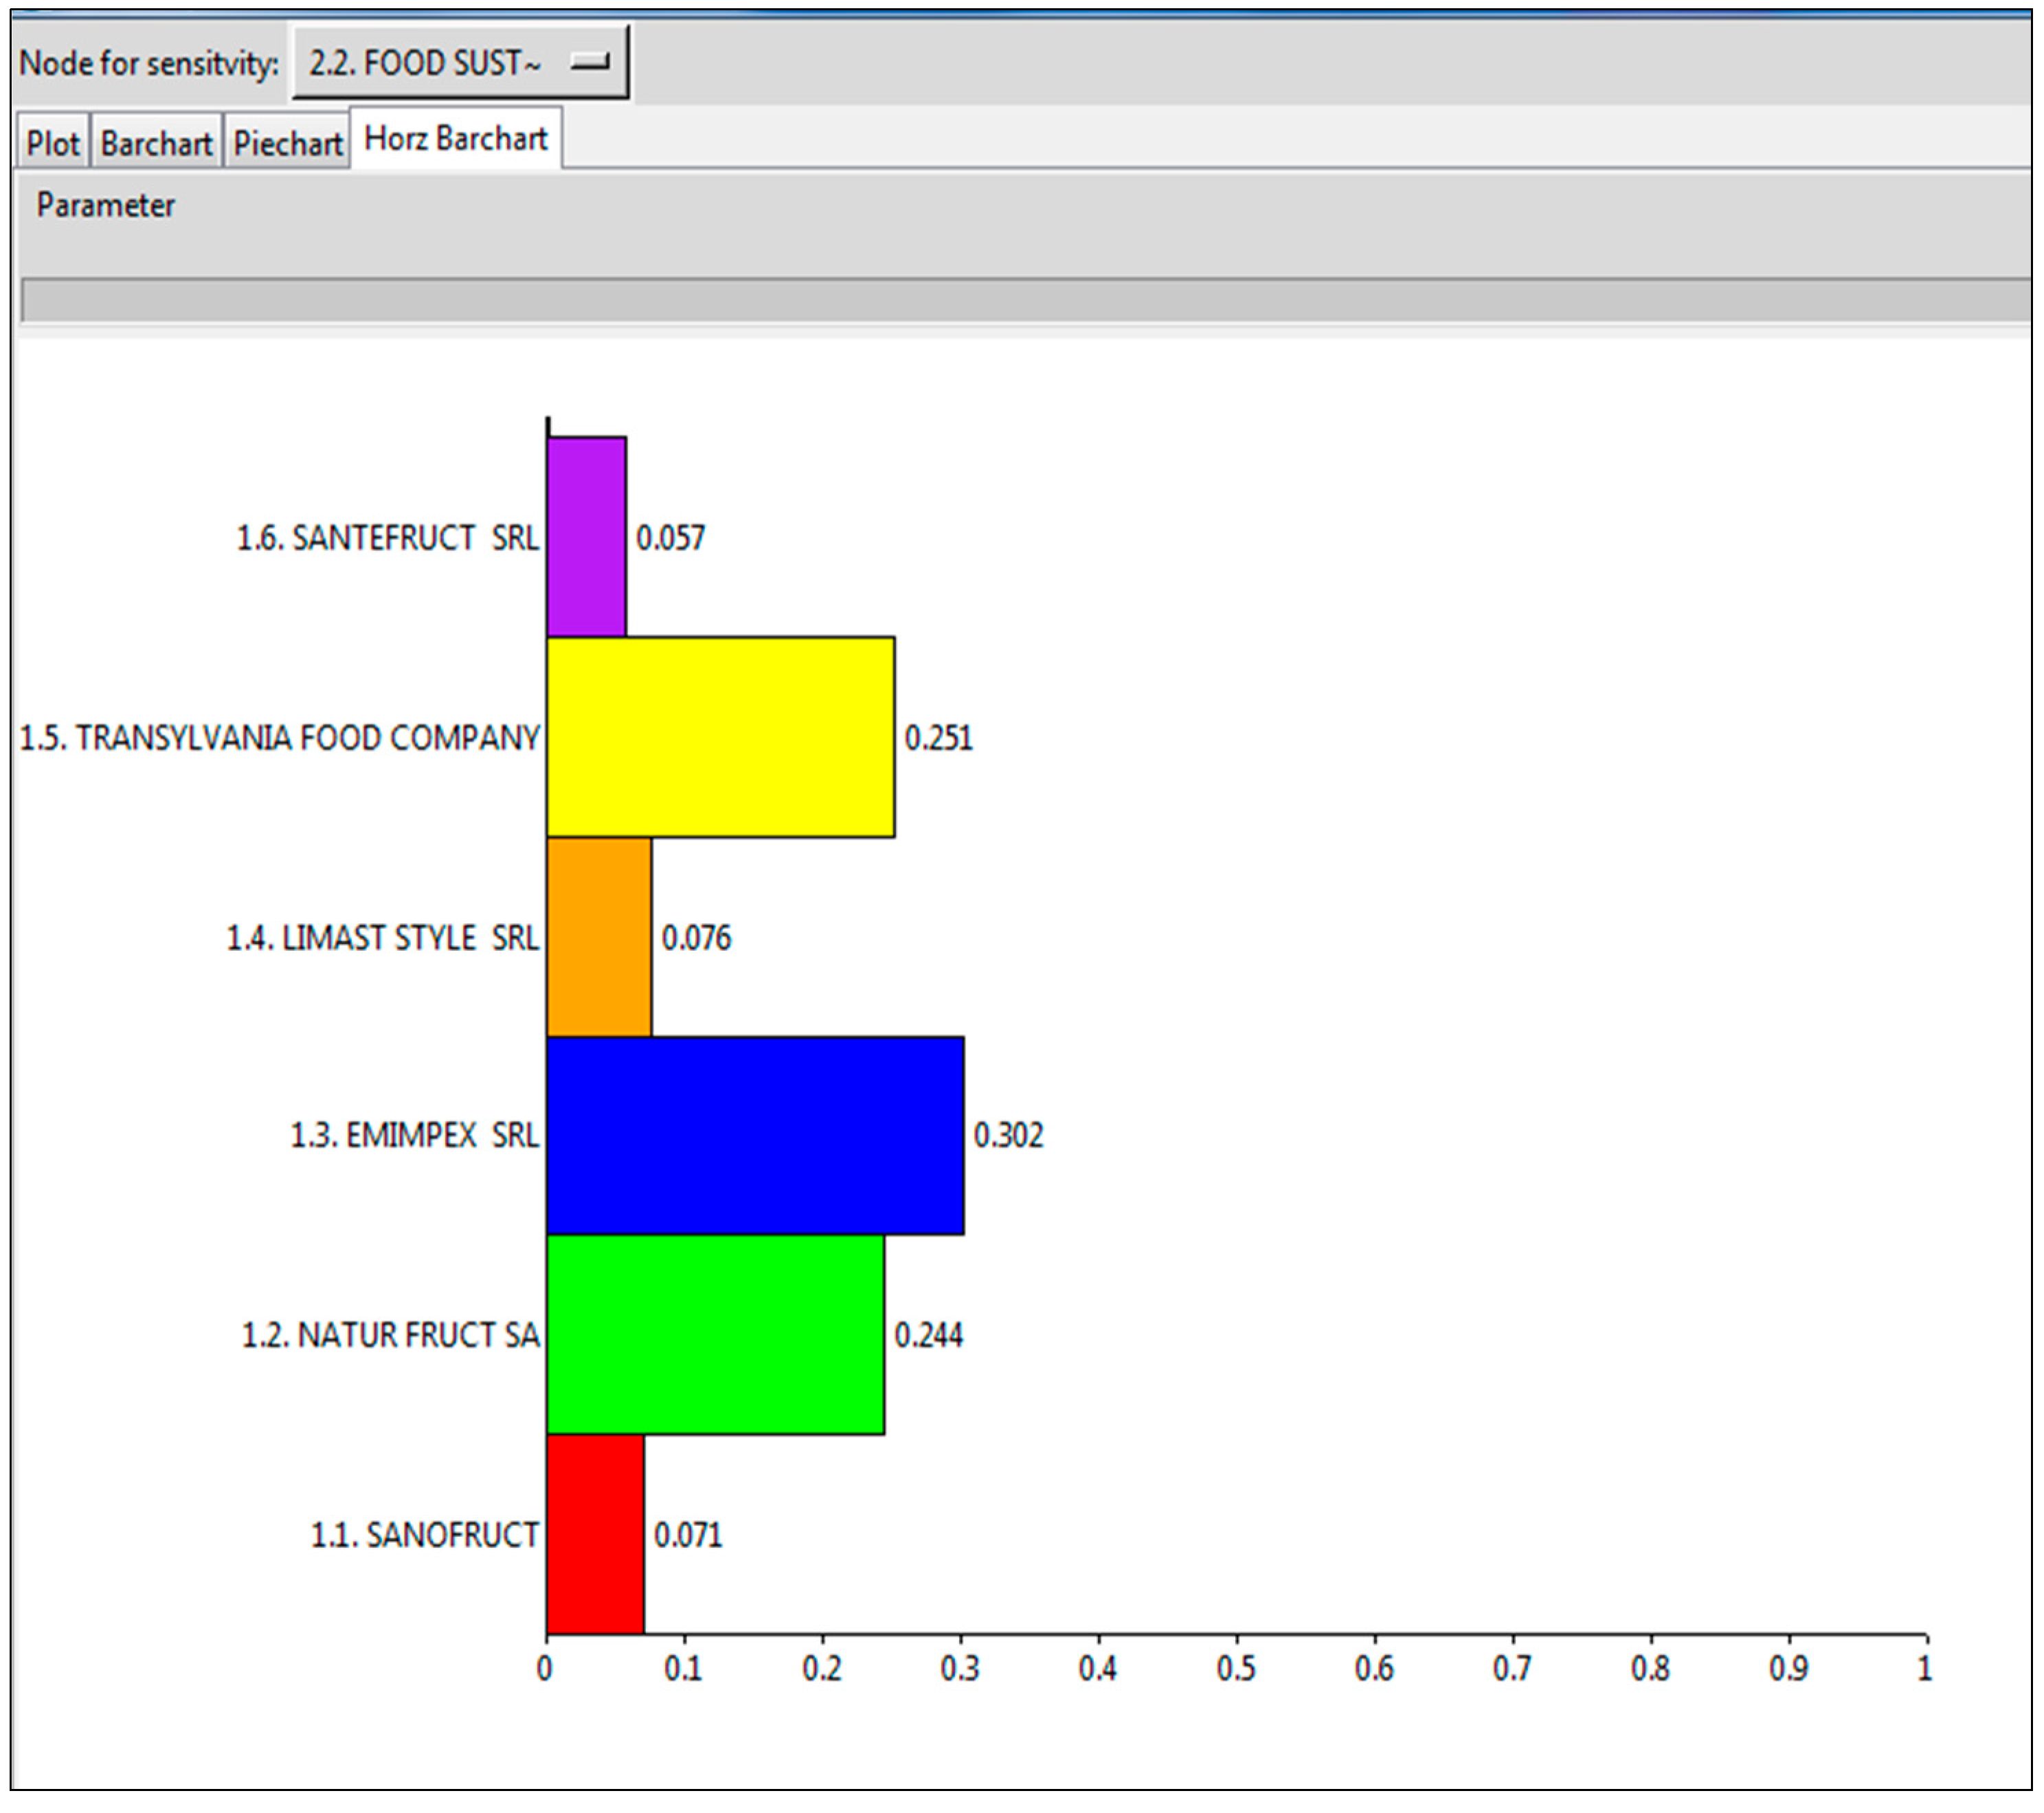
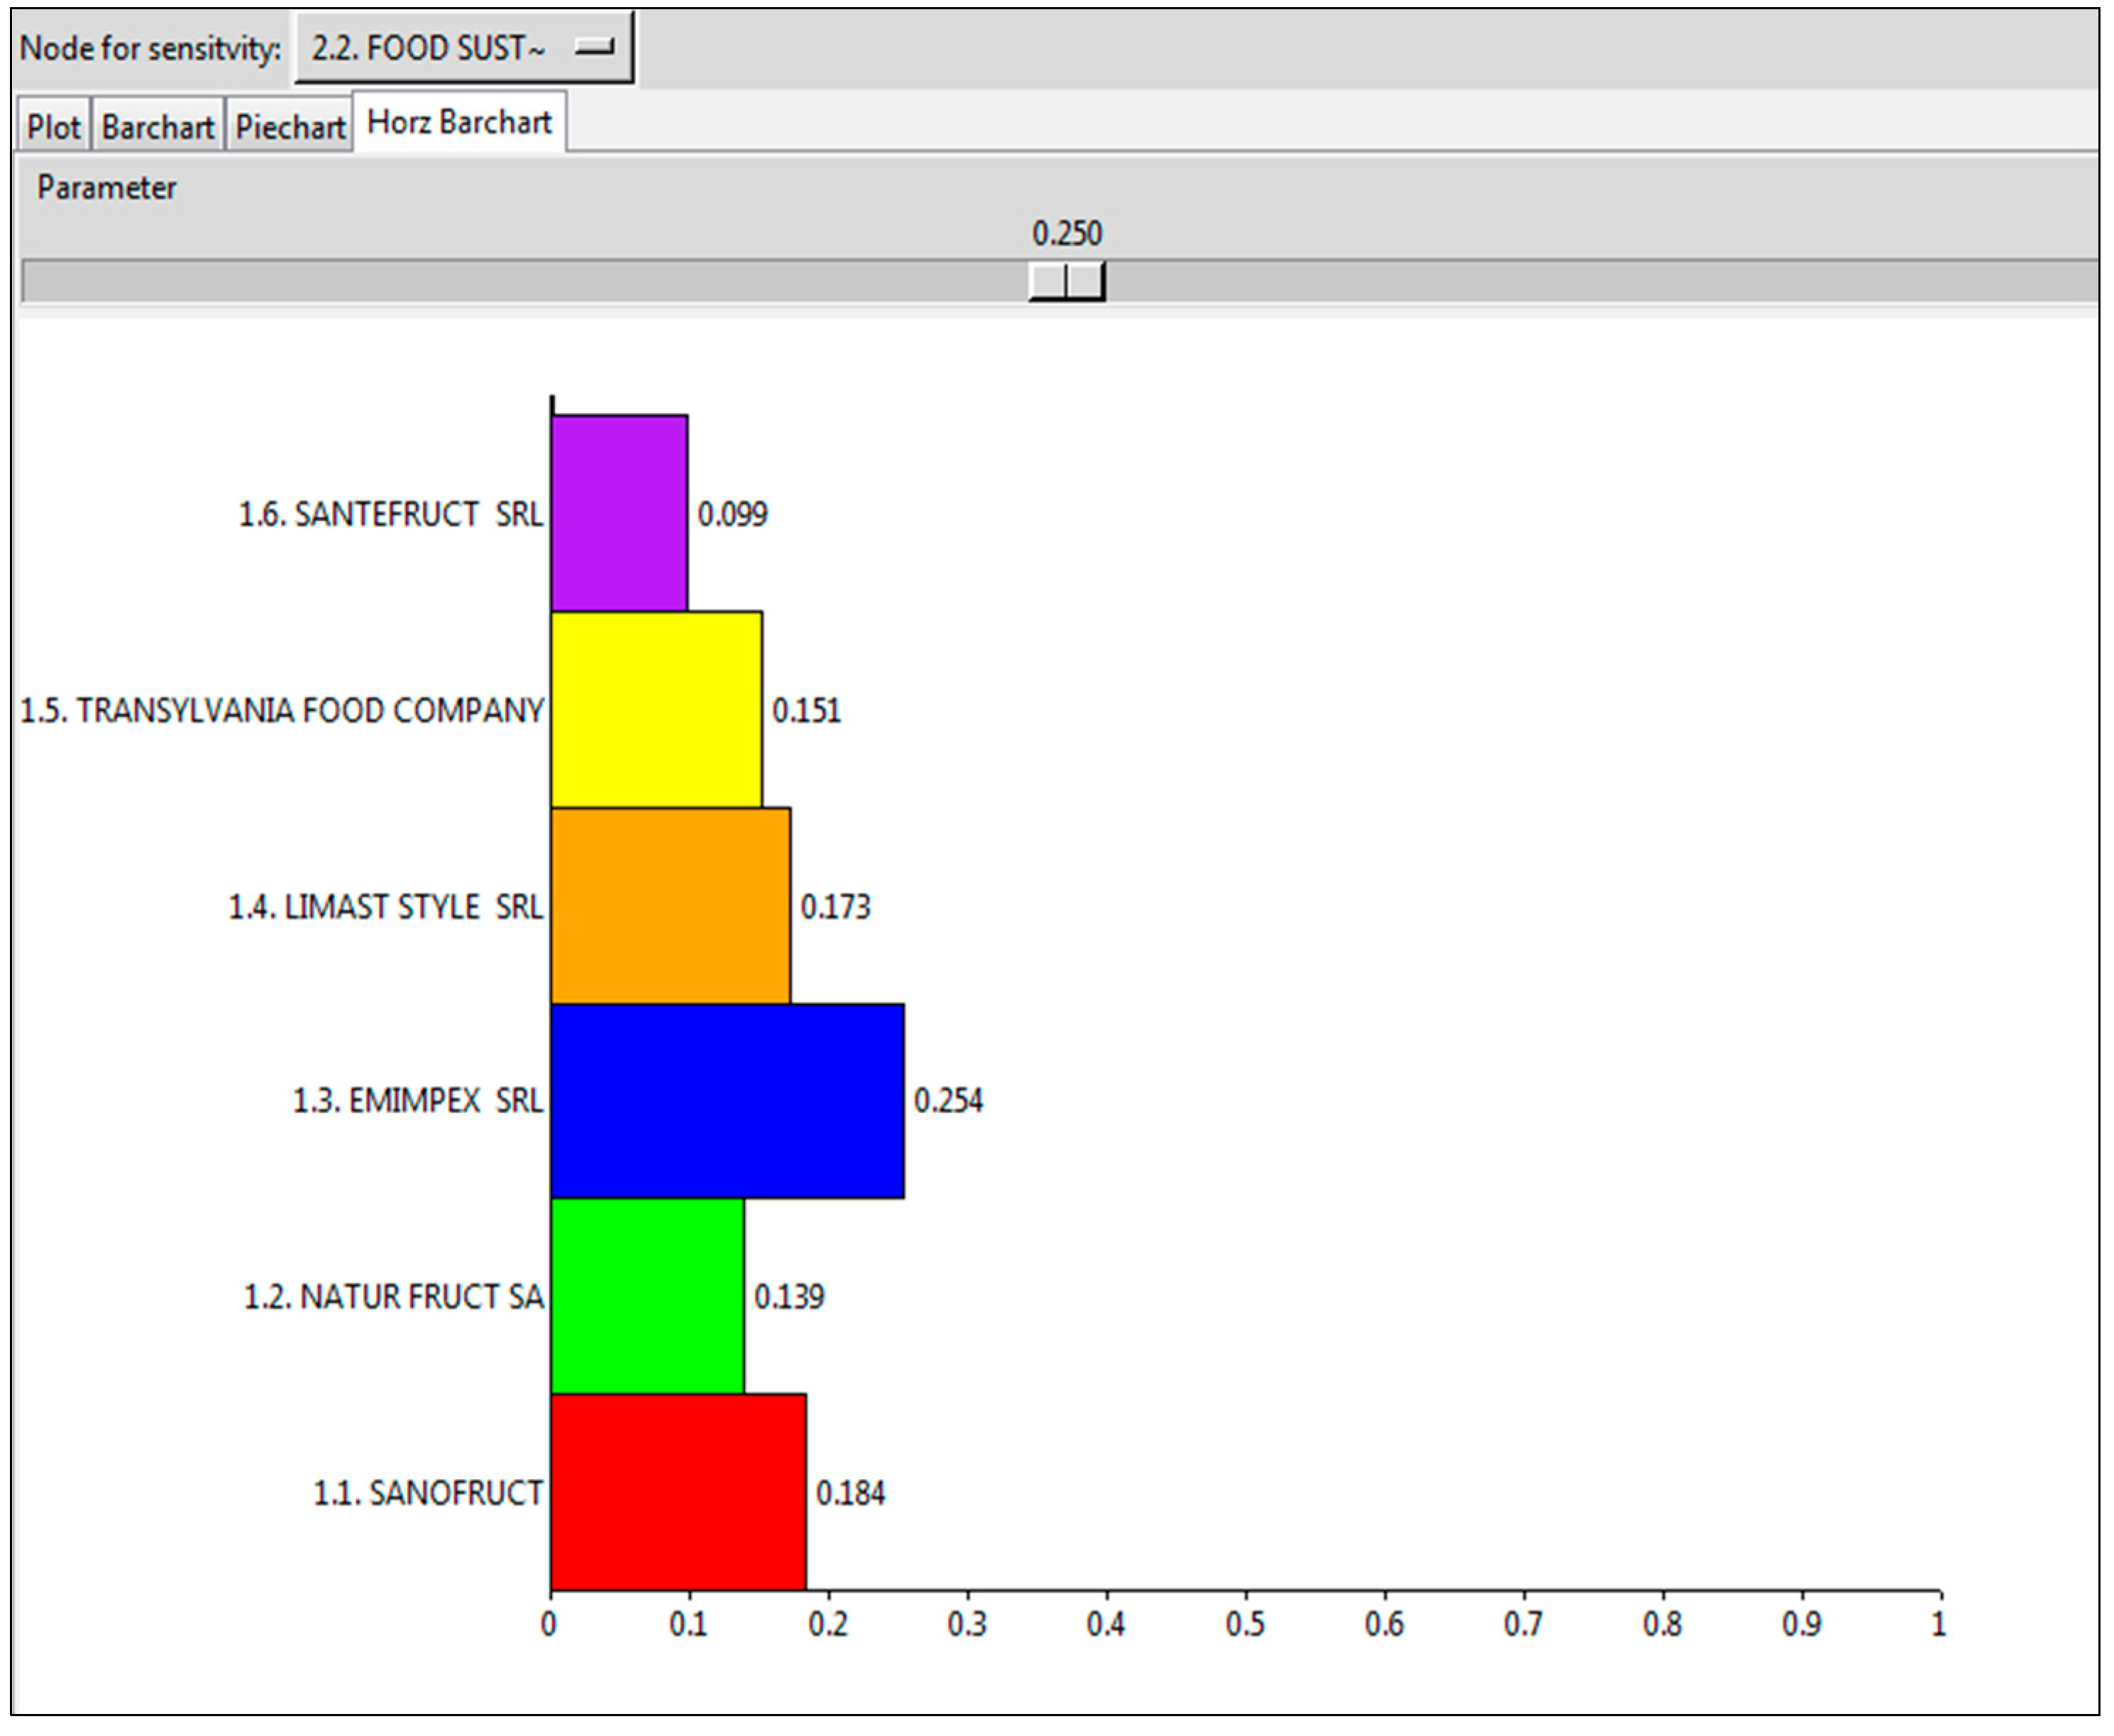
For sensitivity analysis with respect to the node 2.2 FOOD SUSTENABILITY, the value of 0.5 to alpha yields the synthetized priority vectors as in
Figure 3, in a bar representation. This is shown in
Figure 3. The correspondent priority vectors for values of the parameter alpha increased to 0.75 and respectevily decreased to 0.25 are illustrated in
Figure 4 and respectively
Figure 5.
Figure 3.
Sensitivity analisys with respect to the node food sustainability.
Figure 3.
Sensitivity analisys with respect to the node food sustainability.
Figure 4.
Sensitivity analisys with respect to the node food sustainability asuming a 50% increase of the importance.
Figure 4.
Sensitivity analisys with respect to the node food sustainability asuming a 50% increase of the importance.
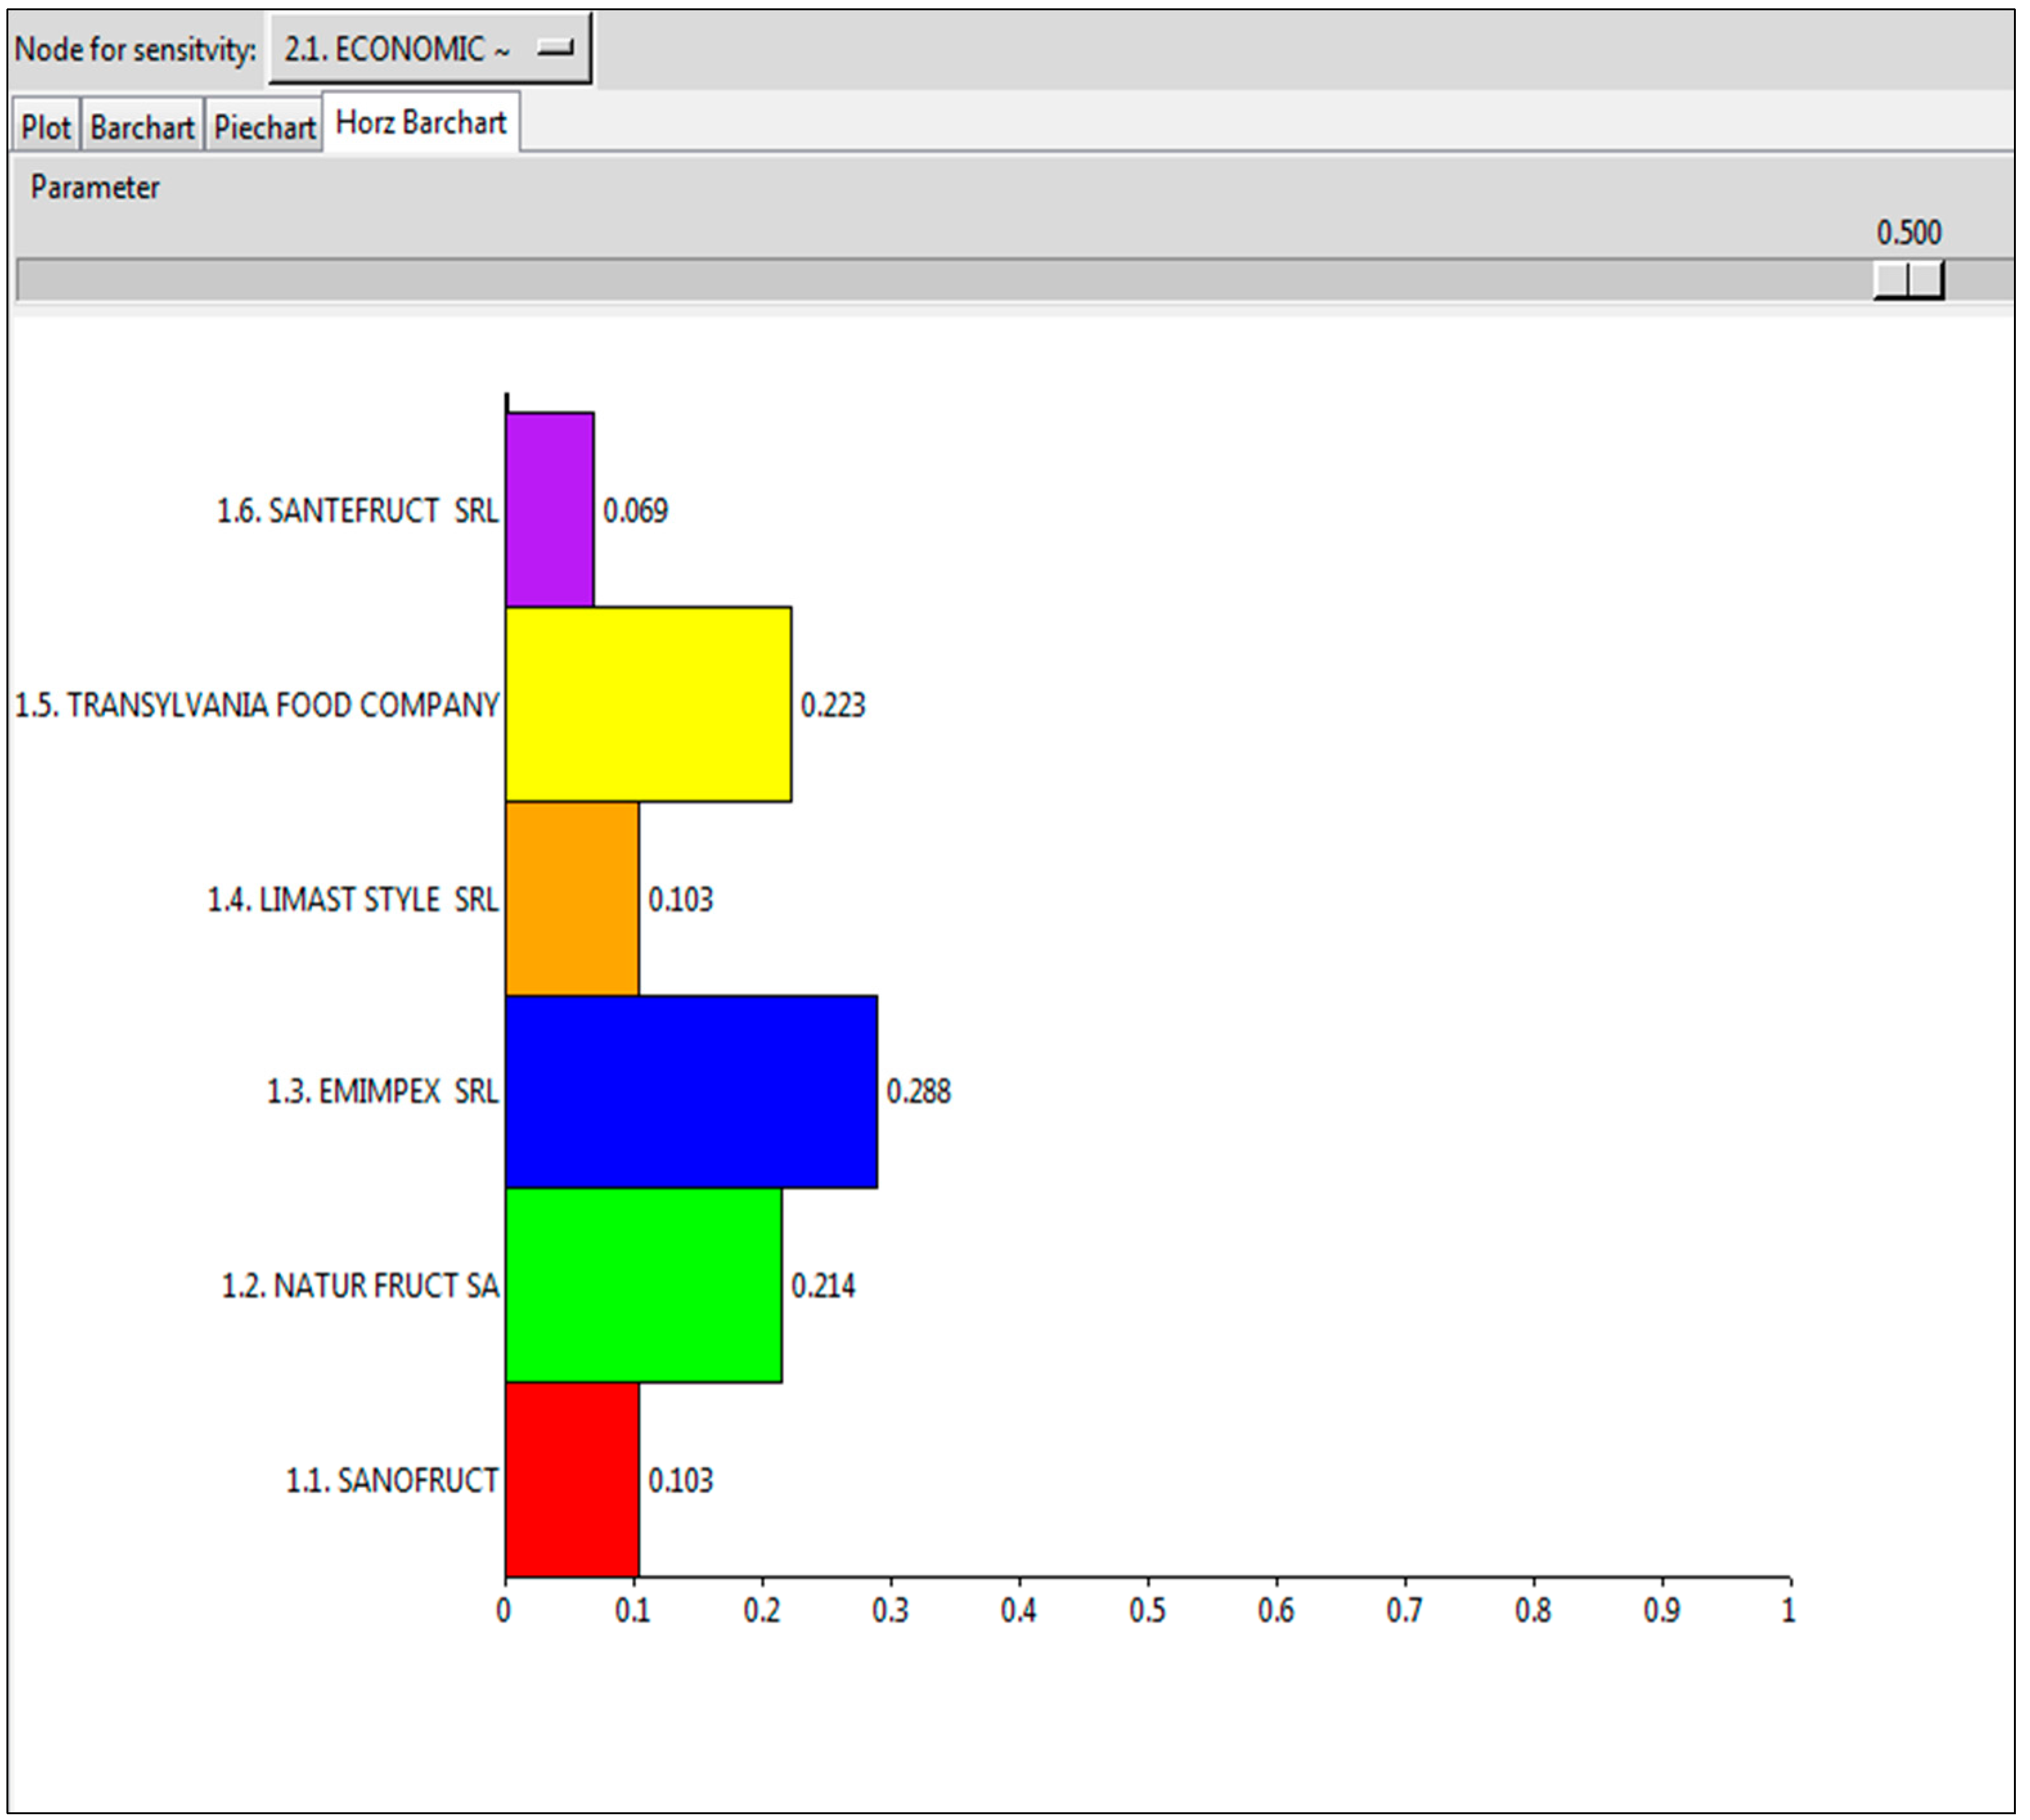
Figure 5.
Sensitivity analisys with respect to the node food sustainability asuming a 50% decrease of the importance.
Figure 5.
Sensitivity analisys with respect to the node food sustainability asuming a 50% decrease of the importance.
The graphical representation above of the node sensitivity with respect to 2.2. FOOD SUSTAINABILITY is bold depicted in
Table 5. The alternatives are in the left side column, in reverse order, as they are represented in the figures above. In brackets, in the columns corresponding to a decrease or an increase of parameter alpha by 50% (
alpha = 0.25 and respectively
alpha = 0.75), we indicated the associated rates of change in the priority vectors.
Table 5.
Sensitivity to FOOD SUSTAINABILITY.
Table 5.
Sensitivity to FOOD SUSTAINABILITY.
| Name | Alpha 0.25 | Alpha 0.5 | Alpha 0.75 |
|---|
| 1.6. SANTEFRUCT SRL | 0.099 (44.0836%) | 0.06871 | 0.057 (−17.0427%) |
| 1.5. TRANSYLVANIA FOOD COMPANY | 0.151 (−32.1407%) | 0.233 | 0.251 (12.7992%) |
| 1.4. LIMAST STYLE SRL | 0.173 (67.4056%) | 0.103 | 0.076 (−26.4576%) |
| 1.3. EMIMPEX SRL | 0.254 (−11.9184%)
| 0.288 | 0.302 (4.7268%)
|
| 1.2. NATURFRUCT SA | 0.139 (−35.1153%) | 0.214 | 0.244 (13.8983%) |
| 1.1. SANOFRUCT | 0.184 (78.9301%) | 0.103 | 0.071 (−30.9563%) |
As an overall conclusion, if the weight of importance of the node food sustainability is reduced by 50%, then the overall change in the natural soft drinks market is going to be the sum of the percentage changes in the second column in the above table, which amount to 111.245%. Similarly, if the weight of importance of the food sustainability is increased by 50%, then the sum of the correspondent percentage changes is −43.033%. So, food sustainability, overall, acts to limit the production of the natural soft drinks. On the other hand, it can be noticed that enhancing food sustainability has a positive effect on the increase of the market share for firms whose actual share is about 20%. This is the case of the two firms, as indicated in the
Table 5, 1.2. NATURFRUCT SA and 1.5. TRANSYLVANIA FOOD COMPANY. Firms with smaller market share than 20% (see 1.1. SANOFRUCT, 1.4. LIMAST STYLE SRL and 1.6. SANTEFRUCT SRL) are at disadvantage if the concept of food sustainability is praised as an engine of development, while this concept does not enhance growth in market share at actual market shares greater than 20% (see the case of 1.3. EMIPEX SRL).
Sensitivity analysis with respect to the node 4.3. BIO PRODUCTS is presented in a similar manner in
Table 6.
Table 6.
Sensitivity to BIO PRODUCTS.
Table 6.
Sensitivity to BIO PRODUCTS.
| Name | Alpha 0.25 | Alpha 0.5 | Alpha 0.75 |
|---|
| 1.6. SANTEFRUCT SRL | 0.068 (−1.0334%) | 0.06871 | 0.062 (−9.7657%) |
| 1.5. TRANSYLVANIA FOOD COMPANY | 0.223 (0.2160%) | 0.233 | 0.237 (6.5076%) |
| 1.4. LIMAST STYLE SRL | 0.103 (−0.3307%) | 0.103 | 0.089 (−13.8780%) |
| 1.3. EMIMPEX SRL | 0.289 (0.2187%) | 0.288 | 0.296 (2.64615%) |
| 1.2. NATURFRUCT SA | 0.215 (0.3612%) | 0.214 | 0.230 (7.36316%) |
| 1.1. SANOFRUCT | 0.102 (−0.8104%) | 0.103 | 0.086 (−16.3695%) |
If the concept of BIO Products is enhanced by 50%, this would conduce to a total reduction in the actual market share equal to −23.5%, while if its importance is diminished by 50%, this would conduce to a reduction of the market share equal to −1.38%. Also, it can be observed that firms having a market share of about 20% are the highest beneficiaries of enhancing the concept of bio products, as it shows for the two firms 1.2. NATURFRUCT SA and 1.5. TRANSYLVANIA FOOD COMPANY, while firms with a market share of about 10% are at a total disadvantage if they would consider moving to the production of their own bio cultures.
As a finding, it can be observed that it is advisable to fund projects for enhancing food sustainability and the establishment of the bio cultures for those firms having a market share equal to about 20%.
5. Conclusions
This paper presents a simple ANP model for estimating the market share of the natural soft drinks on the Romanian market, based on the concept of sustainability and taking into consideration the main types of projects available for funding. The concordance between the ANP model’s estimation and the actual market share validates the model and offers information about the weight of importance for food sustainability, strategic projects and bio products in comparison to its traditional counterparts. It also illustrates an important switch in the main determinants on the market of natural products. It seems that while available technology, packaging and marketing campaigns evolve in a similar manner, it is the view of the necessity of developing strategic projects with the aim of achieving food sustainability which makes the difference for the position of a certain firm on this market. Thus, the European project funding for the development of such firms proved effective in terms of steering the focus on achieving food sustainability and the consumption of bio-products.
The future willingness to develop strategic products in the direction of bio or traditional products, as well as counting the after implementation European funded projects’ effects in the future developments of this particular market can also be inferred with the help of this model.
Apart from these findings, the construction of an ANP model is in itself an innovative attempt in the Romanian scientific economic literature and the discussions with the managers showed that there are many options for further, more detailed constructions of this type.


