Article

Comparative Exergoeconomic Analyses of Gas Turbine Steam Injection Cycles with and without Fogging Inlet Cooling

by
Hassan Athari
1,
Saeed Soltani
2,*,
Marc A. Rosen
3,
Seyed Mohammad Seyed Mahmoudi
2 and
Tatiana Morosuk
4
1
Department of Mechanical Engineering, University of Ataturk, 25240 Erzurum, Turkey
2
Faculty of Mechanical Engineering, University of Tabriz, Tabriz 5166616471, Iran
3
Faculty of Engineering and Applied Science, University of Ontario Institute of Technology, 2000 Simcoe Street North, Oshawa, ON L1H 7K4, Canada
4
Institute for Energy Engineering, Technische Universität Berlin, Marchstr 18, 10587 Berlin, Germany
*
Author to whom correspondence should be addressed.
Sustainability 2015, 7(9), 12236-12257; https://doi.org/10.3390/su70912236
Submission received: 28 July 2015 / Revised: 24 August 2015 / Accepted: 28 August 2015 / Published: 3 September 2015
(This article belongs to the Section Energy Sustainability)

Abstract

:
The results are reported of exergoeconomic analyses of a simple gas turbine cycle without a fogging system (SGT), a simple steam injection gas turbine cycle (STIG), and a steam injection gas turbine cycle with inlet fogging cooler (FSTIG). The results show that (1) a gas-turbine cycle with steam injection and simultaneous cooling has a higher power output than the other considered cycle; (2) at maximum energy efficiency conditions the gas turbine has the highest exergy efficiency of the cycle components and the lowest value of exergy efficiency is calculated for the fog cooler, where the mixing of air and water at greatly different temperatures causes the high exergy destruction; and (3) utilization of the fogging cooler in the steam injection cycle increases the exergy destruction in the combustion chamber. Furthermore, the simple gas turbine cycle is found to be more economic as its relative cost difference, total unit product cost, and exergoeconomic factors are less than those for the two other configurations. However, its efficiency and net power output are notably lower than for the gas turbine with steam injection and/or fog cooling. The total unit product cost is highest for the simple gas turbine with steam injection.

1. Introduction

The performance of a gas turbine, particularly output power and efficiency, is affected significantly by ambient temperature, e.g., the output power of a gas turbine decreases as the ambient temperature rises. This can be particularly problematic since periods of peak load demand tend to increase in summer [1,2,3]. A method to enhance energy efficiency is cooling the inlet air to the gas turbine and inlet fogging [4]. This approach involves spraying water droplets into the turbine inlet air to lower the air temperature towards its wet-bulb temperature and can be beneficial [4,5,6].
By modeling and assessing a media evaporative cooling system in the gas turbine of a Fars combined-cycle power plant (Iran), Hosseini et al. [7] demonstrated that media evaporative cooling for this gas turbine plant at 38 °C ambient temperature and 8% relative humidity temperature reduced the inlet air temperature by about 19 °C and increased the power output by 11 MW.
Economic analyses by Chacartegui et al. [8] determined the effects on power plant performance and economics of combustion turbine inlet air cooling systems.
Overspray of the full spray water causes water droplets to evaporate in the compressor, shifting the compression to isothermal from adiabatic and reducing the compressor power input [9]. An energy analysis by Sanaye and Tahani [10] use of fogging to achieve a saturated moisture state with 1% and 2% overspray showed that inlet air fogging increases the compressor power input, attaining the highest value for saturated inlet air. This phenomenon is attributable in part to the increase in density and mass flow rate of inlet air observed with decreasing temperature.
The efficiency and electricity generation of a gas turbine vary with ambient conditions, sometimes significantly affecting fuel consumption and power plant revenue. The electric power output of a gas turbine is directly proportional to and restricted by the mass flow rate of the compressed air provided by the air compressor to the combustion chamber [11,12]. An air compressor has a constant capacity in terms of volumetric flow rate of air for a given rotational speed so, even though the volumetric capacity of a compressor is fixed, the mass flow rate of air it delivers to the system changes with fluctuations in ambient temperature. This air mass flow rate decreases with increasing ambient temperature because the air density decreases when the air temperature increases. Therefore by increasing the ambient temperature above 15 °C the power output of the gas turbine decreases below its rated capacity at the ISO (International Organization for Standardization) conditions (15 °C and 101.3 kPa at sea level). Additionally, since gas turbines are constant volume machines, they move the same volume of air at a given shaft speed, but the power output of a turbine depends on the flow of mass through it, which is why the power output declines on hot days, when air is less dense. An inlet air temperature rise of 1 °C reduces the power output by 1% [13] while raising the heat rate of the turbine. This effect is of concern to power producers, resulting in the development of many techniques to cool the inlet air to a gas turbine system.
Traditionally, gas turbine inlet air has been cooled by fogging coolers [14], which are comprised of fogging nozzles and a high-pressure pump system. Fogging reduces inlet air temperature by evaporating a spray of water after the filter stage but adequately early that moisture cannot reach the compressor blades. Moisture eliminators are usually installed before the compressor stage to reduce the possibility of turbine damage from moisture carry-over. Cooling capacity with this technique is limited by ambient conditions, the wet bulb temperature being the theoretically lowest limit.
An air cooled condenser (ACC) fogging system can be installed on an inlet air fogging system to gain additional electrical power output during peak demand conditions. Several standards exist for calculating the performance of an ACC fogging system, including ASME PTC., 30 and the Standards for Air-cooled Heat Exchangers published by the Air Cooled Heat Exchanger Manufacturers Association [15]. However, there are no standards at this time for calculating the performance of air-cooled condensers, and the standards for air-cooled heat exchangers cannot be applied for this purpose. Thus, new standards are needed for acceptance test procedures and for calculating performance under a variety of operating conditions. Wind velocity and direction affect ACC performance during hot ambient conditions, but wind screen placement can improve ACC performance. The cooling performance of a typical fog system is around 80%–95%, and its effectiveness is limited by the difference between dry and wet bulb temperatures, which depend on the relative humidity at the plant location. The cooling process by fogging is shown on a psychometric chart by a constant enthalpy line in the direction of saturated air, like the adiabatic cooling process.
Another method for improving the performance of a gas turbine power plant is steam injection [16]. This method exploits the fact that the exhaust gases at the turbine exit are at high temperature, by adding a heat recovery boiler to transfer heat from the gases to water to produce high-pressure superheated steam, which is injected into the combustion chamber. This raises the mass flow rate and the specific heat of the combustion products, resulting in a higher turbine work rate. Steam injection also increases efficiency by reducing the energy loss with the turbine exhaust.
The gas-turbine cycle with steam injection and simultaneous cooling (FSTIG) utilizes both techniques. The use of fogging along with steam injection gas turbine reduces the inlet air temperature [17]. Less water vapor is produced in the boiler during this process than with only steam injection because the turbine exhaust gas is at a lower temperature. Although some research has been carried out on the thermodynamics of such a process, little work has been reported on the combined thermodynamic and economic behavior [6]. Such an understanding is required for a rational decision in system designs. We address this need in the present paper by carrying out exergoeconomic analyses of gas-turbine cycles utilizing both fogging for inlet cooling and steam injection to improve understanding of the techno-economic behavior of such systems and assist improvement efforts. The authors have previously published an article regarding the utilization of fog cooling in biomass fired plants and its exergoeconomic analysis [18], and the present work extends those efforts. The FSTIG cycle and its components are assessed and the advantages and disadvantages of the FSTIG cycle are compared with those for other cycles. The impact of implementing several improvement measures on energy and exergy efficiencies and losses are assessed to inform the exergoeconomic analyses, which reveal the cost formation in different parts of the cycle. The assessments in this work are also aimed at providing options for improving the economic and environmental performance of methods for increasing the efficiency of gas-turbine power plants. Particular attention is paid during the exergoeconomic assessments on ways to decrease the exergy destructions of components and their costs. Parametric studies are carried out to determine the effects of varying design parameters on exergoeconomic performance of the three cycles (simple gas turbine without fogging system SGT, STIG and FSTIG). The results are intended for use by engineers and designers of such systems. To this end, this article identifies features of these cycles, as well as their pros and cons from either thermodynamic or exergoeconomic points of view. The findings are validated with corresponding results from the literature.

2. Descriptions of Cycles and Analyses

In this study an exergoeconomic analysis of simple gas turbine and gas turbine steam injection cycles with and without fogging inlet cooling is carried out using analytical modeling. Descriptions of these cycles and their operations are examined follow:
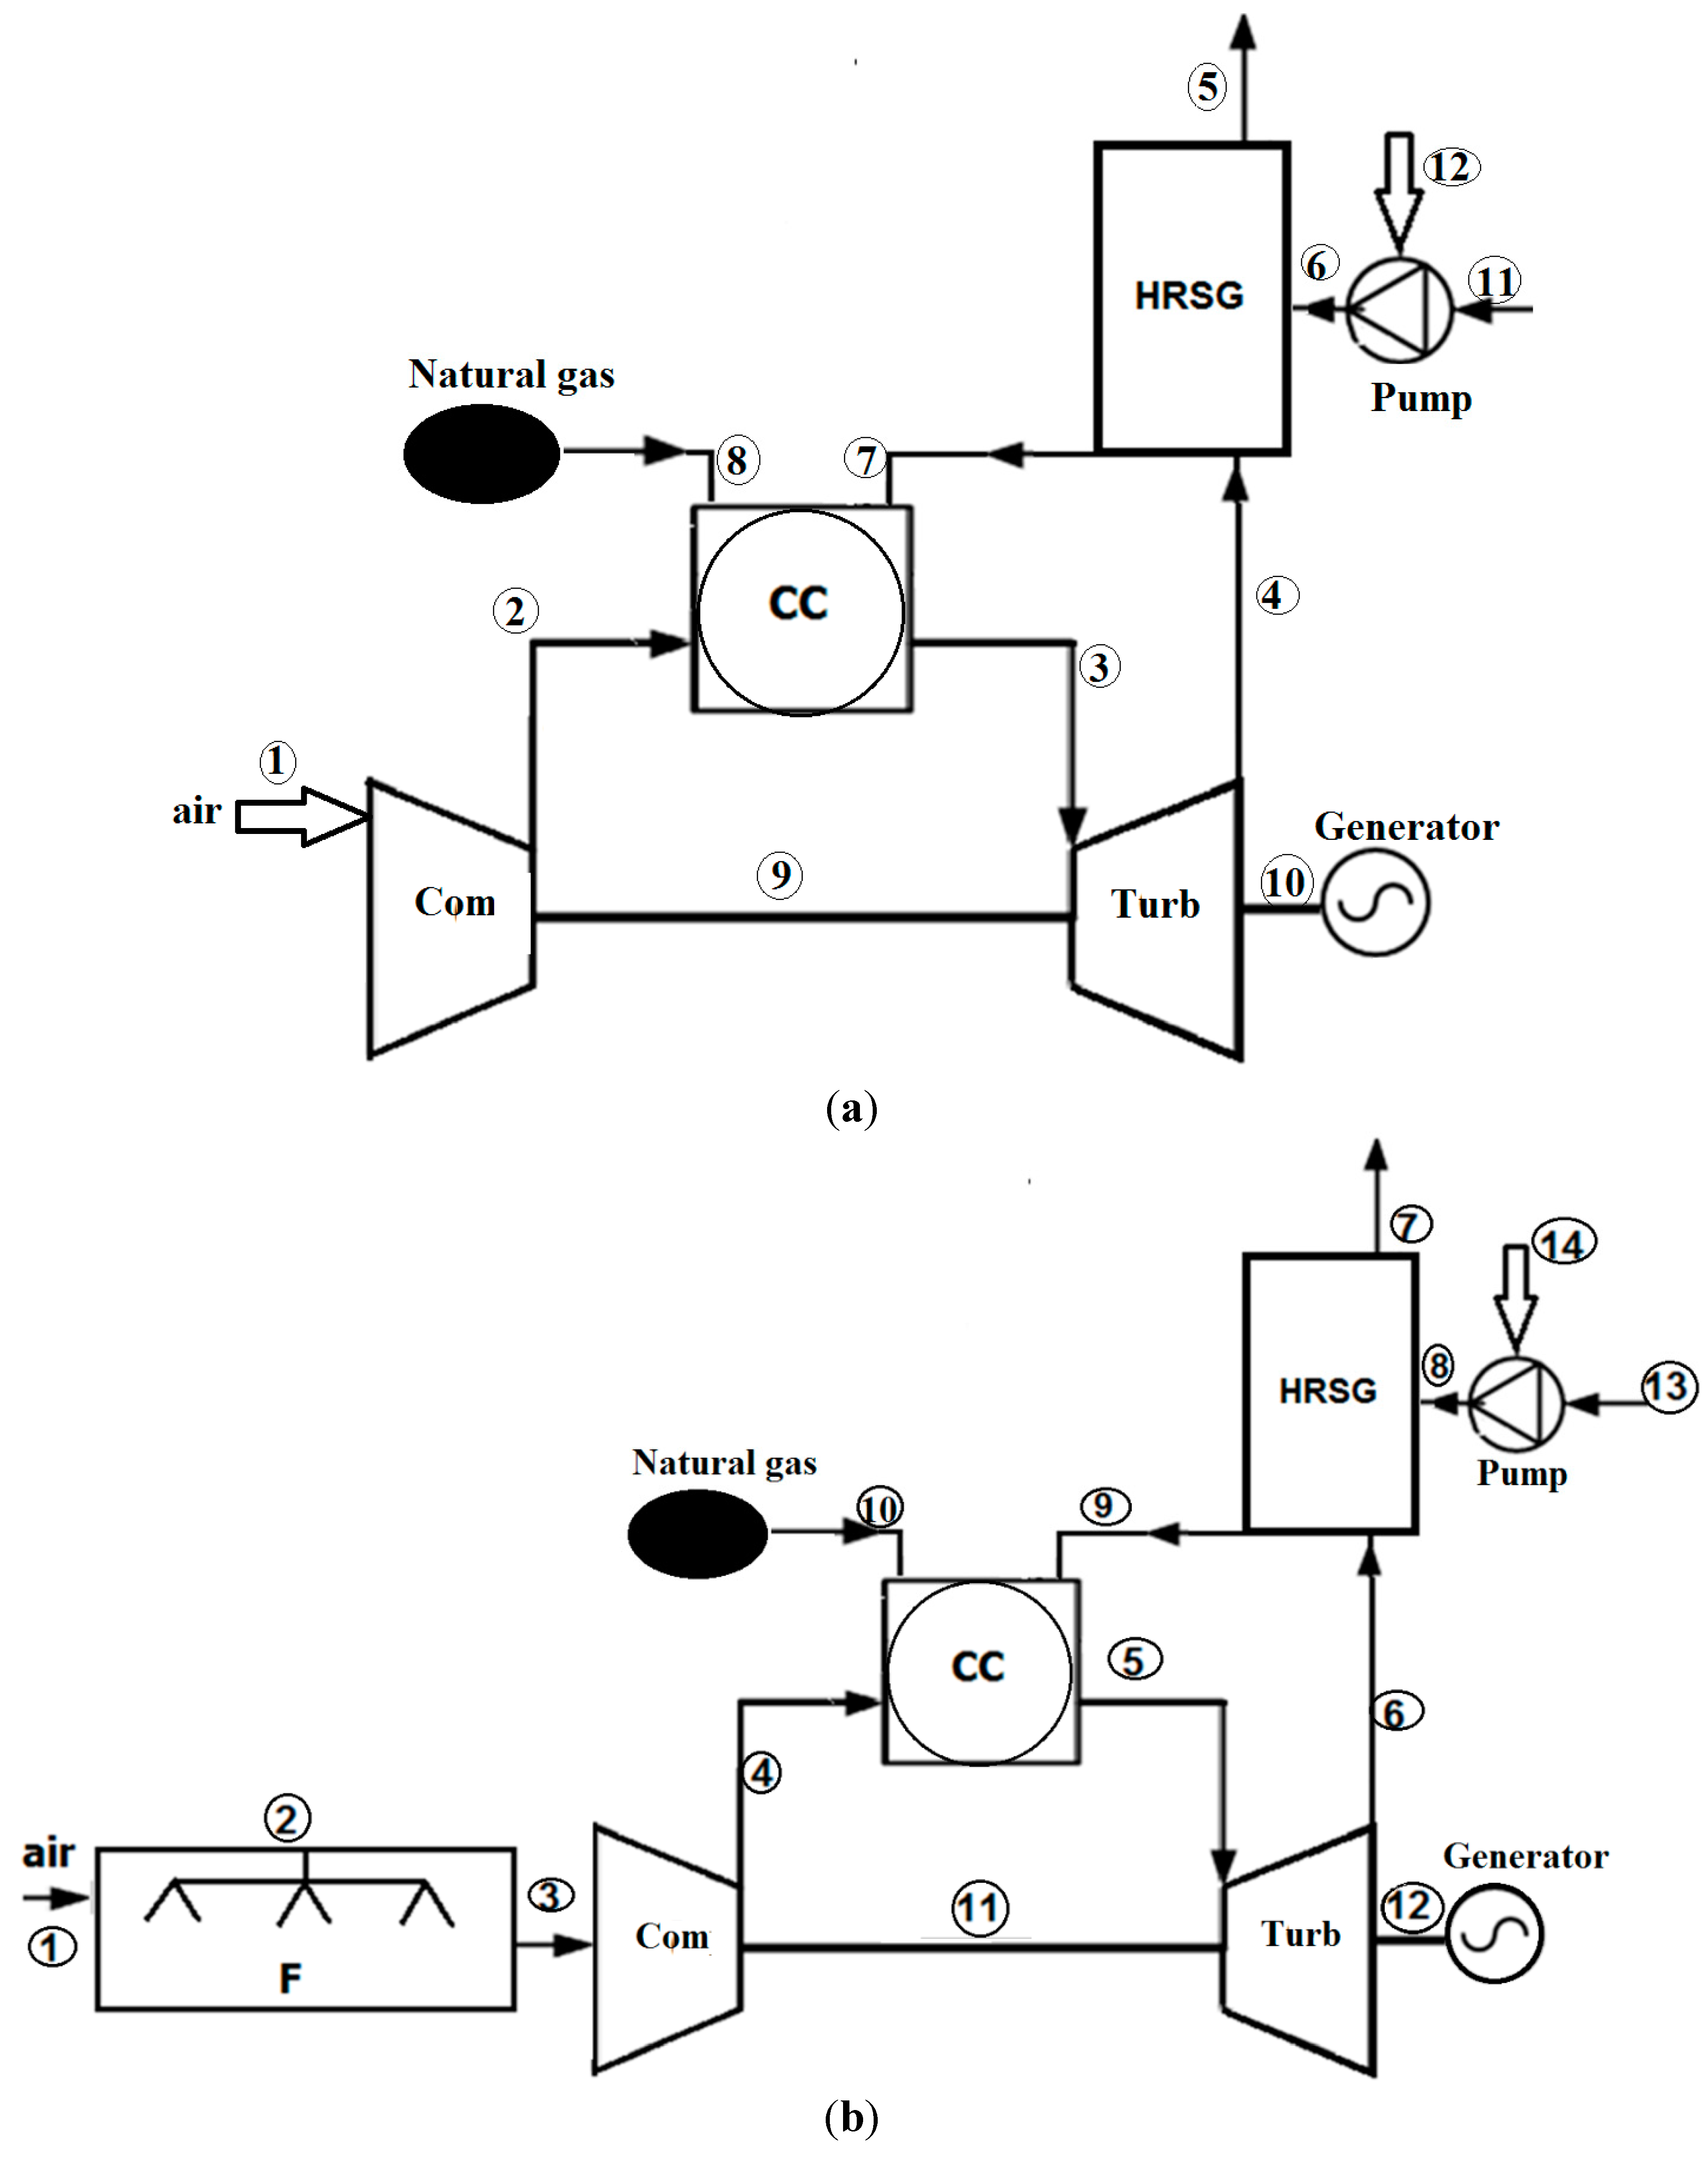
The STIG cycle (Figure 1a) is a simple gas turbine only with steam injection. Inlet air with ambient conditions pressure (P1), temperature (T1) and relative humidity (w1) enters the compressor (characterized by polytropic efficiency) which raises the pressure of the air. The compressed air enters the combustion chamber where it is used for the combustion of fuel (CH4). In order to limit the maximum temperature of the product gases, which occurs at the turbine inlet temperature (TIT), more than stoichiometric air is used, where the amount of excess air is identified by the excess air factor. Next, the hot gases expand in the turbine to produce mechanical power. The gases then enter the heat recovery steam generator (HRSG), where superheated vapor is produced and then injected into the combustion chamber.
The proposed cycle in this study that provides overspray and steam injection simultaneously (the FSTIG cycle) is shown in Figure 1b. Inlet air with ambient pressure (P1), temperature (T1), and relative humidity (w1) enters the fogging cooler. There, the spraying of water into the air flow raises its relative humidity to 100%, while the air temperature reduces to the corresponding wet-bulb temperature. A mixing process, presumed adiabatic, occurs in the fogging cooler. The rest of the cycle is the same as the STIG cycle.
For the simulations of the various gas-turbine cycles, various assumptions are made. The mass flow rate of the ambient air is equal to 20 kg/s, and the air is at atmospheric conditions, i.e., P1 = 101.325 kPa, T1 = 318 K and φamb = 60%. The efficiency of the combustion chamber is 99% and the pressure drop through it is 4% [19]. Methane (CH4) is taken to be the fuel, with lower heating value (LHV) of 50,010 kJ/kg·K [19]. The cost of natural gas is 9.03 $/GJ [20]. For both, the compressor and the turbine, the value of the polytropic efficiency is assumed to be fixed and equal to 0.88 [19]. The pump isentropic efficiency is 0.80. The pinch point temperature difference in the boiler is 10 K [21]. For the HRSG, the efficiency of is 96% [19], the steam pressure is 80 bar, and the end temperature difference is 50 K.
Figure 1. (a) Gas turbine cycle with steam injection (STIG); (b) Gas turbine cycle with steam injection and inlet fogging cooler (FSTIG).
Sustainability 07 12236 g001

3. Thermodynamic and Exergoeconomic Analyses

Before explaining the exergoeconomic analyses, the relevant exergy analyses are explained. The performances of each cycle and its components are simulated and assessed using conservation of mass and energy principles as well as exergy rate balances [22,23,24]. Energy and mass rate balances for all components in the FSTIG cycle are provided below:

3.1. Energy Analyses of FSTIG Components

3.1.1. Fog Cooler

Mass and energy rate balances for the fog cooler can be written as follows:
m ˙ f = m ˙ a × OS
m ˙ 1 + m ˙ 2 = m ˙ 3 + m ˙ w3
h  a3 + w 3 h  v3 + OS × h  w3  = h  a1 + w 1 h  v1 + (w 3 w 1 +OS) × h  f

3.1.2. Air Compressor

Mass and energy balances for the compressor follow:
m ˙ 3 = m ˙ 4
W ˙ Com = m ˙ 3 (h 4 h 3 )
The polytropic efficiency can be expressed as:
T 3 T 4 CP ¯ ,a dT T = P 3 P 4 R ¯ η pt,Com dP P

3.1.3. Combustion Chamber

The combustion chamber is fed with air from the compressor and natural gas fuel. Complete combustion is assumed in the combustion chamber. Mass and energy balances and fuel air ratio can be written as follows:
m ˙ 4 + m ˙ 9 + m ˙ 10 = m ˙ 5
298.15 T f C ¯ P . C n H m dT + λ (n + m/4) [ 298.15 T 4 C ¯ P,O 2 dT + 3.76   298.15 T 4 C ¯ P,N 2 dT + 4.76 ω ¯ 4 298.15 T 4 C ¯ P,H 2 O dT ] = n 298.15 TIT C ¯ P,CO 2 dT+[λ(n + m/4)4.76 ω ¯ 4  + m/2]   298.15 TIT C ¯ P,H 2 O dT   +  3.76 λ (n + m/4)   298.15 TIT C ¯ P,N 2 dT   +(λ 1) (n + m/4) 298.15 TIT C ¯ P,O 2 dT    LHV
FA = M CH 4 λ ( n + m 4 ) × 4.76 × ( 1 + w ¯ 3 ) × M air × η cc

3.1.4. Turbine

Mass and energy rate balances, and polytropic efficiency for the turbine, can be written as follows:
m ˙ 5 = m ˙ 6
W ˙ Turb = m ˙ 5 (h 5 h 6 )
TOT T 5 C ¯ P,g dT T = P 6 P 5 η pt,Turb R ¯ dP P

3.1.5. HRSG

The analysis of the HRSG has been performed taking into account three factors. Firstly, the outlet gas temperature from the HRSG is limited to 400 K in order to avoid any unwanted corrosion through condensation. Secondly, a pinch point temperature difference of 10 K is assigned for the HRSG. Thirdly, the end temperature difference in the HRSG is 50 K. Below, mass and energy rate balances are shown:
m ˙  8 + m ˙  6 = m ˙  9 + m ˙  7
X = n s × M H 2 O λ ( n + m 4 ) × 4.76 × ( 1 + w ¯ 3 ) × M air × η cc
Q ˙ HRSG = m ˙ 8 × ( h 9 h 8 )
( T 6 T 9 ) =50 K
Q ˙ HRSG = m ˙ s (h  s h  W,HRSG )
Products n i T 7 TOT C ¯ P, g, i  dT= n 8 [ h ¯ W (T 9 ,P 9 ) h ¯ W (T 8 ,P 8 )] η B
The exergy analysis is based on “exergy of fuel” and “exergy of product”, which are defined in Table 1.
Table 1. Definitions of the exergy of fuel, exergy of product, cost balances, and auxiliary equations for the FSTIG plant.
ComponentExergy of FuelExergy of ProductCost Balance and Auxilary Equations
Com E ˙ 11 E ˙ 4 E ˙ 3 C ˙ 4 = C ˙ 3 + Z ˙ Com + C ˙ 11 c 1 =0
Turb E ˙ 5 E ˙ 6 W ˙ 11 + W ˙ 12 C ˙ 5 + Z ˙ Turb = C ˙ 11 + C ˙ 12 + C ˙ 6 c 5 =c 6 ,c 11 =c 12
CC E ˙ 10 + E ˙ 9 E ˙ 5 E ˙ 4 C ˙ 4 + C ˙ 9 + C ˙ 10 + Z ˙ CC = C ˙ 5
FC E ˙ 1 + E ˙ 2 E ˙ 3 C ˙ 1 + C ˙ 2 + Z ˙ FC = C ˙ 3 c 2 =0
HRSG E ˙ 6 E ˙ 7 E ˙ 9 E ˙ 8 C ˙ 6 + C ˙ 8 + Z ˙ HRSG = C ˙ 7 + C ˙ 9 c 6 =c 7
In exergy costing a cost rate is calculated for each exergy transfer in the form of either matter or power or heat. These cost rates are balanced as follows [25,26]:
j=1 n ( c j E ˙ j ) in + Z ˙ = j=1 m ( c j E ˙ j ) out
or using the concept of “exergy of product” and “exergy of fuel”
c F E ˙ F + Z ˙ = c P E ˙ P
Here, c is the cost per unit exergy of each stream. Equation (19a) states that the sum of cost rates associated with all the exergy streams entering a component and the cost rates associated with the capital investment as well as operating and maintenance ( Z ˙ = Z ˙ CI + Z ˙ OM ) is equal to the sum of cost rates associated with the exiting exergy streams. The calculation procedure (the so-called F-rule and P-rule) is described in ref. [25]. The cost data for each component of the systems (Zk) is taken from appropriate references [25,26,27,28]. The cost equation for Zk of each component in the system is given in Appendix. The cost data provided in the literature are for different years and in the present work they are normalized to the reference year, 2011, through the following relation [25]:
Cost at reference year = Original cost * cost index for the reference year/Cost index for the year when the original cost was obtained
The annual levelized capital investment for the kth component can be calculated as [26]:
Z ˙ k CI = ( CRF τ ) × Z k
Here, CRF is the capital recovery factor and τ the annual plant operation hours. The capital recovery factor is a function of the interest rate ir and the number of years of the plant operation n, as follows:
CRF= i r ( 1+i r ) n ( 1+i r ) n 1
For the kth component, the annual levelized operation and maintenance cost can be expressed as [26]:
Z k OM k Z k k E ˙ p,k + R ˙ k
Here, γ k and ω k account for the fixed and variable operation and maintenance costs, respectively, associated with the kth component and R ˙ k includes all the other operation and maintenance costs, which are independent of investment cost and product exergy. The last two terms on the right side of Equation (22) are neglected in the present work as they are small compared to the first term [26,29].
Equation (19a) is applied to each system component to calculate the cost rate of each stream in a system [25]. The definitions of the exergy of fuel, exergy of product, as well as cost balances and auxiliary equations are given in Table 1. In addition, the average unit cost of fuel cF, the average unit cost of product cP, the cost rate of exergy destruction rate C ˙ D , the relative cost difference r , and the exergoeconomic factor ƒ are calculated for each component. These parameters play major roles in the exergoeconomic analysis of an energy conversion system [25]. The focus in the present work is to carry out exergoeconomic analyses on FSTIG and STIG and SGT cycles to show and compare the economic viability of these configurations.
Several important performance parameters are utilized. The exergy efficiency for the cycle is defined as follows:
ε= W ˙ net E ˙ 1 + E ˙ CH 4
For the kth component, the relative cost difference rk is defined as [25]
r k = c p,k c F,k c F,k
and the exergoeconomic factor f k as [25]
f k = Z ˙ k Z ˙ k +c F,k ( E ˙ D,k + E ˙ L,k )
The total unit product cost, which is the economic objective function in the present work, is calculated as follows [29]:
c p,total = i=1 n k Z ˙ k + i=1 n f c Fi E ˙ F i=1 n p E ˙ P i

4. Results and Discussion

4.1. Validation

The results obtained via the software analysis are validated by comparing them with the experimental results of Sanaye and Tahani for the GE917IE turbine. This study investigated the results for simple gas turbine cycle with a fogging cycle [10]. The comparison is shown in Table 2, where CIT, CDT, W ˙ net , TOT, and heat rate denote, respectively, compressor inlet temperature, compressor discharge temperature, net power production rate of the cycle, turbine outlet gas temperature, and heat rate in the cycle.
Table 2. Comparison of reported and computed results for selected conditions: TIT = 1122 °C, compressor pressure ratio = 11.84, inlet mass rate of turbine = 374.59 kg/s, OS = 2%.
ParameterReported [10]Computed Here
CIT (°C)30.0030.08
CDT (°C)293286.90
W ˙ net (MW)133136
TOT (°C)553577
HR (kJ/kWh)10,60910,653

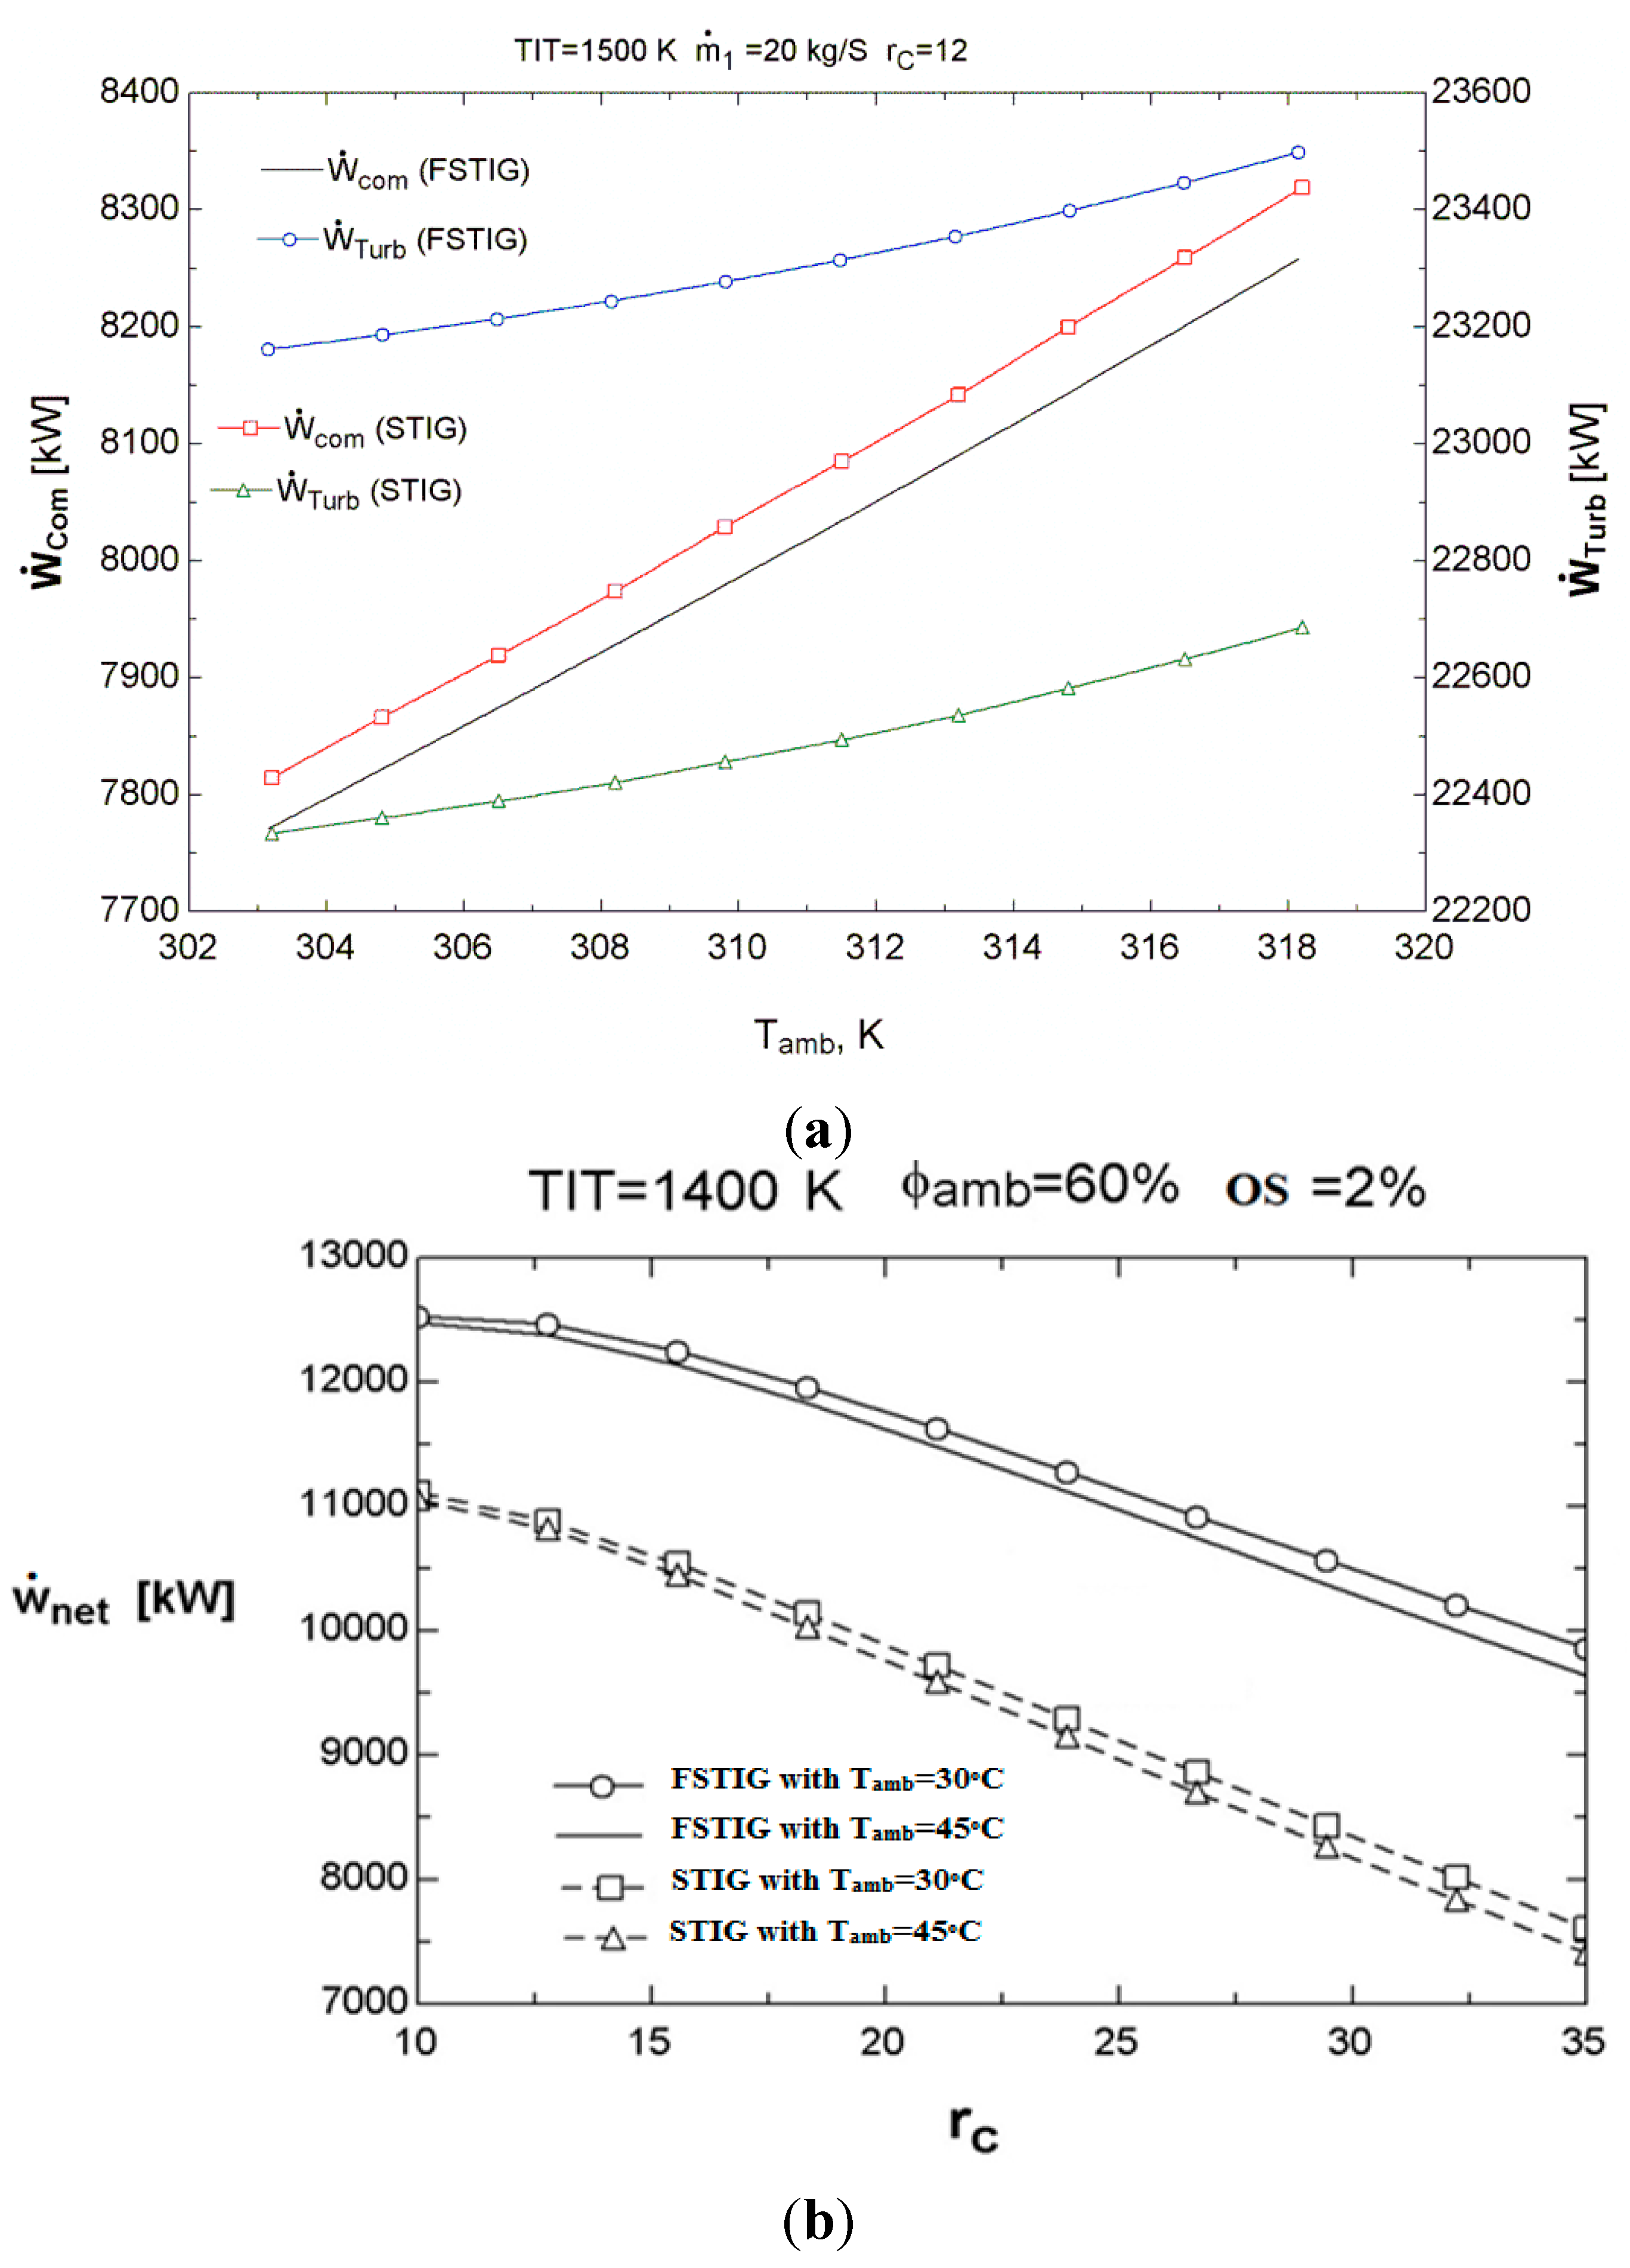
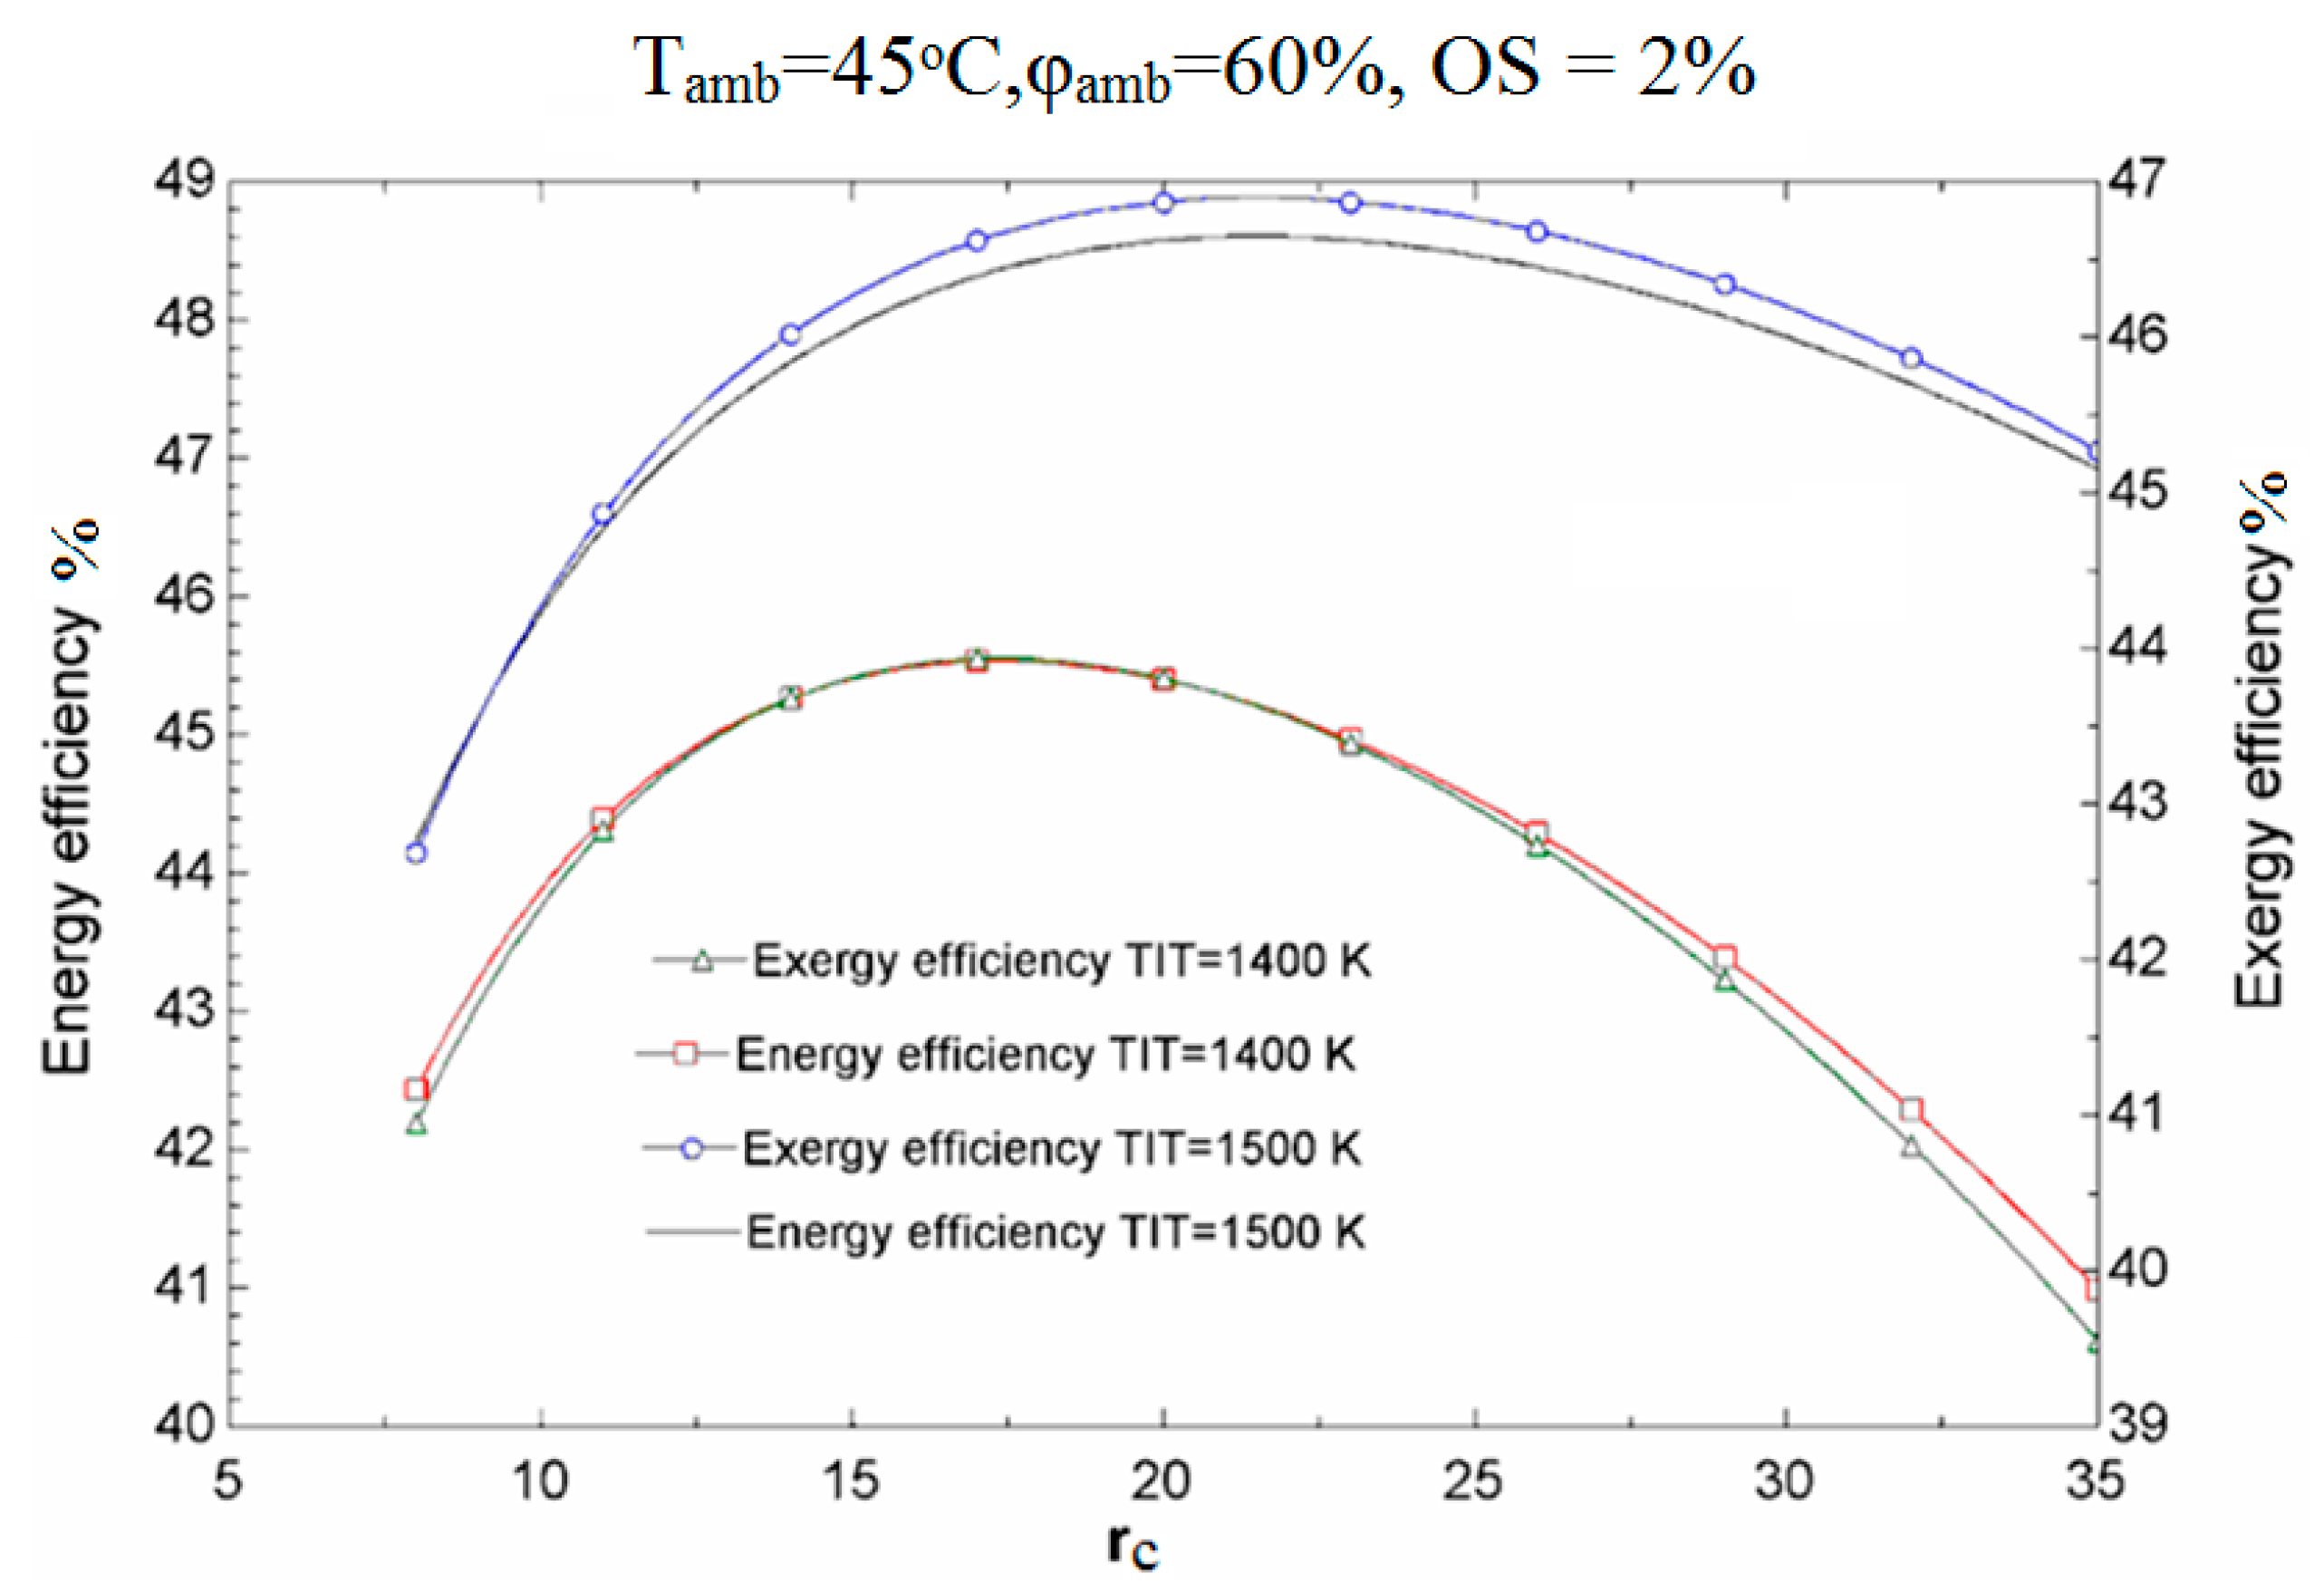
4.2. Thermodynamic Analysis of FSTIG and STIG Cycles

It is shown in Figures 2a,b for the FSTIG cycle, that an increase in the ambient temperature raises the compressor power consumption, although the mass flow rate entering the turbine remains almost constant. Consequently, the gross power produced by the turbine is roughly fixed, but the net power production of the cycle is reduced when the ambient temperature rises. At the same ambient temperature, the net power production of the FSTIG exceeds that for a corresponding STIG. In the FSTIG cycle, the total mass flow rate through the turbine and the specific power it produces can be increased while the compressor power consumption can decline because of the intercooling effect, yielding an increase in net power output. Additionally, as rc rises the net output power decreases because the compressor and turbine powers increase, but the increase is greater for the compressor than the turbine. This is due to the fact that, although increasing rc raises the turbine specific work, the steam injection mass flow rate decreases since the turbine outlet temperature decreases.
Figure 2. (a) Gas turbine and compressor powers of FSTIG and STIG plants with ambient temperature (Tamb), for the following conditions: inlet turbine temperature (TIT) = 1500 K, relative humidity (φamb) = 60% and overspray (OS) = 2%; (b) Net power production of STIG cycle with and without fogging ( ) vs. compressor pressure ratio (rc) for two values of ambient temperature (Tamb), for the following conditions: inlet turbine temperature (TIT) = 1400 K, relative humidity (φamb) = 60%, and overspray (OS) = 2%.
Sustainability 07 12236 g002
Figure 3 shows the variation in cycle energy and exergy efficiencies as pressure ratio changes, for two TITs. As pressure ratio changes, both efficiencies are observed to be maximized at particular values of the TIT. Nonetheless, a higher TIT generally leads to higher energy and exergy efficiencies for all pressure ratios. Additionally, increasing the TIT increases the value of the optimum compressor pressure ratio.
Figure 3. Variation of energy and exergy efficiencies in FSTIG plant with pressure ratio.
Sustainability 07 12236 g003
Figure 4 shows the exergy efficiency of FSTIG components, at the maximum energy efficiency condition. The gas turbine is seen to have the highest exergy efficiency and the components, in order of decreasing exergy efficiency, are compressor, HRSG, combustor, and fog cooler. The low exergy efficiency of the fog cooler is due to mixing of air and water with large temperature differences, which causes high exergy destruction. The low value of exergy efficiency in the combustor is due to irreversible chemical reactions and heat transfer across large temperature differences.
Figure 4. Exergy efficiency of FSTIG at optimum Energy efficiency (TIT = 1500 K).
Sustainability 07 12236 g004
Figure 5 shows the exergy efficiency of combustion chamber for various inlet conditions in the FSTIG and STIG plants. It is observed that, by raising the ambient temperature and the pressure ratio, the combustion chamber exergy efficiency is increased. This observation is mainly attributable to the fact that, for such a modification, the outlet temperature of the compressor and its exergy are increased. Moreover, combustion chamber exergy efficiency in the STIG plant is higher than the FSTIG plant.
Figure 5. Exergy efficiency of the combustion chamber of the FSTIG and STIG cycles vs. compressor pressure ratio (rc) for two values of ambient temperature (Tamb), at the following conditions: inlet turbine temperature (TIT) = 1500 K, relative humidity (φamb) = 60% and OS = 2%.
Sustainability 07 12236 g005
Figure 6 shows the exergy efficiency of the combustion chamber for various gas-turbine cycles at the maximum efficiency condition. It is observed that, by raising the TIT, the combustion chamber exergy efficiency increases. This observation is mainly attributable to the fact that, for such a modification, the inlet temperature of the turbine and the exergy efficiency of the combustion chamber are increased. Furthermore, the highest combustion chamber exergy efficiency is, respectively, for the STIG, FSTIG, and SGT plants. That is concluded that, steam injection substantially increases the combustion chamber exergy efficiency but fog cooling has a reverse effect.
Figure 6. Exergy efficiency of the combustion chamber for various gas-turbine cycles and TITs at the maximum efficiency condition for Tamb = 45 °C, φamb = 60%, and OS = 2%.
Sustainability 07 12236 g006

4.3. Exergoeconomic Analyses of FSTIG and STIG Cycles

Table 3 lists several important performance parameters for the three configurations of a plant operating at full load under energy efficiency optimized condition. The energy and exergy efficiencies, respectively, of the FSTIG plant are about 0.5% and 0.4% higher than those of the STIG plant, and 14% and 13% higher than those of the SGT plant. Natural gas consumption is highest for the FSTIG plant because fog cooling causes the compressor outlet temperature to be low relative to the other two cycles, so more natural gas must be consumed to attain the desired TIT. The net power output plant is highest for the FSTIG plant because of the mass flow rate entering the turbine. The exergy loss rate is highest for the SGT plant and lowest for the STIG plant. The cost of exergy loss, like exergy loss rate, is highest for the SGT and lowest for the STIG. The total component cost is highest for the FSTIG and lowest for the SGT plant. The relative cost difference is greatest for the STIG plant and next highest for the FSTIG plant, implying fog cooling is economically feasible. For the three configurations, the values of the exergoeconomic factor indicate that the exergy destruction costs are higher than the capital investment and maintenance costs. Furthermore, the exergoeconomic factor, which represents the ratio of capital cost to exergy destruction cost, is highest for the FSTIG, next highest for the STIG plant, and lowest for the SGT plant. The total unit product cost, and also the gas turbine product cost, is highest for the STIG plant and the lowest for the SGT plant.
Table 3. Performance parameters of three plants at optimum operating conditions *.
ParameterFSTIG: rc = 21.48, TIT = 1500 KSTIG: rc = 20.11, TIT = 1500 KSGT: rc = 19.69, TIT = 1500 K
Natural gas flow rate (kg/s)0.54330.52100.3628
Net power (kW)13163125116230
Energy efficiency (%)48.6048.1834.32
Exergy efficiency (%)46.9046.4933.12
Exergy loss rate (kW)562.5519.35347
Cost of exergy loss ($/h)18.9017.45179.70
Total purchase equipment cost (106 $)11.9411.228.772
Relative cost difference (%)93.3193.6280.31
Exergoeconomic factor (%)44.1443.5837.73
Gas turbine product cost ($/GJ)16.5616.6215.51
Total unit product cost ($/GJ)18.0418.0716.83
* The mass flow rate of the ambient air is 20 kg/s in all cases.
Figure 7 shows the variation of total unit product (electricity) cost for the FSTIG cycle with pressure ratio, for several values of TIT. As rc increases, the total unit product cost decreases to a point and then rises. However, increasing TIT decreases the total unit product cost. Note that the optimum compressor pressure ratio increases as the TIT increases, similar to the findings from the exergy analysis.
Figure 7. Variation of total unit product cost of the FSTIG plant with pressure ratio for several values of TIT.
Sustainability 07 12236 g007
The variation of exergoeconomic factor with rc, for several values of TIT, is shown in Figure 8a for the FSTIG plant. As rc increases, the exergoeconomic factor increases, suggesting that increasing the pressure ratio increases the capital cost. However, increasing TIT has a complicated effect on the exergoeconomic factor, as can be seen in Figure 8b, which illustrates the change in exergoeconomic factor with TIT when rc is constant. Increasing TIT to about 1400 K decreases the exergoeconomic factor, or capital investment cost, while further increases lead to a higher exergoeconomic factor and a higher capital investment cost.
Figure 8. (a) Variation of exergoeconomic factor of the FSTIG plant with pressure ratio for several values of TIT; (b) Variation of exergoeconomic factor of the FSTIG plant with TIT (rc = 15).
Sustainability 07 12236 g008aSustainability 07 12236 g008b
The variation in the total unit product cost of the FSTIG plant with the overspray is shown in Figure 9. It is observed that the total unit product cost decreases as the overspray increases, but the effect is very slight. This reveals that, as noted previously, fog cooling is economically advantageous.
Figure 9. Variation of total unit product cost of the FSTIG plant with overspray.
Sustainability 07 12236 g009
The variation in the total unit product cost with the rc is shown in Figure 10 for the FSTIG, STIG and SGT plants. As rc increases the total unit product cost is seen to increase for the SGT plant, but not for the FSTIG and STIG plants. For the latter cases, no optimum point is observed. The variation in the total unit product cost with TIT is shown for the FSTIG, STIG and SGT plants in Figure 11, where it is seen that the total unit product cost decreases with TIT for all the plants.
Figure 10. Variation of total unit product cost of the three plants with pressure ratio.
Sustainability 07 12236 g010
Figure 11. Variation of total unit product cost of the three plants with TIT (rc = 15).
Sustainability 07 12236 g011

5. Conclusions

Gas turbine cycle performance is enhanced quantitatively by inlet cooling with fogging. This can assist in meeting increase demands for power and offsetting shortages during peak load periods, especially in summers. In this study parametric studies are carried out for three cycles: simple gas turbine cycle without fogging system (SGT), simple steam injection gas turbine cycle (STIG), and steam injection gas turbine cycle with inlet fogging cooler (FSTIG). The following conclusions are drawn from the results:
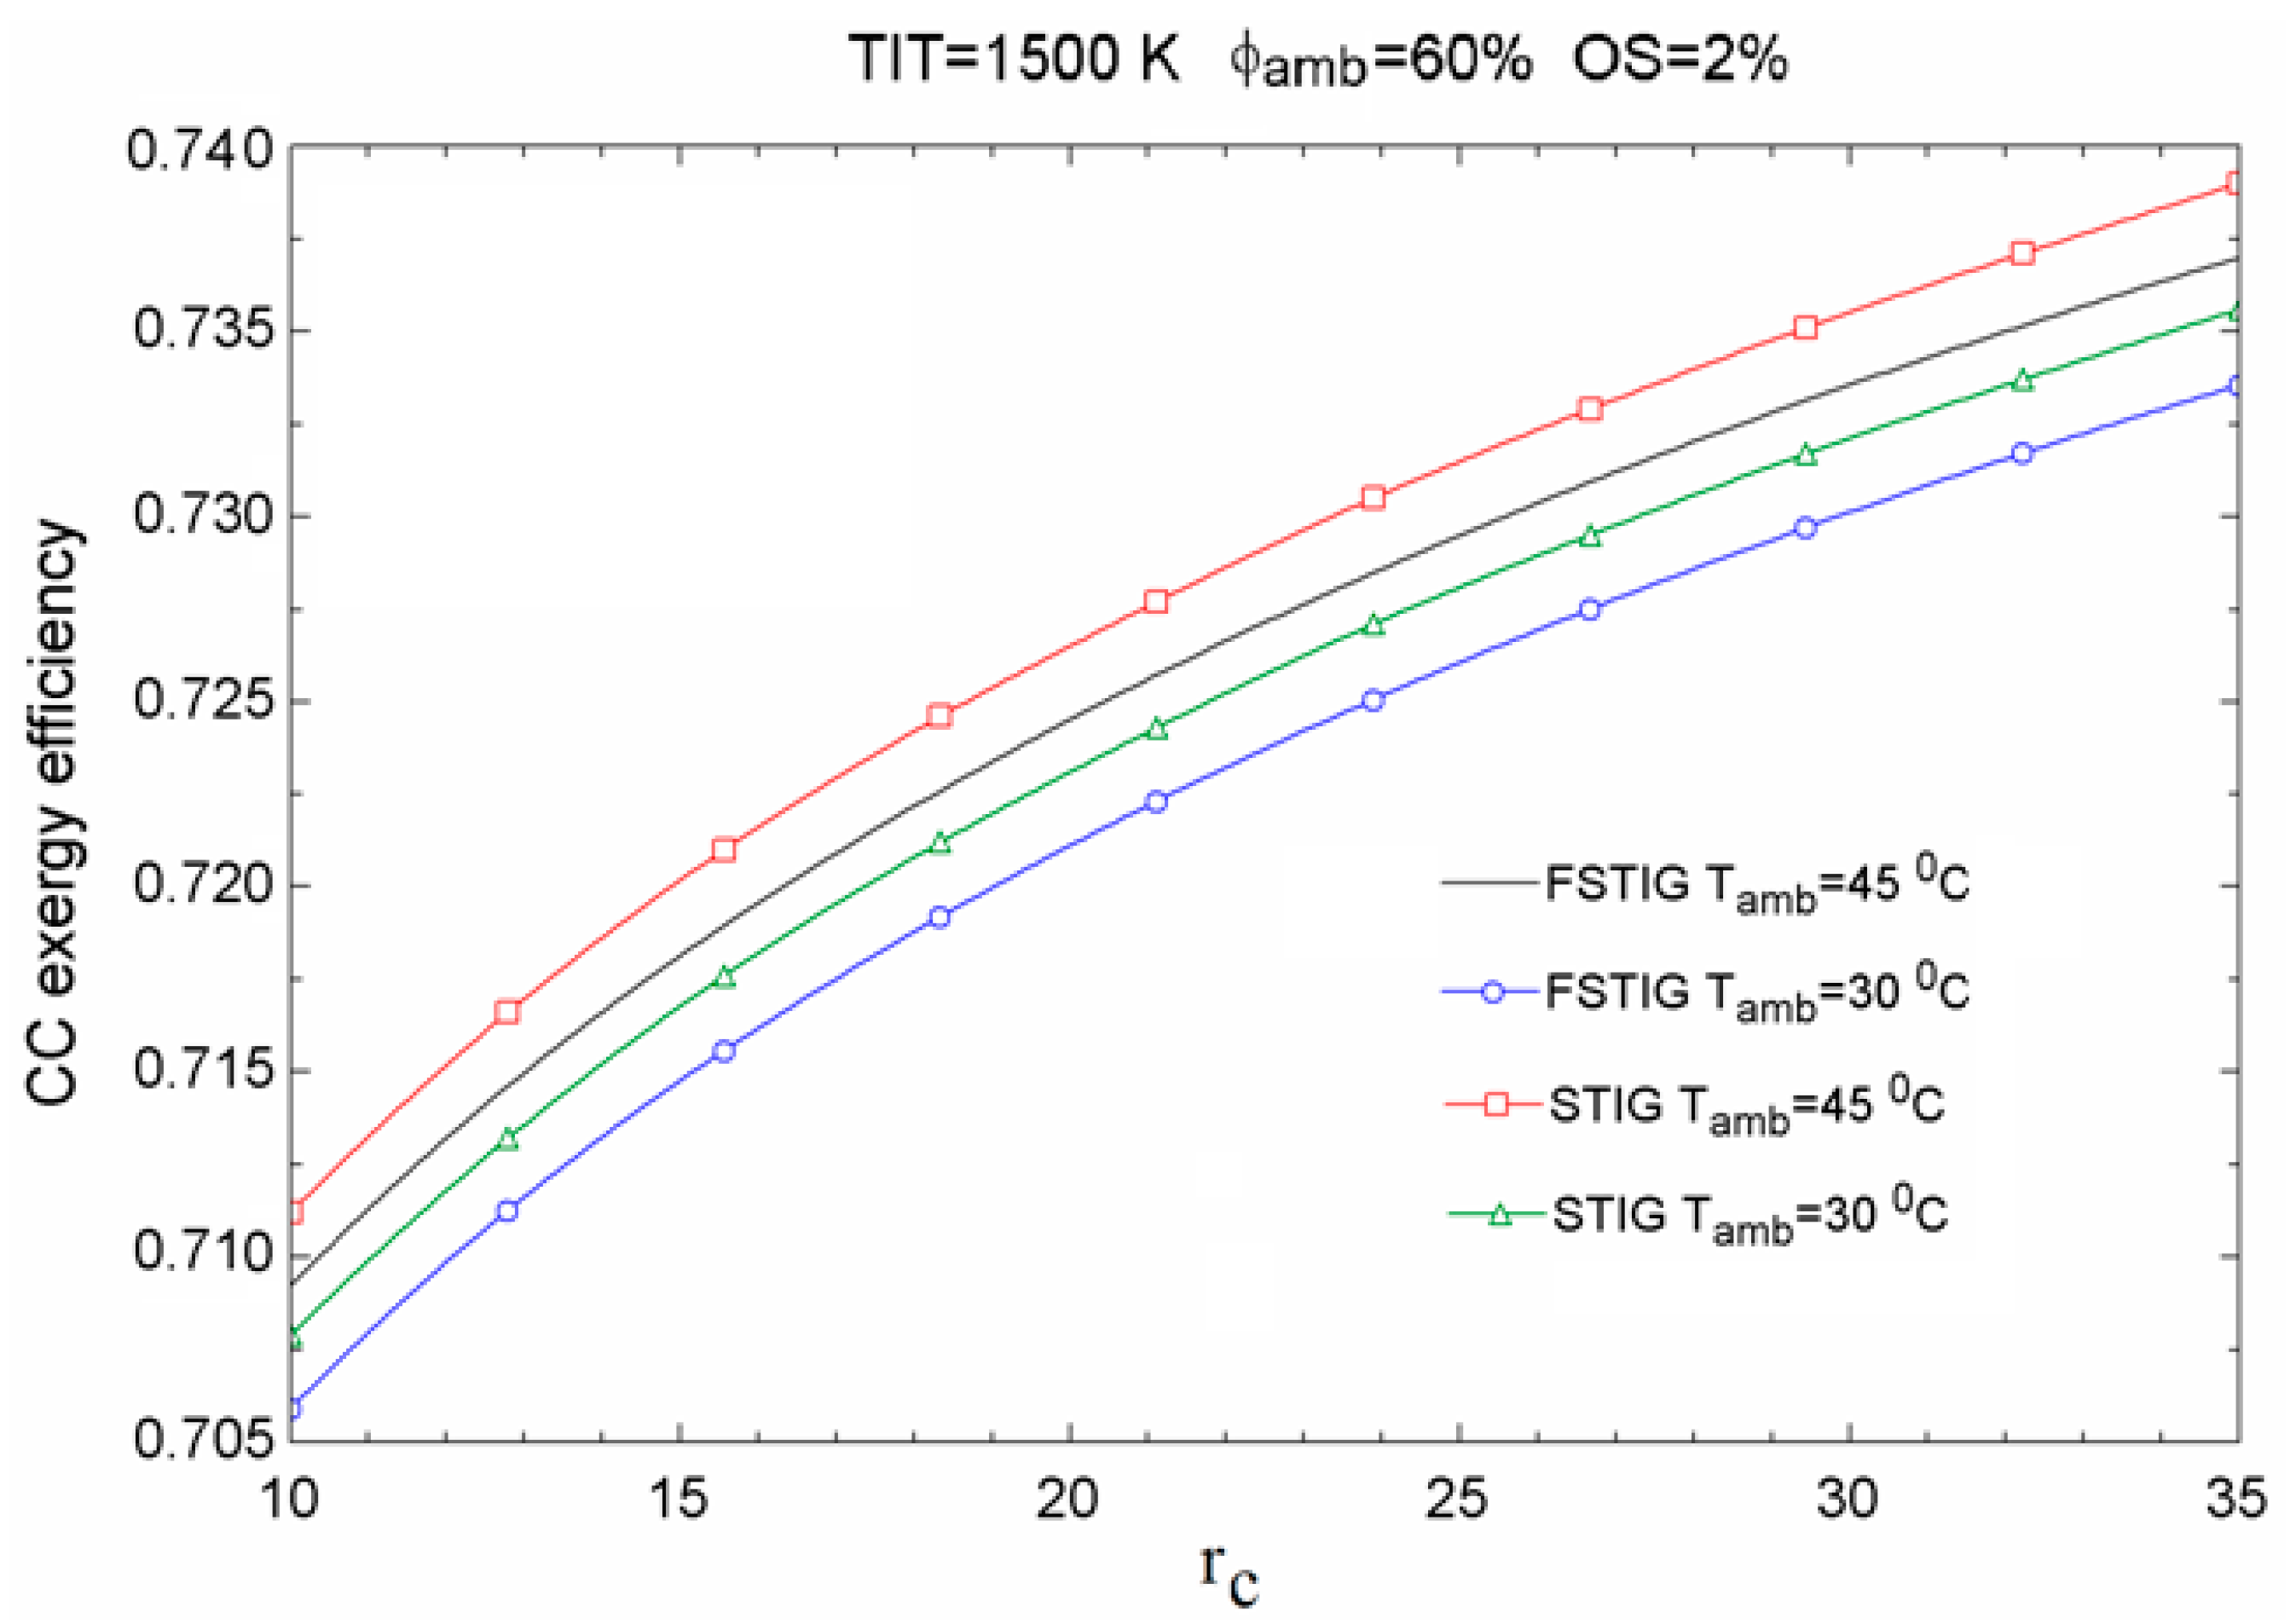
Increasing the compressor pressure ratio in the cycle with steam injection, whether or not fog cooling is applied, increases the exergy efficiency of the combustor. In all cycles, increases in the exergy efficiency of the combustor are observed when ambient temperature rises.
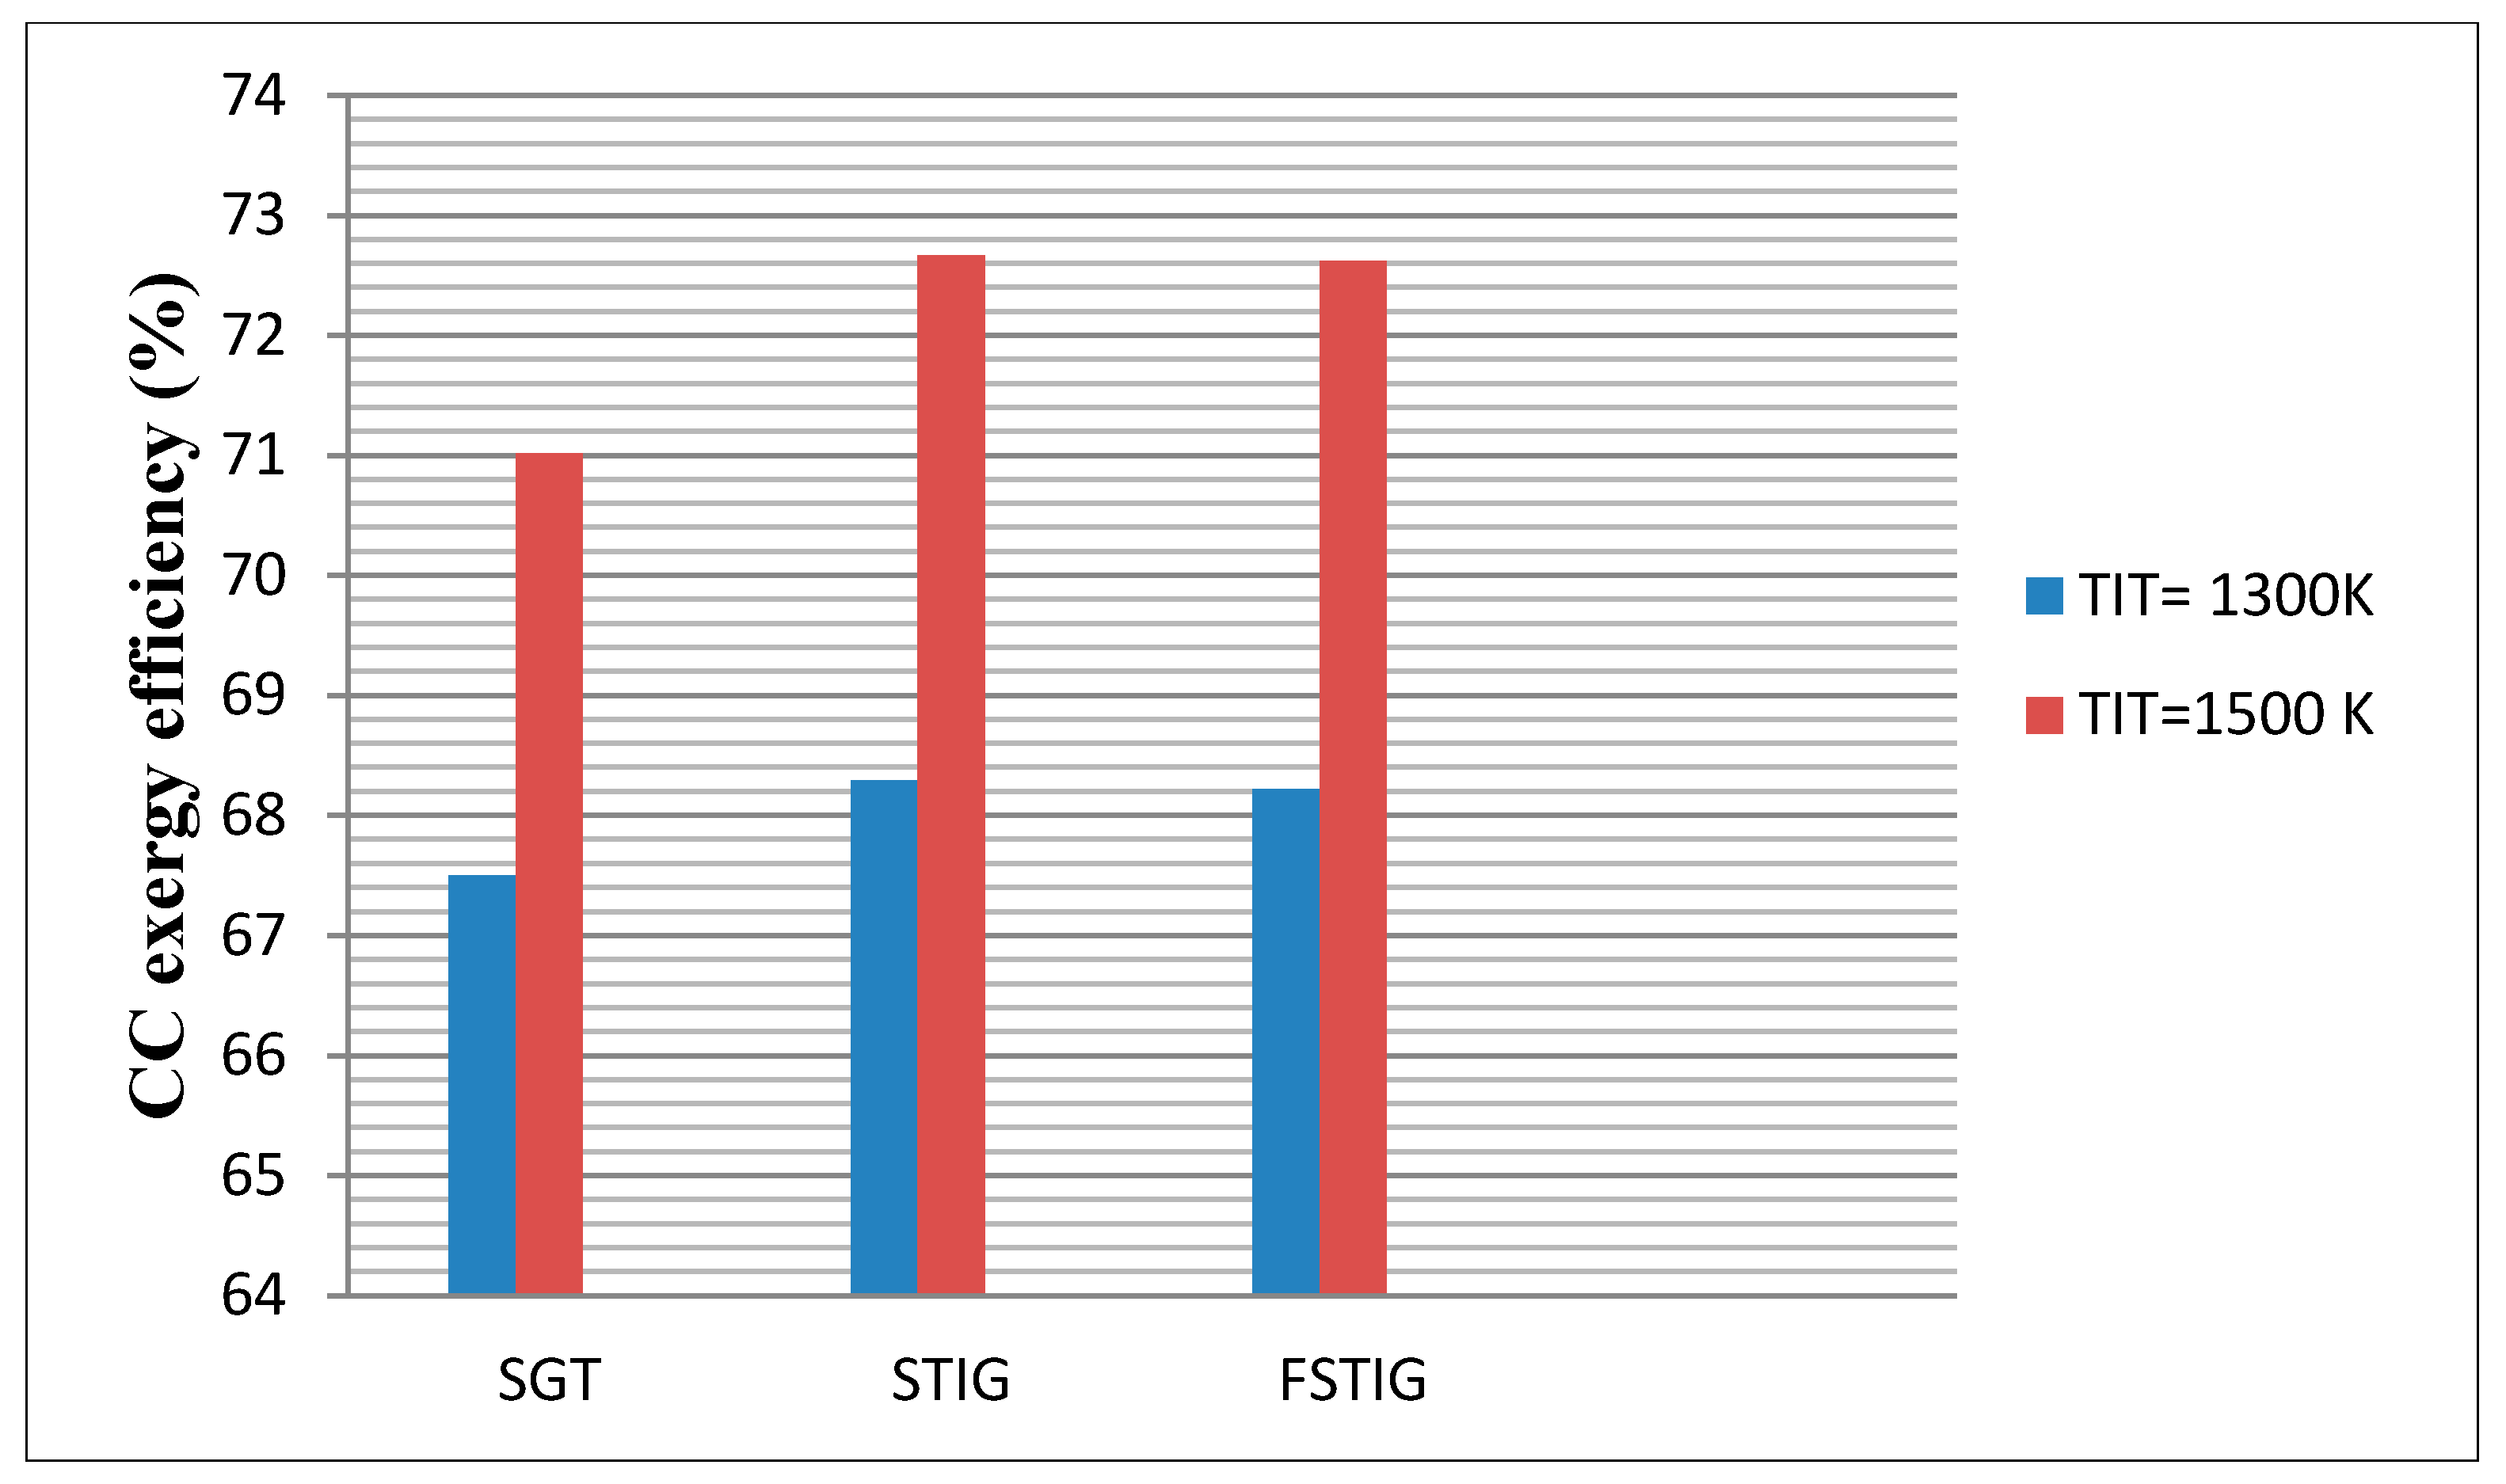
The combustor exergy efficiency is highest for the steam injection plant, next highest for the fogging steam injection plant, and lowest for the simple gas turbine.
The energy and exergy efficiencies respectively of the FSTIG plant are about 0.5% and 0.4% higher than those of the STIG plant, and 14% and 13% higher than those of the SGT plant.
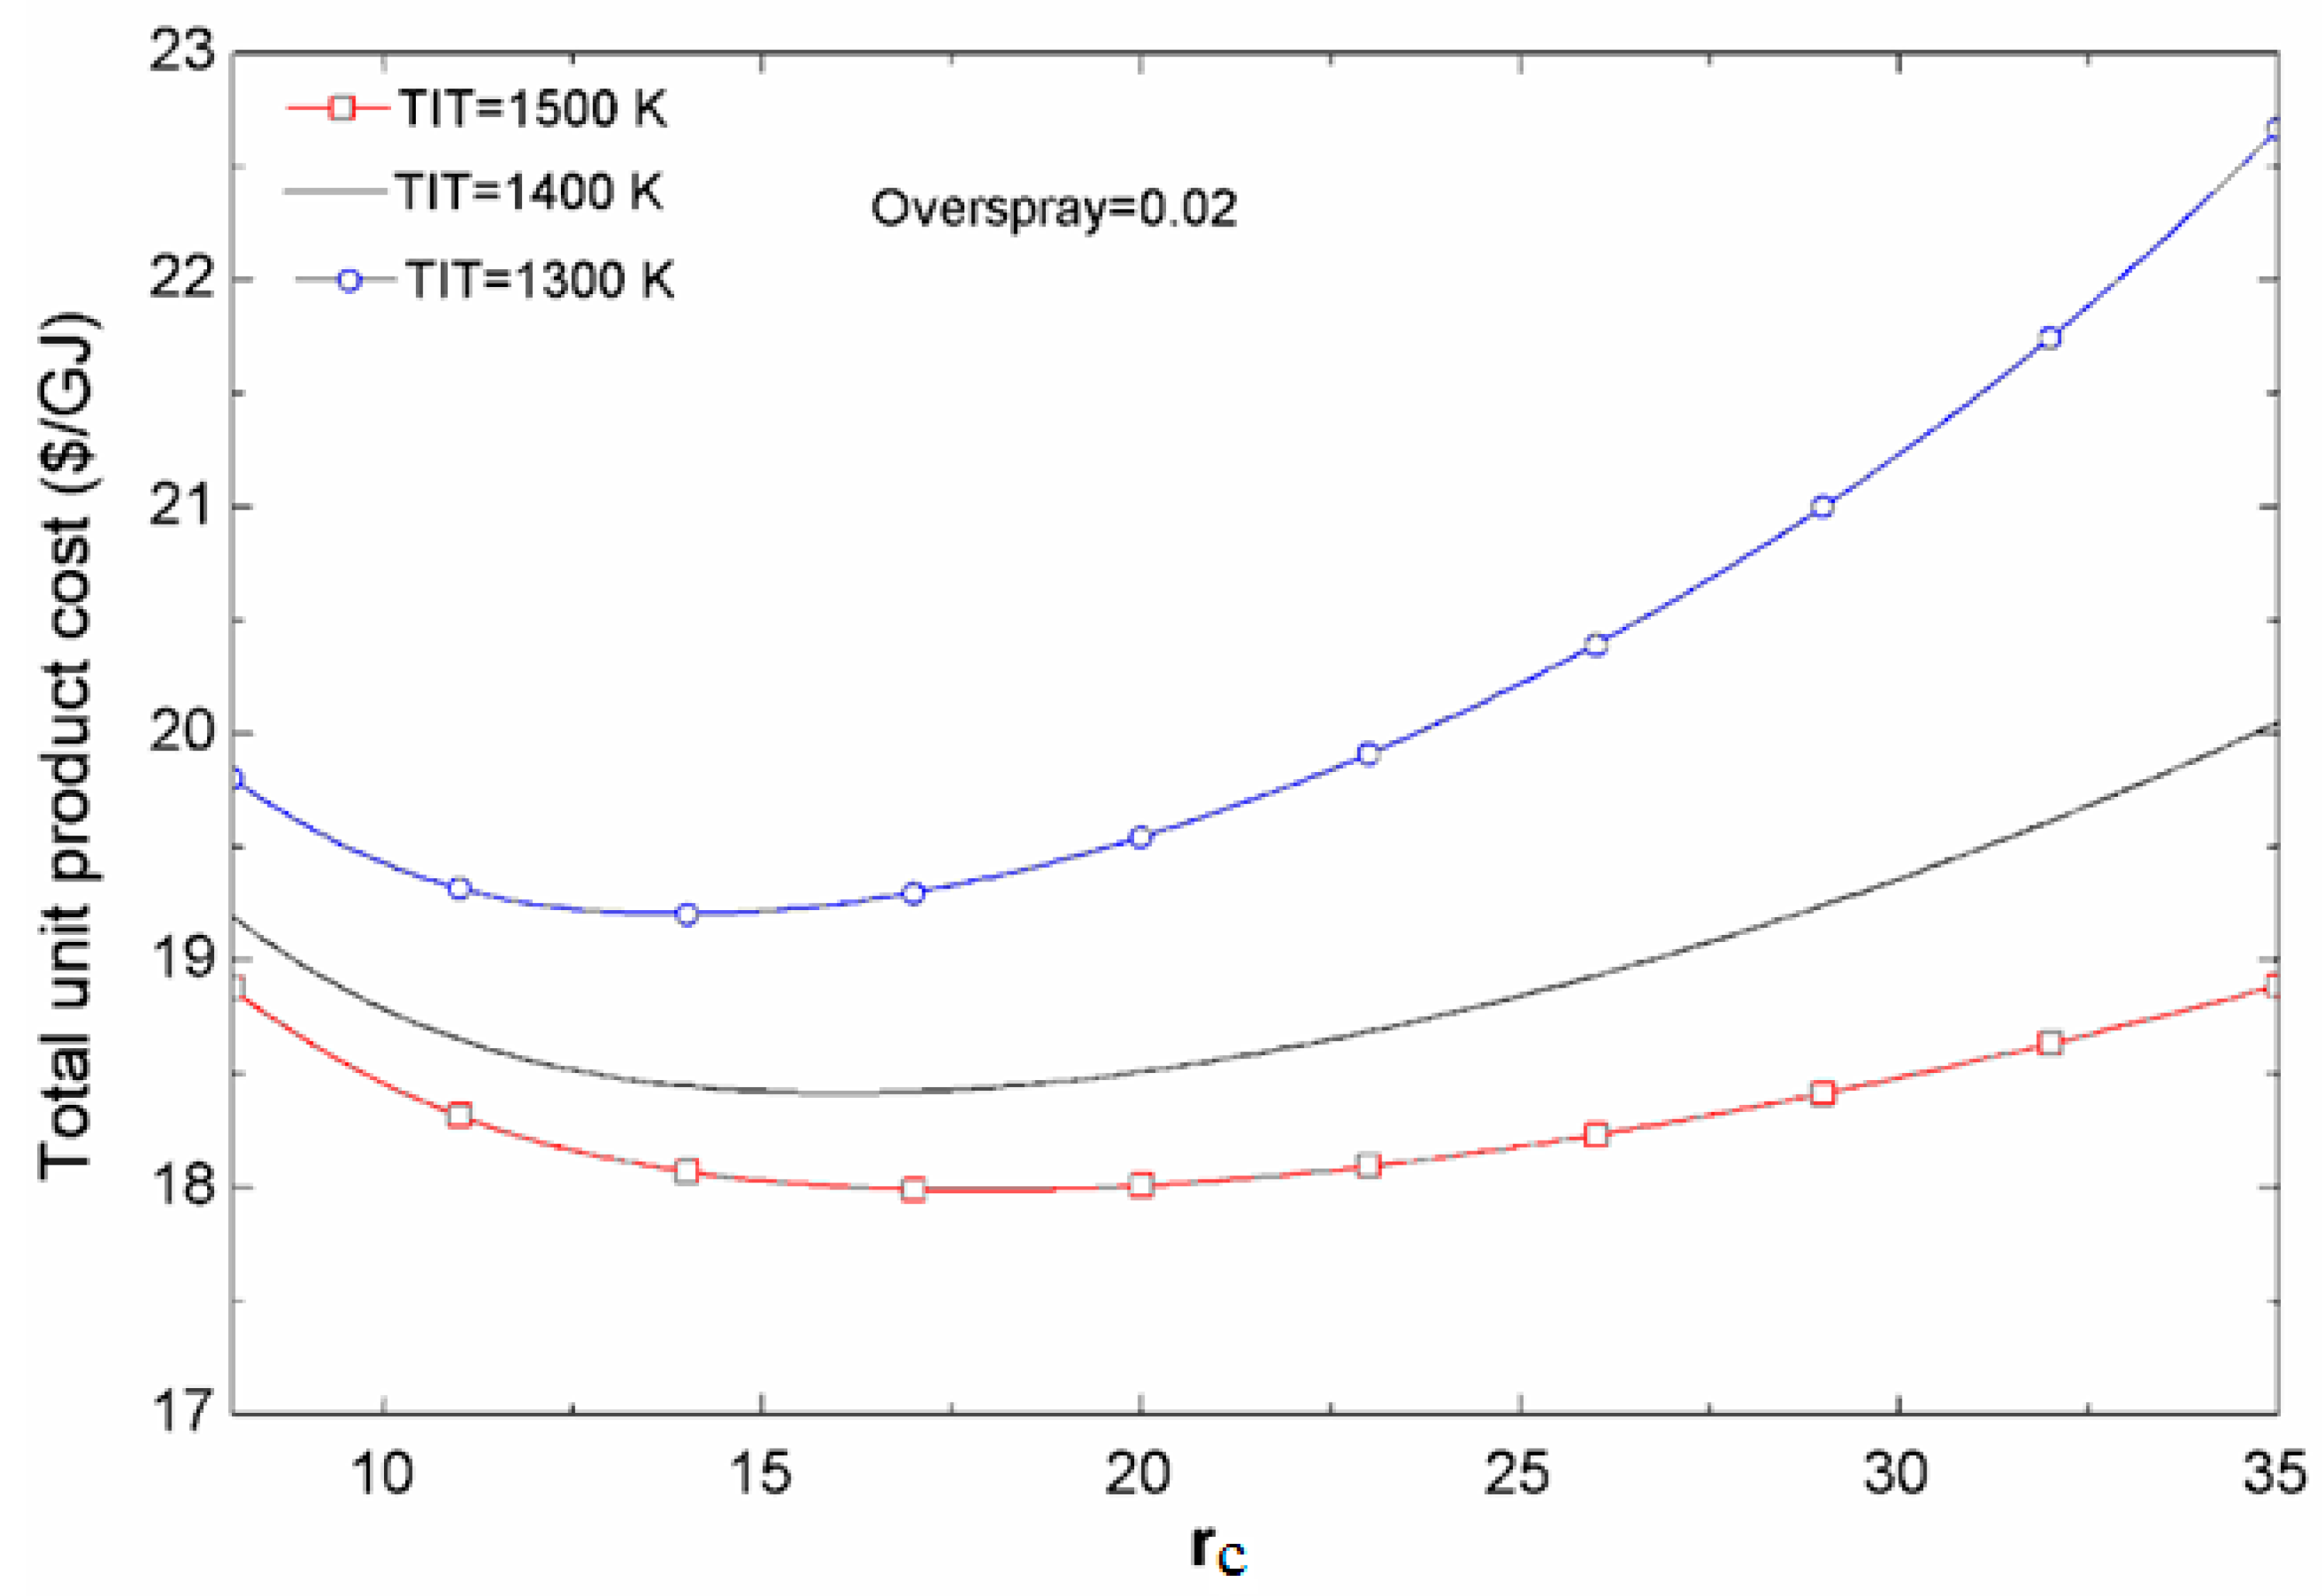
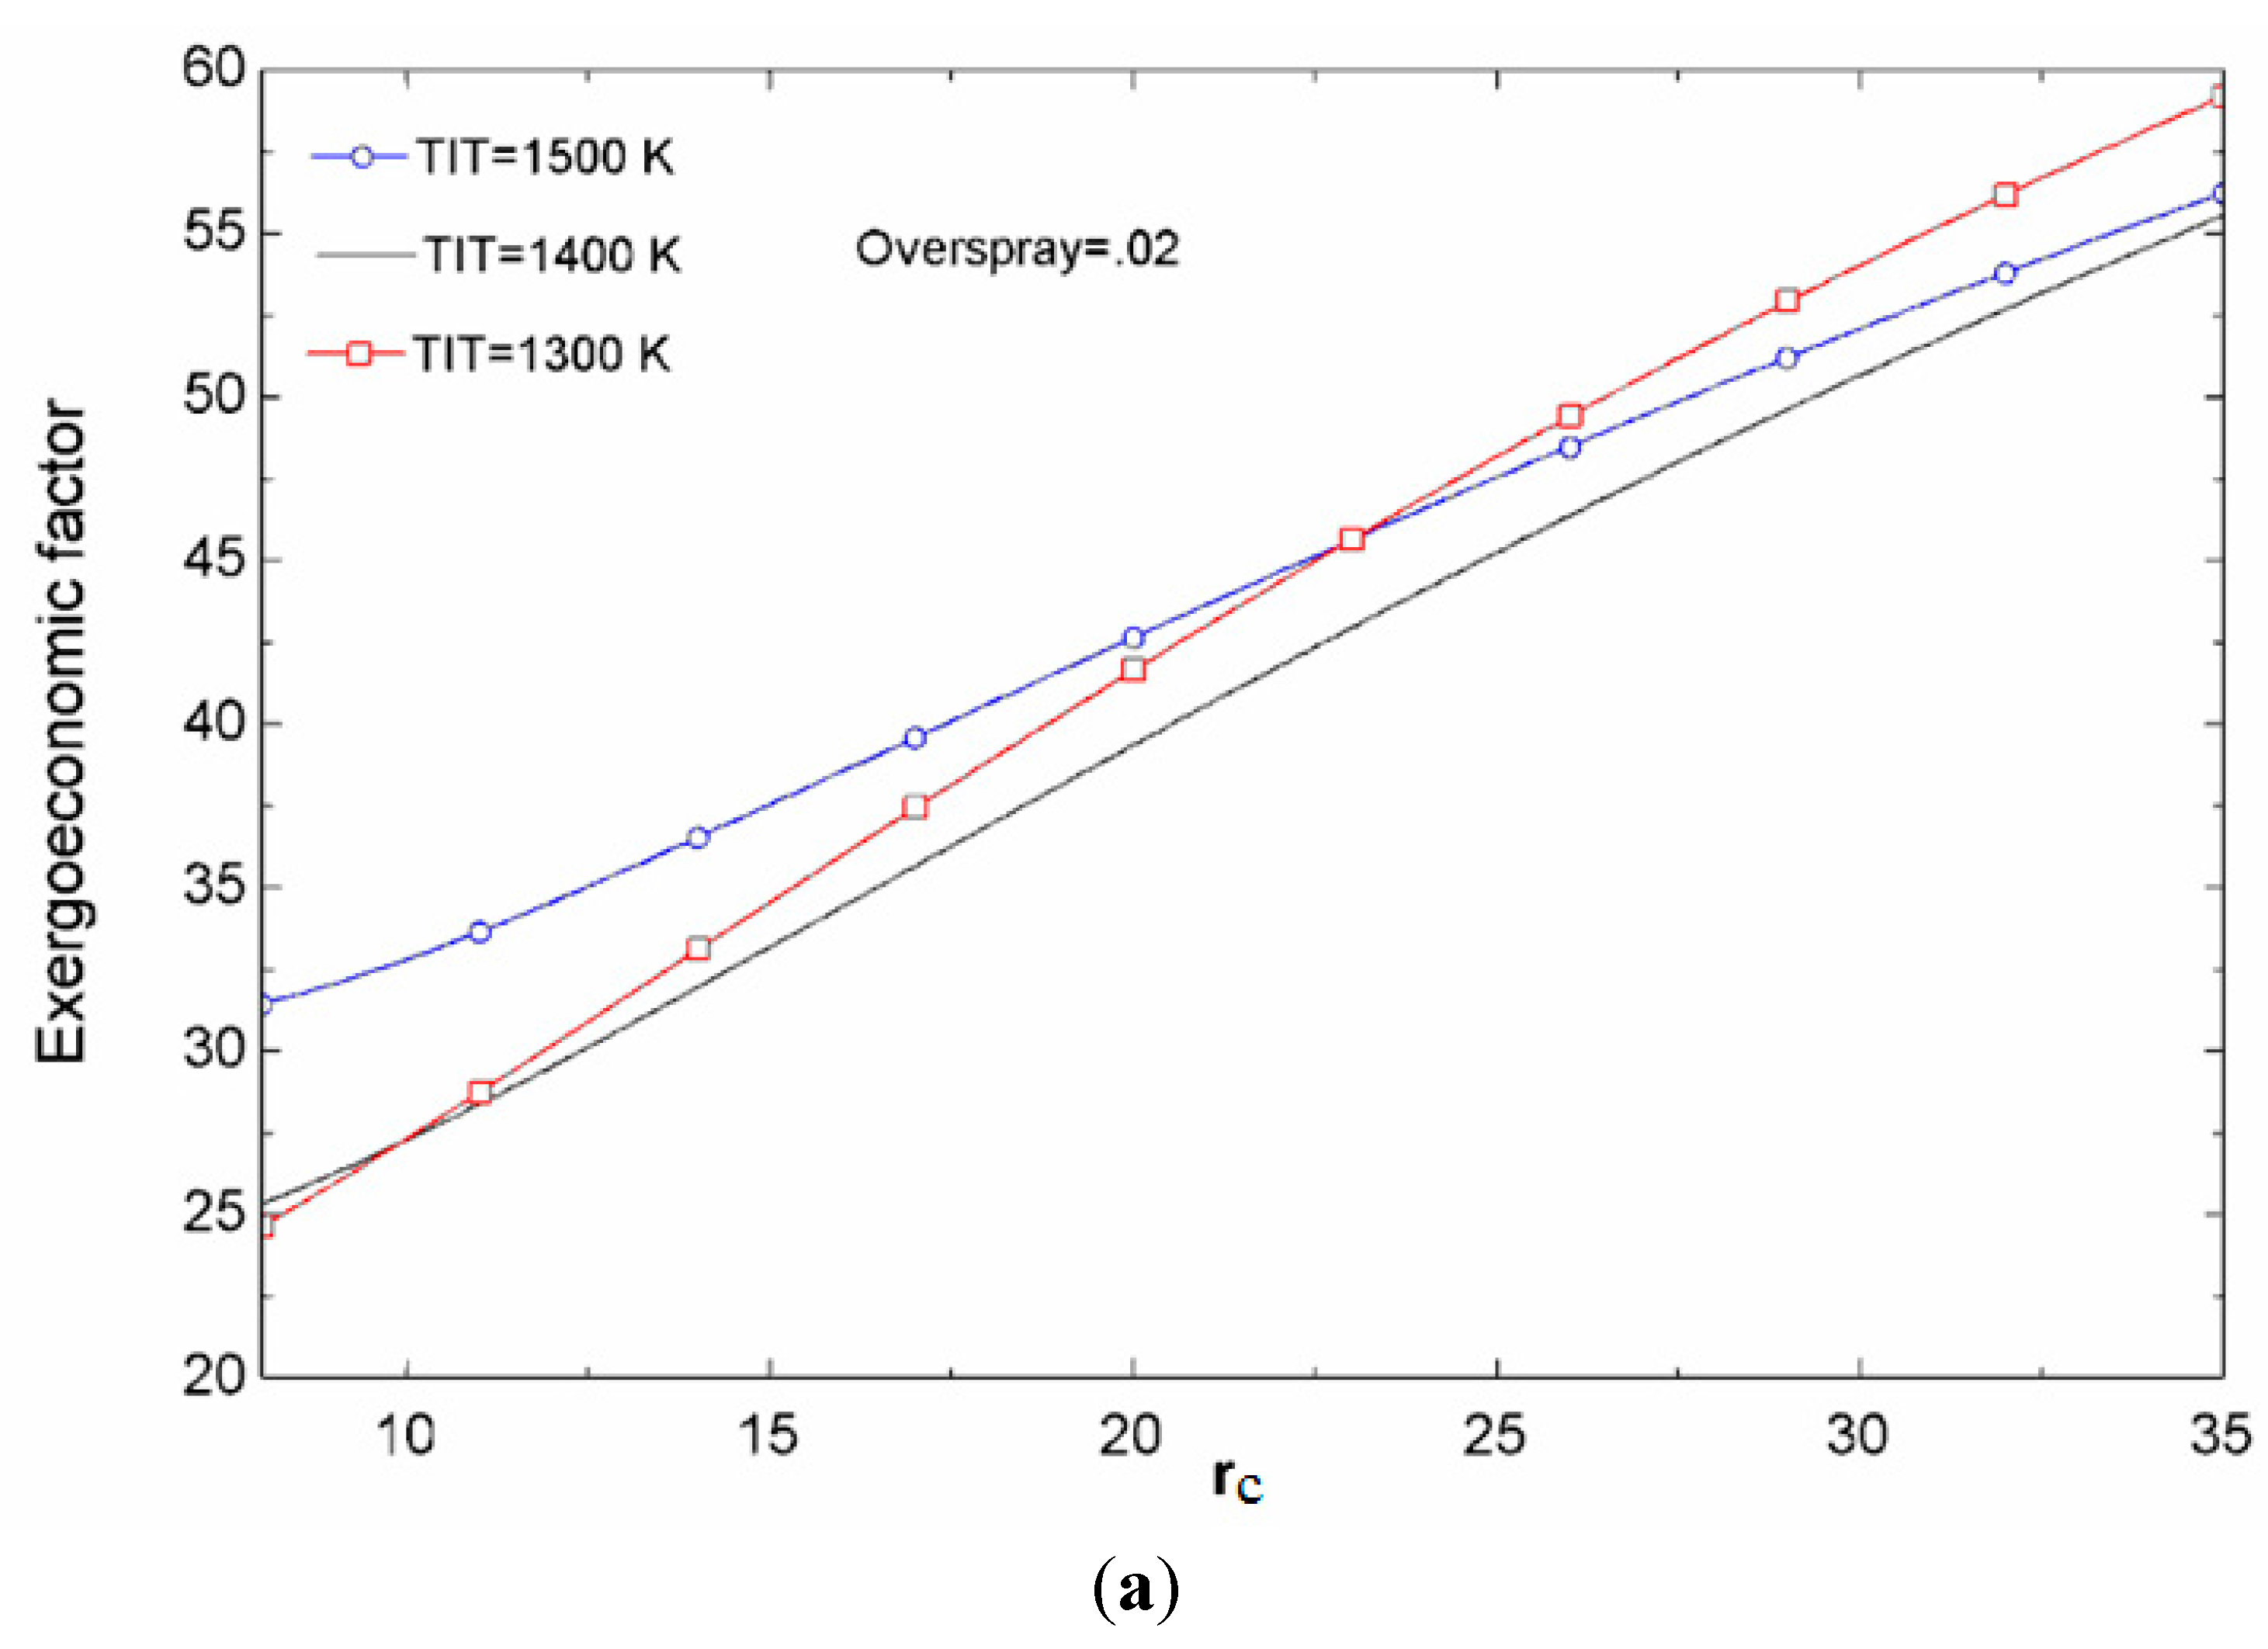
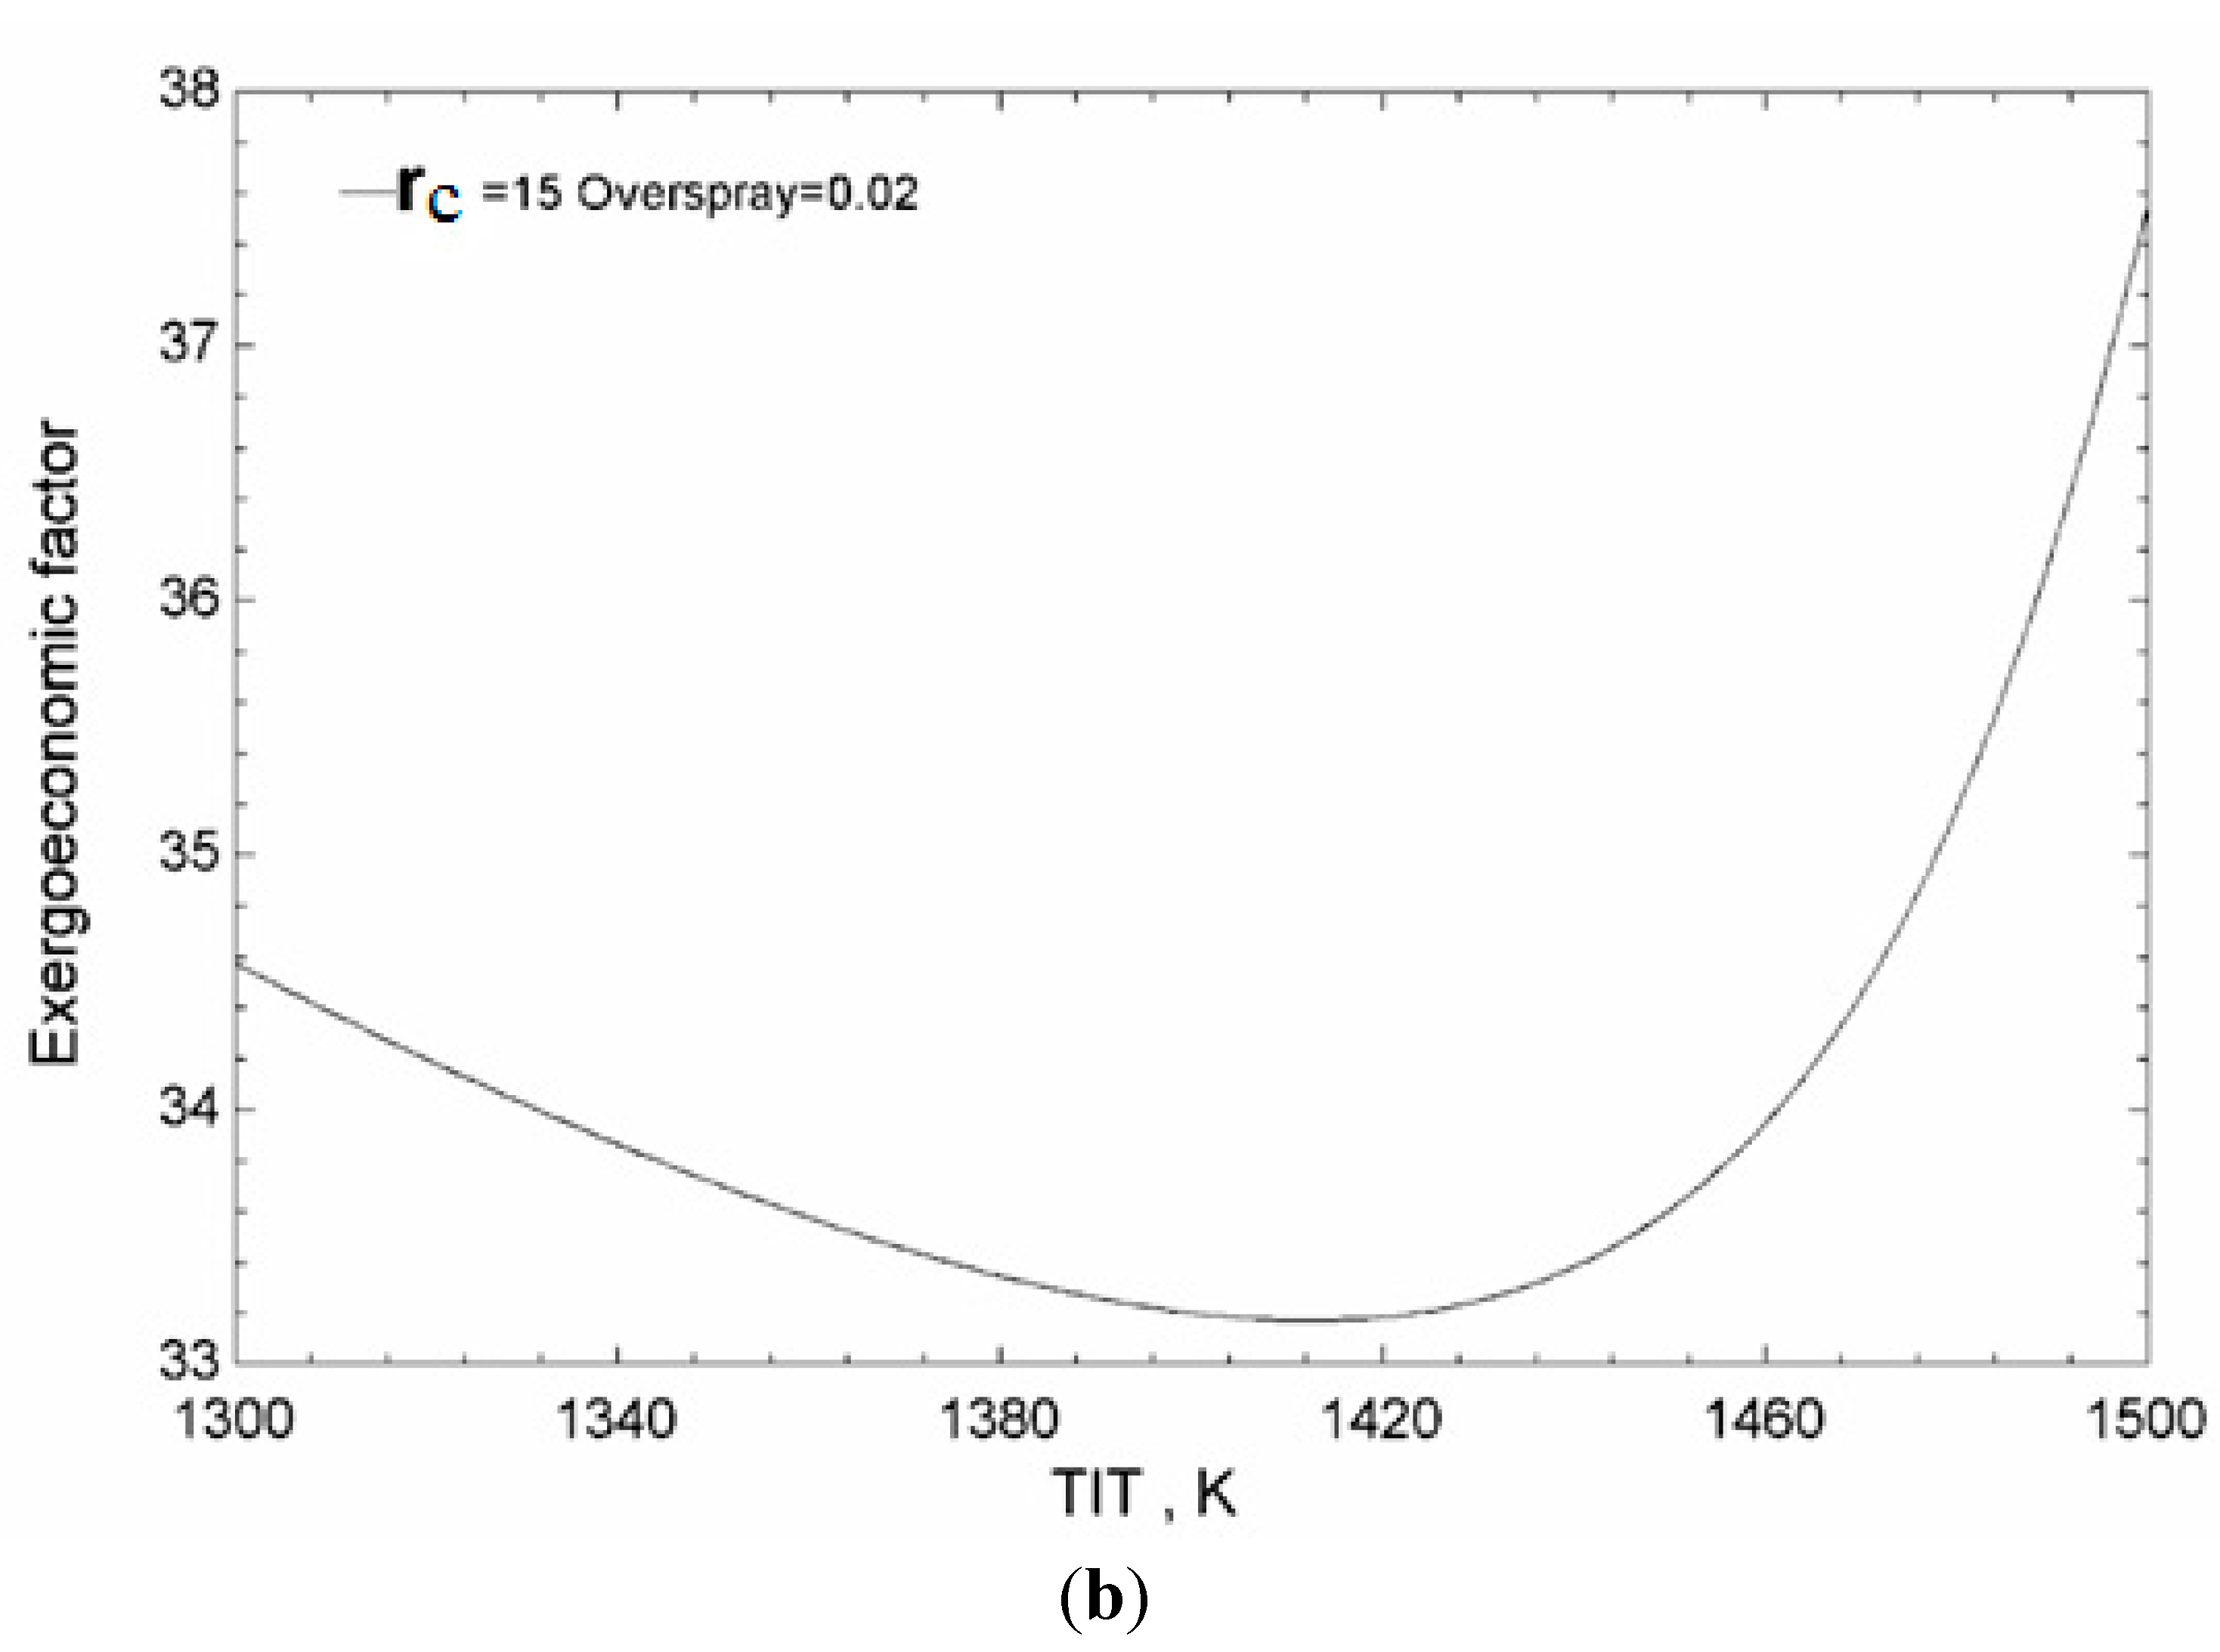
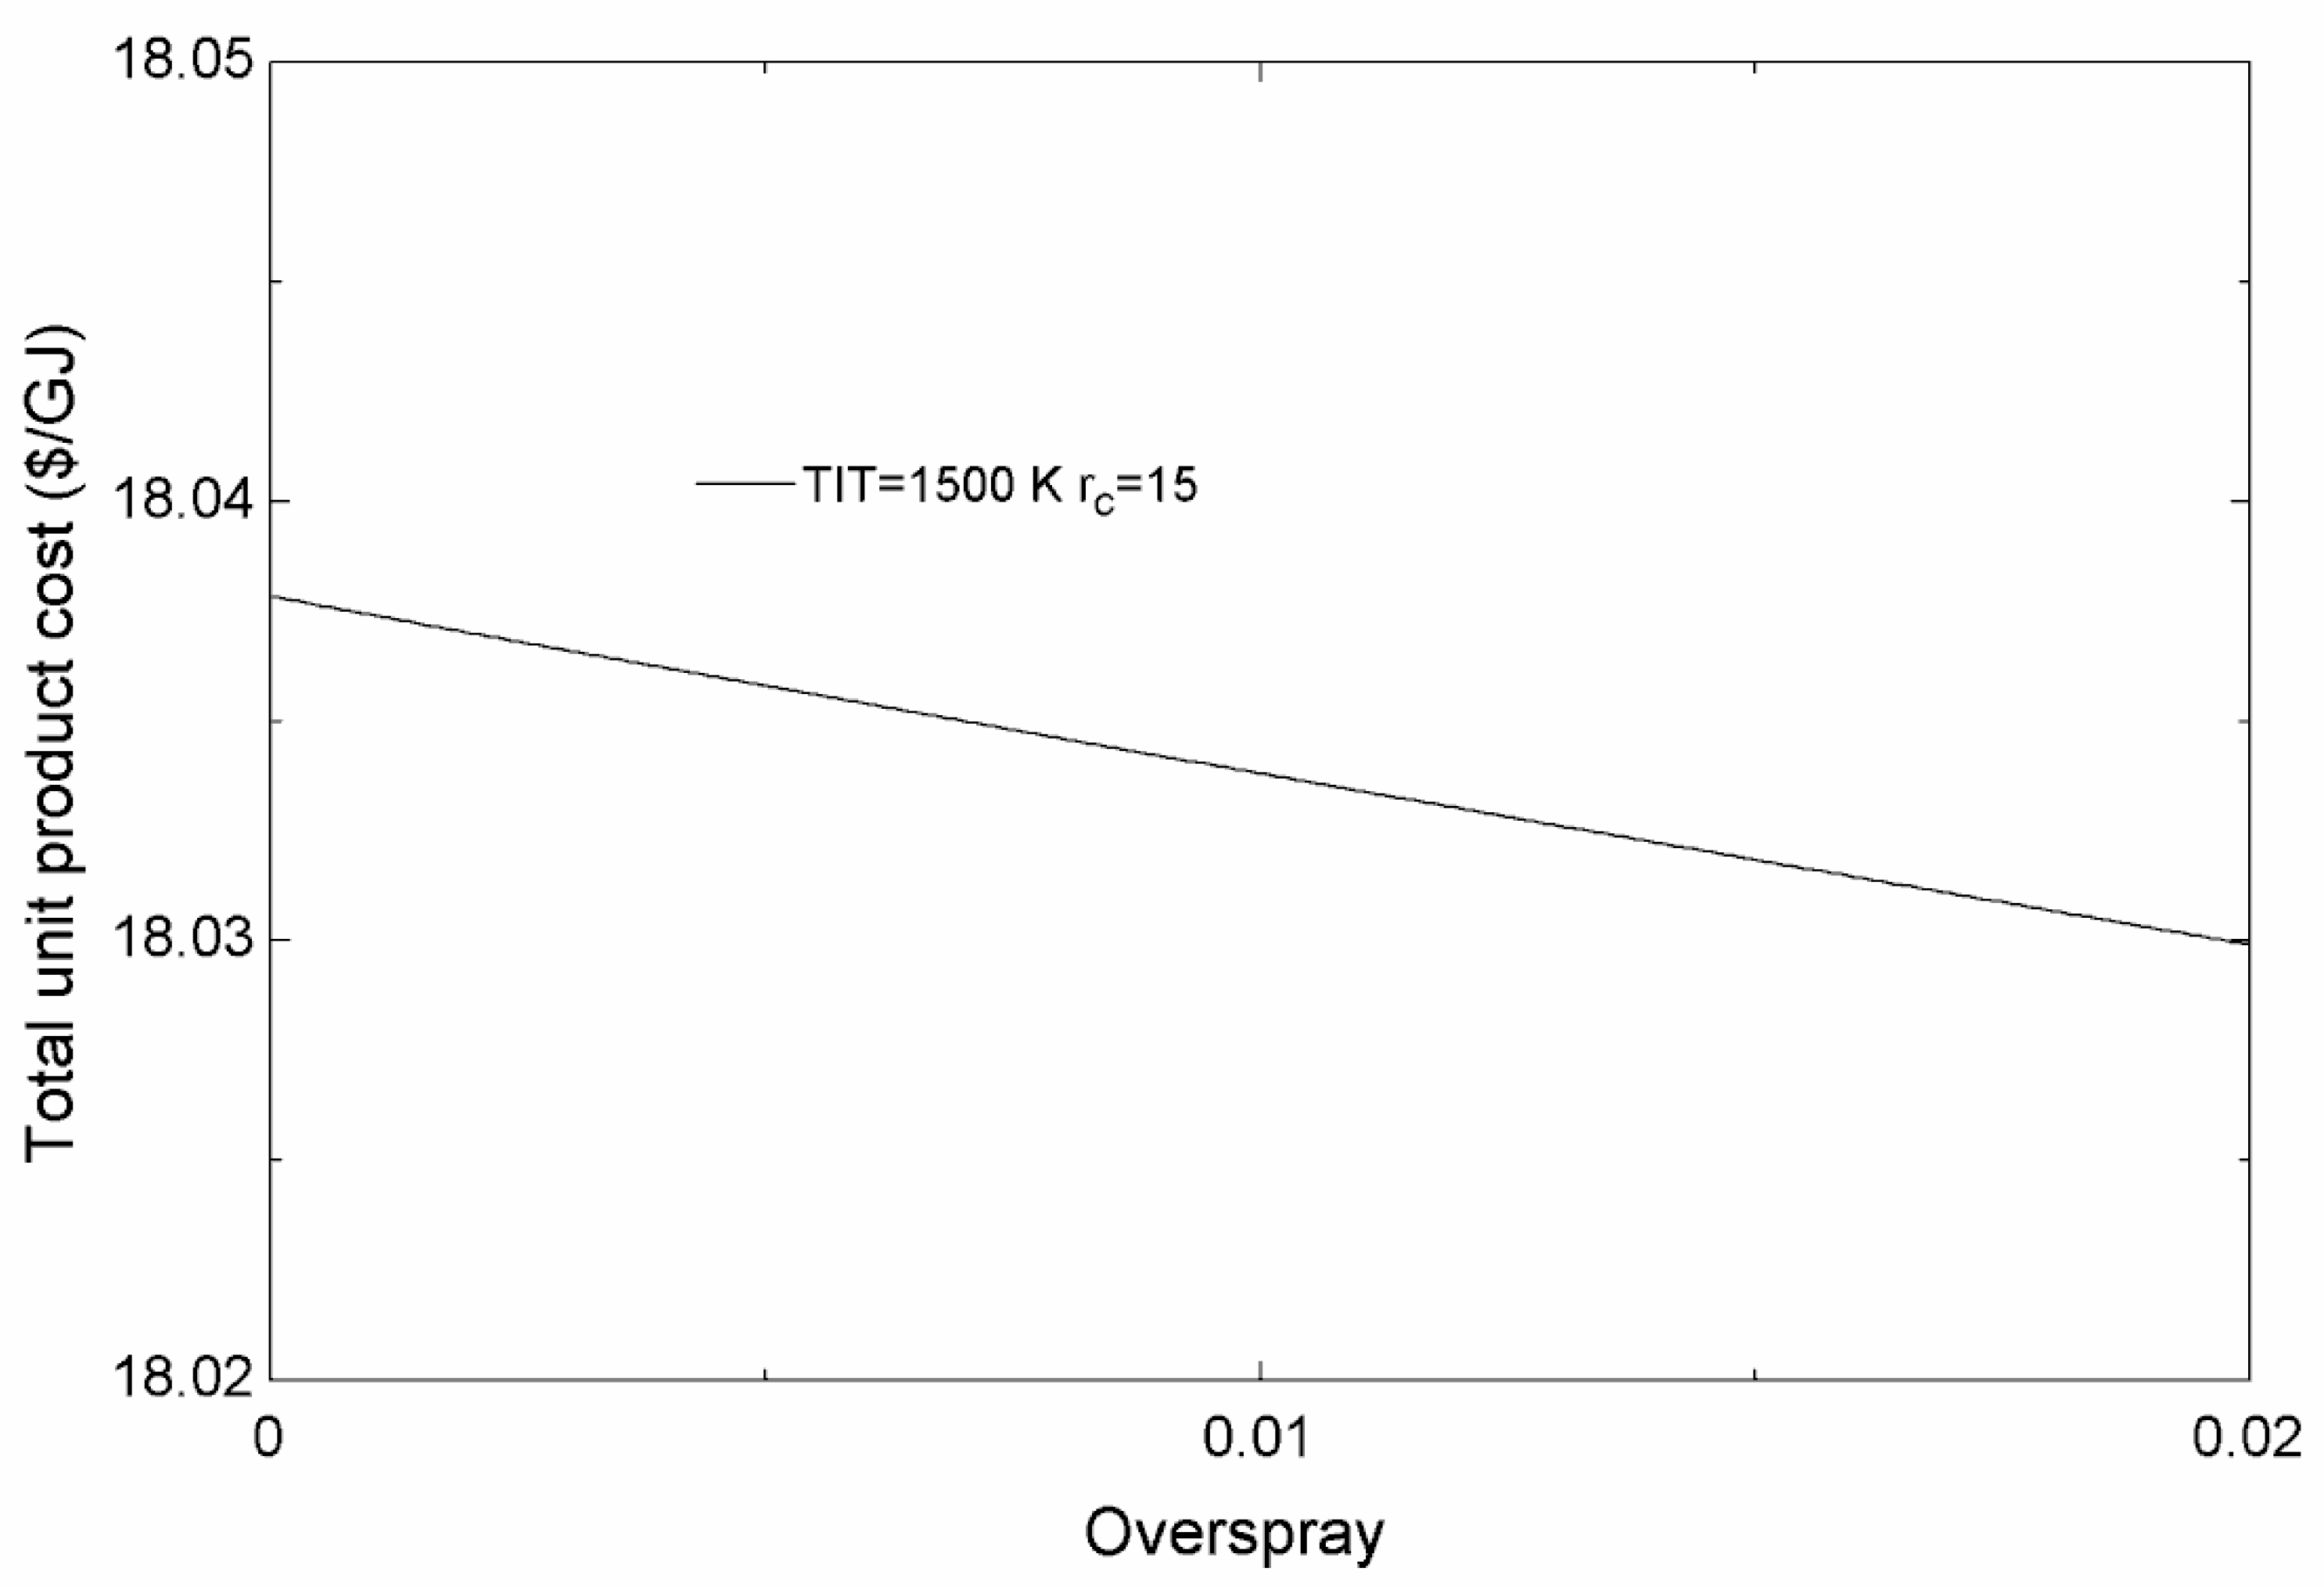
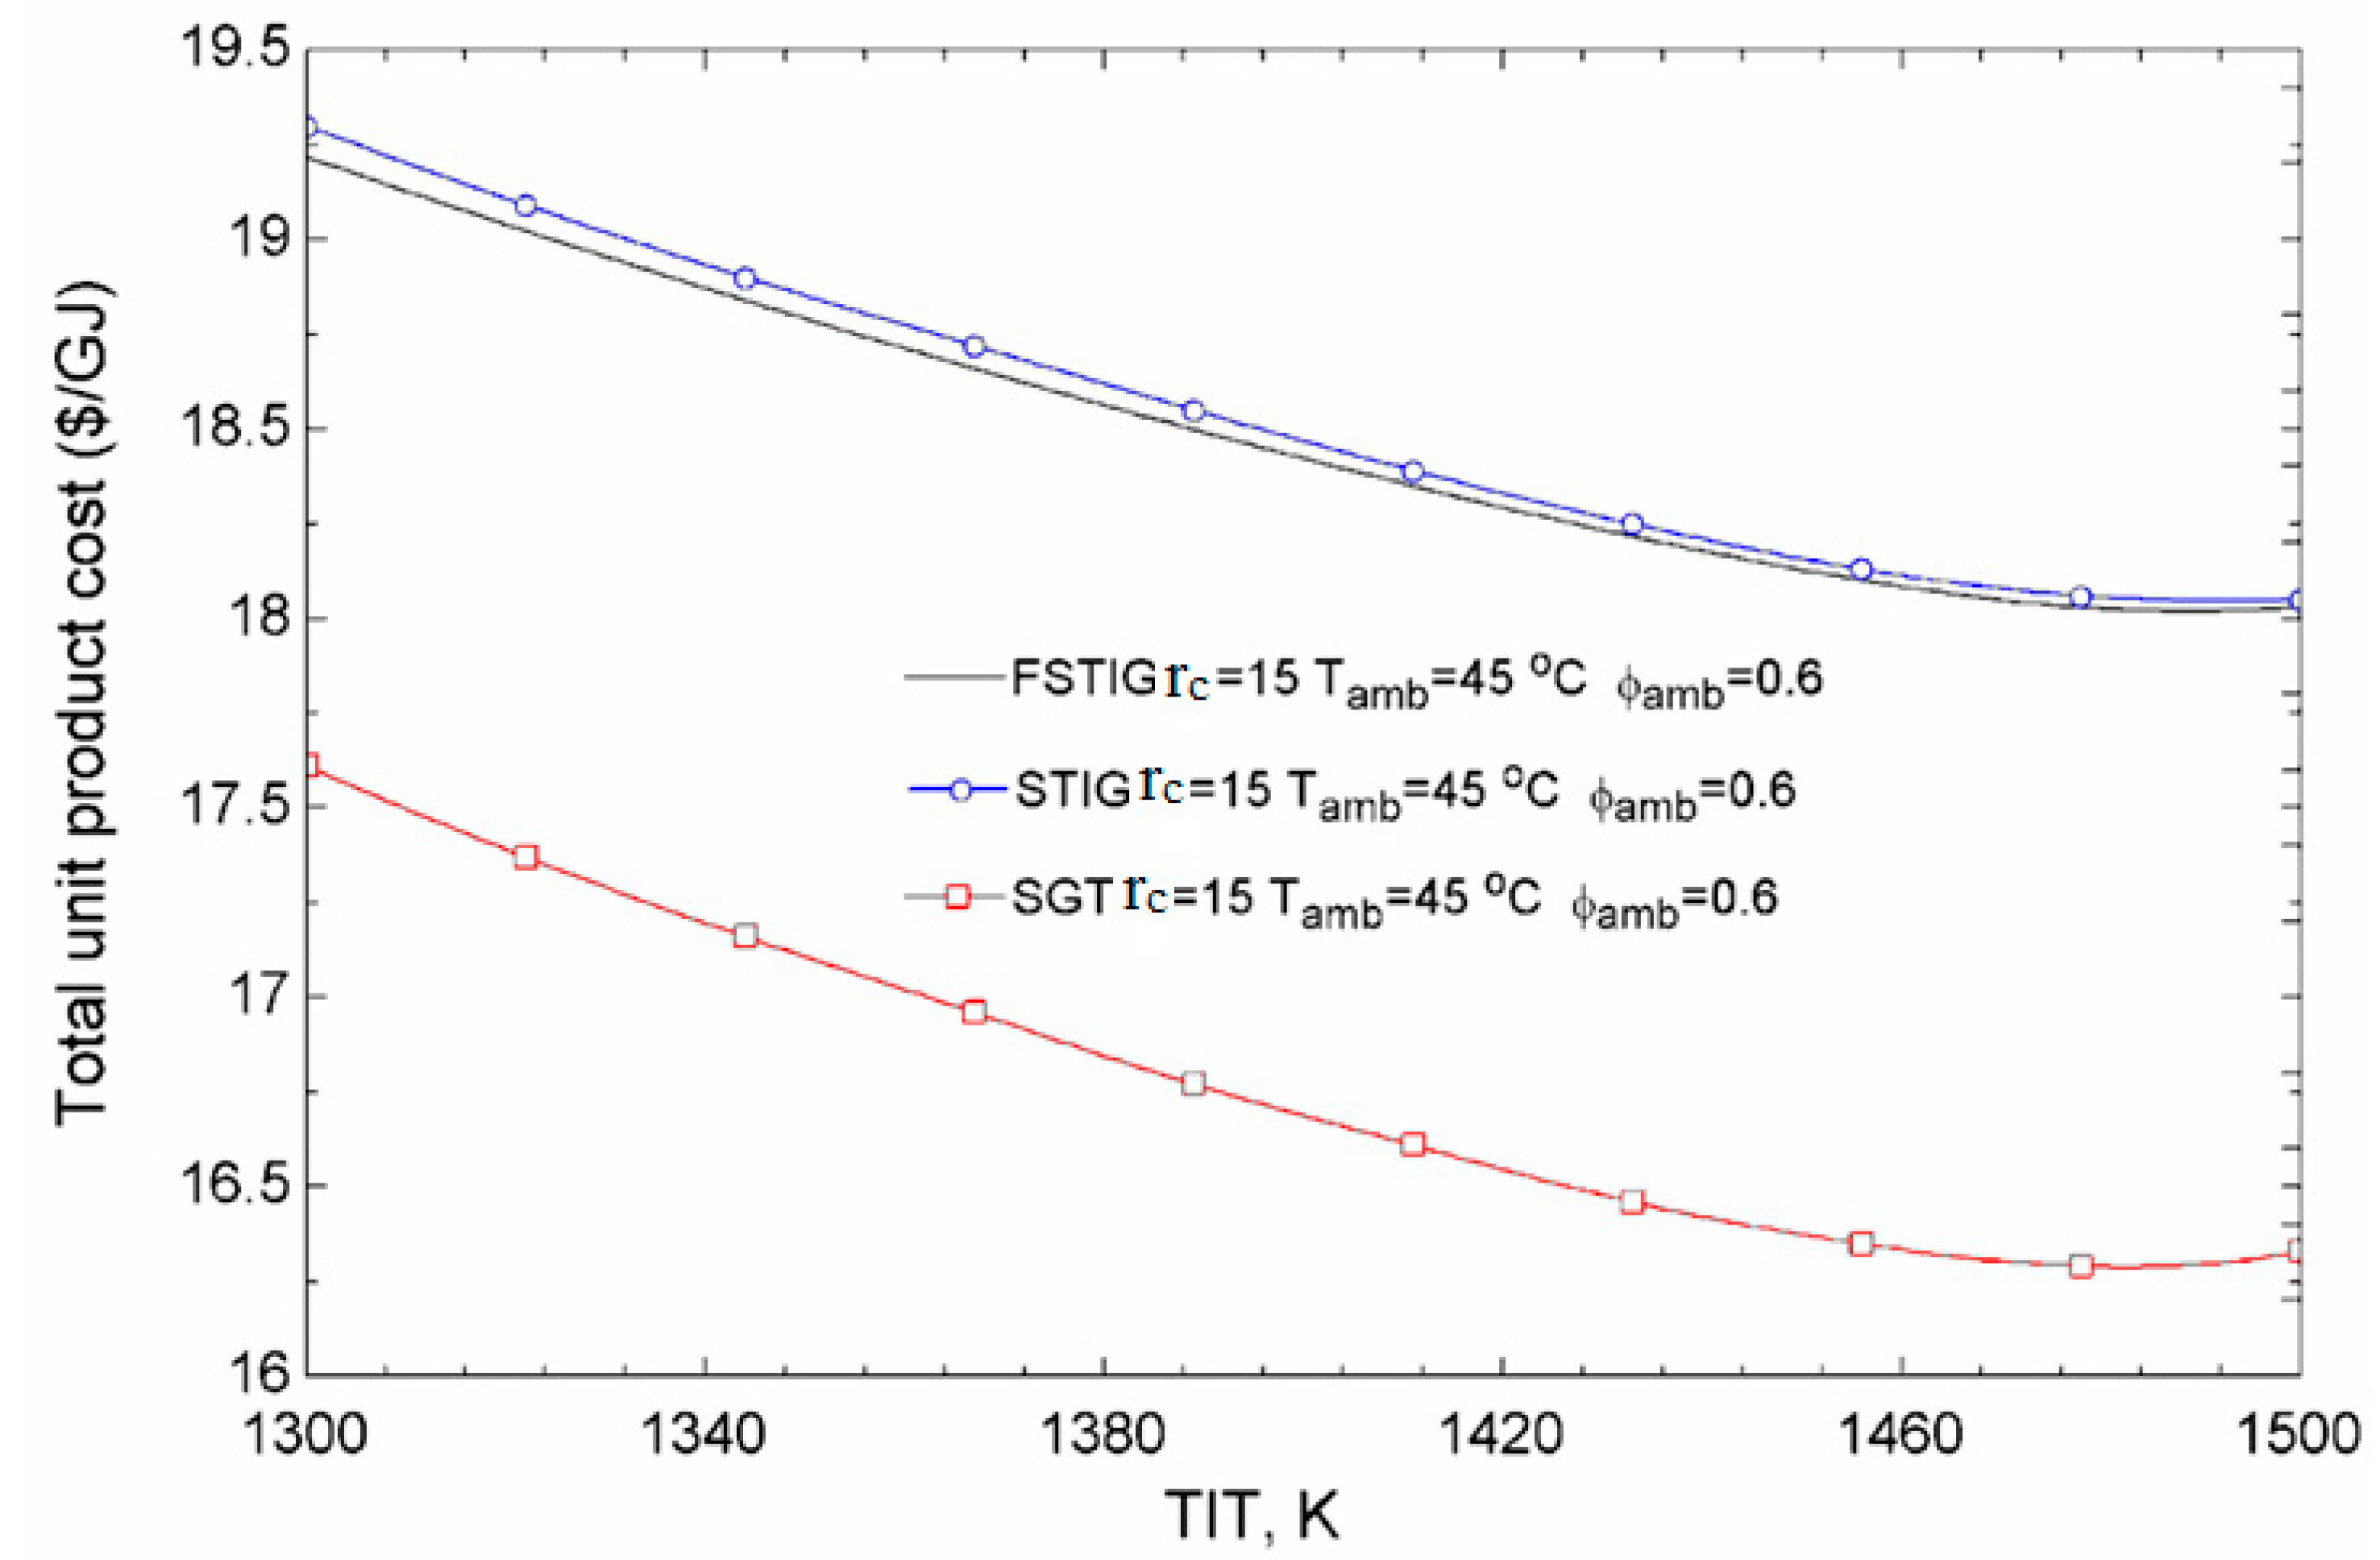
Increasing the gas turbine inlet temperature reduces the total unit product cost for the three configurations considered. For the FSTIG plant, however, as the TIT increases the exergoeconomic decreases to a point and then increases. The variation in total unit product cost in the FSTIG plant, due to the change in overspray, is almost negligible.
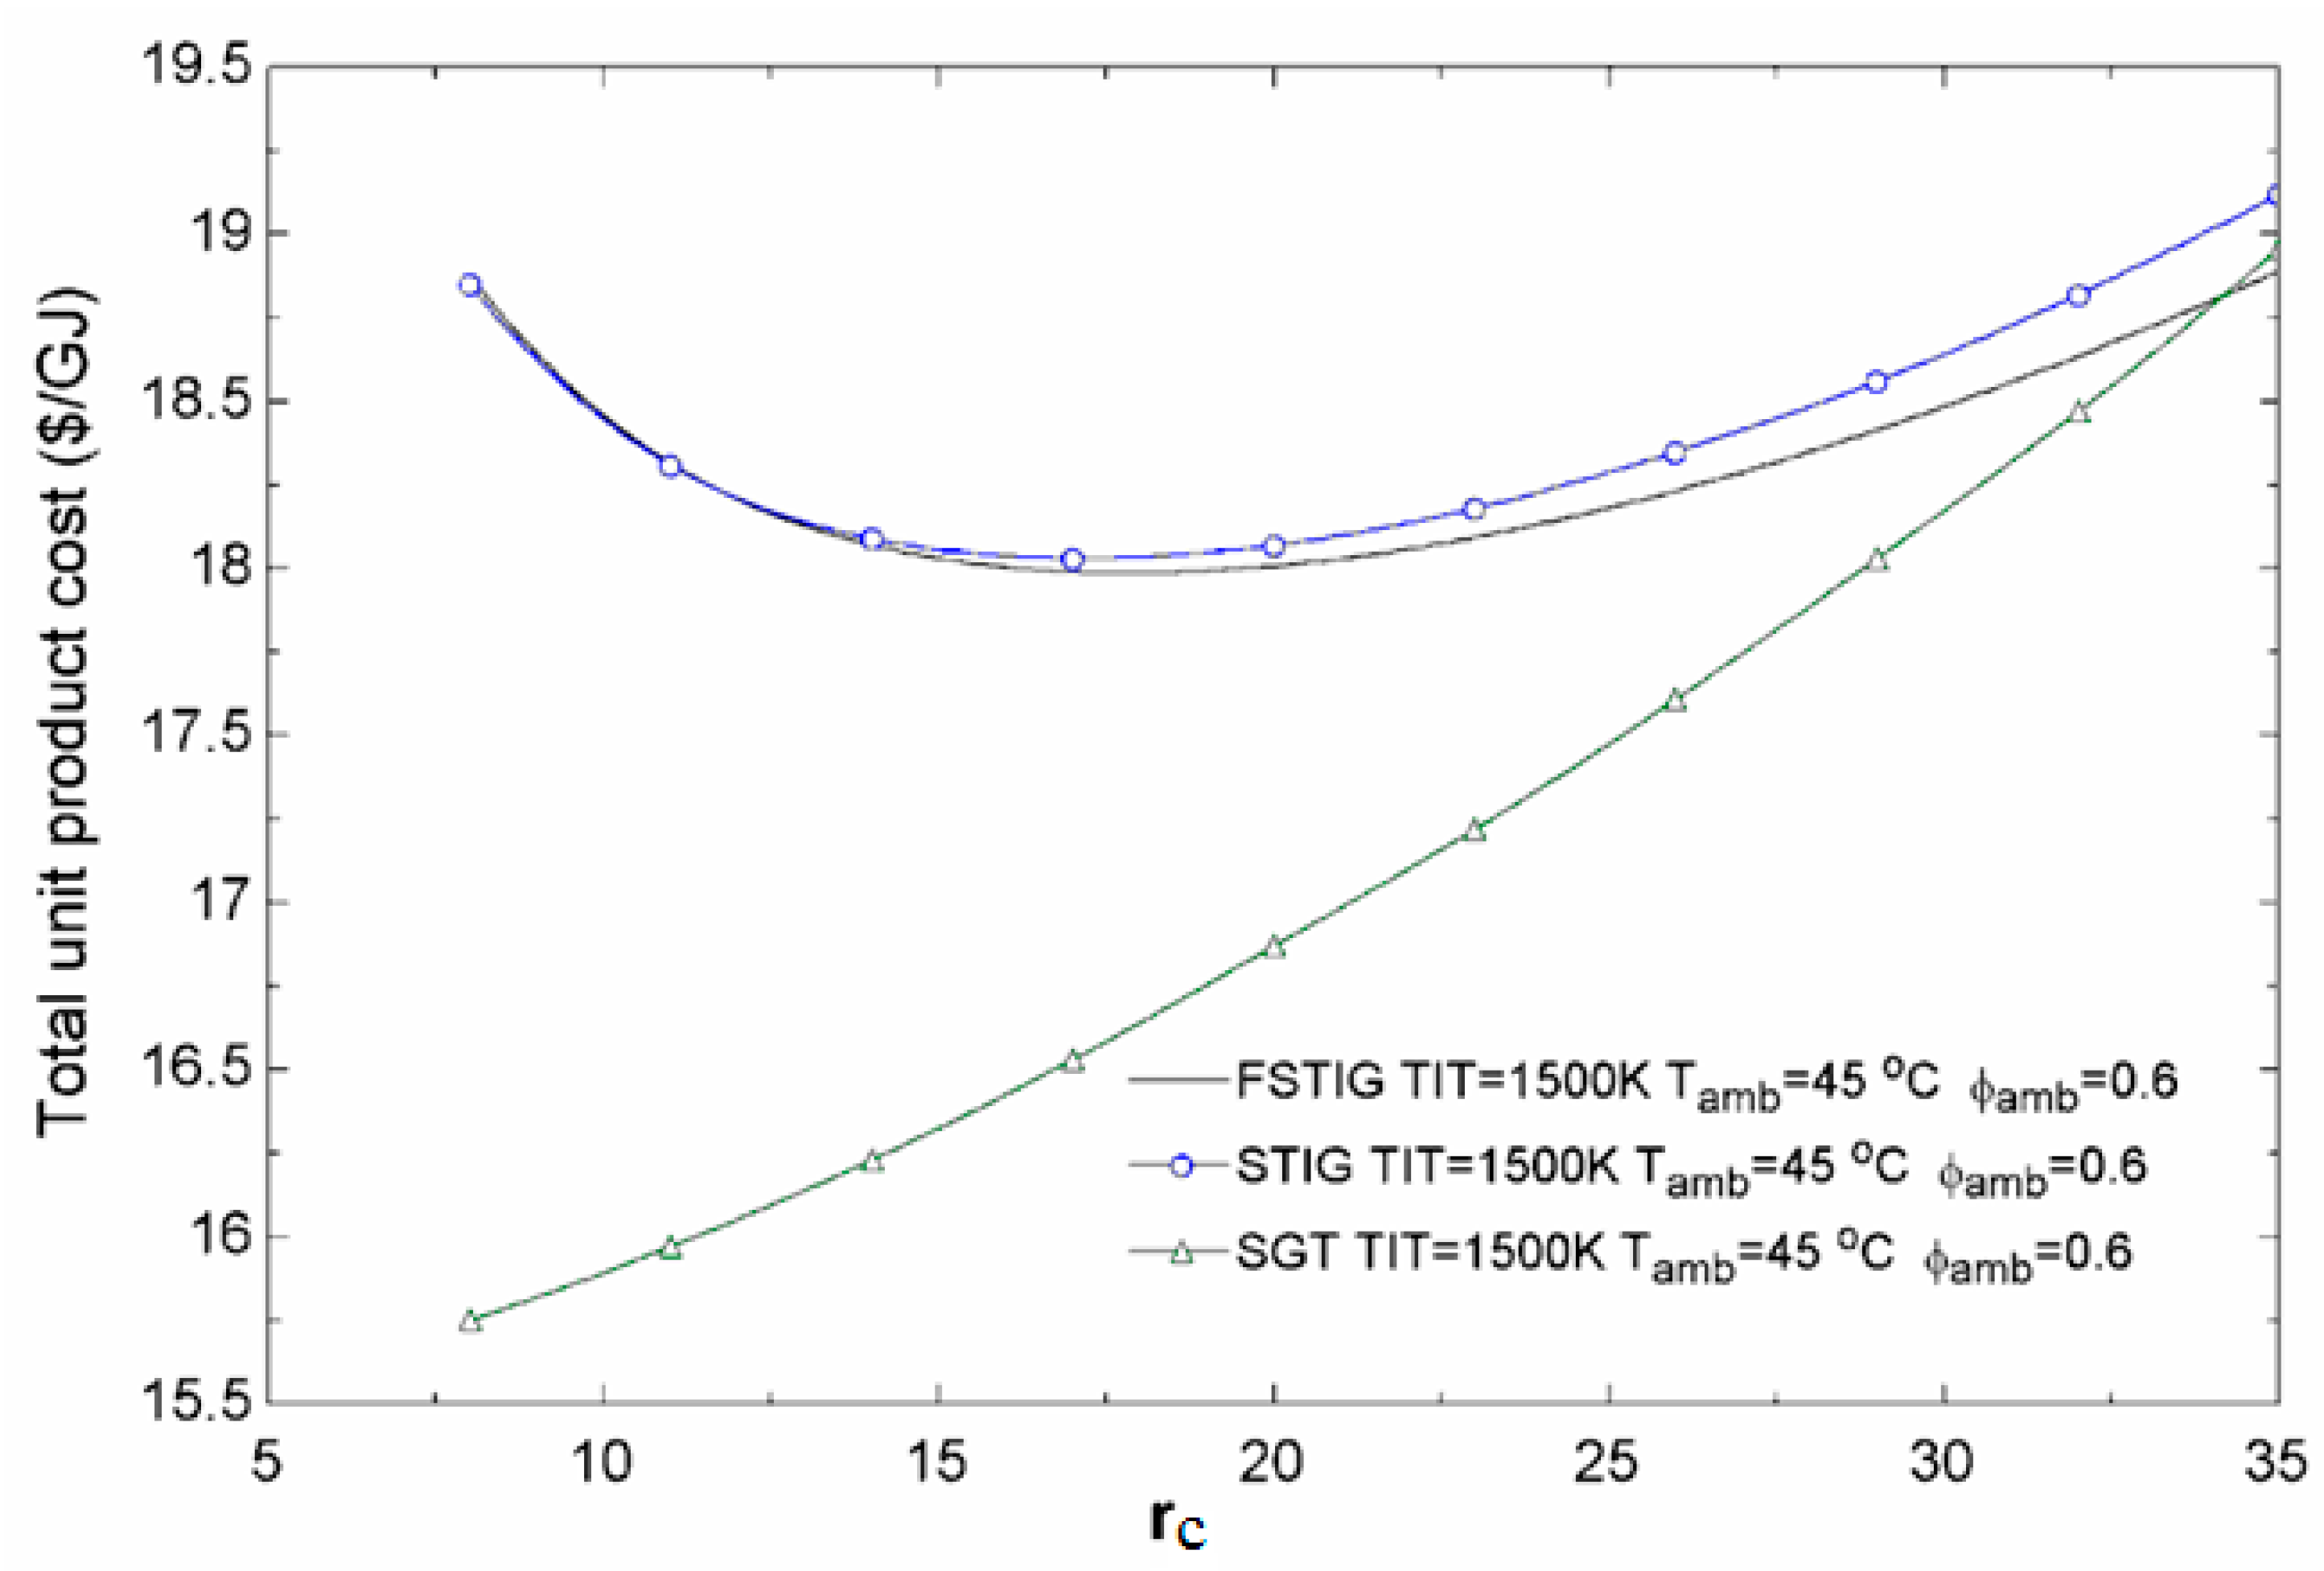
The total unit product cost is higher for the STIG plant than for the FSTIG or SGT plants. The SGT plant exhibits a lower relative cost difference, total unit product cost, exergoeconomic factor and net power output.
The exergy loss rate and its cost are highest for SGT plant and next highest for the FSTIG plant.
The FSTIG exhibits the highest net power output and energy and exergy efficiencies. However, exergy loss rate is higher for this plant than for the steam injection plant without fog cooling.
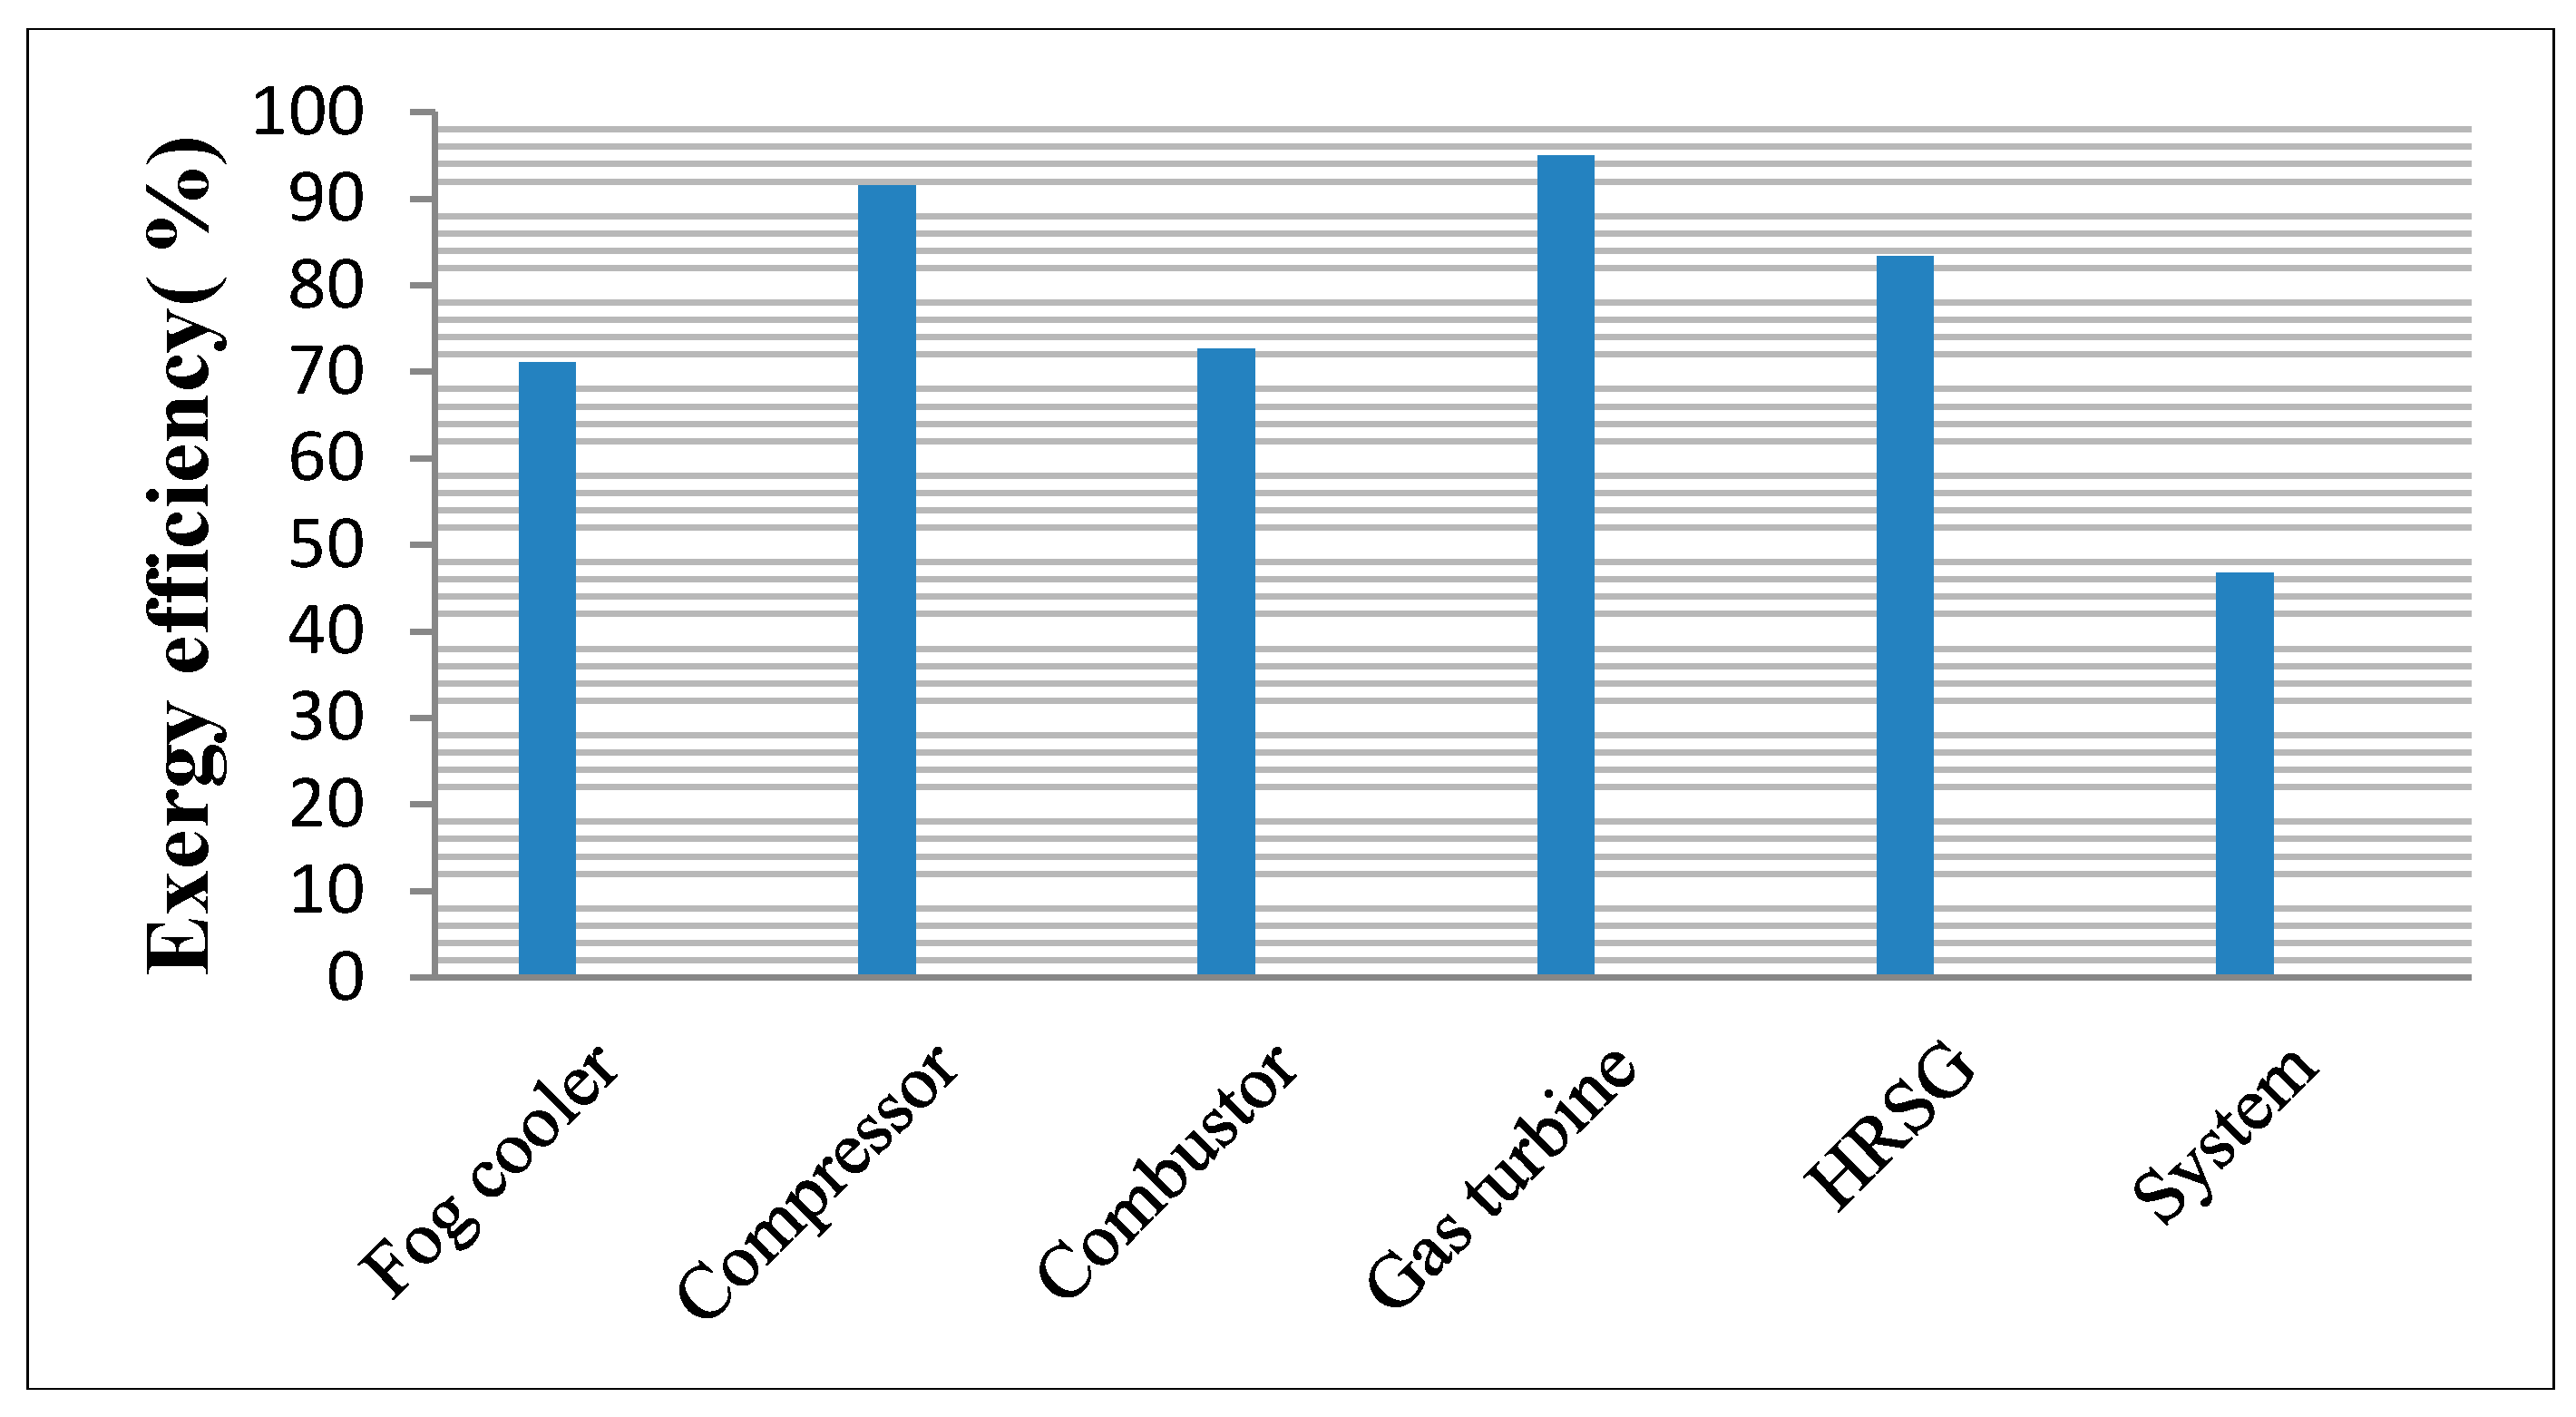
For the components in the FSTIG cycle, the largest irreversibility rates are attributable to the fog cooler and the combustion chamber. In the latter case, the major causes of the irreversibility are heat transfer across large temperature differences and irreversible chemical reactions.
The energy and exergy efficiencies of the FSTIG are maximized at particular values of compressor pressure ratio. With increasing pressure ratio, the total unit product cost decreases to a point and then increases for the FSTIG and STIG plants but increases continually for the SGT plant.
Fog cooling is economically feasible since it reduces the relative cost difference and total unit product cost.

Author Contributions

Hassan Athari, Saeed Soltani and Marc A. Rosen have done the technical, analysis and writing parts and the Prof. Seyed Mohammad Seyed Mahmoudi and Prof. Tatiana Morosuk had contribution in the technical and analysis parts.

Conflicts of Interest

The authors declare no conflict of interest.

Nomenclature

ACC
Air cooled condenser
c
Cost per exergy unit ($/GJ)
CDT
Compressor discharge temperature (°C)
CIT
Compressor inlet temperature (°C)
CRF
Capital recovery factor (-)
C ˙
Cost rate ($/h)
C ¯ P
Molar specific heat at constant pressure (kJ/kmol·K)
E ˙
Exergy rate (kW)
FA
Ratio of fuel mass to 20 kg/s inlet air mass
FSTIG
Steam injection gas turbine cycle with inlet fogging cooler
GT
Gas turbine
ha
Specific enthalpy of dry air (kJ/kg)
hf
Specific enthalpy of water injected into air (kJ/kg)
hv
Specific enthalpies of vapor (kJ/kg)
HR
Heat rate (kJ/kWh)
ir
Interest rate
LHV
Lower heating value (kJ/kg.K)
m ˙ a
Mass flow rate of dry air (kg/s)
m ˙ f
Mass flow rate of the sprayed water in fogging cooler (kg/s)
m ˙
Mass flow rate of steam at location i (kg/s)
m ˙ s
Mass flow rate of steam injected into combustion chamber (kg/s)
m ˙ w
Mass flow rate of unevaporated water in fogging cooler (kg/s)
M
Molecular mass (kg)
ns
Molar quantity of steam (kmole)
OS
Overspray
P
Pressure (kPa)
Q ˙
Heat transfer rate (kW)
R ¯
Universal gas constant (kJ/kmol.K)
s
Entropy (kJ/kg)
SGT
Simple gas turbine cycle without fogging system
STIG
Simple steam injection gas turbine cycle
T
Temperature (K)
TIT
Turbine inlet temperature (K)
TOT
Turbine outlet temperature (K)
w
Specific humidity
w ¯ i
Molar specific humidity per 1 mole of dry air at point i
W ˙ Com
Power consumption of compressor (kW)
W ˙ Turb
Outlet power of turbine (kW)
X
Ratio of injected steam from heat recovery steam generator to 20 kg/s inlet air mass
Z
Investment cost of components ($)
Z ˙
Investment cost rate of components ($/h)

Greek Letters

τ
Annual plant operation hours
γ k
Fixed operation and maintenance cost
ω k
Variable operation and maintenance cost
R ˙ k
All the other operation and maintenance costs
f
Exergoeconomic factor (-)
r
Relative cost difference (-)
λ
Excess air fraction (-)
ε
Exergy efficiency (-)
η B
Boiler efficiency (-)
η cc
Combustion chamber efficiency (-)
η pt,Com
Compressor polytropic efficiency (-)
η pt,Turb
Turbine polytropic efficiency (-)

Subscripts

a
Air
B
Boiler
CC
Combustion chamber
CI
Capital investment
Com
Compressor
D
Destruction
F
Fuel
FC
Fog cooler
HRSG
Heat recovery steam generator
i
State point
in
Input
out
Output
L
Loss
m
Number of hydrogen atoms in hydrocarbon fuel (CnHm)
n
Number of carbon atoms in hydrocarbon fuel (CnHm)
OM
Operation and maintenance
P
Product
pt
Polytropic
S
Steam
Turb
Turbine
W
Water

Appendix: Cost Equations for Components [25,26,27,28]

Air compressor

Z Com = ( c 11 m ˙ a c 12 η Com ) ( P out P in ) ln ( P out P in ) c 11 =75$/(kg/s),c 12 =0.9

Combustion chamber

Z CC =c 21 × m ˙ air(gas) × ( 1+exp(c 22 T out c 23 ) ) × 1 0.995 P out P in c 21 =48 .64$/(kg/s),c 22 =0 .018K 1 ,c 23 =26.4

Gas turbine

Z Turb = ( c 31 m ˙ gas c 32 η Turb ) ( P out P in ) ( 1+exp(c 33 T in c 34 ) ) c 31 =1536$/(kg/s),c 32 =0 .92, c 33 =0 .036K 1

HRSG

Z HRSG =c 41 × i ( f p,i × f T.steam,i × f T.gas,i × ( Q ˙ i LMTD i ) 0.8 ) +c 42 × j f p,j × m ˙ steam,j +c 43 × m ˙ gas 1.2 f p,i =0.0971 × p i 30bar +0.9029 f T.steam,i =1+exp ( T out,steam,i 830K 500K ) f T.gas,i =1+exp ( T out,gas,i 990K 500K ) c 41 =4131.8$ (kW .K) 0.8 c 42 =13380$ (kg .s) 1 c 43 =1489.7$ (kg .s) 1.2

Pump

Z pump =c 71 × W ˙ pump 0.71 ( 1+ 0.2 1 μ is,pump ) c 71 =705.48$.(kg .s) 1

References

  1. Caresana, F.; Pelagalli, L.; Comodi, G.; Renzi, M. Microturbogas cogeneration systems for distributed generation: Effects of ambient temperature on global performance and components’ behavior. Appl. Energy 2014, 124, 17–27. [Google Scholar] [CrossRef]
  2. Al-Ibrahim, A.M.; Varnham, A. A review of inlet air-cooling technologies for enhancing the performance of combustion turbines in Saudi Arabia. Appl. Therm. Eng. 2010, 30, 1879–1888. [Google Scholar] [CrossRef]
  3. Bassily, A.M. Performance improvements of the intercooled reheat recuperated gas-turbine cycle using absorption inlet-cooling and evaporative after-cooling. Appl. Energy 2004, 77, 249–272. [Google Scholar] [CrossRef]
  4. Renzi, M.; Caresana, F.; Pelagalli, L.; Comodi, G. Enhancing micro gas turbine performance through fogging technique: Experimental analysis. Appl. Energy 2015, 135, 165–173. [Google Scholar] [CrossRef]
  5. Mahto, D.; Pal, S. Thermodynamics and thermo-economic analysis of simple combined cycle with inlet fogging. Appl. Therm. Eng. 2013, 51, 413–424. [Google Scholar] [CrossRef]
  6. Ehyaei, M.A.; Mozafari, A.; Alibiglou, M.H. Exergy, economic and environmental (3E) analysis of inlet fogging for gas turbine power plant. Energy 2011, 36, 6851–6861. [Google Scholar] [CrossRef]
  7. Hosseini, R.; Beshkani, A.; Soltani, M. Performance improvement of gas turbines of Fars (Iran) combined cycle power plant by intake air cooling using a media evaporative cooler. Energy Convers. Manag. 2007, 48, 1055–1064. [Google Scholar] [CrossRef]
  8. Chacartegui, R.; Jiménez-Espadafor, F.; Sánchez, D.; Sánchez, T. Analysis of combustion turbine inlet air cooling systems applied to an operating cogeneration power plant. Energy Convers. Manag. 2008, 49, 2130–2141. [Google Scholar] [CrossRef]
  9. Yang, C.; Yang, Z.; Cai, R. Analytical method for evaluation of gas turbine inlet air cooling in combined cycle power plant. Appl. Energy 2009, 86, 848–856. [Google Scholar] [CrossRef]
  10. Sanaye, S.; Tahani, M. Analysis of gas turbine operating parameters with inlet fogging and wet compression processes. Appl. Therm. Eng. 2010, 30, 234–244. [Google Scholar] [CrossRef]
  11. Bartolini, C.M.; Caresana, F.; Comodi, G.; Pelagalli, L.; Renzi, M.; Vagni, S. Application of artificial neural networks to micro gas turbines. Energy Convers. Manag. 2011, 52, 781–788. [Google Scholar] [CrossRef]
  12. Caresana, F.; Comodi, G.; Pelagalli, L.; Renzi, M.; Vagni, S. Use of a test-bed to study the performance of micro gas turbines for cogeneration applications. Appl. Therm. Eng. 2011, 31, 3552–3558. [Google Scholar] [CrossRef]
  13. Kim, H.; Ko, H.; Perez-Blanco, H. Exergy analysis of gas-turbine systems with high fogging compression. Int. J. Exergy 2011, 8, 16–32. [Google Scholar] [CrossRef]
  14. Mohapatra, A.K.; Nit, S. Sanjay Comparative analysis of inlet air cooling techniques integrated to cooled gas turbine plant. J. Energy Inst. 2015, 88, 344–358. [Google Scholar] [CrossRef]
  15. American Society of Mechanical Engineers (ASME). Air Cooled Heat Exchangers; ASME PTC.30; ASME: New York, NY, USA, 1991. [Google Scholar]
  16. Kayadelen, H.K.; Yasin, U. Performance and environment as objectives in multi-criterion optimization of steam injected gas turbine cycles. Appl. Therm. Eng. 2014, 71, 184–196. [Google Scholar] [CrossRef]
  17. Kim, H.; Perez-Blanco, H. Potential of regenerative gas-turbine systems with high fogging compression. Appl. Energy 2007, 84, 16–28. [Google Scholar] [CrossRef]
  18. Athari, H.; Soltani, S.; Bölükbaşi, A.; Rosen, M.A.; Morosuk, T. Comparative exergoeconomic analyses of the integration of biomass gasification and a gas turbine power plant with and without fogging inlet cooling. Renew. Energy 2015, 76, 394–400. [Google Scholar] [CrossRef]
  19. Rahman Khan, J.; Wang, T. Fog and Overspray Cooling for Gas Turbine Systems with Low Calorific Value Fuels. In Proceedings of GT2006ASME Turbo Expo 2006: Power for Land, Sea and Air, Barcelona, Spain, 8–11 May 2006.
  20. Petrakopoulou, F.; Boyano, A.; Cabrera, M.; Tsatsaronis, G. Exergoeconomic and exergoenvironmental analyses of a combined cycle power plant with chemical looping technology. Int. J. Greenh. Gas Control 2011, 5, 475–482. [Google Scholar] [CrossRef]
  21. Soltani, S.; Mahmoudi, S.M.S.; Yari, M.; Rosen, M.A. Thermodynamic analyses of an externally fired gas turbine combined cycle integrated with a biomass gasification plant. Energy Convers. Manag. 2013, 70, 107–115. [Google Scholar] [CrossRef]
  22. Moran, M.J.; Shapiro, H.N.; Boettner, D.D.; Bailey, M.B. Fundamentals of Engineering Thermodynamics, 7th ed.; Wiley: New York, NY, USA, 2011. [Google Scholar]
  23. Dincer, I.; Rosen, M.A. Exergy: Energy, Environment and Sustainable Development, 2nd ed.; Elsevier: Oxford, UK, 2013. [Google Scholar]
  24. Kotas, T.J. The Exergy Method of Energy Plant. Analysis; Butterworths: London, UK, 1985. [Google Scholar]
  25. Bejan, A.; Tsatsaronis, G.; Moran, M. Energy Design and Optimization; Wiley: New York, NY, USA, 1996. [Google Scholar]
  26. Soltani, S.; Mahmoudi, S.M.S.; Yari, M.; Morosuk, T.; Rosen, M.A.; Zare, V. A comparative exergoeconomic analysis of two biomass and co-firing combined power plants. Energy Convers. Manag. 2013, 76, 83–91. [Google Scholar] [CrossRef]
  27. Baghernejad, A.; Yaghoubi, M. Exergoeconomic analysis and optimization of an Integrated Solar Combined Cycle System (ISCCS) using genetic algorithm. Energy Convers. Manag. 2011, 52, 2193–2203. [Google Scholar] [CrossRef]
  28. Roosen, P.; Uhlenbruck, S.; Lucas, K. Pareto optimization of a combined cycle power system as a decision support tool for trading off investment vs. operating costs. Int. J. Therm. Sci. 2003, 42, 553–560. [Google Scholar] [CrossRef]
  29. Vieira, L.S.; Donatelli, J.L.; Cruz, M.E. Exergoeconomic improvement of a complex cogeneration system integrated with a professional process simulator. Energy Convers. Manag. 2009, 50, 1955–1967. [Google Scholar] [CrossRef]

