1. Introduction
Sustainability is a very germane topic for logistics service providers (LSP) as outlined for example by Abbasi and Nilsson [
1] (p. 263), Govindan and Soleimani [
2] (p. 371), or Colicchia et al. [
3] (p. 189). True for all transport modes in transportation, e.g., for road, rail [
4] (p. 148), air, and sea [
5] (p. 473) transport [
6] (p. 414), an important characteristic of sustainability concepts and efforts with LSP is also the fact that they steer the transport chain on behalf of industry and retail corporations and therefore influence their own sustainability performance [
7] (p. 589). Furthermore, this is also proven by the fact that all major LSP provide extensive sustainability data and reports, often within legal business report documents, for example Deutsche Post DHL [
8], Kühne + Nagel [
9], or A.P. Moeller Maersk [
10], and research indicates that these reports drive change [
11] as well as firm value [
12,
13]. This importance also extends towards the question of external institutional legitimation by business partners, as outlined by Busse, Kach, and Bode [
14] (p. 321). Although supply management is deemed to play an important role in implementing sustainability objectives [
15] and technology advances may help in the endeavor [
16,
17], some authors search for a “missing link” in sustainability implementation [
18,
19] or voice critical concerns regarding overall resource depletion [
20,
21] and greenwashing risks in the sustainability domain [
22,
23].
In spite of large volumes of communication and research regarding sustainability in logistics and supply chain management, empirical evidence for an improvement in global or company-based sustainability is largely missing or simply anecdotal evidence. Quantitative research is, for example, of interest for the productivity of LSP regarding the established triple bottom line approach for sustainability, including economic, environmental, and social performance areas. This is especially true for a dynamic time-series perspective, as usually only static analyses for one point in time are presented. Therefore, for example, the operations research (OR) technique of a data envelopment analysis (DEA) Malmquist index calculation could be used in order to provide a longitudinal calculation of efficiency for multiple objectives regarding the triple bottom line approach for European LSP. The underlying DEA technique for efficiency measurement was introduced by Charnes, Cooper, and Rhodes [
24] in the basic form with constant returns to scale (CRS) model and extended by Banker, Charnes, and Cooper [
25] with a variable returns to scale (VRS) model. It is well applied within the logistics service sector, where service quality aspects and other competitive features lead to a multi-output production situation, especially in complex supply chain environment or if public interest or public production is included [
26,
27,
28,
29,
30]. The DEA Malmquist index for the analysis of longitudinal developments [
31,
32,
33] has also been applied in logistics, e.g., for the airline and airport service sector [
34,
35,
36,
37].
For the question of longitudinal analysis regarding sustainability developments, some applications and results exist for the energy industry and the aggregated industry as well as on a national country level. For the energy sector, Arabi et al. [
38] show that in Iranian energy production, eco-efficiency has increased mainly due to technical advancement and that eco-efficiency and corporate efficiency are closely linked; this is based on a slacks-based model for Malmquist-Luenberger index measurement in the timeframe from 2003 to 2010, a period with huge restructuring efforts. Chang, Kuo, and Chen [
39] describe dynamic Malmquist index results regarding three years for the aggregation level of whole industries, reporting that sustainability performances improved overall but that only seven out of 16 observed industries gained in sustainability efficiency throughout the whole three-year period. Lin, Chen, and Chen [
40] outline Malmquist-Luenberger index results for 70 countries regarding sustainability performance between 1981 and 2007, revealing that developing countries were able to achieve a higher improvement in their environmental productivity.
However, no application exists to date addressing sustainability questions for LSP with the DEA Malmquist index technique. Therefore this is constituted as a significant research gap. The research questions therefore are how DEA Malmquist index calculation can be applied to the question of longitudinal efficiency development of LSP regarding the sustainability triple bottom line and which results such an analysis would present.
The remainder of this contribution is structured as follows:
Section 2 describes management concepts and internationally acknowledged evaluation regimes of sustainability for LSP.
Section 3 outlines the policies and data (2007–2015) for selected European LSP regarding sustainability, which were used for evaluation in this contribution.
Section 4 provides the methodological background regarding DEA and the DEA Malmquist Index.
Section 5 presents calculation results for the dataset.
Section 6 points at interesting discussion topics resulting from the calculations results before
Section 7 closes with conclusions and further interesting research questions.
2. Transportation and Sustainability
Sustainability has been defined by von Carlowitz regarding the “sustainable” growth and cutting management of forests with the simple rule not to cut more trees in a period than can grow back in a long-term perspective [
41]. Similarly, the modern-day scientific as well as practical definition, based on earlier works like “Limits to Growth” [
42,
43], stems from the Brundtland report in 1987 [
44] (p. 16, §27), stipulating that:
“Humanity has the ability to make development sustainable to ensure that it meets the needs of the present without compromising the ability of future generations to meet their own needs. The concept of sustainable development does imply limits—not absolute limits but limitations imposed by the present state of technology and social organization on environmental resources and by the ability of the biosphere to absorb the effects of human activities. But technology and social organization can be both managed and improved to make way for a new era of economic growth.”
As several researchers note, this has been a major step forward, reconciling economic, environmental, and social objectives, a hallmark still valid and approachable today, 30 years later [
45,
46,
47]. Derived from this overall global and societal objective, corporate strategies and decisions are obviously affected at the core to the point where, as with marketing, quality, and supply chain management in the past, today sustainability can be seen as a fundamental management philosophy permeating the whole corporation and embedded in all processes and decisions [
48,
49].
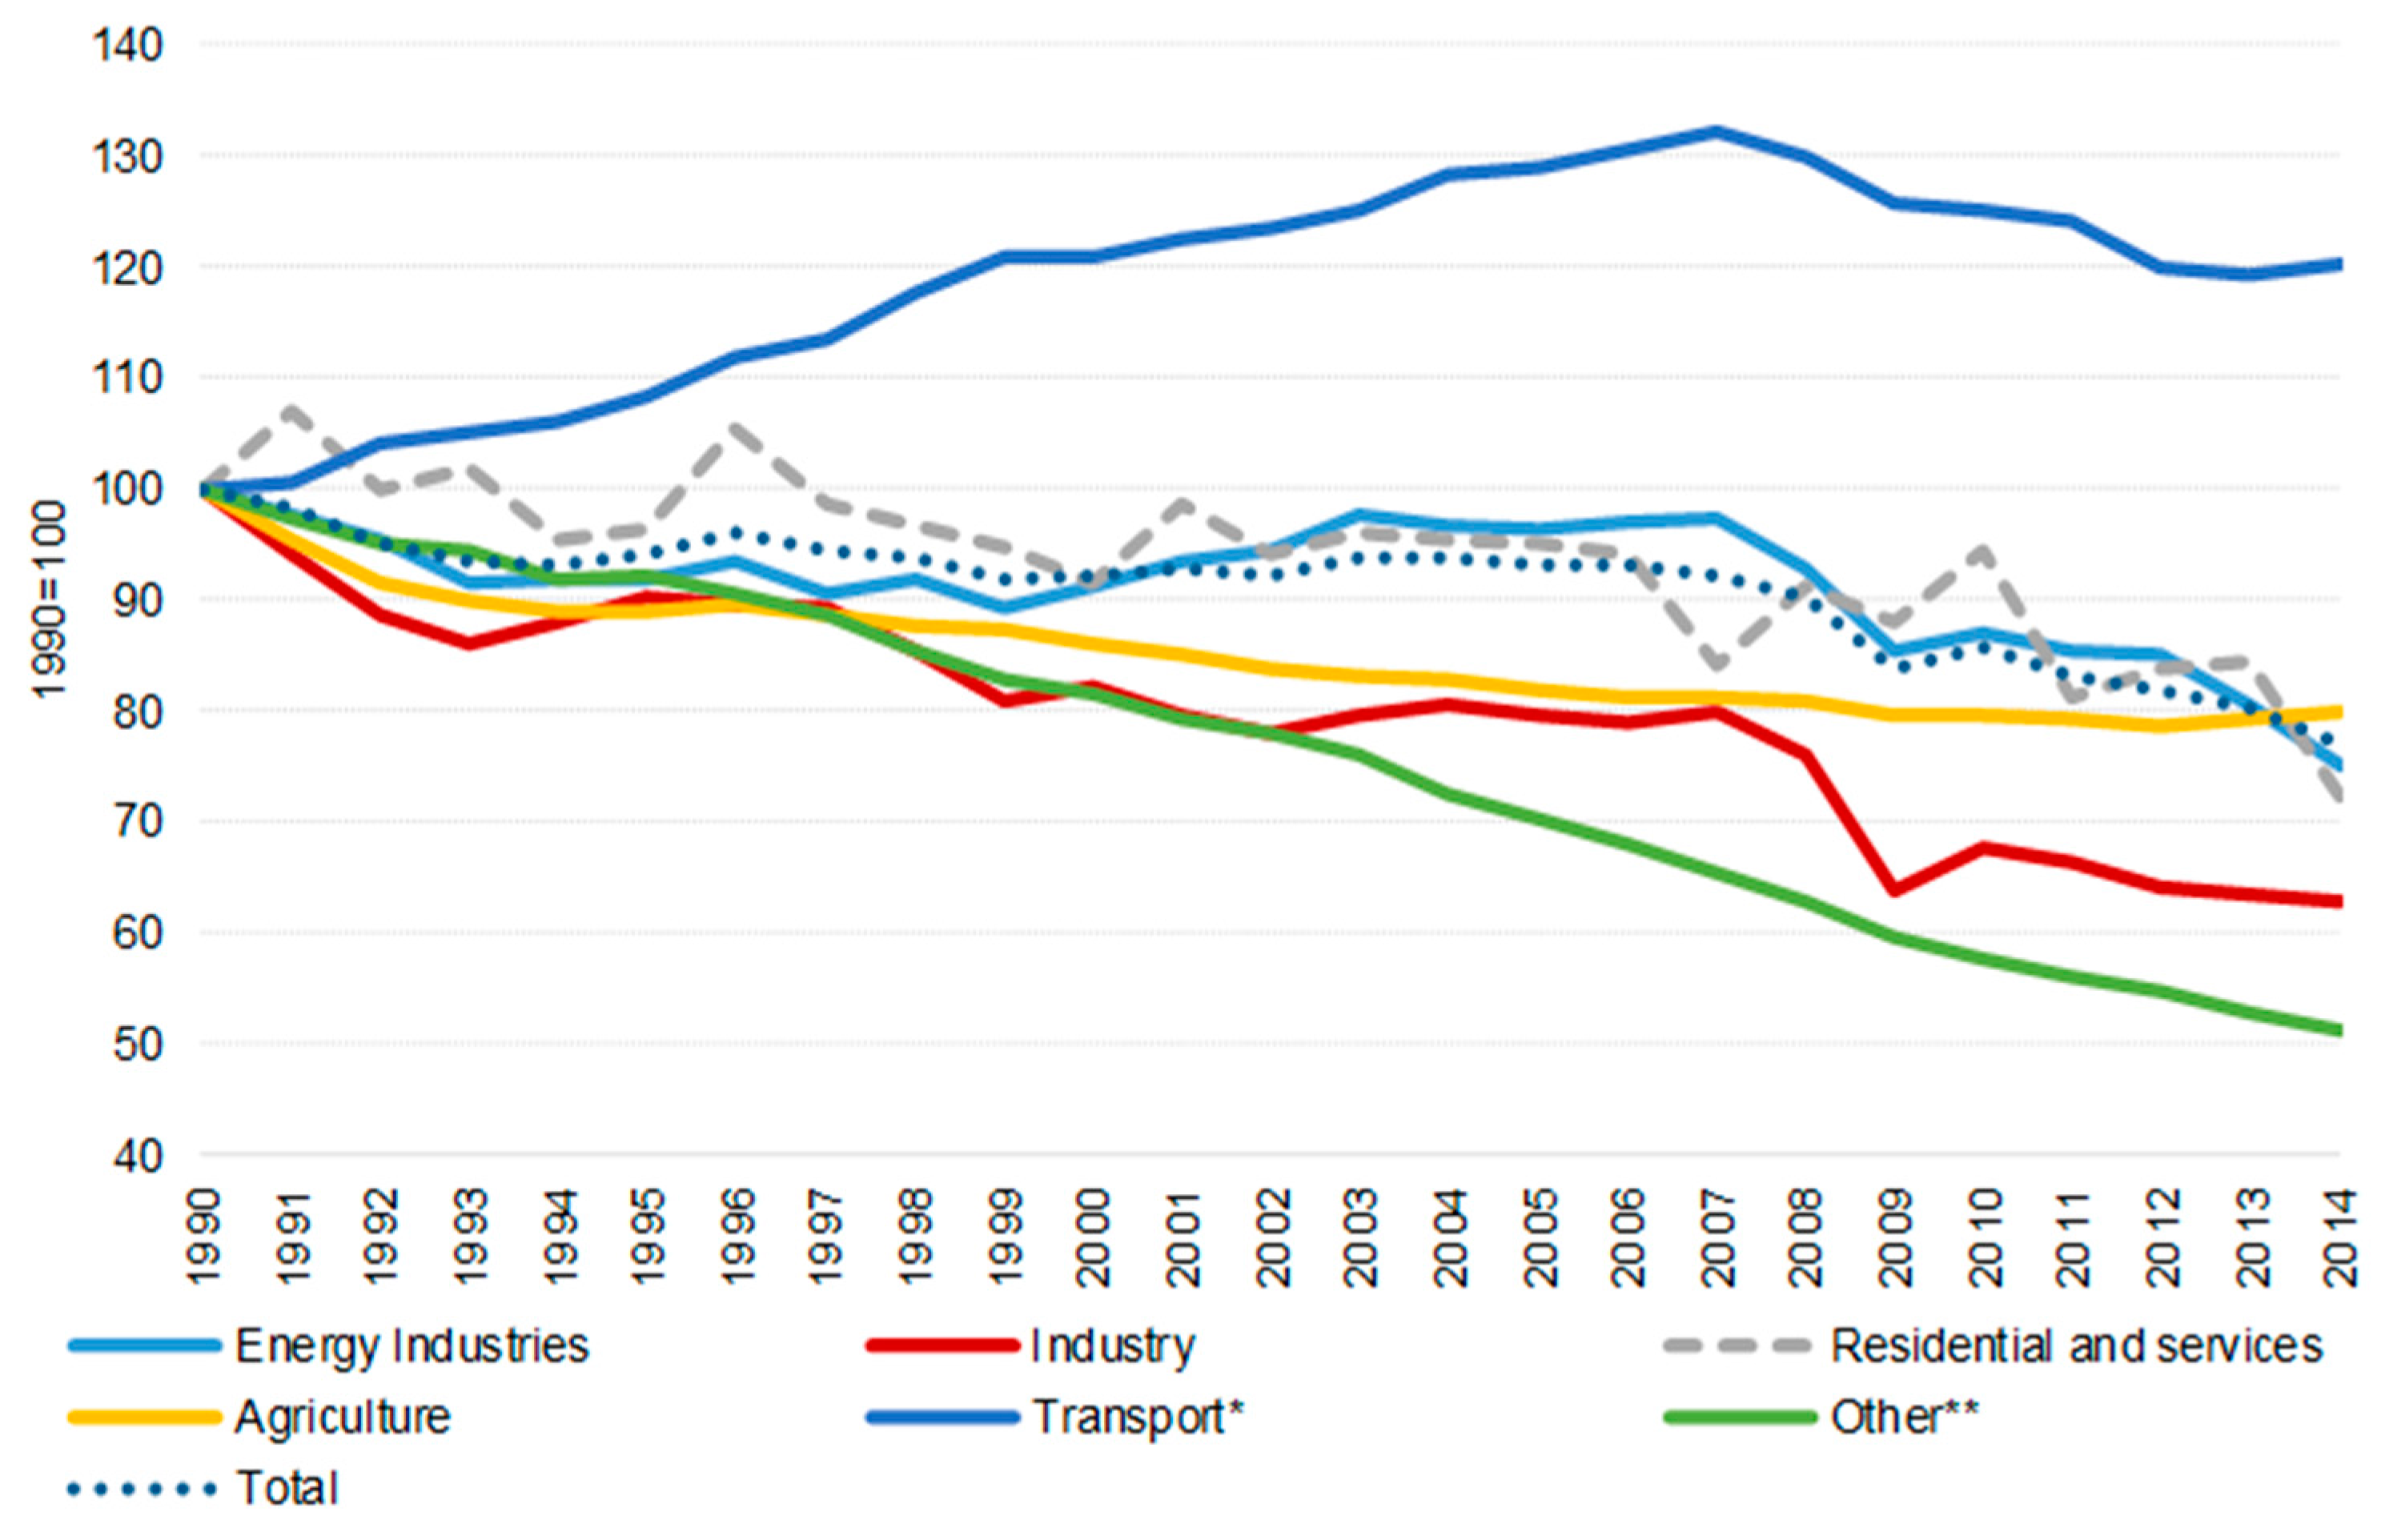
Regarding the environmental dimension for transportation, logistics, and supply chain management, the specific challenge consists in the fact that this sector, in which logistics service providers are active, has developed into the largest contributor of greenhouse gas emissions among all economic and society sectors (contributing 25.5% of total EU-28 greenhouse gas emissions in 2014, [
50]) and the only one with a dynamic long-term increase in emissions (cp.
Figure 1). This is aggravated by the fact that, only hampered by the economic crisis after 2008, the overall development trend for emissions from this sector is still largely upward, endangering the greenhouse gas (GHG) emission reduction targets set by the European Union until 2050 (cp.
Figure 2). Emissions from transport (including aviation) in 2014 were 20.1% above 1990 levels; international aviation experienced the largest percentage increase over 1990 levels (+97%), followed by international shipping (+24%) and road transport (+17%, [
50]).
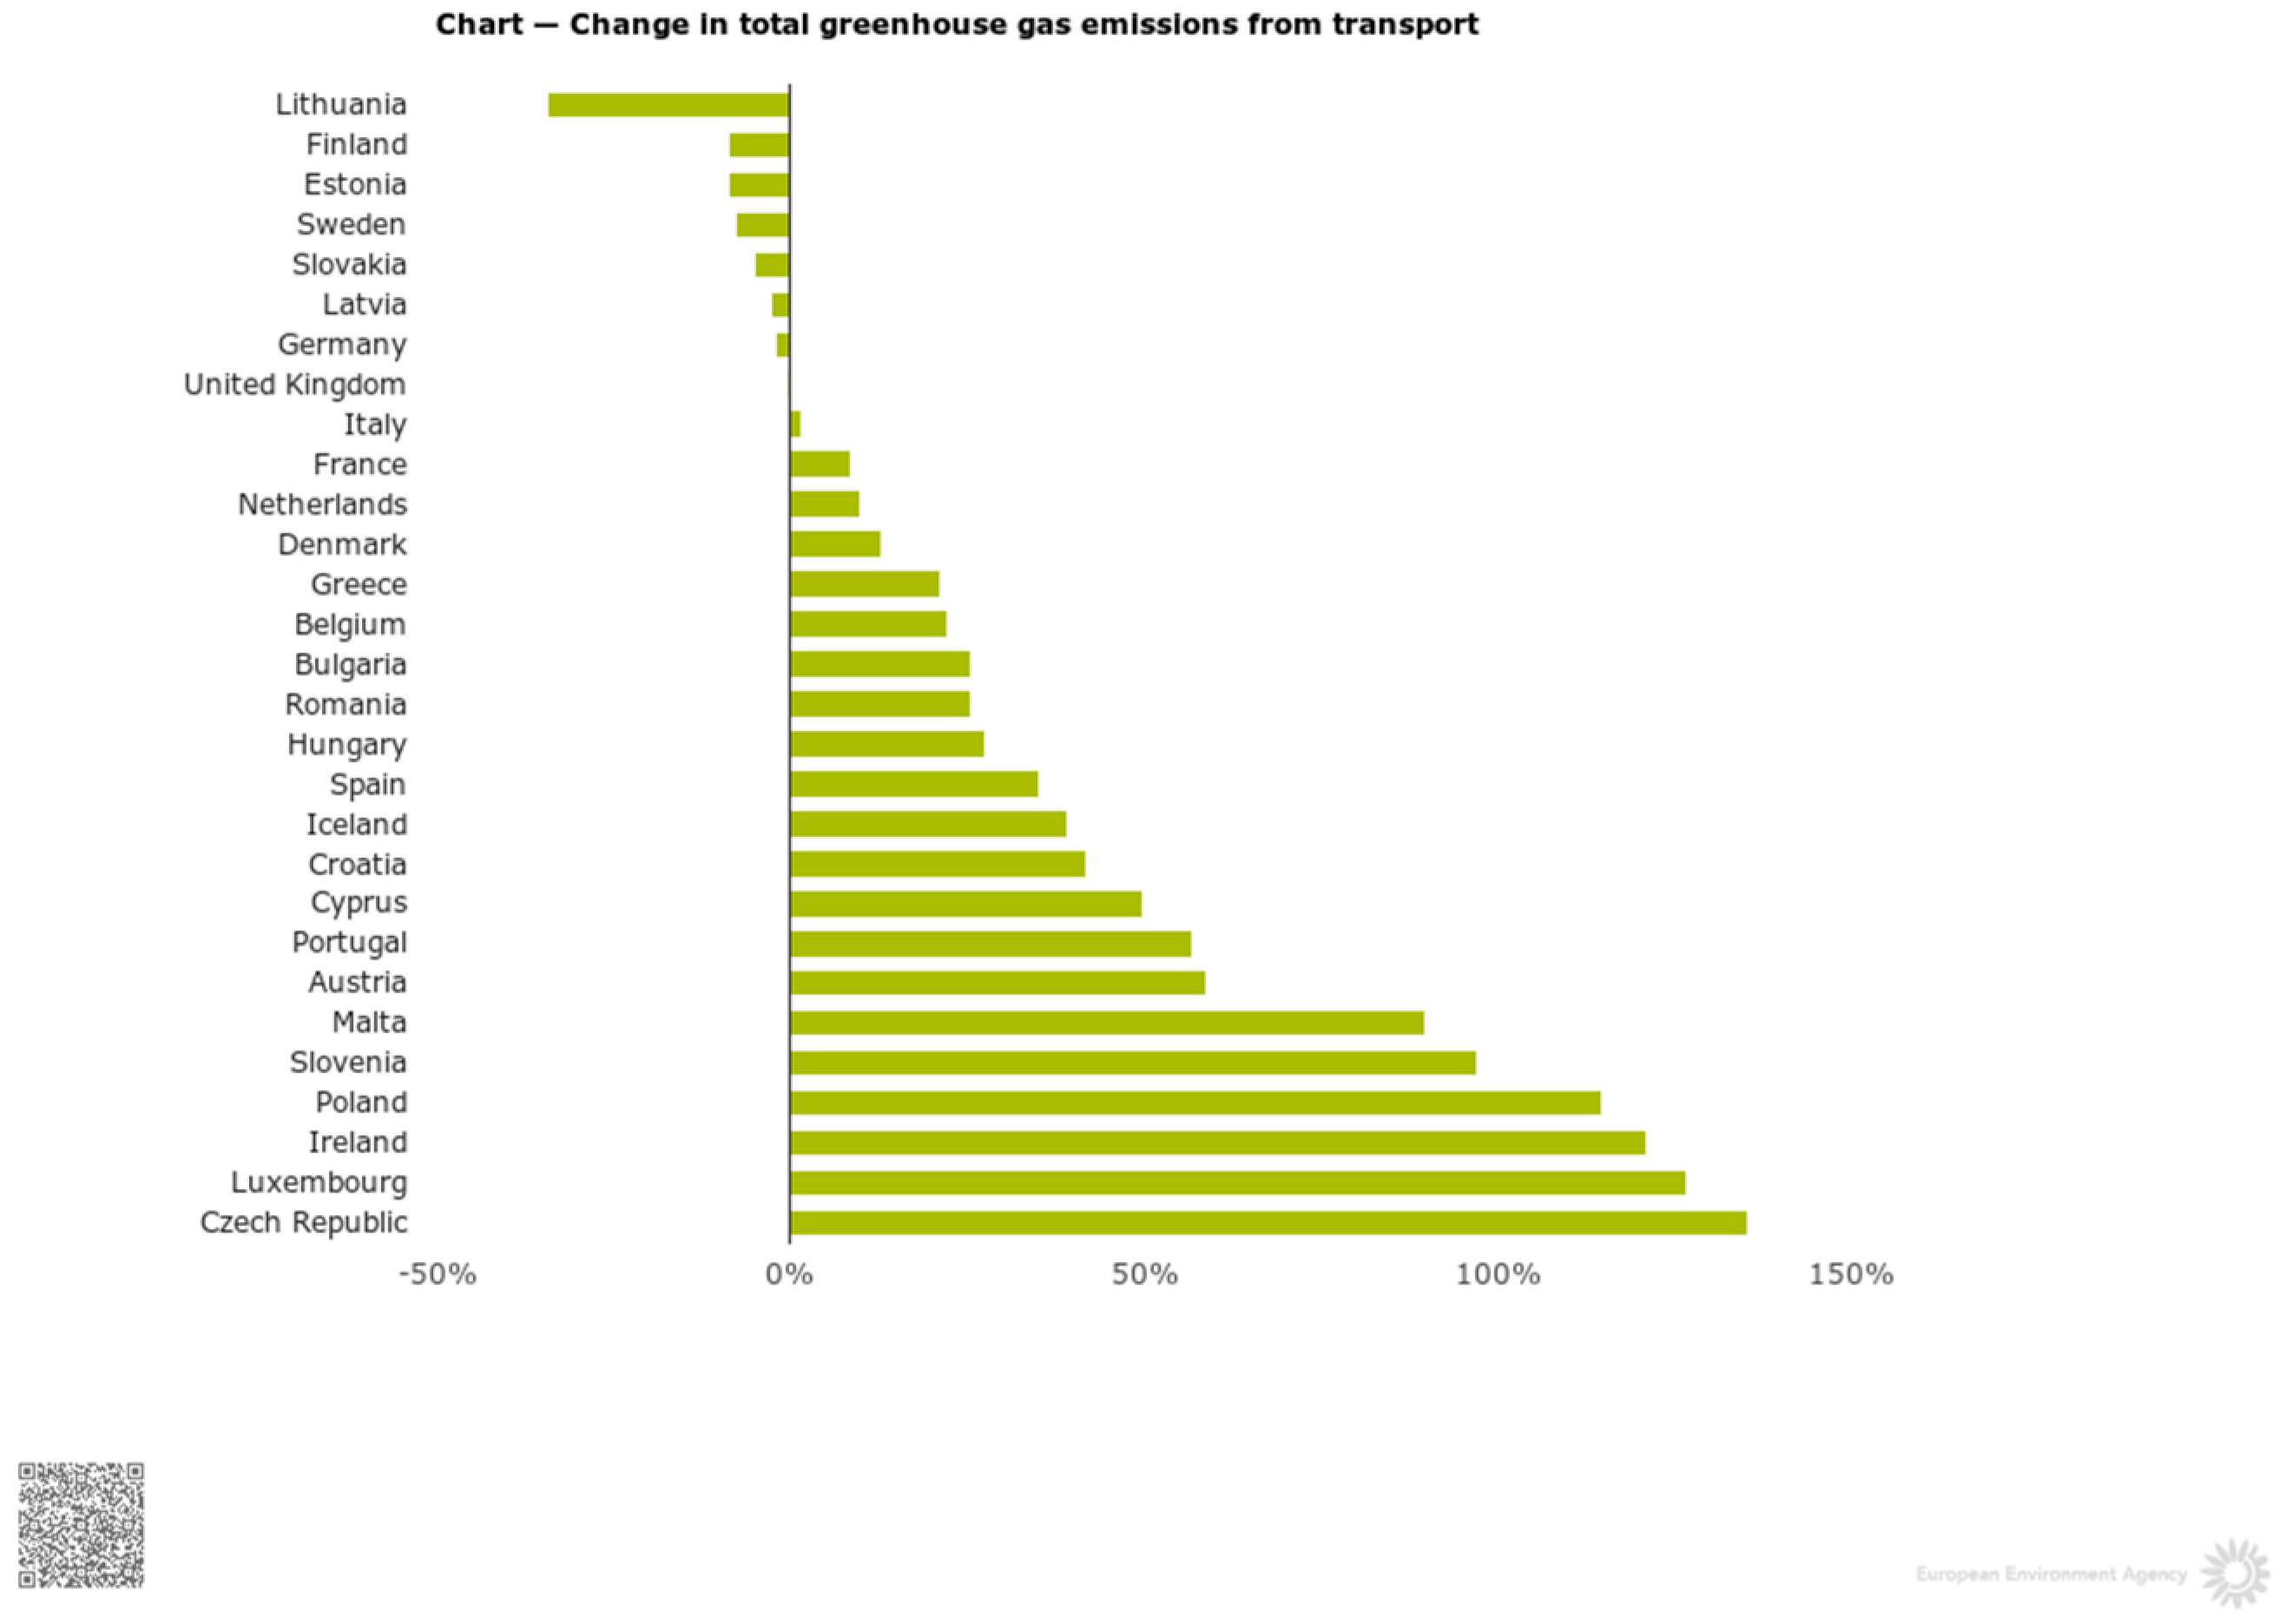
Furthermore, it can be recognized that there are large differences in such developments as depicted in
Figure 3 for the country level development within the European Union. Whereas Nordic states like Lithuania, Finland, Estonia, or Sweden have succeeded in reducing GHG emissions from transportation, other countries have even higher increases than the EU average, led by the Czech Republic, Luxembourg, Ireland, and Poland. Again, changes are only possible on a corporate level.
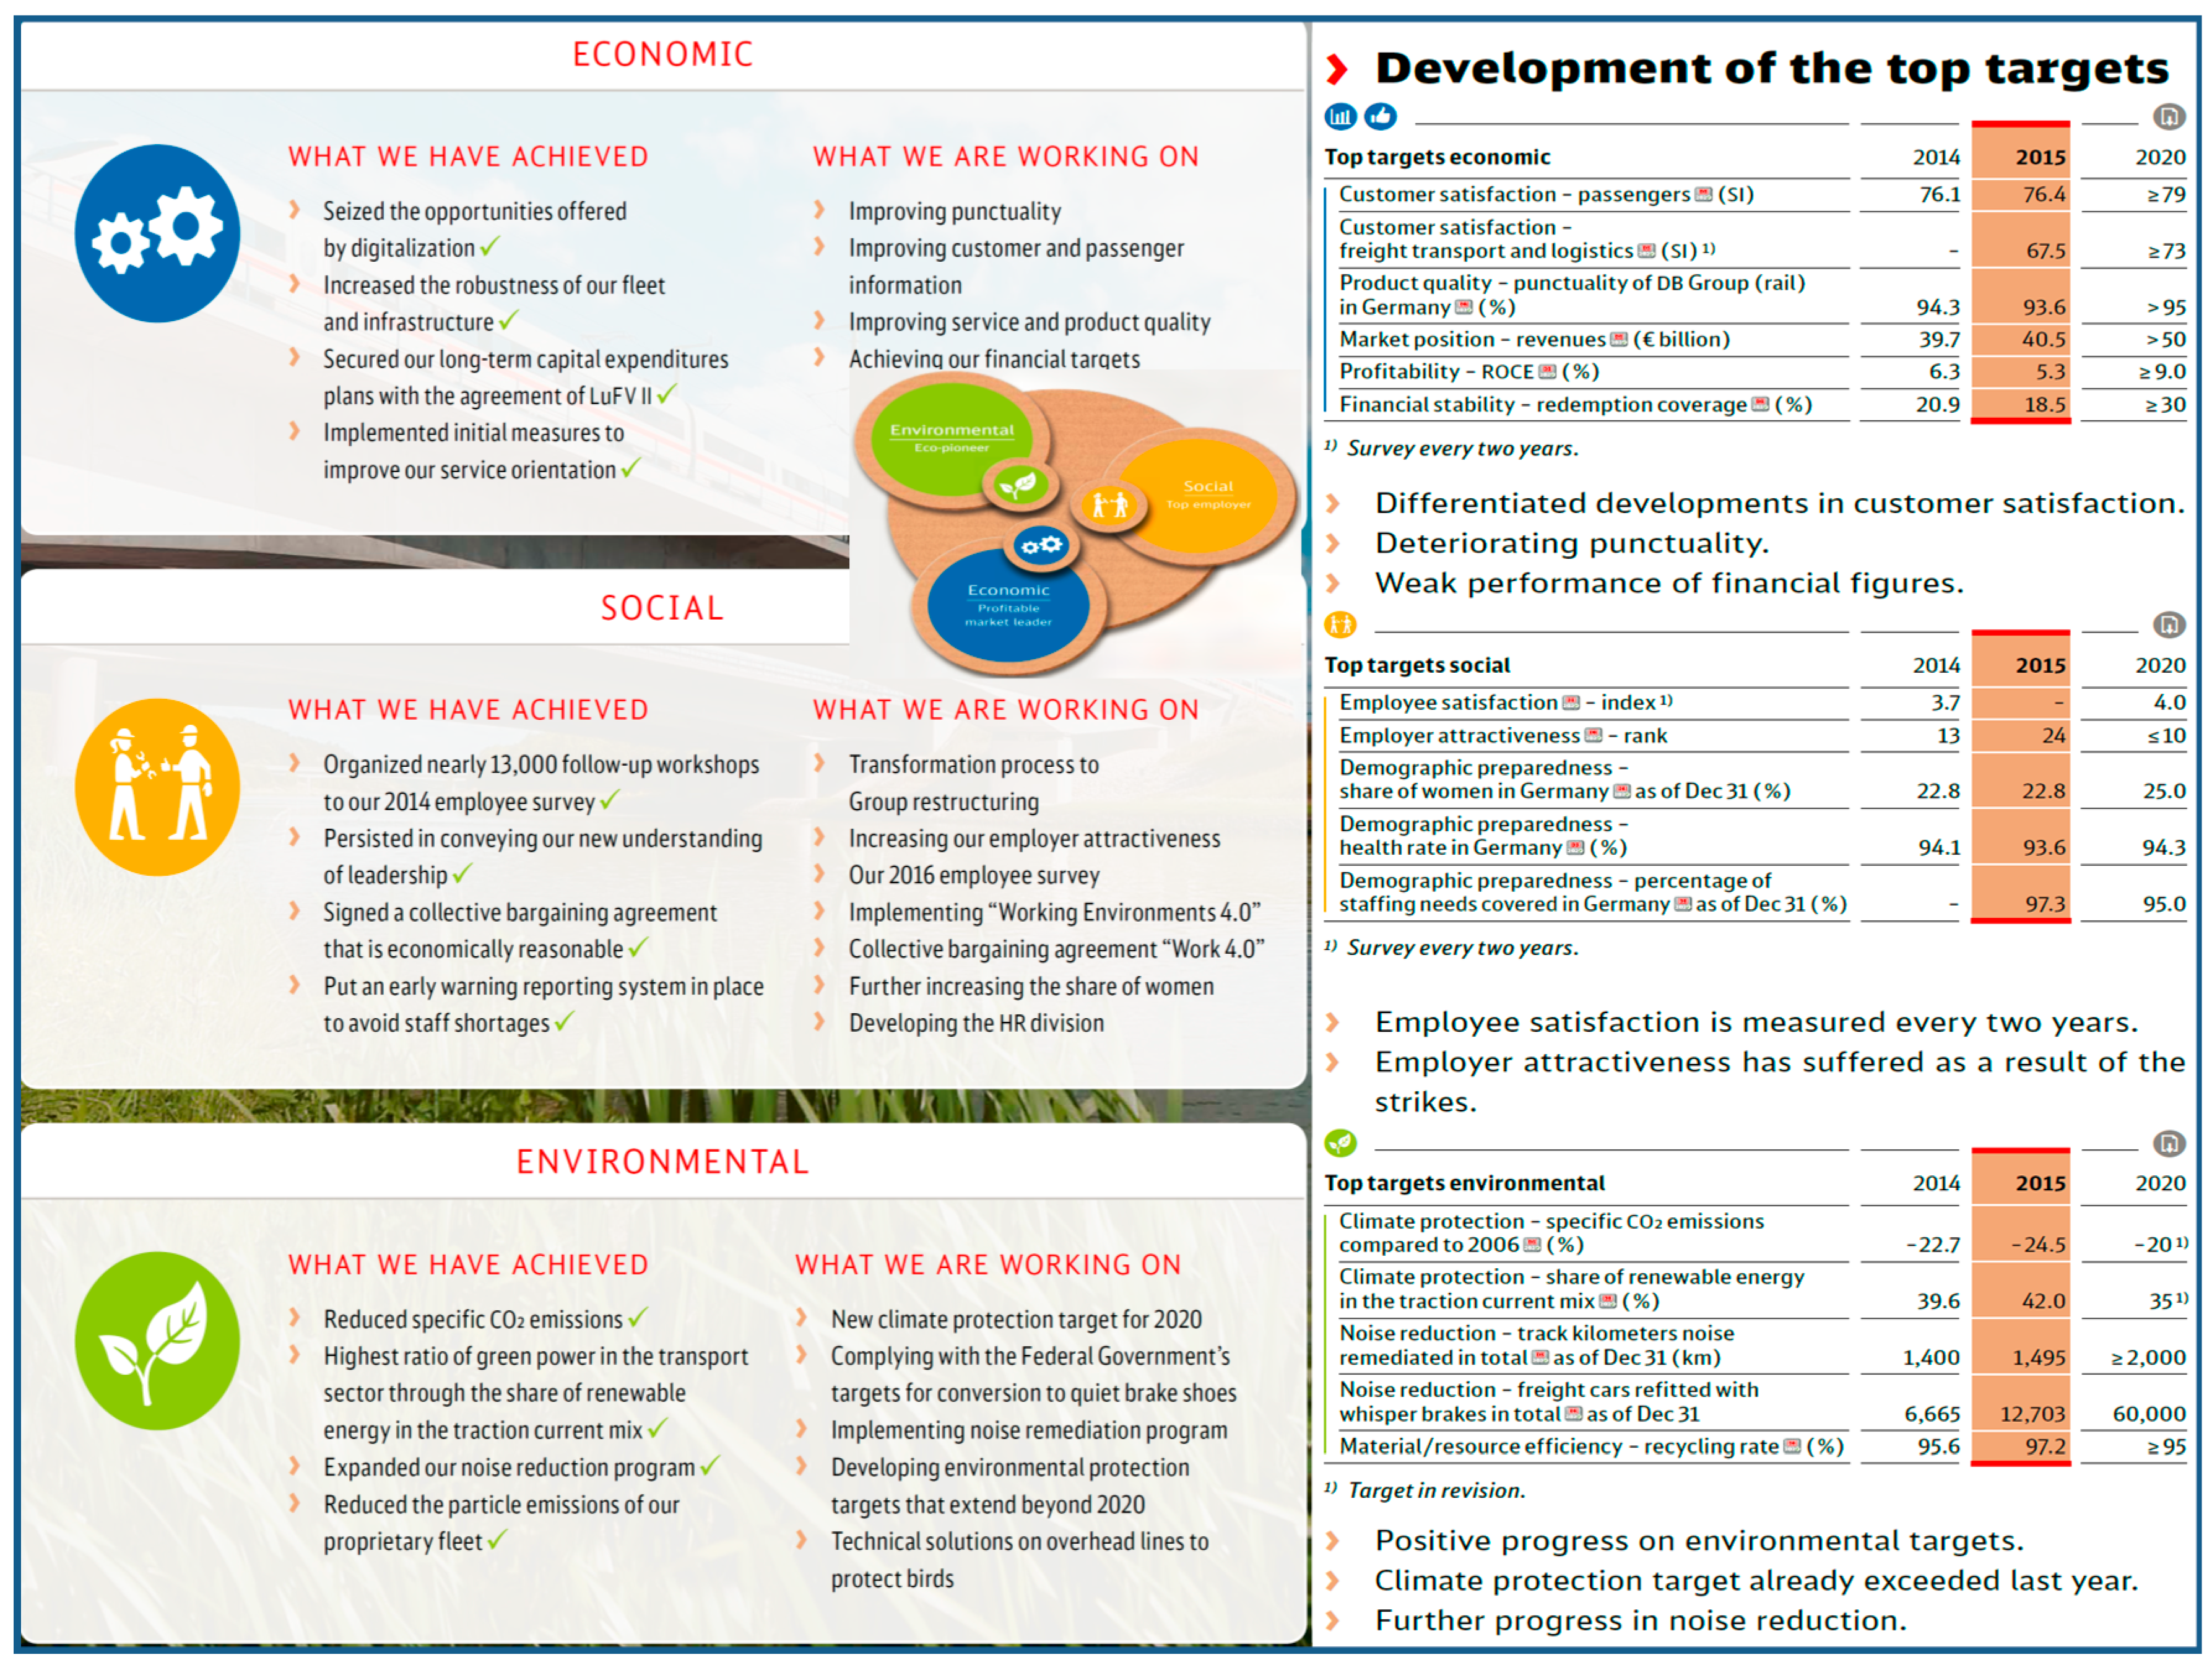
What is the bottom-line for an individual LSP? Analogous to the conclusion drawn by Levallois [
52] as well as the European Commission in the White Paper Transportation [
53], de-growth or limitation of growth would not be an option as it would counteract the idea of balanced development also in an economic and social dimension. Instead, LSP strive to improve within all three dimensions as per their individual capabilities, e.g., by aiming to reduce the GHG emission volume per tonkilometer of transport service as the overall transport volume and therefore the absolute total GHG emission is out of their individual reach; see, for example, the “Carbon Efficiency Index” by Deutsche Post DHL [
8] (p. 76). This is also exemplified by specific triple bottom line missions within corporate strategies and reports (
Figure 4). Many research avenues and projects therefore address such questions, mainly aiming to reduce and optimize the logistics “footprint” [
54,
55,
56]. As was experienced involuntarily during the 2008 economic crisis, the total amount of GHG emissions can easily be reduced by lowering the overall transport volume. This is a political question at the core, not a corporate one, and further complicated by the Jevons Paradox [
57] problem as outlined by [
58,
59,
60]. However, furthering a relative measurement approach, this contribution will try to establish relative measures of sustainability performance for LSP, e.g., by comparing GHG output volumes to assets and other corporate input volumes. Therefore, in another size-related dimension, the question of corporate size and absolute transport volume does not come into play with such a comparative analysis.
4. DEA Malmquist Technique for Longitudinal Efficiency Analysis
The data envelopment analysis (DEA) method is based on the work of Koopmans regarding the activity analysis concept [
143], Debreu [
144] and Farrell in terms of the radial efficiency measure [
145], and the works of Diewert [
146]. This led to the specific DEA method suggestion by Charnes, Cooper, and Rhodes [
24]. The advantages of its increasing use in higher education research are the fact that no a priori existing knowledge of a production function is required, only real-life data is used (no hypothetical production function or efficiency values), and a multitude of inputs can be combined with a multitude of outputs, which is very typical for LSP, as complex and high-level service providers as well as other industries like health care or higher education [
147,
148,
149,
150,
151] (Karsak and Karadayi 2017; Bolli et al. 2016; Shwartz, Burgess, and Zhu 2016; Hollingsworth 2003; Bessent et al., 1983). DEA studies Decision Making Units (DMUs), which can be seen as the entities responsible for input, throughput, and output decision making [
152] (p. 22); DMUs like LSP can be evaluated and compared, showing a specific level of decision making success in terms of overall efficiency. DEA uses a non-parametric mathematical programming approach for this evaluation of DMUs’ efficiency relative to each other (comparing each DMU’s relative efficiency with the best DMU). Further it is assumed that there are several DMUs, and it is supposed that inputs and outputs comply with these requirements: (i) For each input and output, there are numerical, positive data to be chosen for all DMUs; (ii) Selected values (inputs, outputs, and the chosen DMUs) should depict the interest of decision-makers towards the relative efficiency evaluations; (iii) DMUs are homogenous in terms of identical inputs and outputs; (iv) Input and output indicator units and scales are congruent. Furthermore, two different basic models can be distinguished; the CCR model, named after the authors Charnes, Cooper, and Rhodes [
24], with constant returns to scale and the BCC model with variable returns to scale (named after Banker, Charnes and Cooper) [
25]. For both models and their efficiency measurement, the following specifications are made [
153] (p. 239):
| n | the number of DMUs to be evaluated |
| DMUj | the j-th DMU |
| m | the number of inputs to each DMU |
| s | the number of outputs to each DMU |
| xij | amount of the ith input consumed by DMU j |
| ykj | amount of the kth output produced by DMU j |
| eff | abbreviation for efficiency |
| vi | the weight assigned to the ith input |
| uk | the weight assigned to the kth output |
One basic characteristic of the CCR model is the multi-output and multi-input reduction to a single (weighted) input and output combination for each DMU. For a certain DMU, measuring its efficiency and comparison with other DMUs in the system is enabled. Usually executed by a series of linear programming formulations, the single DMU’s performance comparison facilitates a ranking of the different analyzed DMUs and scales their relative efficiency from low to high, whereby the last one is defined as 100% efficient. The CCR model contains both mathematical maximization and minimization problems. Detecting DMUs’ relative technical efficiency requires on the one hand detection of each DMU’s technical efficiency and, on the other hand, the comparison of all DMU’s efficiencies. These steps are executed in DEA’s simultaneous arithmetic operation. The calculation of the DMU’s efficiency value results from the consideration of the weighted inputs and weighted outputs. With the help of quantified inputs and quantified outputs, DEA generates via a quotient one single efficiency ratio for each DMU. The weighting factors are endogenously determined and allow the pooling of heterogeneous inputs and outputs with different units of measurement in one efficiency ratio. Hereby, each DMU’s weights are considered optimally in order to maximize the efficiency value and determine only the definitely provable inefficiency. The analysis for the maximization problem is attached to each DMU, which means that for n DMUs, the quotient needs to be solved. This is done by transforming the quotient into a linear programming problem. With the help of the following figure, the different scales of CCR and BCC are depicted in the case of a single input and a single output.
Based on early works of Malmquist [
31], Caves, Christensen, and Diewert [
154] proposed a calculation of a productivity index in order to shed light on efficiency changes over time. This new longitudinal perspective is especially promising for the DEA method as most efficiency measurement approaches are directed towards the question of efficiency improvement. In order to provide usable information for this objective, the index is therefore distinguishing between a technological progress for the whole set of DMUs, as for example universities, individually adapted for each institution, on the one side and the technological efficiency on the other side [
32]. This second technological efficiency is caused by the organizational and process setup of an institution.
The following formula depicts the mathematical distance function algorithm used for the Malmquist Index [
33]:
A series of applications do exist for this specific longitudinal efficiency analysis, as shown for example by Thanassoulis, Shiraz, and Maniadakis [
155] for water and gas companies from different countries, Emrouznejad and Yang [
156] for CO
2 emissions of Chinese manufacturing, or Sueyoshi and Goto [
157] for the environmental evaluation of petroleum companies. This highlights also the advantage of the Malmquist index in allowing for an efficient development of decomposition, i.e., compared to DEA Window analysis or other efficiency evaluation methods.
5. Research Results
The calculation results have been obtained for the presented input and output data in the timeframe 2006 to 2015 while applying an output-oriented DEA Malmquist index model with the software BANXIA Frontier Analyst for the analysed European LSP.
Due to specific calculation setups and evaluation perspectives, the following 16 different DEA application runs were implemented in this research paper (see
Table 2). The variation of constant versus variable returns to scale (“CRS/VRS”) refers to the model differences outlined above in
Section 4 regarding the production scale assumptions. As there are no similar calculations for LSP known, it makes sense to calculate and compare both model types. The further question of one or two input types relates to the fact that the input type assets may be scrutinized for application with LSP due to the question of different strategy setups (“asset-light” versus “asset-heavy” strategies, as discussed later in
Section 6). Finally, the question of weighting is based on the theory regarding the suitable size of the DMU as well as the question of a sensible discrimination level in combination with the concept of the balanced triple bottom line discussed here.
In order to achieve sensible discrimination levels [
158] as well as paying attention to the idea of a balanced triple bottom line sustainability evaluation, weightings are introduced as otherwise (and seen in the 0% weightings case), due to the methodological nature of the DEA technique [
24,
159], nearly all LSP and annual datasets are deemed to be 100% efficient as with the current low number of DMUs compared to the relatively high number of input and output types. Each DMU may find a “specialized” output type at which to excel. Therefore, forcing the DEA technique to acknowledge at least every applicable input and output type with a certain minimum weighting is seen as a sensible variation idea (5%, 10%, and 15% weightings applied,
Table 2).
As expected, the results show that, for the aggregate efficiency results (arithmetic mean, median, minimum, and standard deviation values for all 50 calculated data items per run), the differentiation level rises with (i) increasing weightings; (ii) CRS over VRS model applications; and (iii) one input versus two input types. This is explained according to a theory of decreasing “freedom” along the lines of (i), (ii), and (iii) for the individual efficiency optimization and calculation for each DMU in the subsequent models from run I to run XVI. According to the method theory, see [
160,
161], as VRS models are wielding different results from the CRS models, the supposition of variable returns to scale (VRS) is the more appropriate model application in this specific scenario and dataset. Regarding the number of inputs, as there are only slight differences experienced with this distinction, the application of two inputs seems to be legitimate as this also includes a richer information base (including asset volume). Third, the question of weighting seems to lean towards the maximum possible minimum weighting of 15%, as in these cases (XIII and XIV) the differentiation level is sufficiently high. One might argue that the “fixed” weighting volume of cumulated 75% may be too high and switch to the 10% (cumulative 50%) variant (runs IX and X), but, again, this does not signifies a major difference. Run XIII is exemplified further for discussion, especially regarding the longitudinal perspective.
Quantitative results for all 16 calculation runs are outlined in detail in
Appendix B at the end of the paper. Here the main results are provided in an aggregated figure outline as the basis for the subsequent discussion of results (
Table 3 and
Figure 7). From the results depicted in
Table 3, it is obvious that at least in a VRS case, as applicable here, the large number of output types as required by a triple bottom line perspective allows most DMU to reach a 100% (1.00) efficient evaluation over all indicators, even in the here applied minimum weighting of 15% for five indicators applied here (asset and revenue volume, GHG emissions, employees, and women participating in management). Only Deutsche Bahn (Schenker) and DSV are not able to achieve the production frontier in this case with decreasing (DB Schenker) and increasing returns to scale (DSV) positions respectively. This would translate into the management advice that DB could increase its sustainability efficiency by reducing the overall size and production volume, whereas DSV is too small to reach efficient levels and therefore should increase corporate size and production, meaning transportation service, volume.
6. Discussion
For a detailed discussion regarding the results presented above, among others, the following items may be worthwhile to explore:
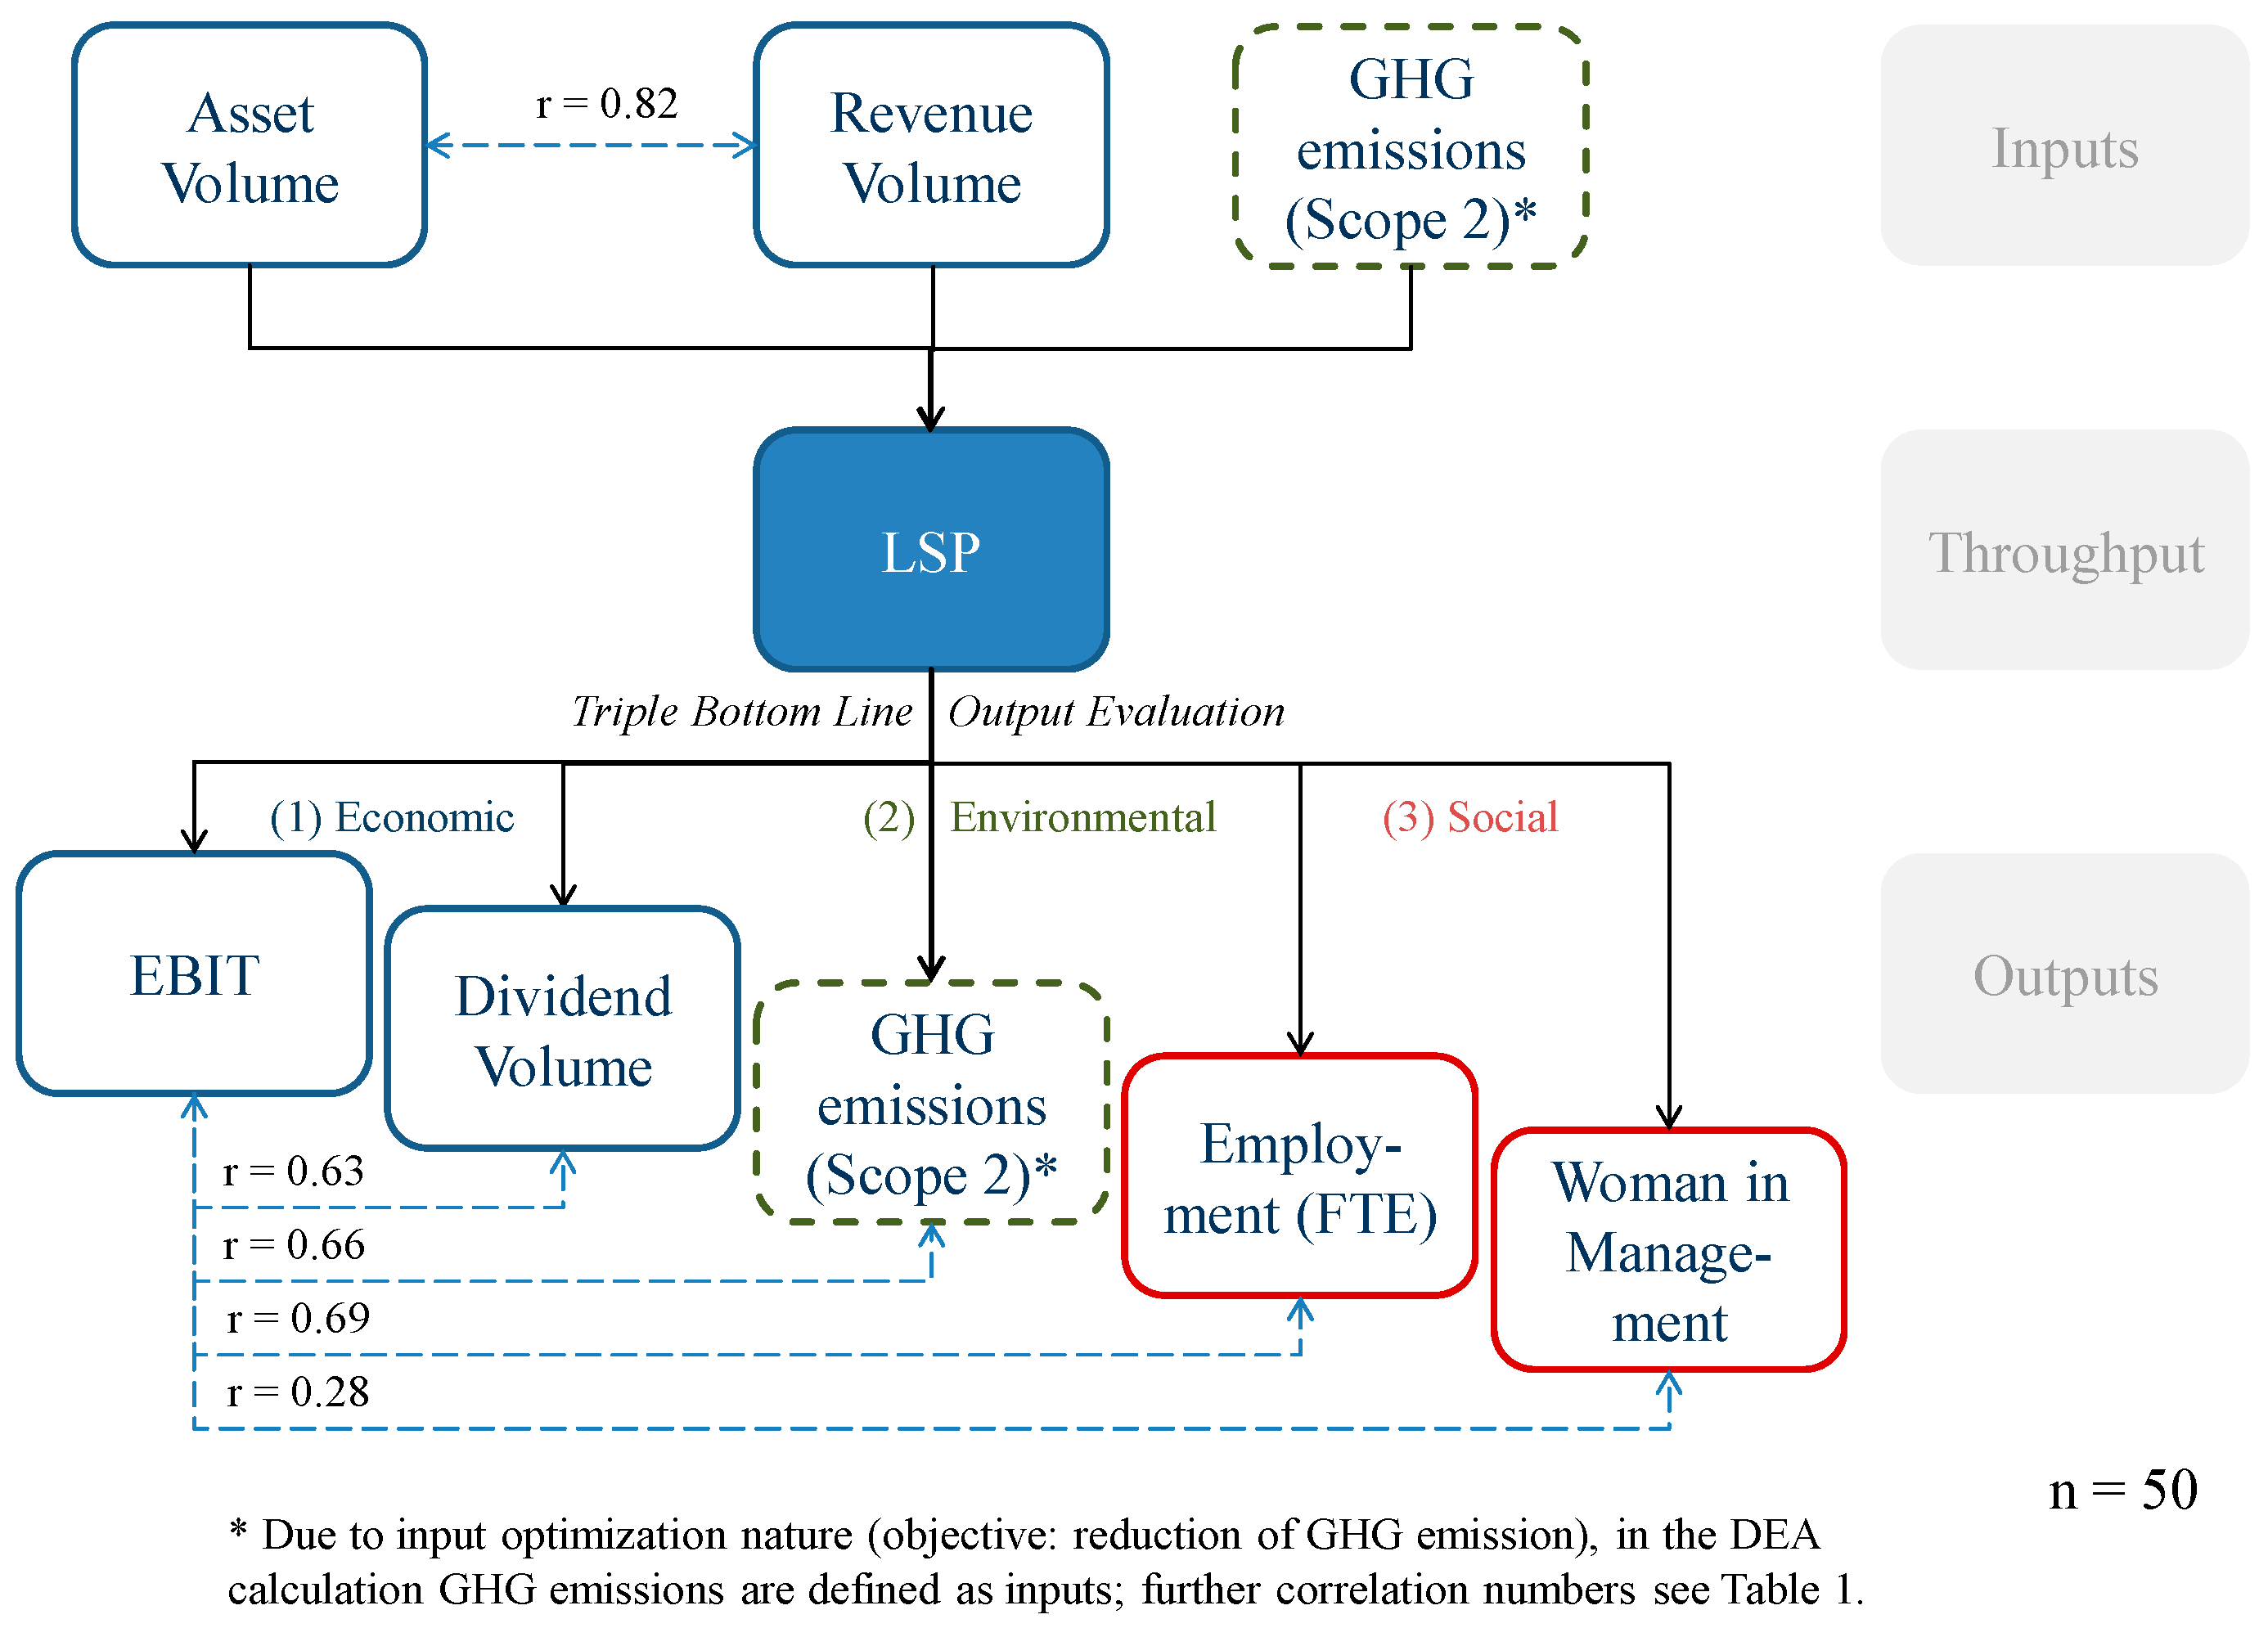
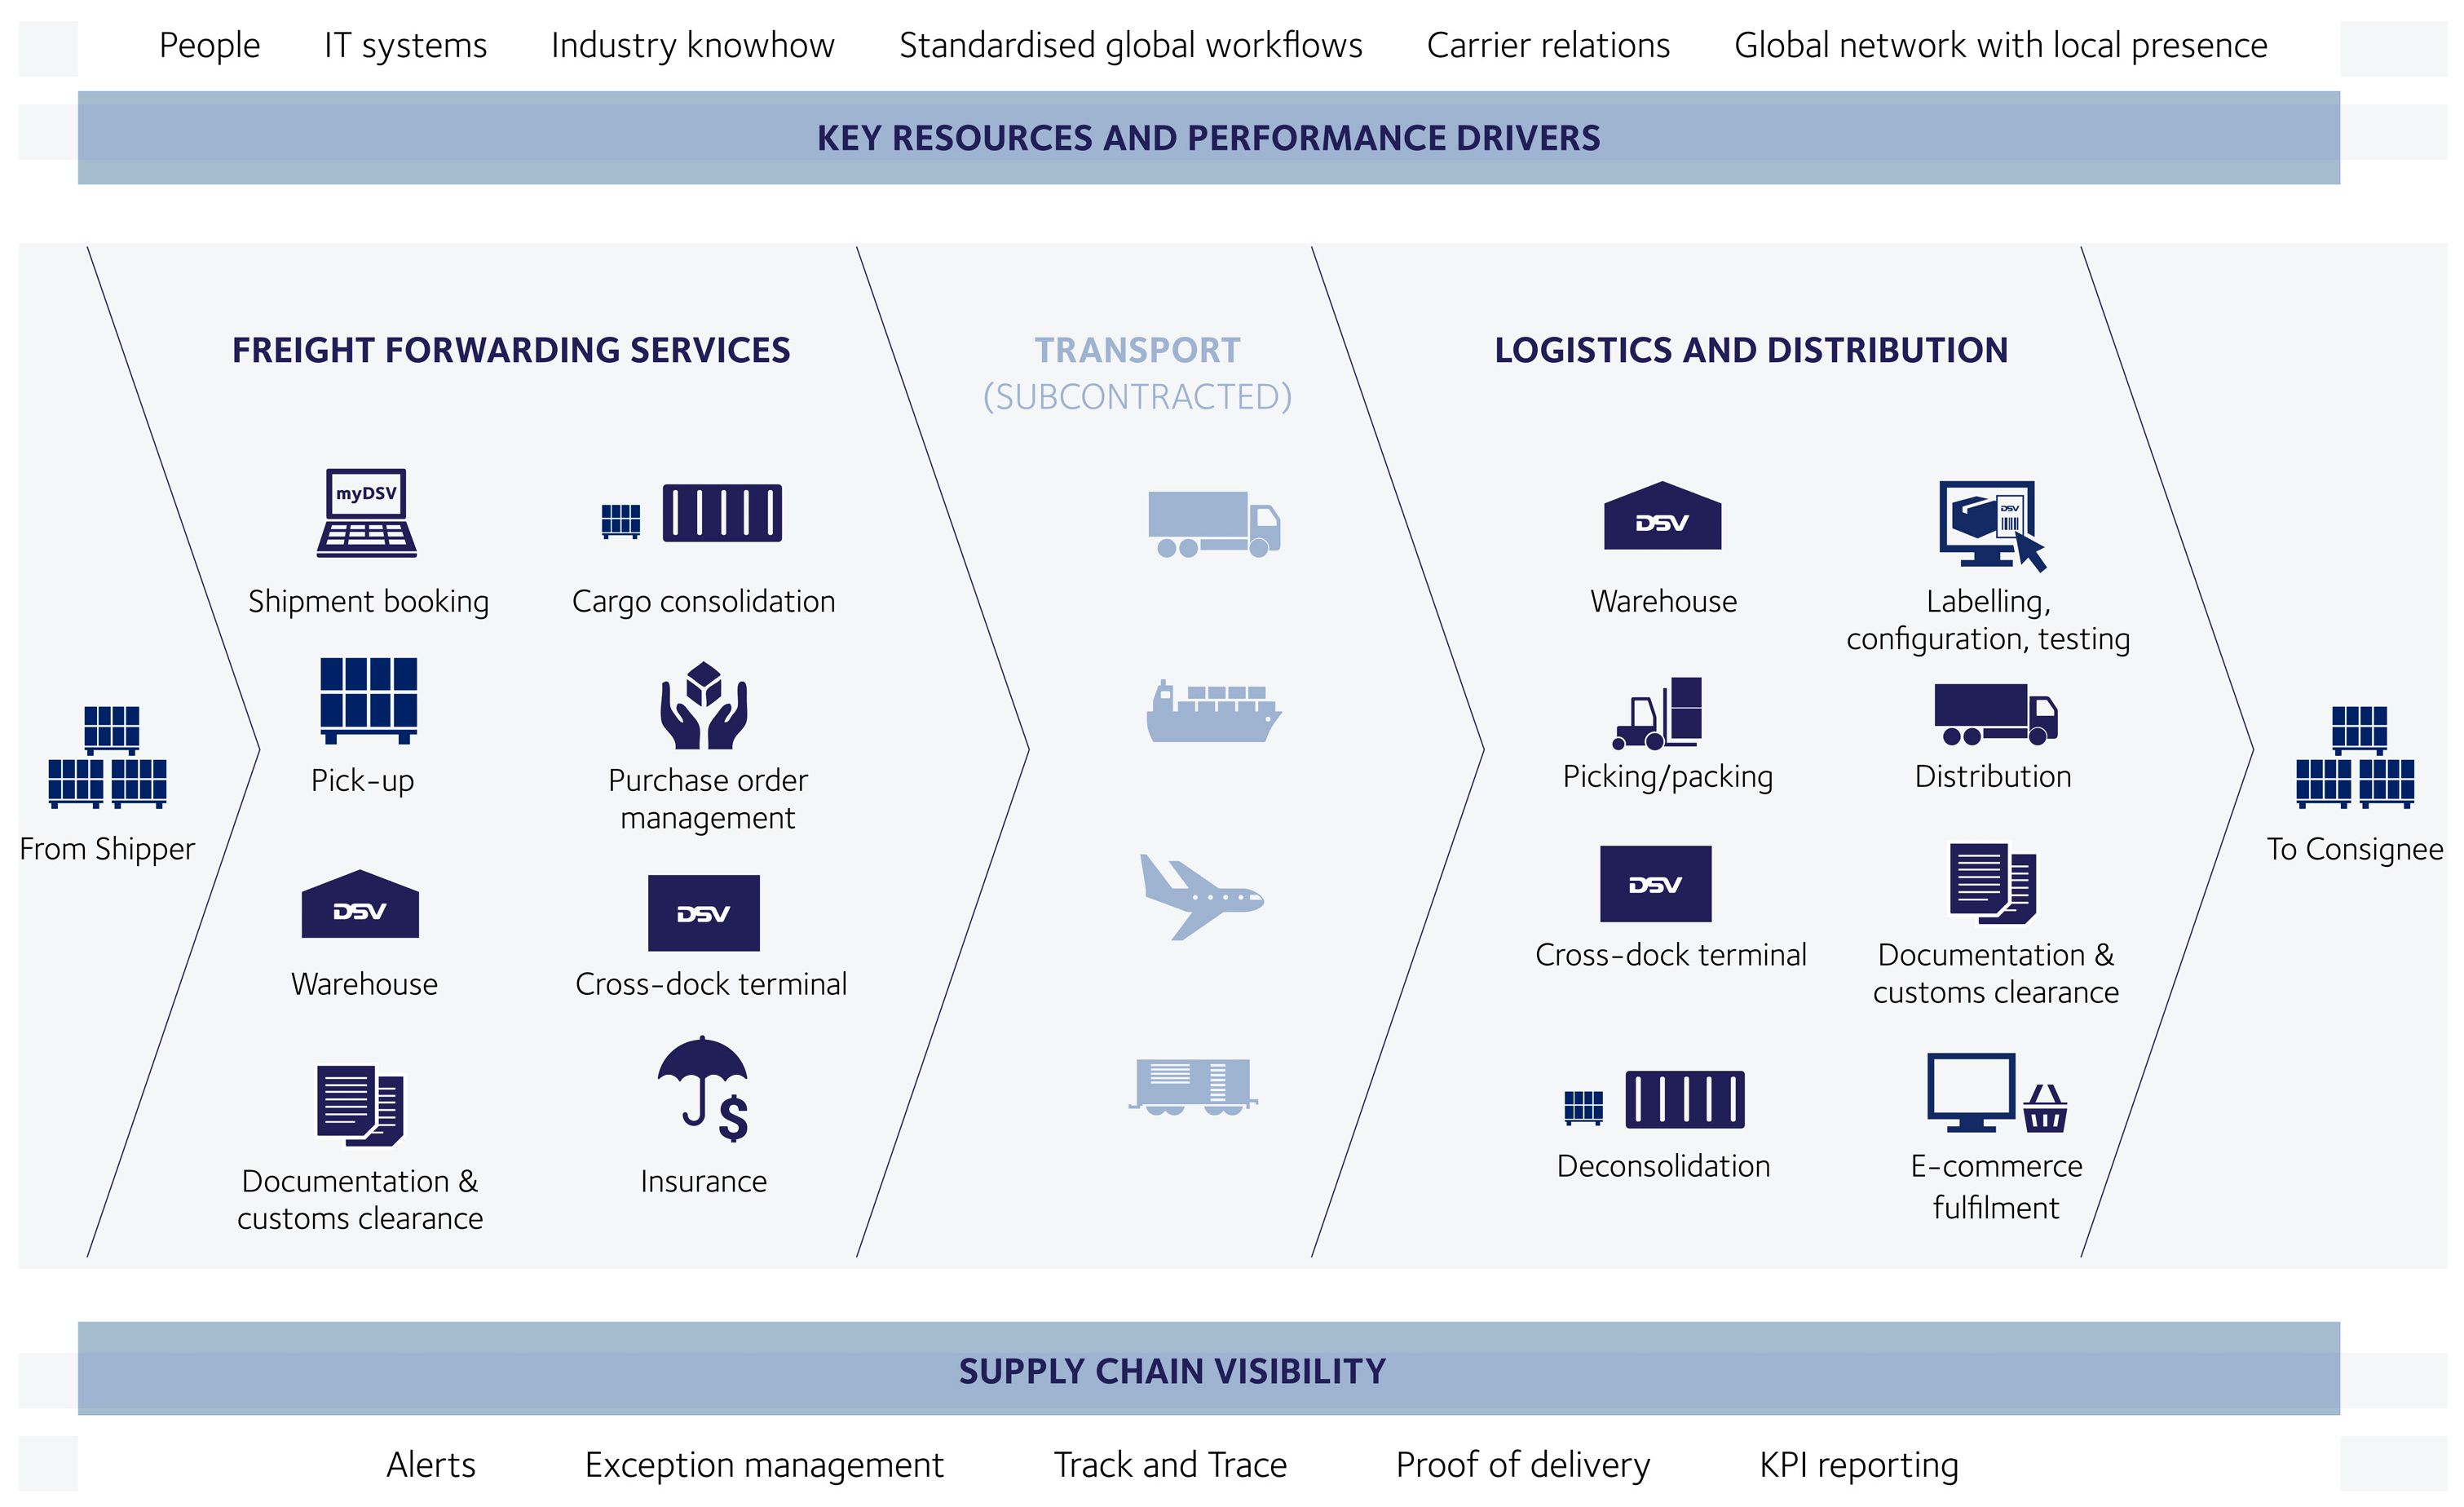
(I) In a qualitative evaluation of the used indicators and data it may be outlined that though many selection and application decisions in this context, e.g., the use of revenue as input indicator, may be counter-intuitive, the specific production theory context in a sustainability evaluation can be argued to be distinctively different from standard input-output and economic analysis settings. Therefore, the use of assets as well as revenue as a form of corporate size in terms of input is justified. Furthermore, the comparative accuracy in these two cases is very high as IFRS and reporting standards prohibit companies from deviating too much from a common ground of definition, analysis, and reporting. For output measures, the economic indicators of EBIT and dividend volume are to be judged viable and sensible too, as the results show. The environmental indicator of scope 2 GHG emissions has proven to be of interest in terms of efficiency development over time but not so in an inter-company comparative perspective. As scope 2 only reports corporate direct and indirect emissions but not emissions by suppliers and subcontractors, different business structures between LSP influence the scope 2 amount too heavily.
For example, whereas Deutsche Post DHL operates its own aircraft fleet and reports high levels of scope 2 GHG emissions due to that, Panalpina does not employ its own planes but only subcontractors and has therefore significantly lower levels of scope 2 GHG emissions (the same is true for DB Schenker versus Kühne + Nagel and partly DSV). Sensible comparative figures are only to be expected with full disclosure of scope 3 GHG emissions throughout the whole supply chain, which are hard to obtain throughout the multi-level subcontractor structures in logistics. This inherent problem with forwarders as brokers of transportation, not necessarily but also possibly including own transport activities, is captured in the model figure for DSV below.
(II) Plain efficiency results show that among the five selected European LSP, DSV is the least resilient and performant regarding sustainability efficiency in a triple bottom line perspective with the implemented indicators. Already having a 0% minimum weighting restriction, meaning each and every input and output indicator may be individually weighted up to 100% for each DMU, there are single annual data points for DSV (2009, followed by 2011) with an inefficient overall calculation value. This is followed by DB (Schenker) as the next least sustainably efficient LSP in the dataset, with inefficient annual values for 2014 and 2015 from a minimum weighting of 5% for the indicators. On the other side, LSP DHL, Kühne + Nagel, and Panalpina only show inefficient data points in the applied CRS models. Significantly, in all cases, Panalpina is selected as the efficient reference technology, singling it out as the most efficient DMU included in this analysis on all accounts. As DHL is additionally experiencing very low levels of efficiency in the VRS model runs, it can be claimed that especially the two medium-sized, asset-light LSP without government ownership and influence, namely Kühne + Nagel and Panalpina (both also legally seated in Switzerland) are the prominent leaders and benchmarks compared to the other LSP. Further research would have to determine which of the differentiating factors (medium size, asset-light forwarder strategy, and being devoid of government ownership and influence) may be the most important one for the characteristics of an excellent sustainability efficiency as shown here. As a hypothesis for further discussion and research the following proposition may be formulated:
‘It is proposed that medium-sized, asset-light LSP without government ownership and influence may have a competitive advantage in reaching high sustainability efficiency levels in a long-term perspective.’
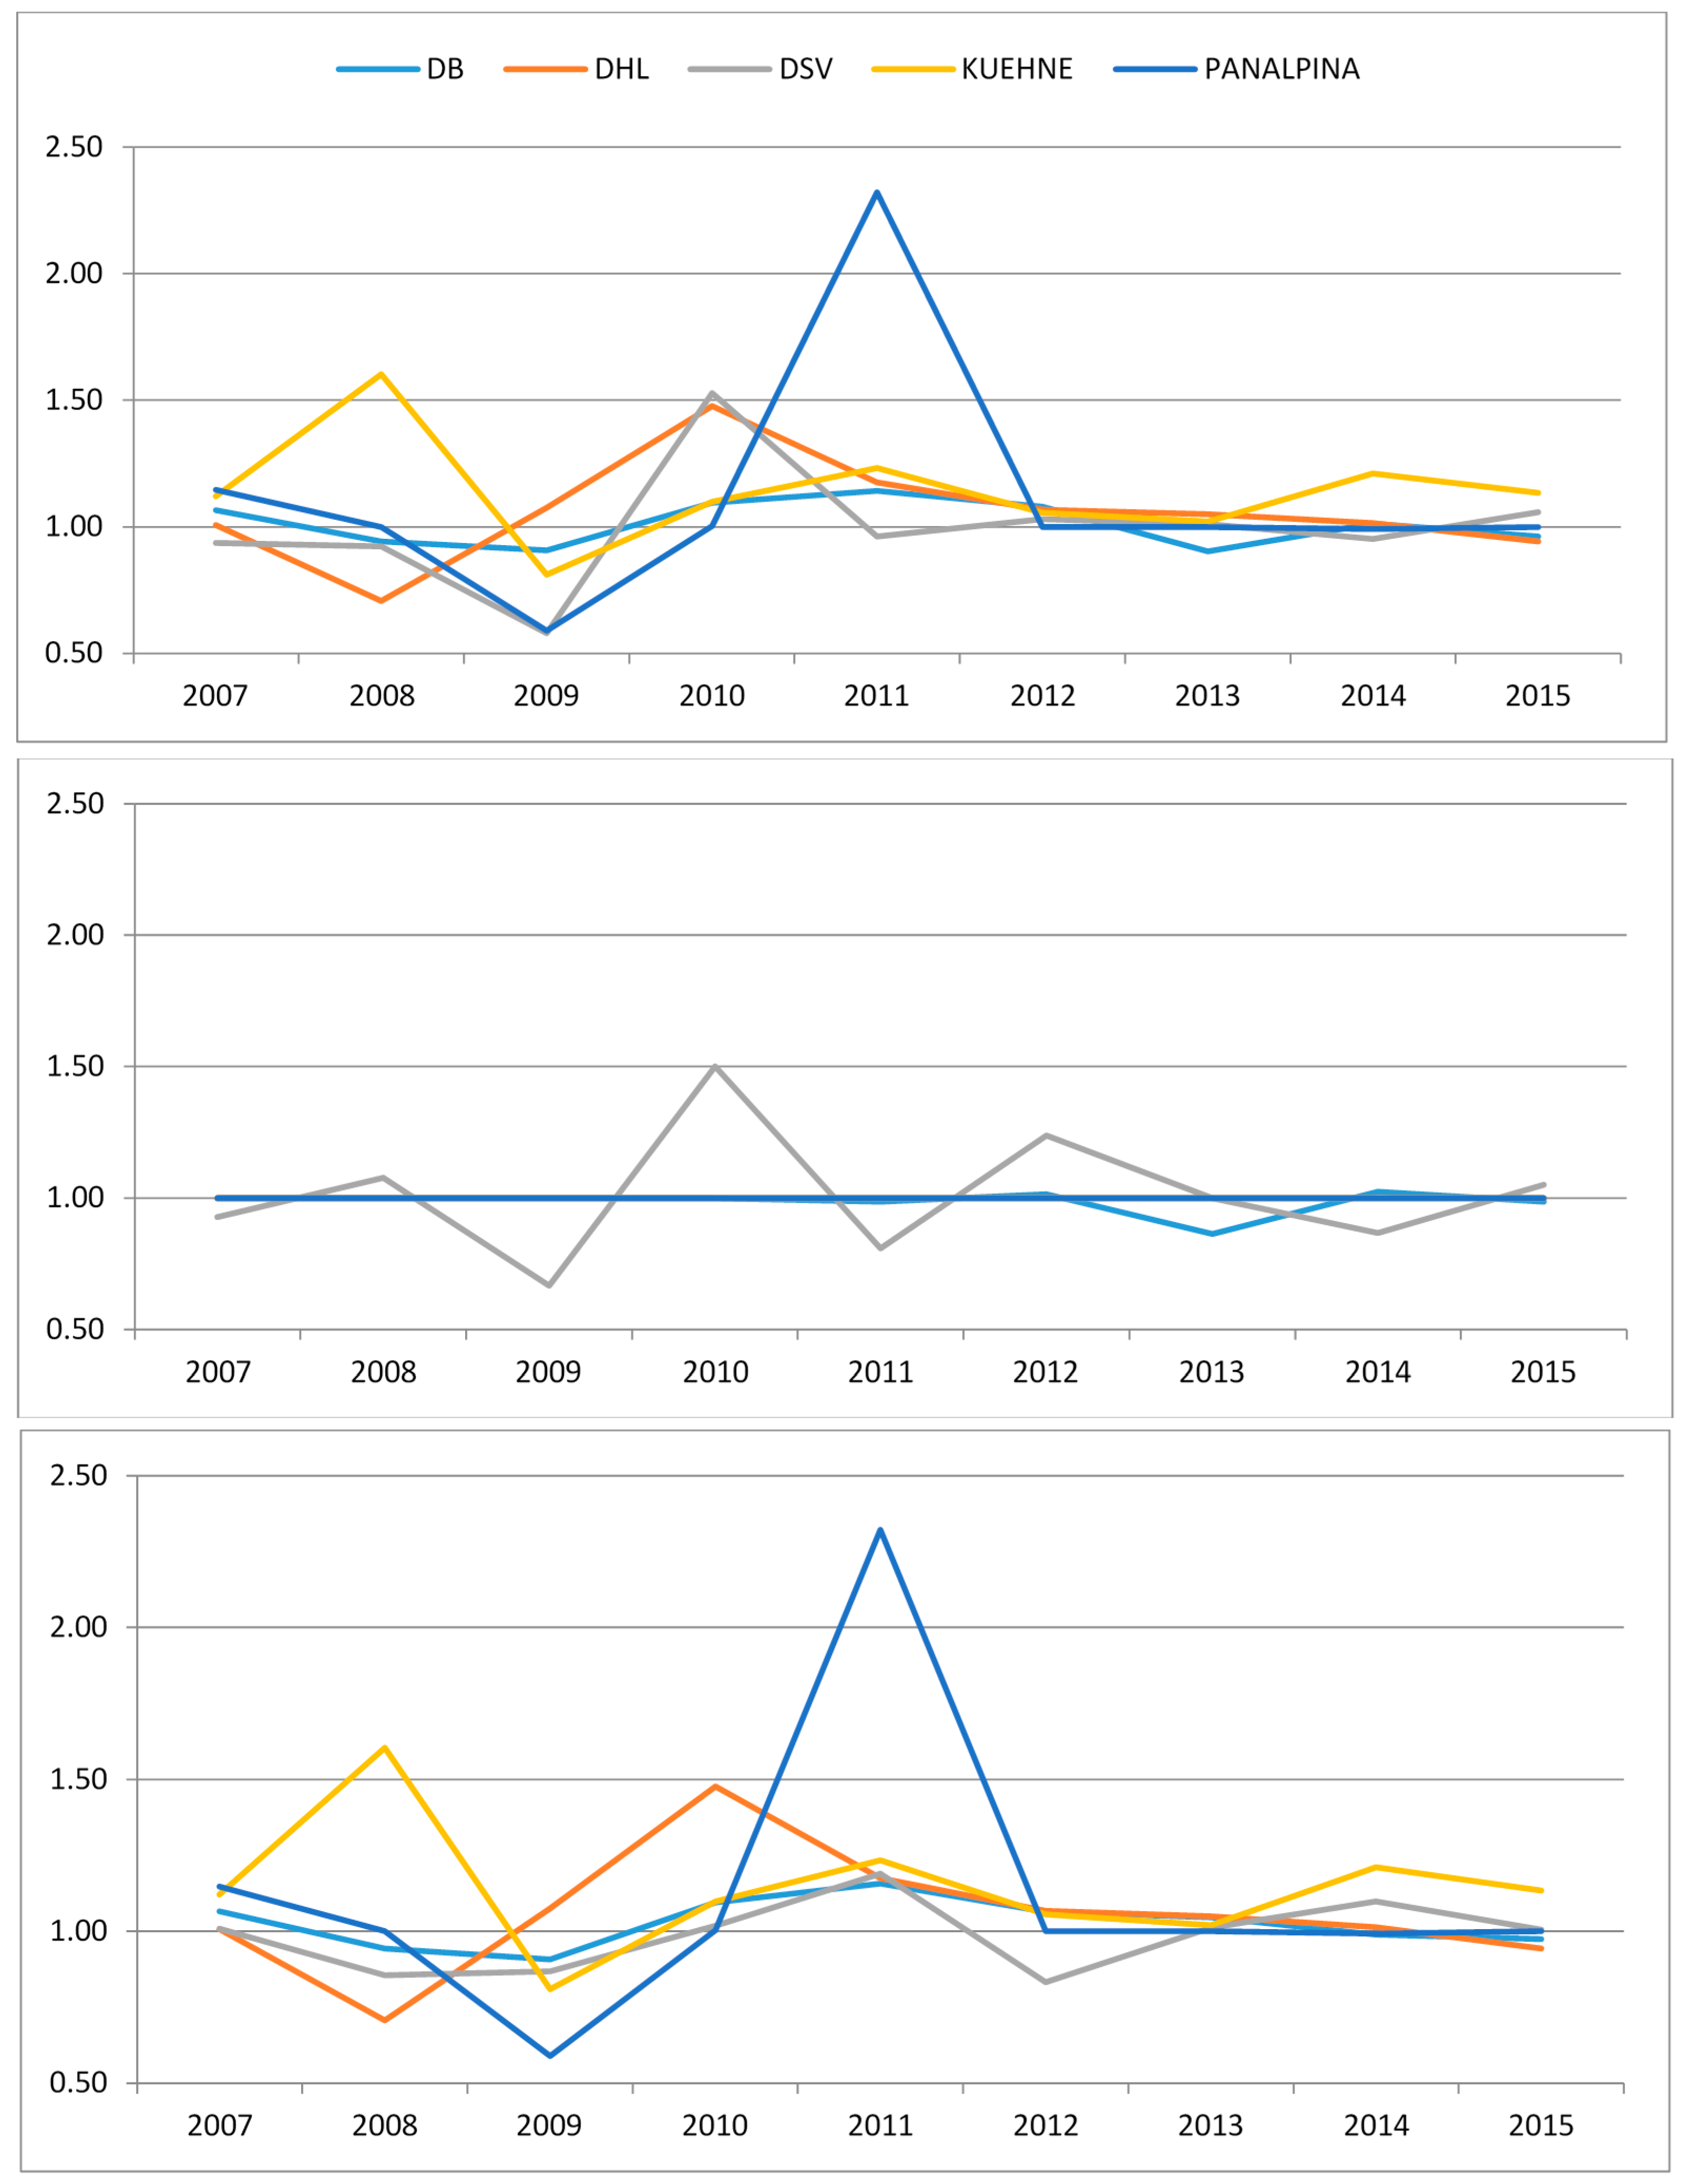
(III) Longitudinal developments over time (
Figure 8) furthermore provide the result that obviously the same distinction as recognized before holds true also for longitudinal development. Whereas DSV and partly DB Schenker are experiencing significant inefficiencies and therefore are predominantly occupied with catch-up developments (middle picture), the other three LSP are actively pushing the efficiency frontier (lower picture), e.g., Kühne + Nagel in the year 2008 due to a very resilient economic posture in spite of the global economic crisis; in 2010 Deutsche Post DHL; and in 2011 Panalpina due to significant EBIT and dividend volume increases. Those two different parts are adding up to the overall Malmquist Index development perspective (upper picture), where it can be seen that sustainability efficiency development seems to be a “shaky” business. Obviously for each LSP and business year, different tendencies occur, and no single LSP is able to sustain efficiency improvements throughout all 10 years (nine change years towards the base year 2006 seen here). This can be connected to the standard business cycle and consolidated into a comprehensive further hypothesis as the proposition of a “triple separation business cycle” model, in which, as in
Figure 9 below, the typical growth and crisis phases of economic, environmental, and social indicators move in with the same volatility and sequence (“business cycle”) but with a significant shift. For example, compared to the economic business cycle of growth and crisis, as experienced within the analysed timeframe of 2005 to 2016, the social indicator of employment is shifted to the future by one to three years. Meaning that, as experienced in the dataset analysed here, the peak of employment does not occur at the same time as the peak of revenues and profit as economic indicators but is due to employment and dismissal restrictions for employers significantly later. Thus, in the case of the analysed LSP here, the peak of employment was around 2009/2010, later than the economic peak before the 2008/2009 crisis. On average, significant workforce reduction obviously needs a time lag of about one to three years depending on (national) workforce regulations, specialization, and qualification of employees and other factors.
A similar shift but in the other direction is experienced with environmental factors, e.g., emissions for GHG. Already in the first cooling phases of an economic cycle, transportation volumes are reduced significantly as stock levels are not replenished in full in anticipation of an oncoming crisis. Again, this was experienced in the current dataset as GHG emissions were lowest slightly before the 2008 to 2010 business crisis. Such behavior as depicted in
Figure 9 would explain the described “shaky sustainability efficiency” development found in the DEA Malmquist index data. As the “optimal” points regarding the three dimensions are distinctively separate in the typical business cycle, it is hard for any LSP to arrive at a steady and balanced sustainability development.
(IV) Furthermore, the crucial and high-influence role of government ownership within the (German) logistics sector is to be reviewed critically. Two out of five analysed LSP, Deutsche Post DHL and Deutsche Bahn/DB Schenker, are partly (DHL: indirectly via KfW 20.9%, see [
8], p. 71) or wholly (DB) owned by the German federal government. This can be seen as unwarranted misuse of a competitive market as many research and political critics interpret it [
163,
164]. Though privatization of these government monopoly actors has been implemented a long time ago, their influence is still large, especially with the network infrastructure problem with Deutsche Bahn, currently financed by the federal government but on long-distance tracks exclusively used by Deutsche Bahn (monopoly). This has to be reviewed closely and critically, as pointed at by the European Commission as well as the German national competition regulator, in order to avoid undue market bias in transportation [
165,
166]. Depending on such evaluation and judgement, the inclusion of such government-owned entities in a comparative sustainability analysis as conducted here can be put in doubt. As both companies still act in a very competitive and global market environment, this risk is not seen as striking at the moment though. Nevertheless, the fact that, especially for DB (Schenker), the analysed VRS cases indicated a quite seldom “decreasing returns to scale” situation, this should be further discussed and researched. Such “DRS” situations signify that the DMU in question would be able to increase its efficiency posture by decreasing corporate size and production volume. Therefore researchers, cartel watchers, and politicians alike should be inclined to scrutinize Deutsche Bahn/DB Schenker holdings further if potential downsizing and imposed de-segmentation could be of interest for the public as well as the corporation itself in terms of overall efficiency.
(V) Special emphasis may be put on the innovative role of employment indicators, used in this analysis as the social output performance area. Historically, management science has viewed this indicator predominantly as input factor, but, in light of the social sustainability dimension as well as the major importance of the economic and political arena in our societies, it is more than time to re-evaluate this narrow view. As with third party funding for higher education analysis, factors may play distinctive roles as input as well as output indicators. For third party funding, for example, it is acknowledged in university efficiency analysis that this special area of analysis has input characteristics (financing further input factors like personnel or research expenses) but is at the same time in the majority of applications used as a suitable quantitative indicator for research output and excellence, cp. [
148]. This could be applied to the question of employment and FTE indicators in a comprehensive sustainability evaluation in the same fashion. Whereas personnel and especially personnel expenses are possibly used as input measures, it shall be established within the social dimension of the sustainability triple bottom line that FTE quantities are also a reliable measure for the social performance and positive impact of any corporation, as suggested here for logistics.
(VI) Finally, even accepting the limited influence of LSP towards the overall setup of global supply chains (e.g., the trend towards longer transportation distances due to sourcing, production, and retail sites farther apart), on a strategic long-term level there may be a further problem. As described by Jevons, the rebound effect may lead to the consequence that, with increased sustainability efficiency, the increased use of transportation resources may lead to an overall absolute increase in negative sustainability impacts. For transportation in general, this is outlined by Wang and Lu [
167], Winebrake et al. [
168], or Matos and Silva [
169]. In order to identify such rebound effects for the specific triple bottom line objectives and indicators suggested here would have to be tested in further research, but a similar rebound effect may not be rejected out of hand in light of the existing research results.
7. Conclusions
This paper has pointed at the research gap of missing longitudinal DEA Malmquist index measurements for the triple bottom line sustainability performance of European LSP. Several important results and conclusions may be highlighted from this first-time application. The initial research question can be answered positively as the presented results show that the DEA Malmquist index application is feasible for LSP in a sustainability efficiency evaluation regarding triple bottom line objectives, and such an application wields interesting results. Further of interest is the fact that medium-sized LSP like Kühne + Nagel as well as Panalpina were reveaked as efficiency leaders in such a triple bottom line sustainability evaluation. In the proposed longitudinal perspective, it is recognizable that all LSP struggle to keep up sustained positive improvements in comprehensive sustainability efficiency; this led to the suggestion of a triple separation business cycle model in which social development lags behind and environmental development precedes economic development indicators for LSP within the business cycle. The suggested indicators like employment for the social dimension of the triple bottom line are found to be very interesting as, especially in a traditional efficiency and production analysis setting, such indicators would have to be used as input types but are employed here as output types. The discussion connected to this question should be continued regarding the further exploration tof a deeper and richer social dimension of the triple bottom line for LSP, as suggested by Wieland, Handfield, and Durach [
170]. The established indicators within this DEA Malmquist index calculation, including asset and revenue volume as input types as well as EBIT, dividend, GHG emissions, employment, and women participating in management as output types, have been proven to signify research and management science value in their result output. Other research project should connect to these results and further the discussion regarding appropriate sustainability indicators on the base of the triple bottom line. Also, further trends and developments in the logistics and supply chain management domain as outlined by Fawcett and Waller or Brockhaus et al., see [
171,
172], would have to be connected to the efficiency developments of European LSP in a comprehensive sustainability setting.
Furthermore, the following five further research items could stem from this initial research regarding a longitudinal sustainability efficiency evaluation of LSP. First, the proposed intersecting and opposing development of the three triple bottom line perspectives during a typical business cycle would have to be tested and verified further. Second, the important influencing factors of corporate size, asset strategy, and government ownership and influence would have to be scrutinized further in subsequent research endeavors. Especially interesting would be which of these three aspects contributes more to explain LSP inefficiencies in a sustainability evaluation perspective. Third, it could be of interest to analyse the proposed “shaky development” further, i.e. if this holds for LSP seated in other world regions as well as during other business cycles outside the timeframe 2006 to 2015 analysed here. Further confirmatory research with larger numbers of LSP included would be important for advancing the frontier of knowledge and management science application for sustainability management within LSP. Fourth, the question of efficiency should be connected to the field of regulation [
173], e.g., with the question of whether enhanced regulation would increase or decrease sustainability efficiency, at least in the triple bottom line concept perspective. Fifth, the method comparison between the DEA Malmquist index and the alternative DEA window analysis should be explored further, see [
174].
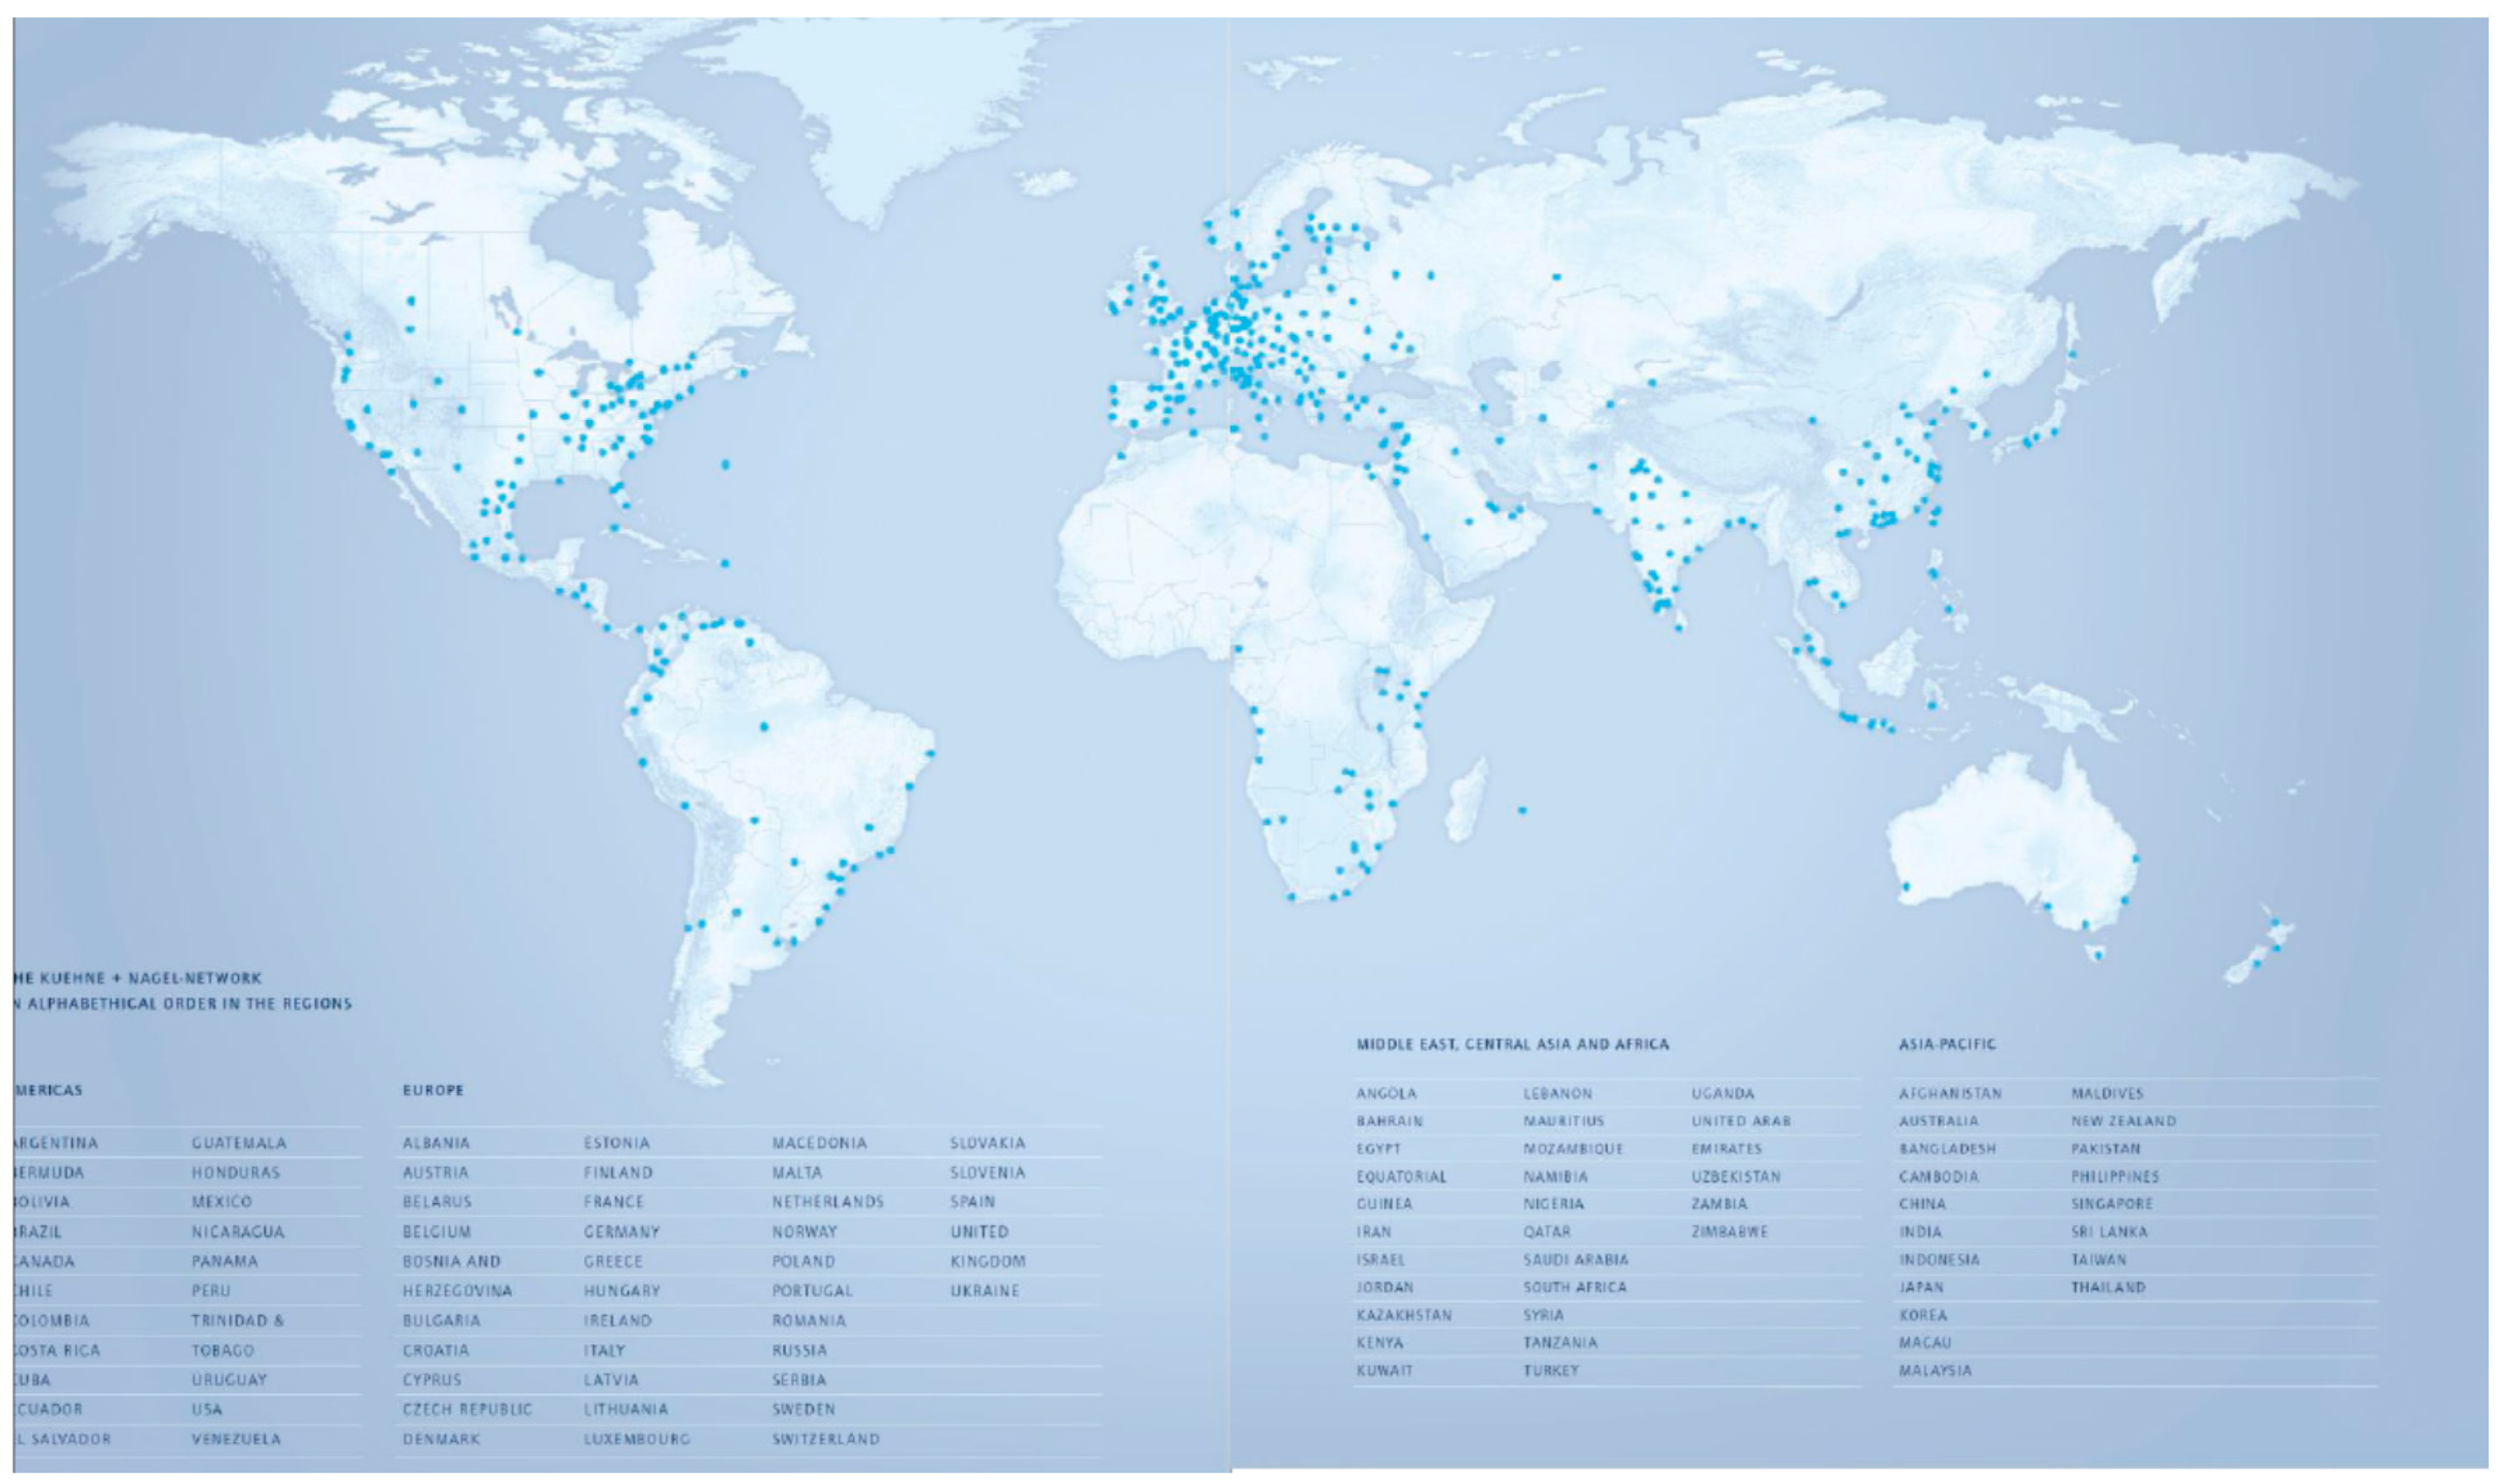
Finally, as indicated in the introduction, the future evaluation and discussion of sustainability performance by LSP should be considered paramount to sustainability management in general as, in a time of global supply chains, LSP are a central key and cornerstone of any value chain for any given product in worldwide markets. This is uniquely depicted by the below map of an example world-spanning LSP network (in this case Kühne + Nagel,
Figure 10). Therefore, it can be deemed a special responsibility towards sustainability and our planet for LSP to cater to the needs of human and global sustainability development as far and wide as technology allows.


