1. Introduction
Precipitation is crucial input parameter of the global hydrological cycle [
1,
2] and an impetuous factor contributing to natural disasters like droughts and flooding [
3]. The performance of different hydrological, meteorological, and climate models depends on the accuracy of precipitation inputs. These models are used in reliable modeling, monitoring, and quantification of floods, drought assessment, landslides, agricultural production, and sustainable water resource management. Moreover, understanding of the spatial and temporal variability of precipitation is significantly important under climate change [
4,
5]. The spatial and temporal variation in precipitation pattern significantly affects socioeconomic factors such as disaster management, food security, ecosystem health, and hydropower generation [
6,
7,
8]. Therefore, accurate precipitation estimation with high spatiotemporal resolution on a regional scale is essential for significant hydrological predictions. However, this is still a challenging task for the developing countries like Pakistan because of the sparse surface precipitation gauge (SPG) network and highly complex topography [
9,
10,
11].
Most widely used techniques for precipitation measurement are in situ measurements (SPGs), and commercial microwave products such as ground-based radars and satellite-based sensors [
4,
12]. There are numerous errors associated with distribution and readings of SPG as discussed in [
13]. Furthermore, the SPG measurements are in situ, which is difficult to describe the spatial variations in precipitation on a regional scale. To overcome these uncertainties, the utilization of satellite-based precipitation products (SPPs) to measure global or regional precipitation has increased significantly over the past thirty years [
14]. In poorly or ungauged regions, SPP estimation techniques may be opted due to unavailability, uncertainty, and quantitative self-consistency of SPG data [
15]. At present, the development of high-resolution SPPs has provided unprecedented opportunity to monitor the spatiotemporal variability in precipitation on a global scale, particularly at high elevation where ground-based information is scarce or not readily available [
16,
17,
18]. A detailed description of the most widely used SPPs can be found in a past work [
19].
A number of researchers evaluated the performance of these SPPs on the regional and global scales, such as Asia [
3,
20,
21,
22,
23], Africa [
24,
25,
26], North and South America [
27,
28,
29,
30], Europe [
31,
32,
33,
34], Australia [
35,
36,
37], and others [
14,
38,
39,
40,
41]. These studies conclude that GPM IMERG showed better performances than TRMM products across many countries of the world with different climatic conditions. Most of the SPPs showed weak performance in precipitation detection and resulted in high mean errors in regions having rapid precipitation gradients with complex terrain.
A very few studies are conducted over Pakistan [
9,
10,
11,
42,
43,
44]. Cheema and Bastiaanssen [
9] calibrated TRMM-TMPA on a monthly time scale over the Indus Basin for runoff and soil water balance studies. Results revealed that TMPA overestimated the precipitation in high ranges and foothill plains, whereas underestimated precipitation in northwest and coastal areas compared with SPG data. Khan et al. [
11] conducted a study to assess TMPA-v7 Real Time (RT) and Adjusted (Adj) TMPA and CMORPH-RT during the monsoon season on a daily temporal scale. The result revealed that TMPA-Adj v7 and CMORPH overestimated the precipitation over high altitudes in the study area. Overall, TMPA-v7 performed well as compared to other precipitation products. Anjum et al. [
44] assessed the improvements of TMPA-v7 over TMPA-v6 on a basin scale study over the Swat River watershed (14,039 km
2). Results showed that both the magnitude and spatial variation were not captured accurately using TMPA-v7 and v6 on the annual and seasonal scales. However, both the products showed improved accuracy on a monthly time scale than daily precipitation estimate. Hussain et al. [
43] evaluated the performance of CMORPH, TMPA, and PERSIANN data sets over three geomorphological climate zones: plain, mountain and glacial regions of Pakistan. Their results indicated that all SPPs captured the precipitation pattern accurately but overestimated the precipitation at glacial, whereas good performance over the mountain region as compared to plain zones. Furthermore, they concluded that the Adjusted (Adj) versions of SPPs outperformed their respective real-time (RT) versions. Muhammad et al. [
42] proposed an ensemble algorithm based quantification of precipitation and assigned relative regional performance weights to IMERG research (IR), IMERG real-time (IT), and TRMM 3B42 (RT) to produce regional precipitation (RP) estimates. The results showed that the proposed RP algorithm provided significant agreement with SPG observations. Iqbal and Athar [
10] validated TRMM-TMPA with SPG data and Asian Precipitation-Highly-Resolved Observational Data Integration Towards Evaluation of Water Resources (APHRODITE) named as APH data. The result revealed that TMPA slightly overestimated the precipitation at daily, monthly and annual scales compared with SPG and APH based observations, but the correlation with SPG observation was stronger compared with APH. Based on the seasonal evaluation, TMPA overestimated both SPG and APH based observations during the pre-monsoon and monsoon seasons whereas underestimated during the post-monsoon and winter seasons. Moreover, the performance of TMPA in plain- and medium-elevated regions was better in comparison with high elevated regions.
Generally, in Pakistan, the literature demonstrated that TRMM (RT and Adj) and TMPA performance is better in plain and medium elevated areas, however, both the products overestimate the precipitation in mountainous and glacial regions in the north and coastal areas. Based on the studies conducted over Pakistan, it is concluded that the performance of different SPPs shows significant temporal (daily, monthly, and annual), seasonal (pre-monsoon, monsoon, and post-monsoon), precipitation intensities, climate, and geotopographic dependency. Most of the studies conducted in Pakistan evaluated the TRMM-TMPA, PERSIANN, PERSIANN-CDR, and CMORPH. However, GPM-IMERG is still to be evaluated against other SPPs in Pakistan.
The objectives of this study are twofold: (1) to evaluate the GPM-IMERG with previously evaluated SPPs in Pakistan such as TMPA_3B43 v7, PERSIANN, and PERSIANN-CDR based on climate and topographic diversity and seasonal precipitation variation, i.e., pre- and post-monsoon, monsoon and winter seasons and (2) to select best SPPs and propose an Ensemble Precipitation (EP) algorithm and its evaluation with the selected SPPs in Pakistan. Unlike many other studies available in the literature, a novelty in this study is the development of the EP algorithm by applying the paired sample t-test and principal component analysis (PCA) methods.
2. Materials and Methods
2.1. Study Area
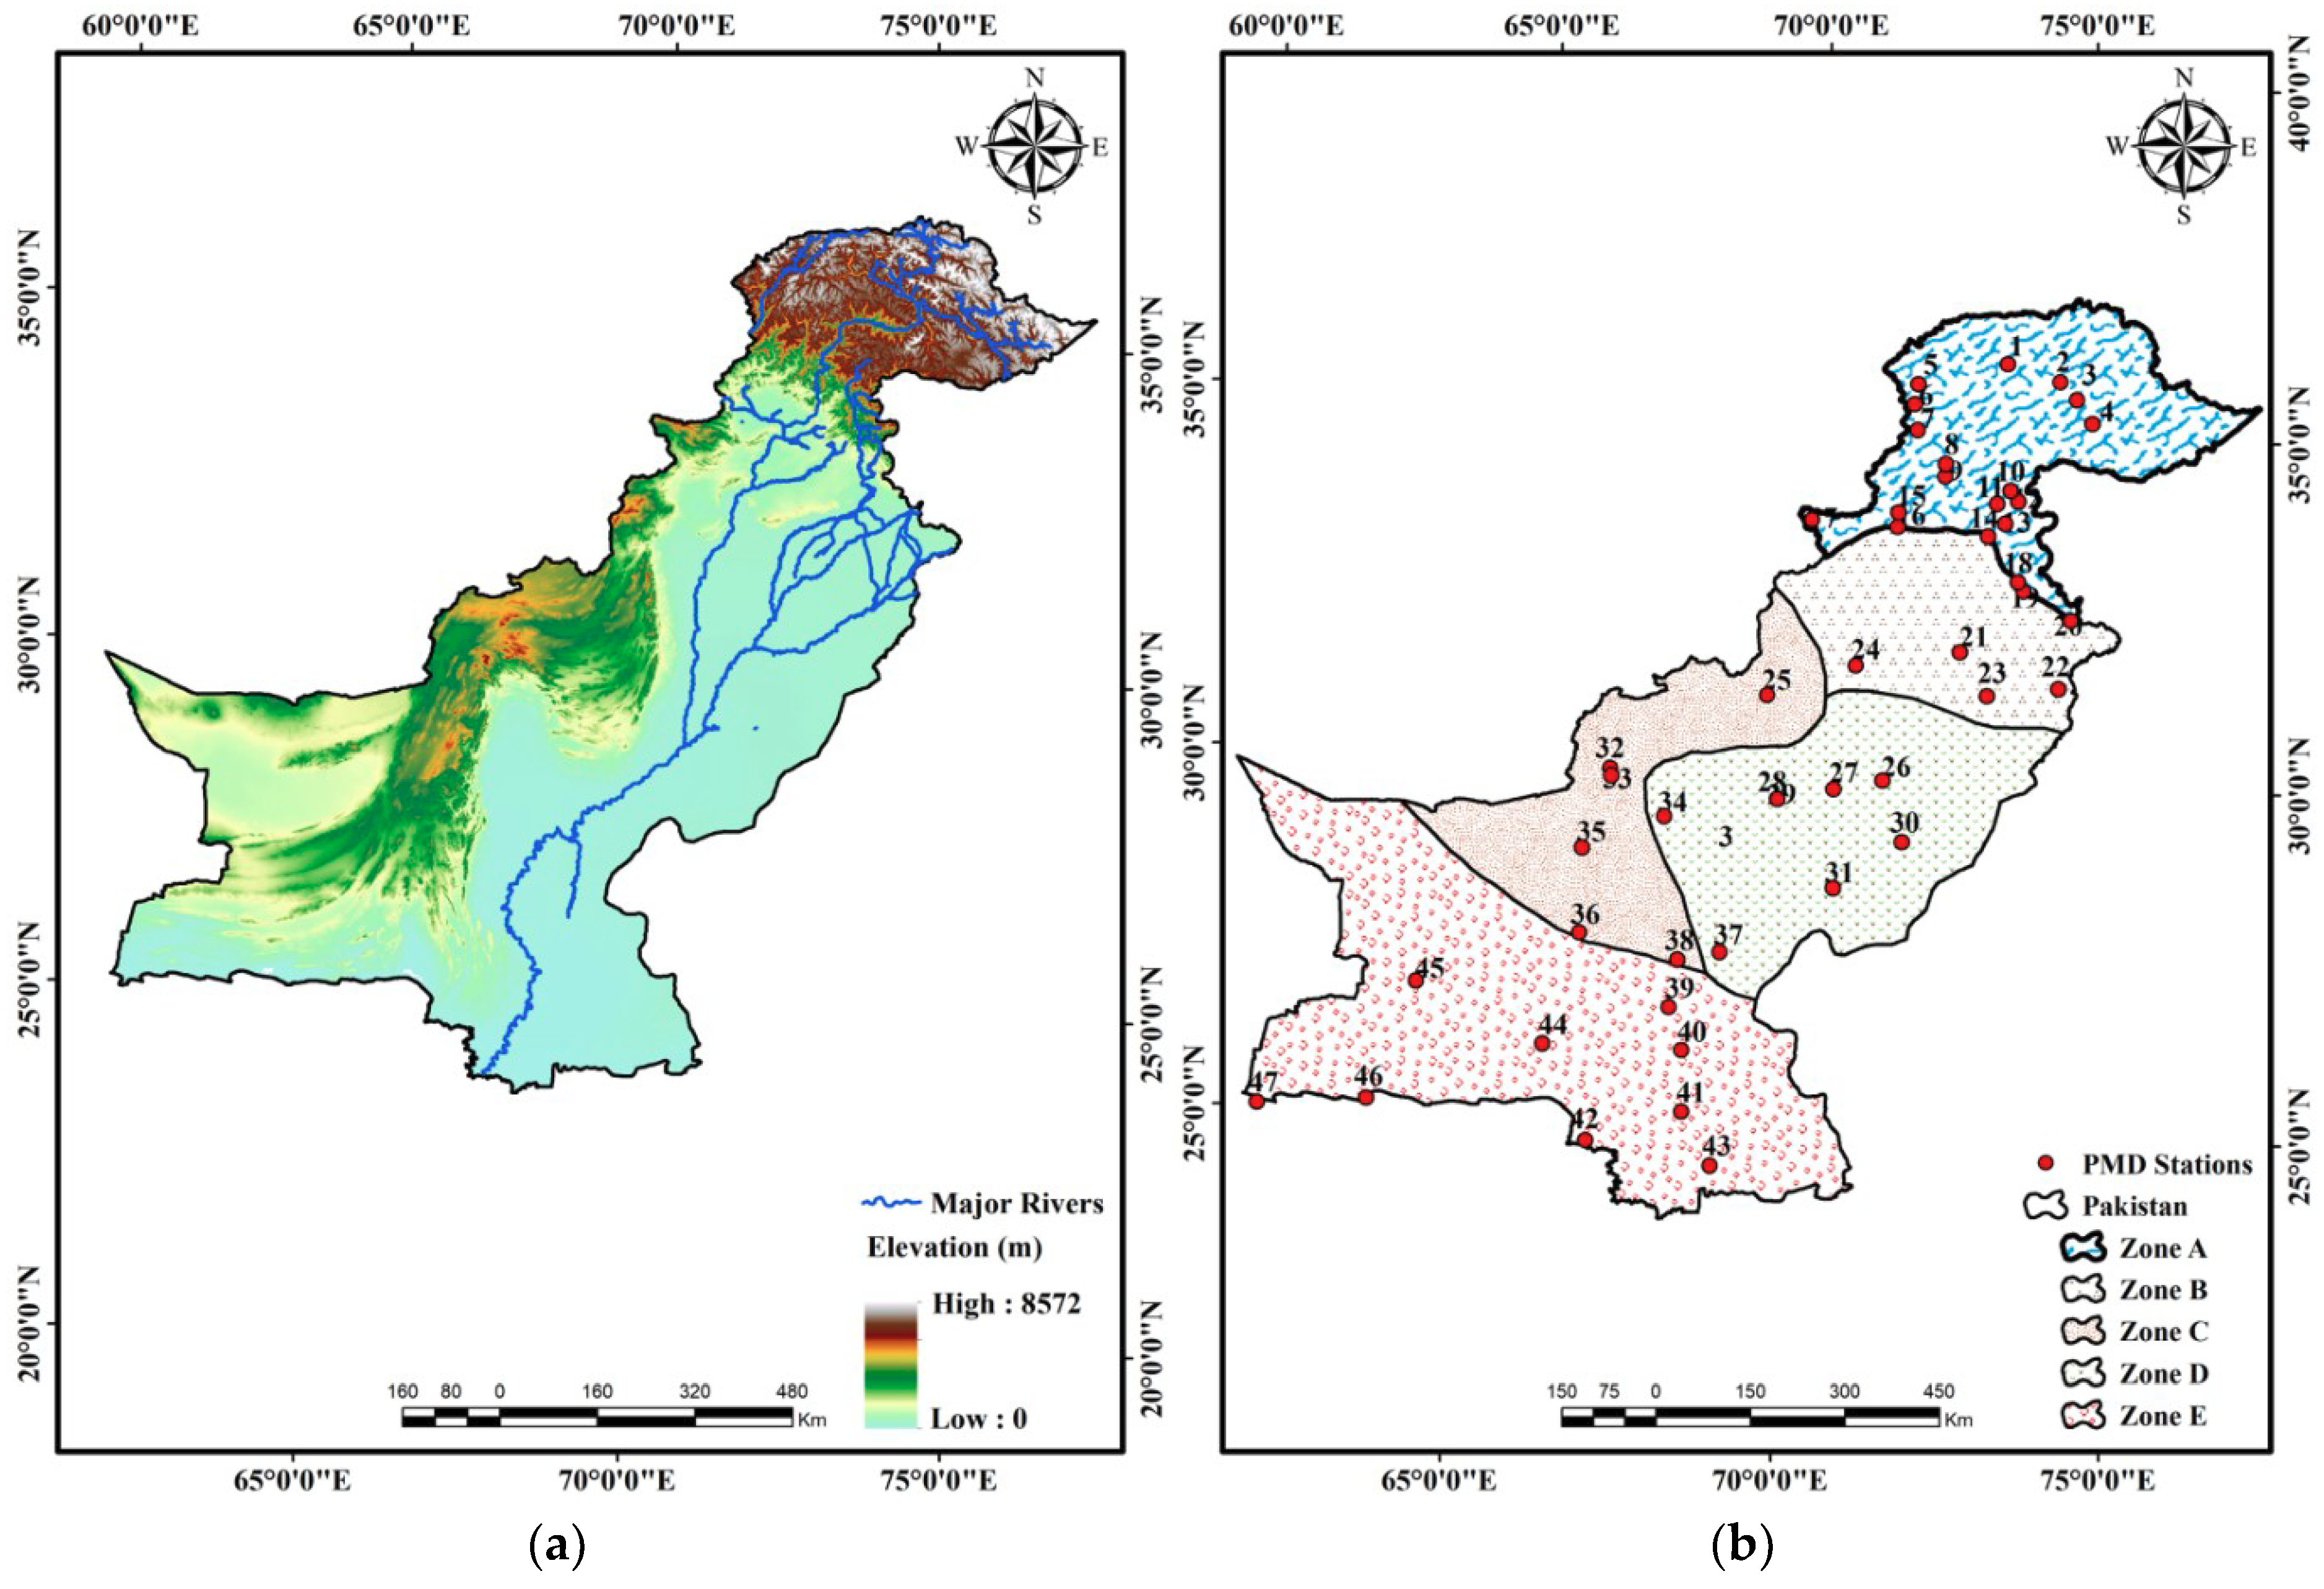
Pakistan is situated geographically between 24° and 37°N latitude and 62° and 75°E longitude in the western zone of South Asia and covers approximately 79.6 million ha of the area (
Figure 1). Pakistan has complex and diverse topography with elevation ranges from 0 m (Arabian sea) to the world famous Himalayas and Karakoram mountain ranges with a peak elevation of 8600 m [
45]. The landscape diversity ranges from glacial and snow cover region in the north, to a plain zone having deserts and plateaus in the middle, and a coastal zone along the Arabian Sea in the south. Due to diverse climatic regimes, the annual precipitation of Pakistan ranges from 300 mm in the south to about 1500 mm in the north. The maximum precipitation occurs during summer (Monsoon) and winter (western disturbances) seasons [
46]. Monsoon precipitation occurs during July to September and originates from the Bay of Bengal and enters Pakistan from east and northeast. During the monsoon season, heavy precipitation (from 55 to 60% of annual precipitation) is received in the country [
47]. Winter precipitation occurs during December to March due to the Mediterranean Sea and enters Pakistan from Iran and Afghanistan. Moderate precipitation (30% of annual precipitation) is received during the Winter season [
48].
The Indus River is the most important river in Pakistan. The Indus River originates from Mount Kailash in Tibet (China) and discharges into the Arabian Sea. The Indus River covers most of Khyber Pakhtunkhwa, Punjab and Sindh provinces of Pakistan, with the Himalayan mountains (North–East) and Highland regions in the north and the arid regions in the southwest. Salma et al. [
49] divided Pakistan into five different microclimate zones (
Figure 1).
2.2. In Situ Data
Surface Precipitation Gauges (SPGs) are considered as ground truth data, as they provide a direct record of the precipitation at a specific location. The SPP observations at the grid cell are compared with the corresponding SPG during the calibration and validation phases. To monitor the precipitation and climate variation in Pakistan, PMD has established a significant number of weather SPGs all over Pakistan, including some dating back to 1950, some seasonal ones, and some newly established ones. A total of 97 observatories are installed all over Pakistan on behalf of PMD. The precipitation data is collected manually which is subjected to human-induced and instrumental errors. Other associated errors with the SPG located at high elevation regions comes from wind effect, which affects the precipitation measurement by the SPGs. In these circumstances, PMD follows the World Meteorological Organization (WMO) standard code WMO-N for the evaluation and correction of SPG precipitation data to ensure the consistency in the measurements. In this research, daily precipitation data at 47 SPGs are obtained from PMD for the year 2015 and 2016.
Table 1 shows the details of all the SPGs utilized in this study.
The dataset is divided into five different climate zones (Zone-A to Zone-E) for evaluation of the topographical and seasonal performance of SPPs. Zone-A is situated from 34°N to 38°N, has cold climate and high mountains like Hindukush, Himalaya, and Koh-e-Sufaid with mean annual precipitation (MAP) of 1034.43 mm. Zone-B lies between 31°N and 34°N and has a mild cold climate and submountains (MAP of 990.72 mm). Zone-C is located between 27°N and 32°N and has cold weather in winter and hot weather in summer (MAP of 317.00 mm). Zone-D is the hottest and arid zone of Pakistan. The area is almost plain in elevation with some area included in the famous Thar Desert (MAP of 322.41 mm). Zone-E is the coastal zone of Pakistan and situated near the Arabian Sea. The climate in this zone mostly ranges from arid to hyper-arid (MAP of 146.65 mm).
The zero-order method test is used to fill the missing data. The method employs a simple procedure by replacing the average for the missing values [
50]. The data quality test is used to check the accuracy and consistency of the data. There are various statistical methods to test the quality of the data. It mainly contains the normality test such as the Jarque–Bera test, histogram (graphical approach), the mean, the skewness, and kurtosis of the data [
51]. For the current study, the skewness and kurtosis method is applied to test the data quality.
2.3. Description of Satellite-Based Precipitation Datasets
Three different satellite-based precipitation datasets have been used in the present study. Which include the Integrated Multi-Satellite Retrievals for Global Precipitation Measurement (IMERG), Tropical Rainfall Measurement Mission (TRMM) Multi-satellite Precipitation Analysis (TMPA), and Precipitation Estimation from Remotely Sensed Information using Artificial Neural Networks (PERSIANN).
The IMERG is the quasi-global (between 60°N and 60° S) multi-satellite precipitation product of Global Precipitation Measurement (GPM) [
52]. The GPM-IMERG mission was launched in February 2014 and has a spatial resolution of 0.1° × 0.1° and a temporal resolution of 30 min. IMERG is the Level 3 precipitation algorithm of GPM, which has three runs, i.e., early run (latency of 6 h and can be used for warning a probable flood event or landslides), late run (latency of 18 h and suitable for drought monitoring and agricultural forecasting), and final run (latency of three months and used for observation like precipitation observation). In this study, IMERG final run will be used to estimate the seasonal and topographical variation of precipitation in Pakistan.
Tropical Rainfall Measurement Mission (TRMM) is the first space-borne SPP launched in November 1997 its detailed description is available in previous literatures [
53,
54,
55]. TRMM has three onboard instruments, Precipitation Radar (PR), TRMM Microwave Image (TMI), and Visible Infrared Scanner (VIRS) for recording the data. TMI is a multichannel passive microwave radiometer that supplements the PR by providing total hydrometeor (liquid and ice) contents, with the precipitation systems. The VIRS dispensed the cloud context of precipitation structures and used to connect microwave precipitation information to infrared-based precipitation estimates from geosynchronous satellites [
53,
54,
55]. Currently, the Multi-satellite Precipitation Analysis (TMPA) is producing the best precipitation estimates at 0.25° spatial resolution for the areas between 50°S and 50°N. The TMPA algorithm combines the precipitation estimates from various satellite systems, as well as SPG precipitation analyses [
17,
56]. TRMM TMPA-3B43 v7, a daily precipitation product, is used in this study.
The PERSIANN is an algorithm developed by the Center for Hydrometeorology and Remote Sensing (CHRS) in the University of California Irvine with a spatial resolution of 0.25° × 0.25°. In PERSIANN PMW data (TMI, AMSU-B, and SSM/I) is used to adjust the neural network parameters to increase precipitation estimation accuracy. PERSIAN–CDR is another product from PERSIANN family developed by CHRS with the spatial resolution of 0.25° × 0.25°. PERSIANN–CDR uses the same neural network for precipitation estimation as used previously but differs regarding input IR dataset with the use of GridSat-B1 instead of CPC-IR. Moreover, PMWs data are not used [
57]. In this study, PERSIANN and PERSIANN-CDR algorithms are evaluated based on seasonal and regional scales.
2.4. Adjustments in Spatial and Temporal Resolutions
All of the SPPs used in this study differ in spatial and temporal resolutions. To adjust the spatial resolution, an aggregation method was used to aggregate the precipitation product of IMERG from 0.1° to 0.25°, and the areal aggregation weights of 0.16, 0.08, and 0.04 were assigned to four IMERG grid cells falling inside a 0.25° TRMM grid cell, four located halfway within, and the ninth covers one-fourth inside, respectively [
40]. Furthermore, the coordinate matching process was also performed to avoid any mismatch issue. In the coordinate matching process, the precipitation record and the latitude/longitude of the SPGs are matched against the amount of satellite precipitation in the pixel. To produce a single mean value at each pixel, the precipitation data is averaged when a pixel has more than one SPG.
The day in Pakistan begins 5 h ahead of Greenwich Mean Time (GMT+5). The satellite-based data accumulations are computed from 3:00 to 3:00 UTC to match the 8:00 to 8:00 local time of the SPG data in Pakistan. In order to compare the SPPs estimates with the SPGs data, the satellite precipitation data is accumulated into daily precipitation, which has the same temporal resolution as the SPG precipitation data.
2.5. Precipitation Products Evaluation
The selected four SPPs are quantitatively evaluated by comparing the SPPs with the daily PMD SPG observations from January 2015 to December 2016. The statistical indices used to assess the efficacy of selected SPPs are listed in
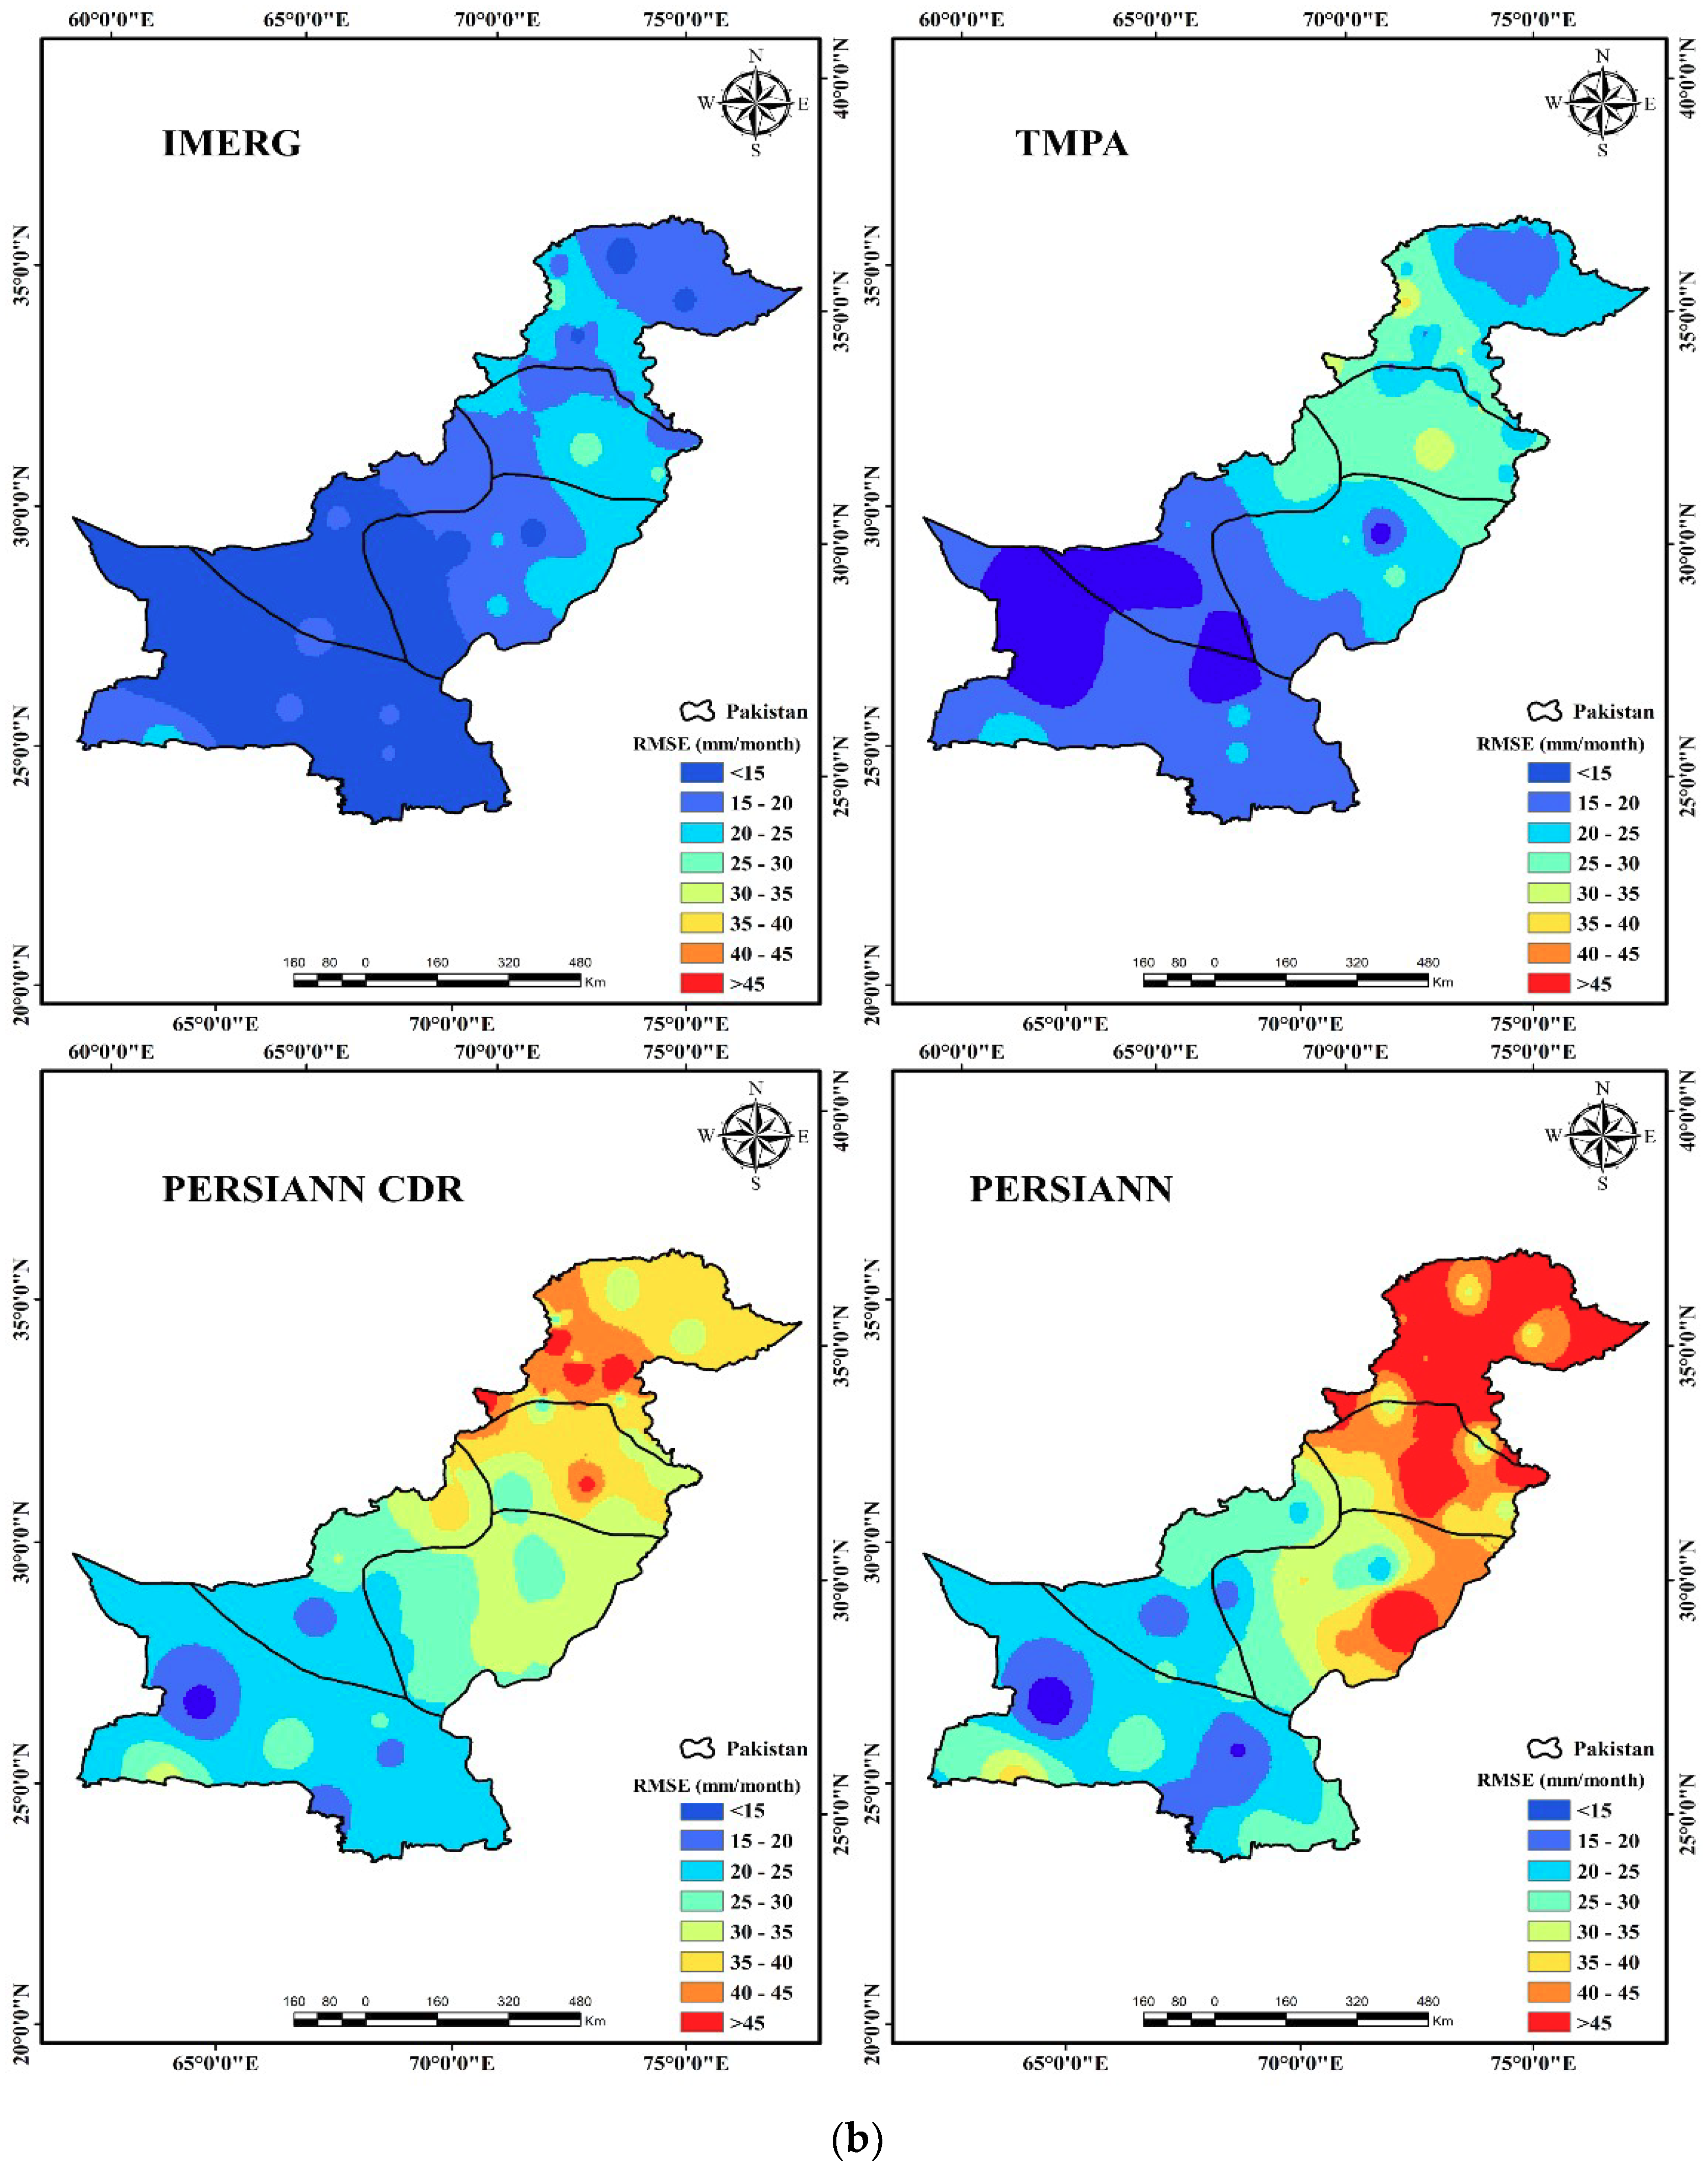
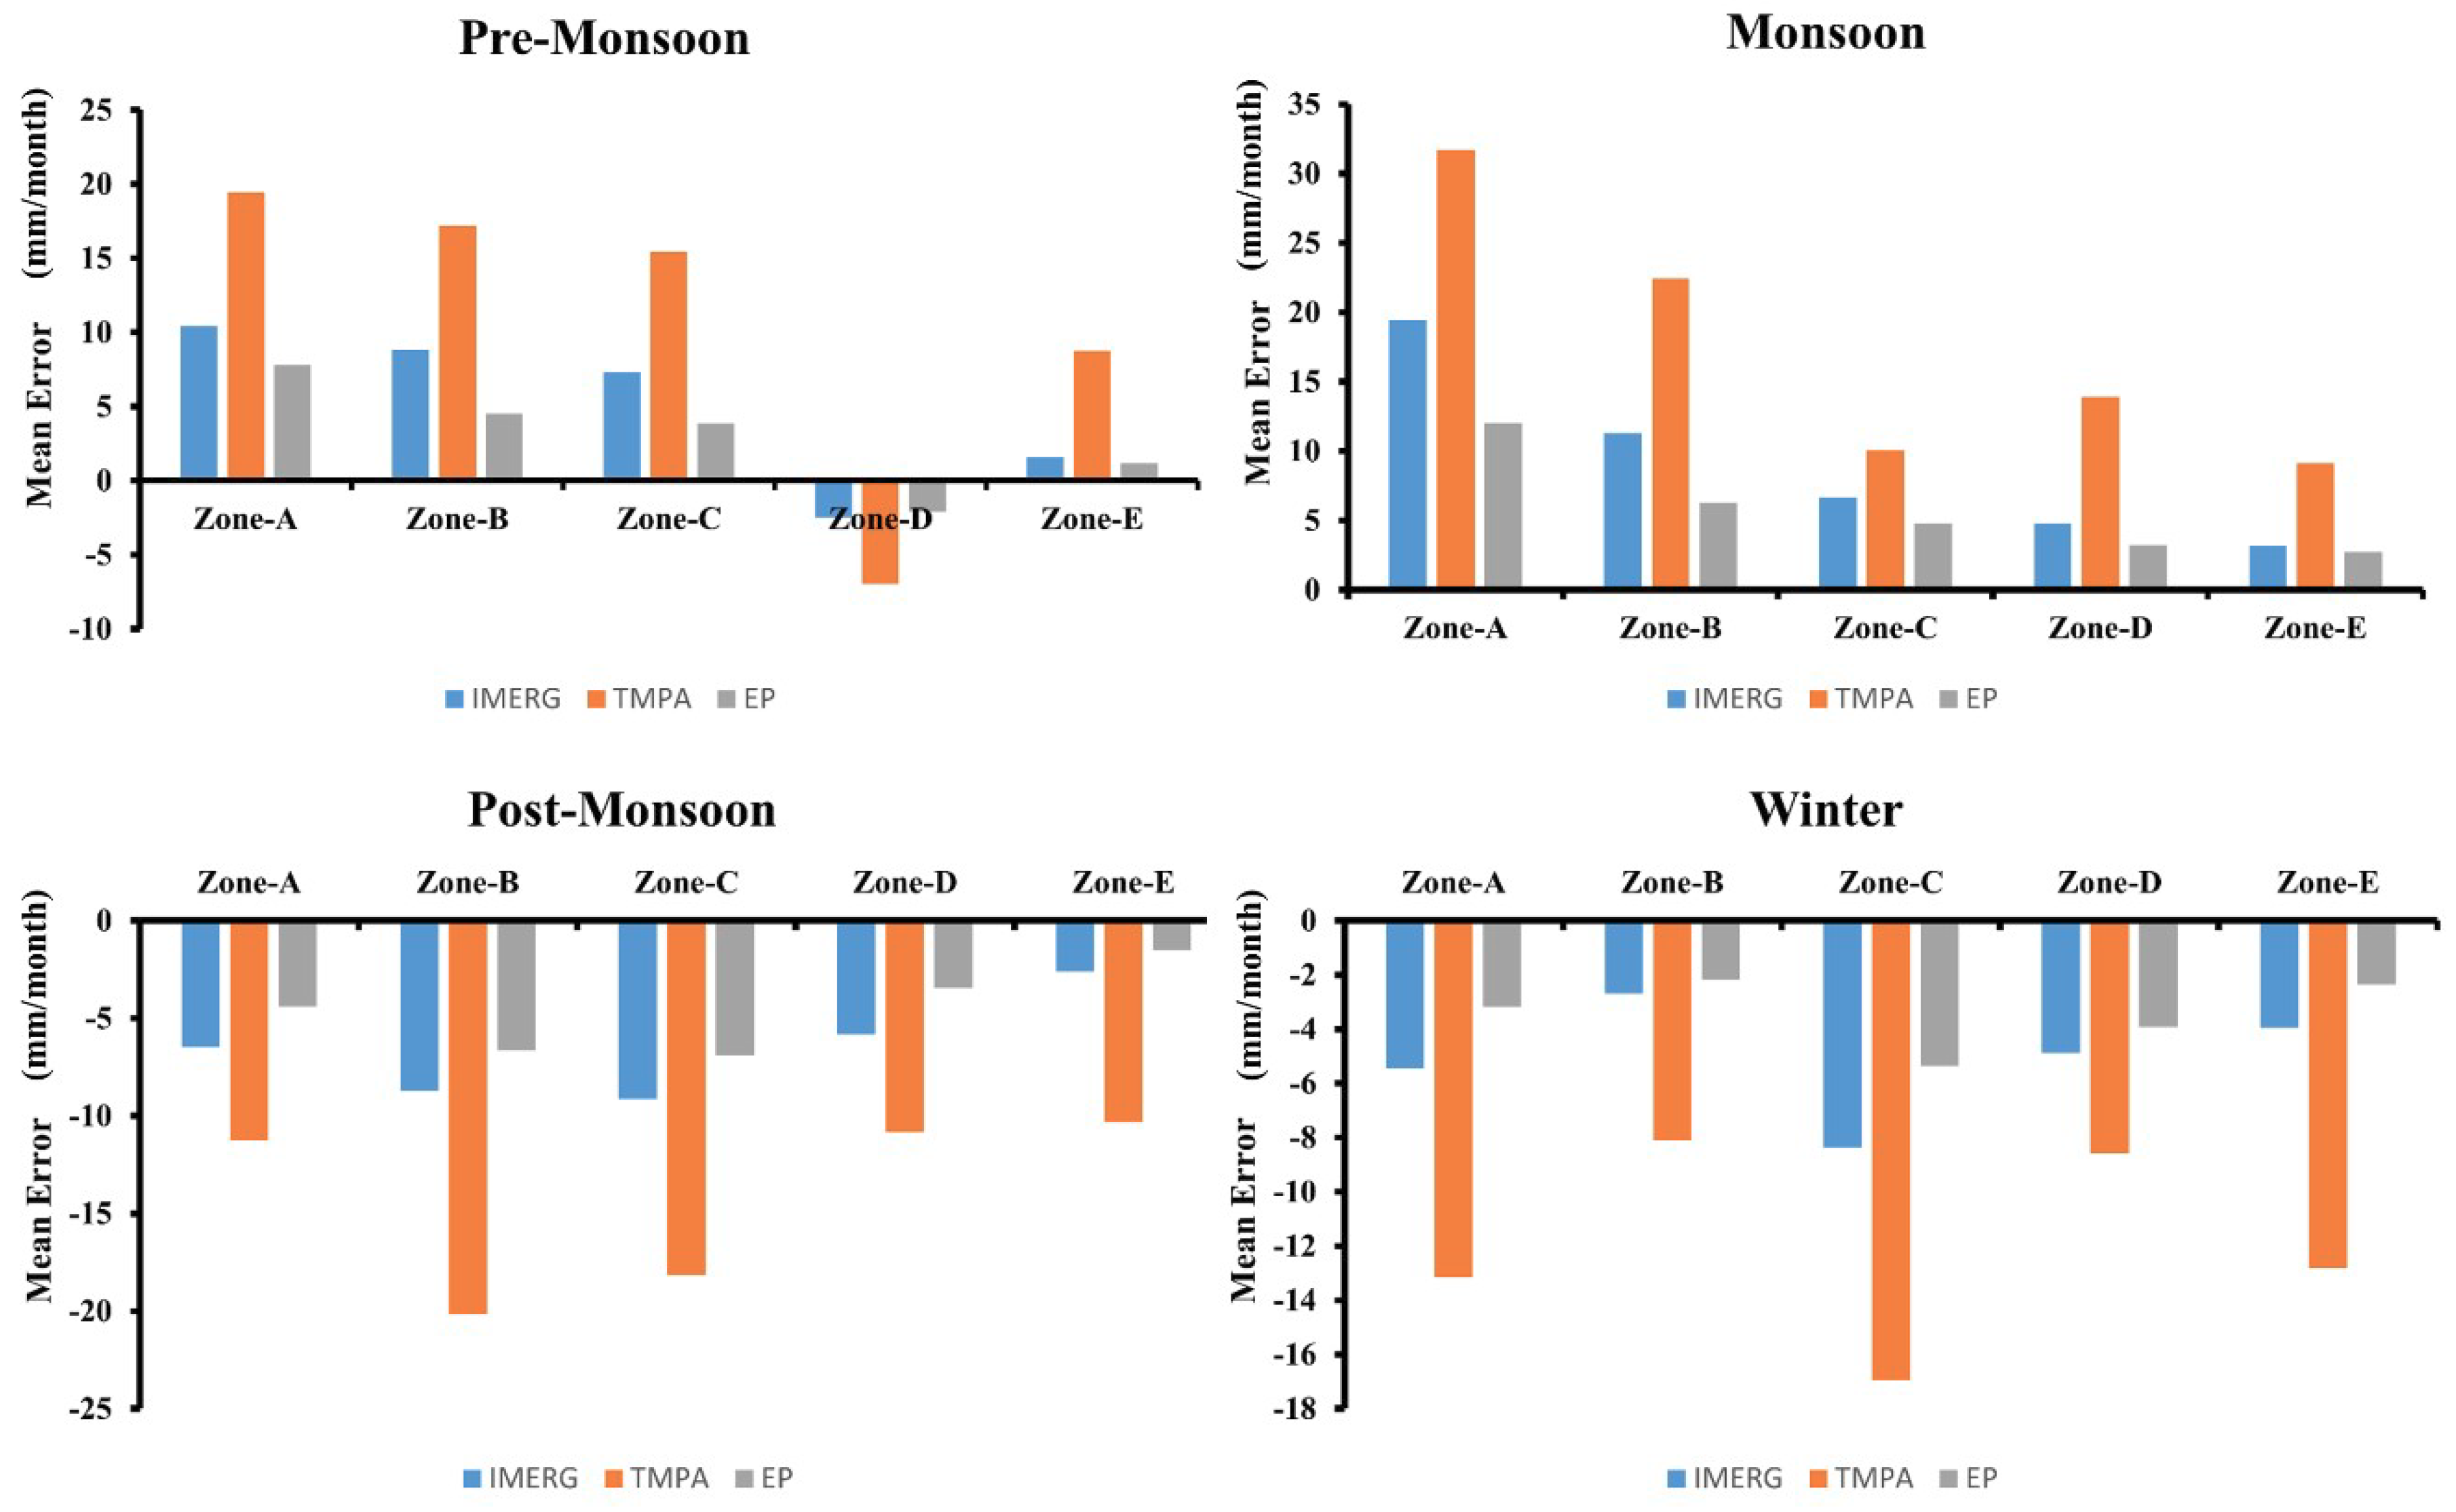
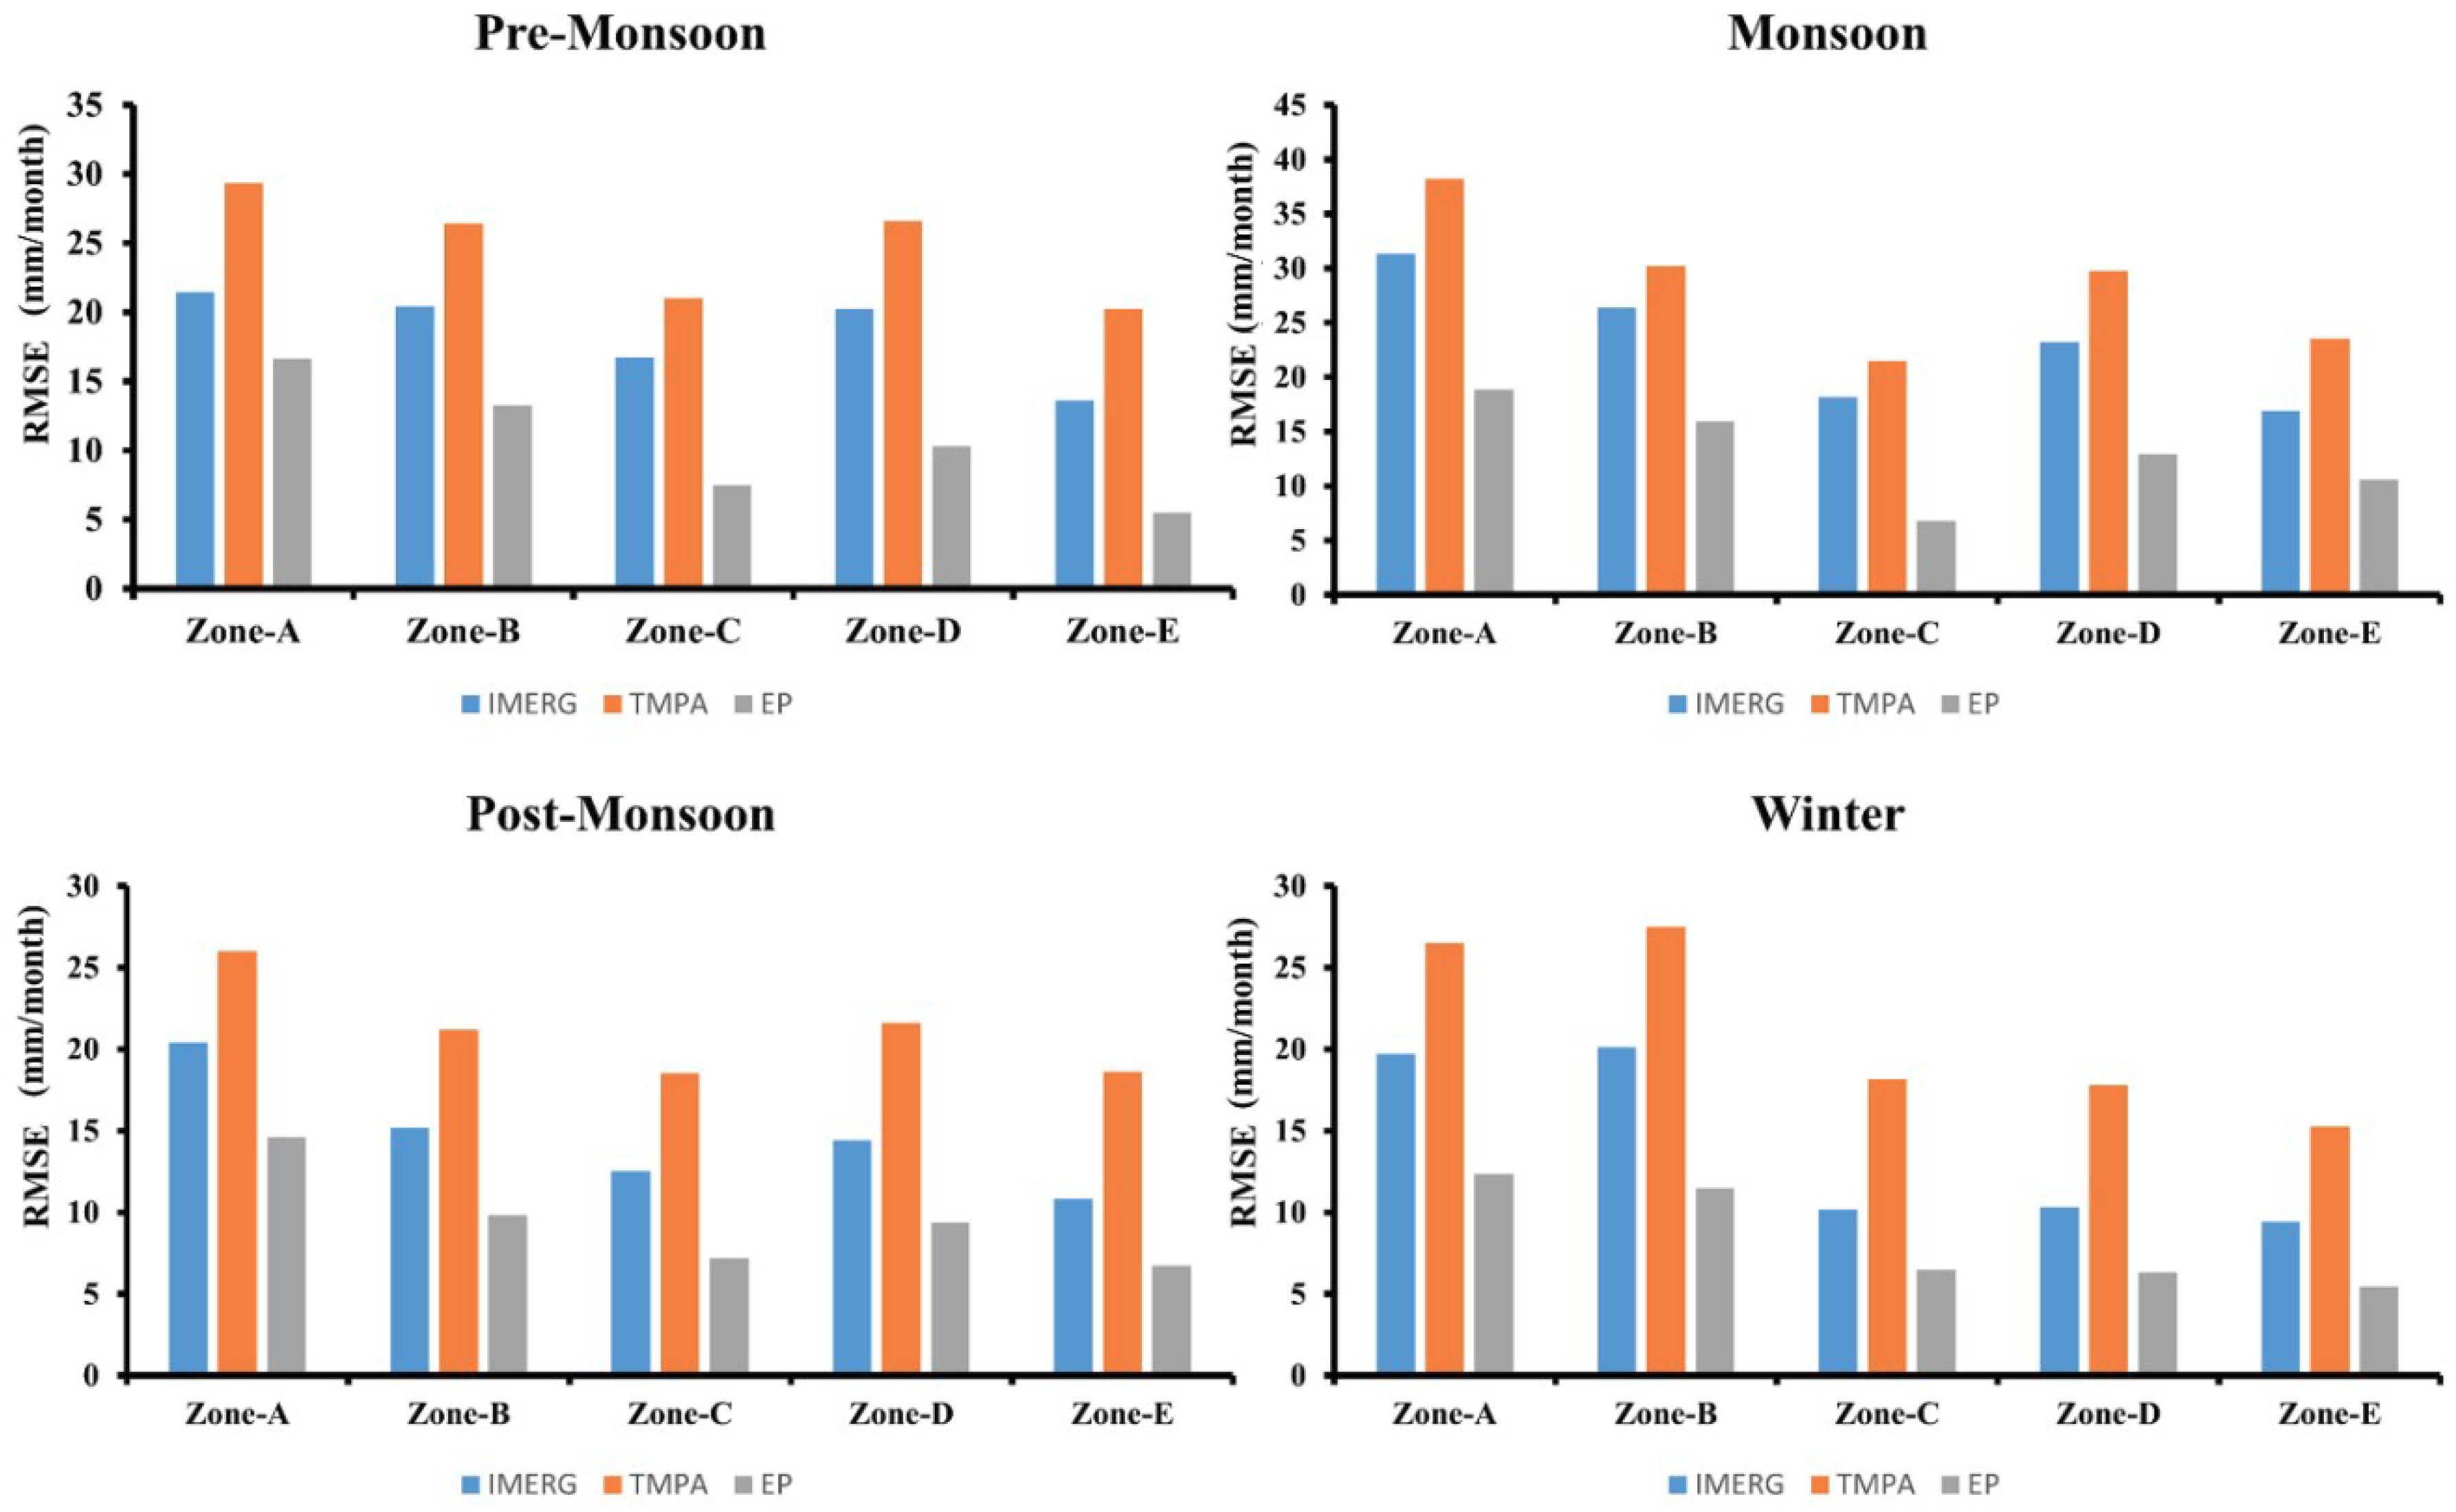
Table 2, including (i) Mean Error (ME) to evaluate the bias, (ii) Root Mean Square Error (RMSE) to evaluate the magnitude of error with more emphasis on large errors as compared to ME, and (iii) the Pearson correlation coefficient (CC). For comprehensive evaluation of CC, the CC ranges mentioned by Iqbal and Athar [
10] are considered: Weak (CC < 0.25), Low (0.25 < CC < 0.5), Moderate (0.5 < CC < 0.75), and Strong (0.75 < CC < 1).
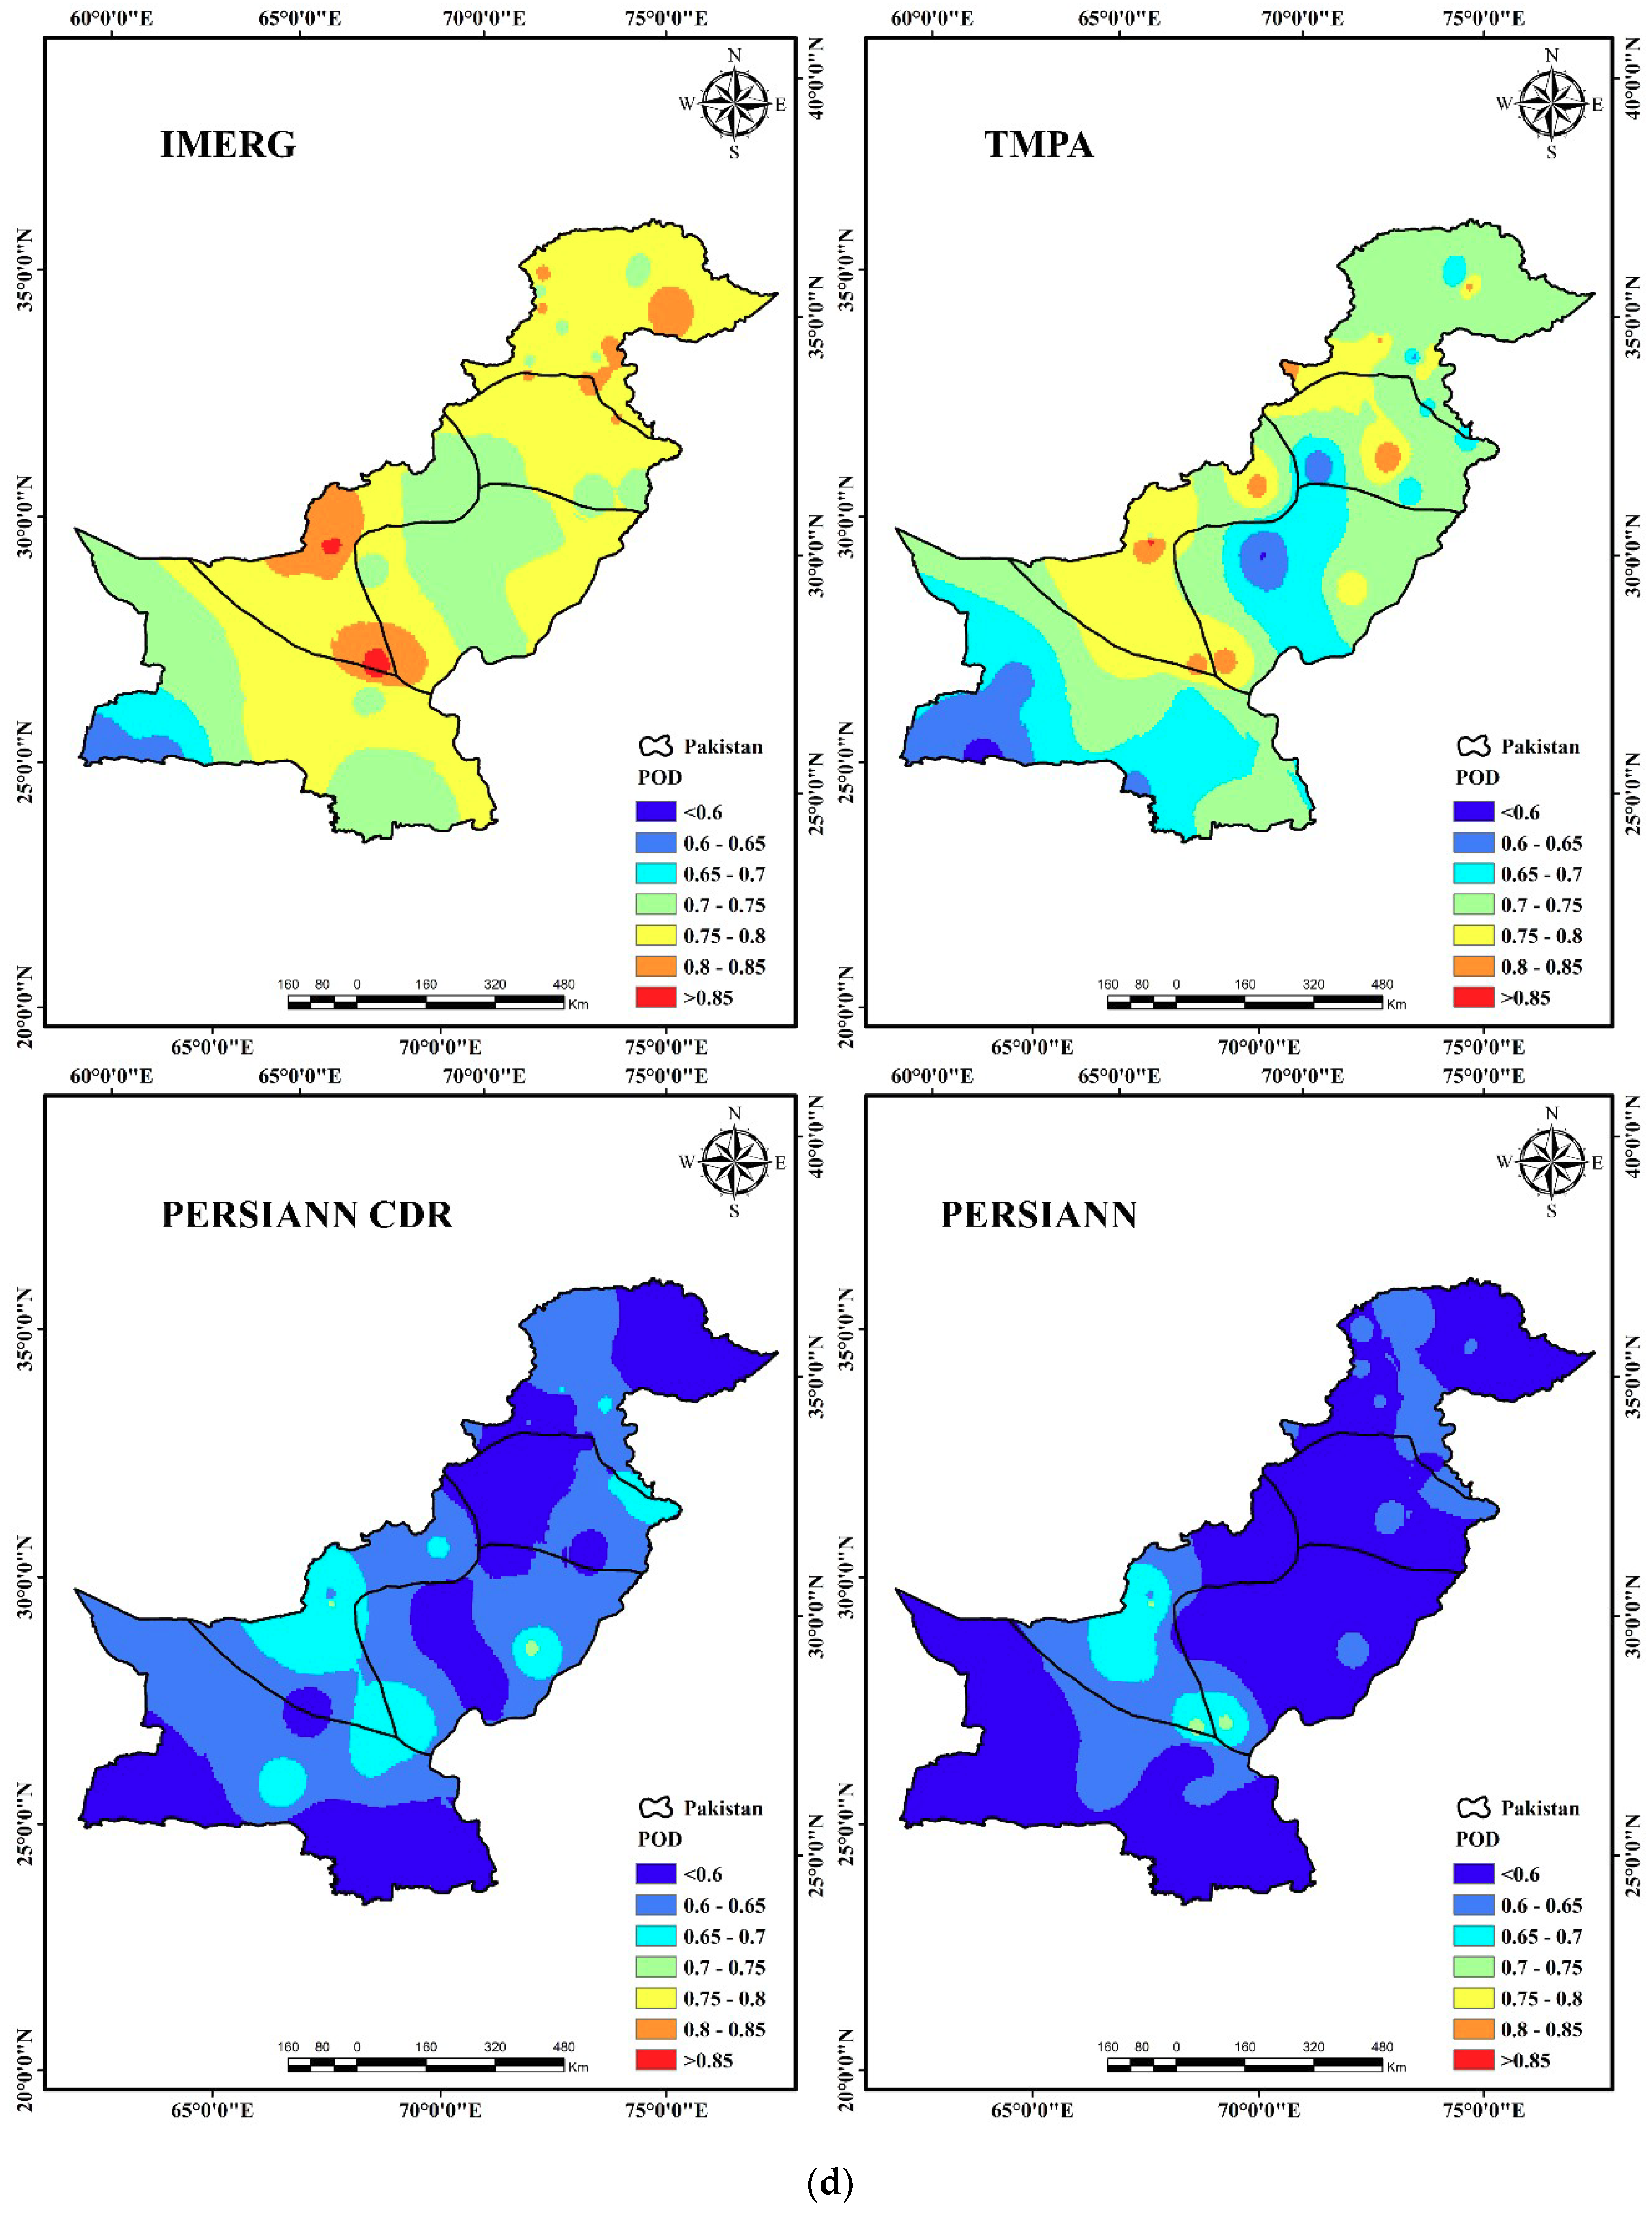
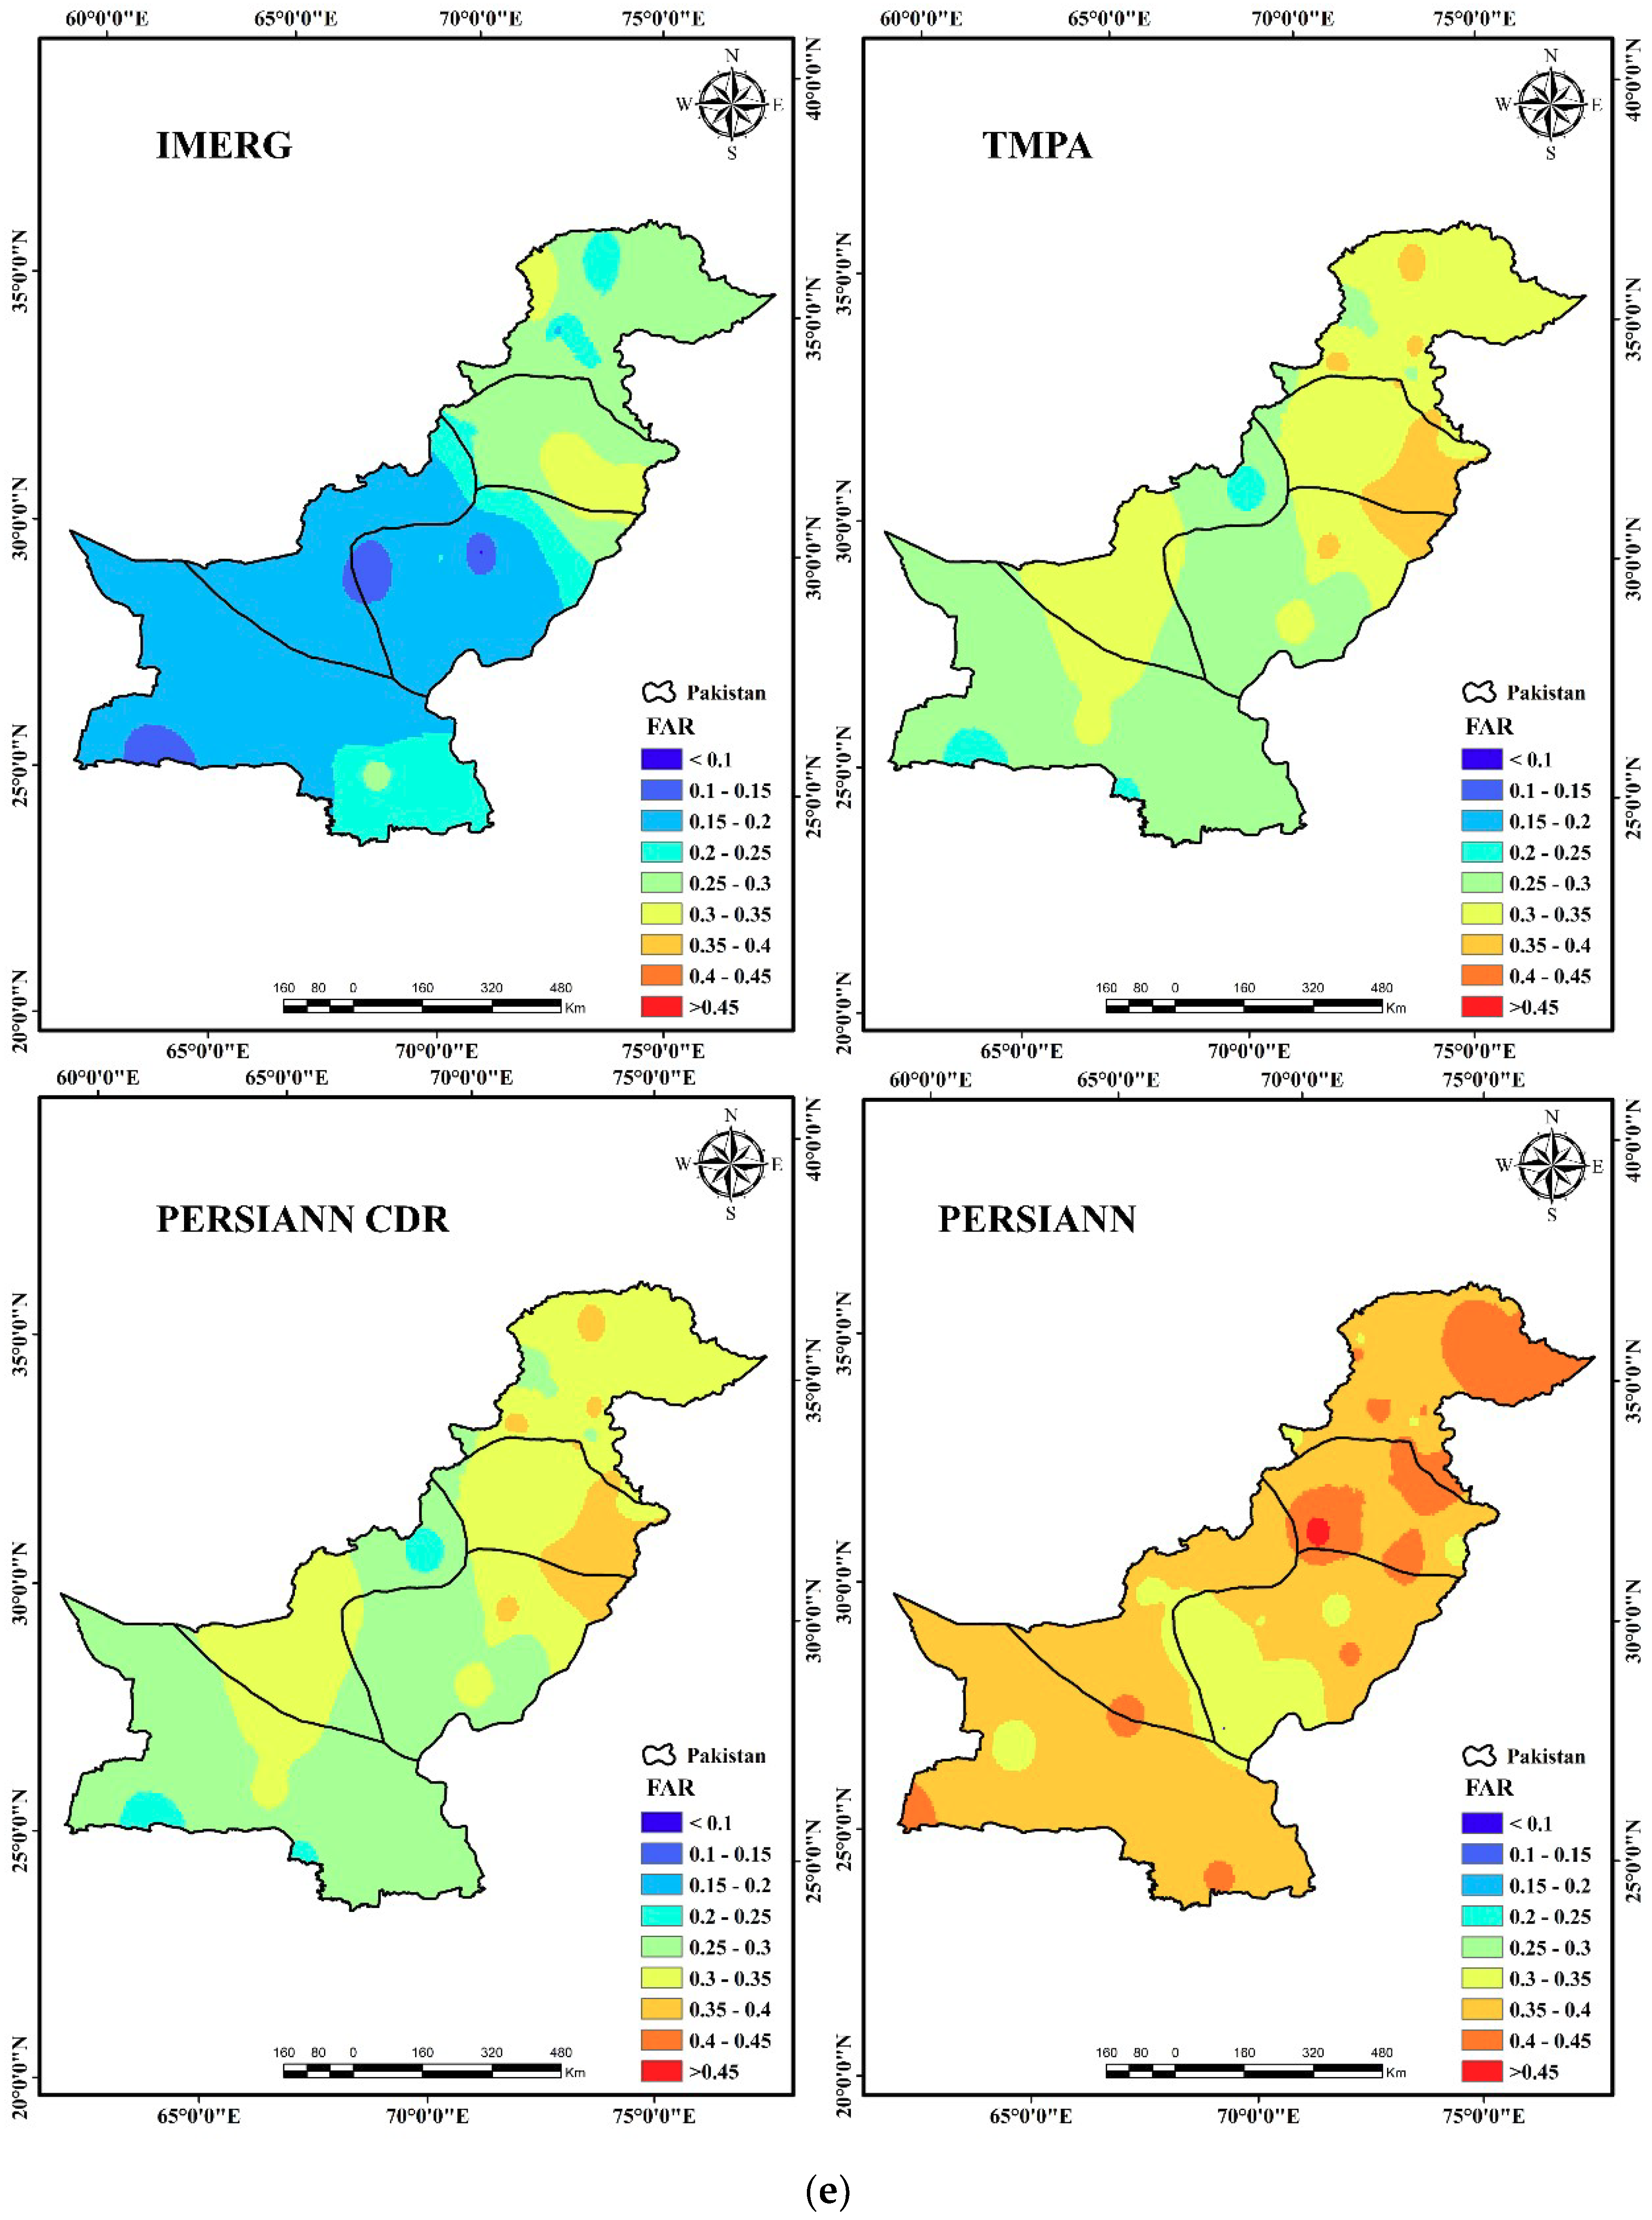
For more accurate quantification of errors, three additional categorical statistical indices, including Probability of Detection (POD), False Alarm Ratio (FAR), and Critical Success Index (CSI), are used to detect the agreement between SPP- and SPG-based precipitation data. POD indicates how well the SPPs detect the precipitation events among all the SPG-based precipitation events (1 mm was used as the precipitation/no precipitation threshold [
22], FAR indicates the fraction of incorrectly detected precipitation events by SPPs, and CSI represents an overall fraction of precipitation events correctly detected by the SPPs.
2.6. Algorithm for Ensemble Precipitation Estimation
The proposed algorithm for satellite-based ensemble precipitation estimation is based on K-fold cross-validation, paired sample t-test, Principal Component Analysis (PCA), and the ensemble algorithm.
The K-fold cross-validation method is used to evaluate the SPPs performance and its selection. In the K-fold cross-validation, the SPG observations in the five different climate zones are divided into K-datasets. Furthermore, these datasets are partitioned into training and testing sets. During the validation process, the data of a single SPG (testing set) in a selected climate zone is taken out from the calibration dataset (training set). The average error across all K-trials was calculated. The K-fold test was repeated for all the SPGs considered in the study.
A dependent-sample t-test, also known as paired sample t-test, is used to compare the SPPs with the SPG datasets. The paired sample t-test assesses whether the mean difference between paired objects/observations is significantly different from zero. The following two hypotheses are tested for the paired sample t-test.
Hypothesis 2. Alternative (Nondirectional) Hypothesis:
Hypothesis 3. Alternative (Directional) Hypothesis:
where
and
are the mean of first and second variables. Moreover, the Wilcoxon matched-paired signed ranks test is also performed to examine the extreme violation of normality assumptions and further validation of the performance of SPPs. The mean error and standard deviation between the SPP and SPG datasets are calculated. Based on K-fold cross-validation and paired sample
t-test with 95% confidence interval, the best satellite products (minimum mean error and standard deviation) are selected.
The Principal Component Analysis (PCA) technique uses a sophisticated mathematical principle to transform a number of possibly correlated variables into a smaller number of variables called principal components. The basic idea behind the application of PCA is to select the two best SPPs out of the four SPPs and to determine the percentage correlation of the selected SPPs with the ground truth data (PMD SPGs). This percentage is considered as a weight factor “w” (Σw = 1) of the particular satellite product.
After calculating the weights, the precipitation observations of the selected SPPs over each climate zone have been combined using the following equation:
where EP is the ensemble precipitation, w
1 and w
2 are weights associated of the selected two SPPs,
S and
s are the two selected satellite products,
i is the number of PMD SPGs, and
N is the maximum number of SPP records in the particular climate zone.
Finally, the developed ensemble precipitation product EP = [EP
1, EP
2,…, EP
N] is compared and evaluated with the corresponding ground observations G = [G
1, G
2,…, G
N] using the statistical metrics presented in
Table 2.
4. Discussion and Conclusions
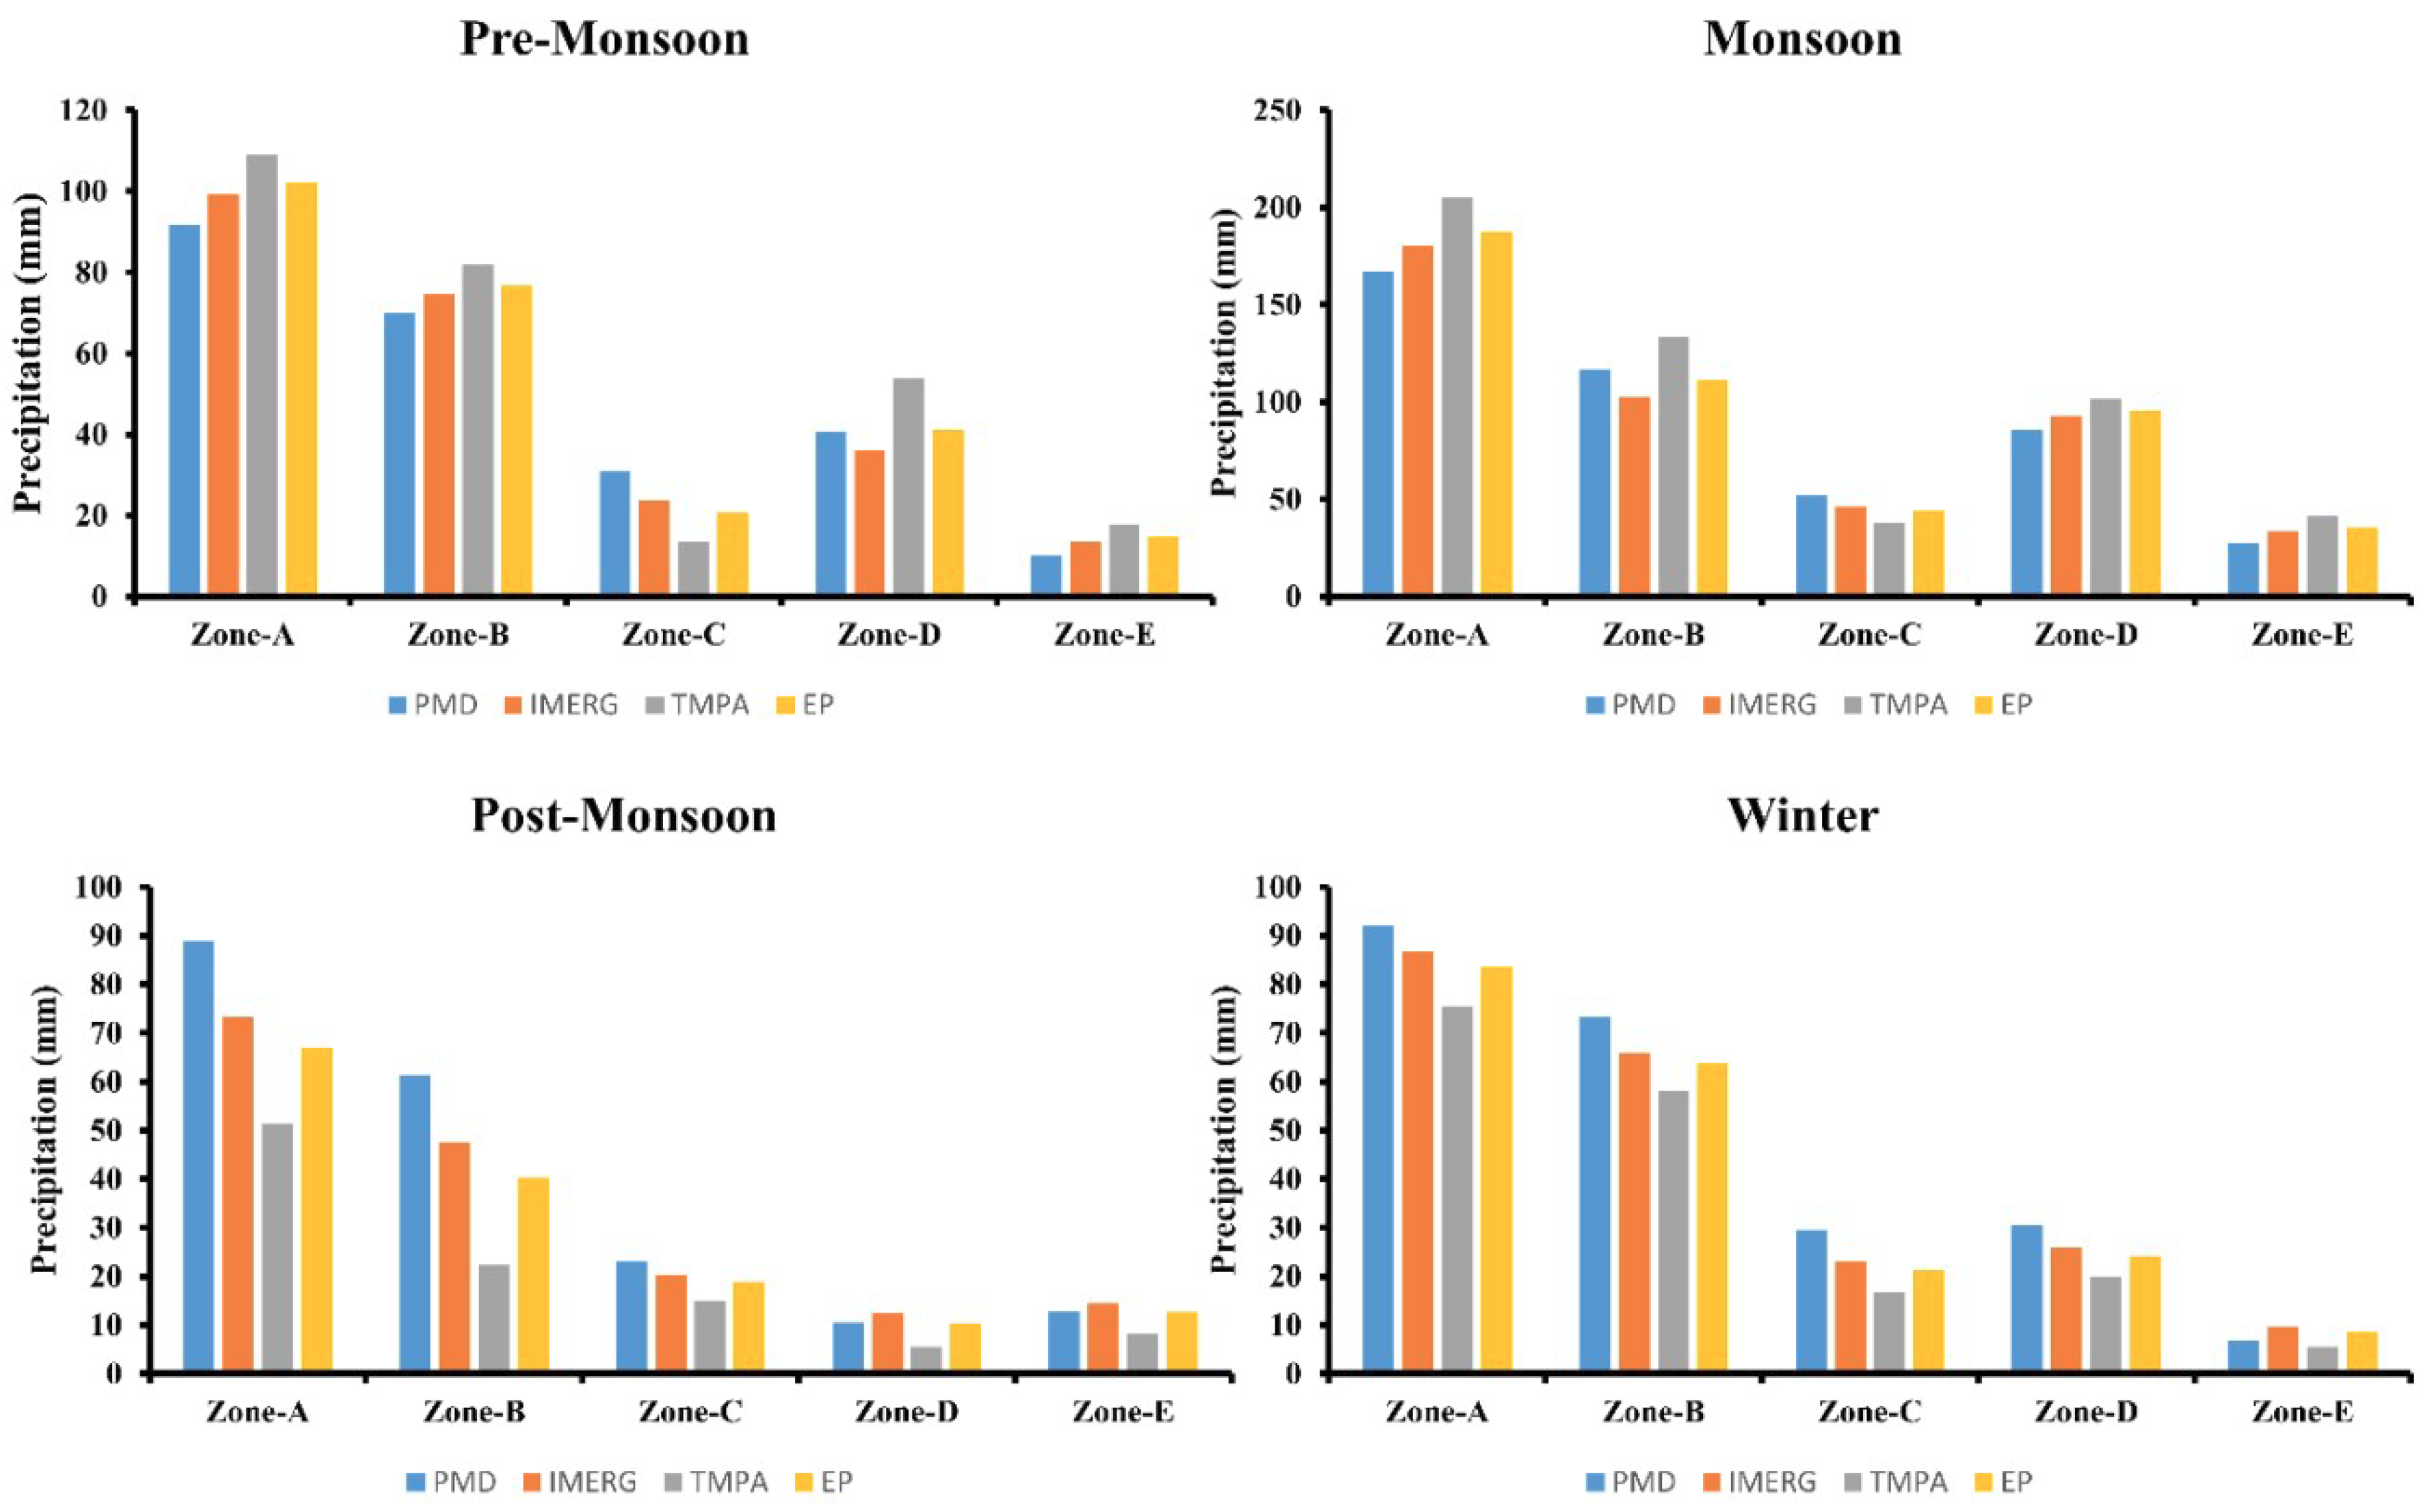
Accurate estimation of precipitation with high spatial and temporal resolution is a very important for different hydrological simulations and climate change studies. Recently SPPs are attracting the attention of researchers and play a vital role in estimating precipitation in ungauged or poorly gauged regions. However, it is a challenging task in the developing countries such as Pakistan having sparse SPG network and complex topography. Based on the spatial (regional) scale evaluation (
Figure 2a–e), our study supports the findings of previous literatures [
10,
43] conducted in Pakistan. In this study, it has been observed that high errors are found over high elevations, and these errors are reducing with the elevations from north to south. The IMERG and TMPA resulted in a poor performance at high elevated zone (Zone-A) of the study area. There could be number of reasons such as external error associated to the SPG (for example, wind effect, splashing effect of precipitation, evaporation from the SPGs and human-induced errors), complex topography, climate variability in the region, seasonality (pre-monsoon, monsoon, post-monsoon, and winter etc.) [
10,
13,
39], and a sparse SPG network. However, a strong correlation has been observed over the plain elevation and low positive correlation over high elevation. These findings are consistent with the previous studies. However, the EP performed exceptionally well in plain areas while its performance is reducing with the elevation.
The IMERG and TMPA overestimated the precipitation during the pre-monsoon and monsoon seasons while underestimated the precipitation during post-monsoon and winter seasons. Moreover, good agreement between IMERG and SPGs was found in plain and medium elevated regions. These findings are consistent with the previous studies. However, EP performed very well during high and moderate precipitation while its performed ordinary in low precipitation events.
Different algorithms such as algorithms for improved calibration, reducing sampling issue, moving from TRMM to GPM, etc., have been implemented to reduce the non-negligible error in the SPPs. However, there is still room for further advancement in those algorithms to provide consistent results [
14,
40]. Effort has been made by Muhammad Waseem et al. [
42] to minimize the inconsistency issues and the associated errors by merging different SPPs. Their algorithm is based on leave-one-out cross-validation (LOOCV), regional performance weights (
), and the ensemble algorithm. They concluded that their developed algorithm presented better agreement than the selected SPPs. In this study, we developed ensemble precipitation (EP) product for each SPG in the study area based on selecting two (best) out of four SPPs, i.e., IMERG and TMPA 3B43 v7. The best SPPs were selected using the paired sample
t-test, and the corresponding weights are calculated using the principal component analysis (PCA). The developed EP algorithm was evaluated based on regional and temporal scales. The performance of the developed EP algorithm based on statistical evaluation is found comparatively better than the RP algorithm developed by Muhammad Waseem et al. [
42]. Moreover, the EP algorithm has also been tested on a seasonal scale, and the algorithm performed well when evaluated by ME and RMSE. Overall, the developed EP algorithm performed very well across all the Pakistan irrespective of the seasons.
The EP algorithm is evaluated on spatial and temporal scales, and it has been observed that it outperformed the IMERG and TMPA in the plain and medium elevated areas. However, it performed relatively poorer over high elevated regions. The EP algorithm performed significantly better when evaluated based on temporal (seasonal) scale. Overall, the EP algorithm can capture the spatial precipitation pattern over the region at annual and seasonal scales very well. Moreover, the methodology presented in this study is very simple, and it has the capability to select the best SPPs for a specific region to minimize the errors associated SPPs to ensure consistency in the performance.


