1. Introduction
The remote sensing community has demonstrated the effectiveness of hyperspectral imagers and LiDAR to obtain spectral and spatial information [
1,
2,
3,
4,
5]. The hyperspectral imager is capable of obtaining consecutive and abundant spectral profiles of targets, which has been employed in vegetation parameter extraction, food production prediction, target classification, etc. [
1,
2,
3,
4,
5]. However, the hyperspectral imager relies on environmental illumination conditions, so poor lighting will affect the hyperspectral information acquisition. LiDAR is an active sensor invented to acquire spatial information. In LiDAR a laser source emits monochromatic laser beams to a target, and thus, the ranging information is obtained through measuring the travel time of the laser beam [
6,
7]. With a scanning operation, LiDAR is able to obtain spatial information from the environment. Besides this, the power of the reflected signal from the target in LiDAR can be obtained with ranging operation. With careful calibration, the power of the reflected signal is measured and termed as intensity. Researchers have carried out some investigations using the intensity of a single wavelength to obtain some textures of the targets, for instance, rock analysis in outcrop models, landcover classification, etc. [
1,
2,
3,
4,
5,
6,
7,
8].
Restricted by the monochromatic laser source, intensity information of the back-scattered laser pulse or the spectral information from a traditional single wavelength LiDAR is much less efficient than a passive spectrometer [
9,
10,
11]. Recently, two approaches were investigated for the fusion of spatial and spectral data. The first approach ias to combine spectral and spatial data from two standalone instruments into the same framework, and this method was employed in forest area classification, urban species classification, automatic building extraction, and outcrop analysis [
12,
13,
14,
15,
16,
17,
18]. The disadvantage is that the data registration is complicated and time-consuming, and the coordinate transformation between the two instruments will probably introduce additional errors [
12,
13,
14,
15,
16,
17,
18].
The second approach refers to the integration of ranging with spectral measuring functions into a single sensor or instrument. Hyperspectral LiDAR (HSL) or Multispectral LiDAR (MSL) were developed as active sensors to obtain spectral and spatial information simultaneously. Basically, there are two solutions to develop an HSL or MSL. The first solution is to combine several monochromatic laser sources of different wavelengths together. Since more channels mean more laser sources at different spectral wavelengths, it was hard to combine tens or hundreds of monochromatic laser sources together in this framework [
19,
20,
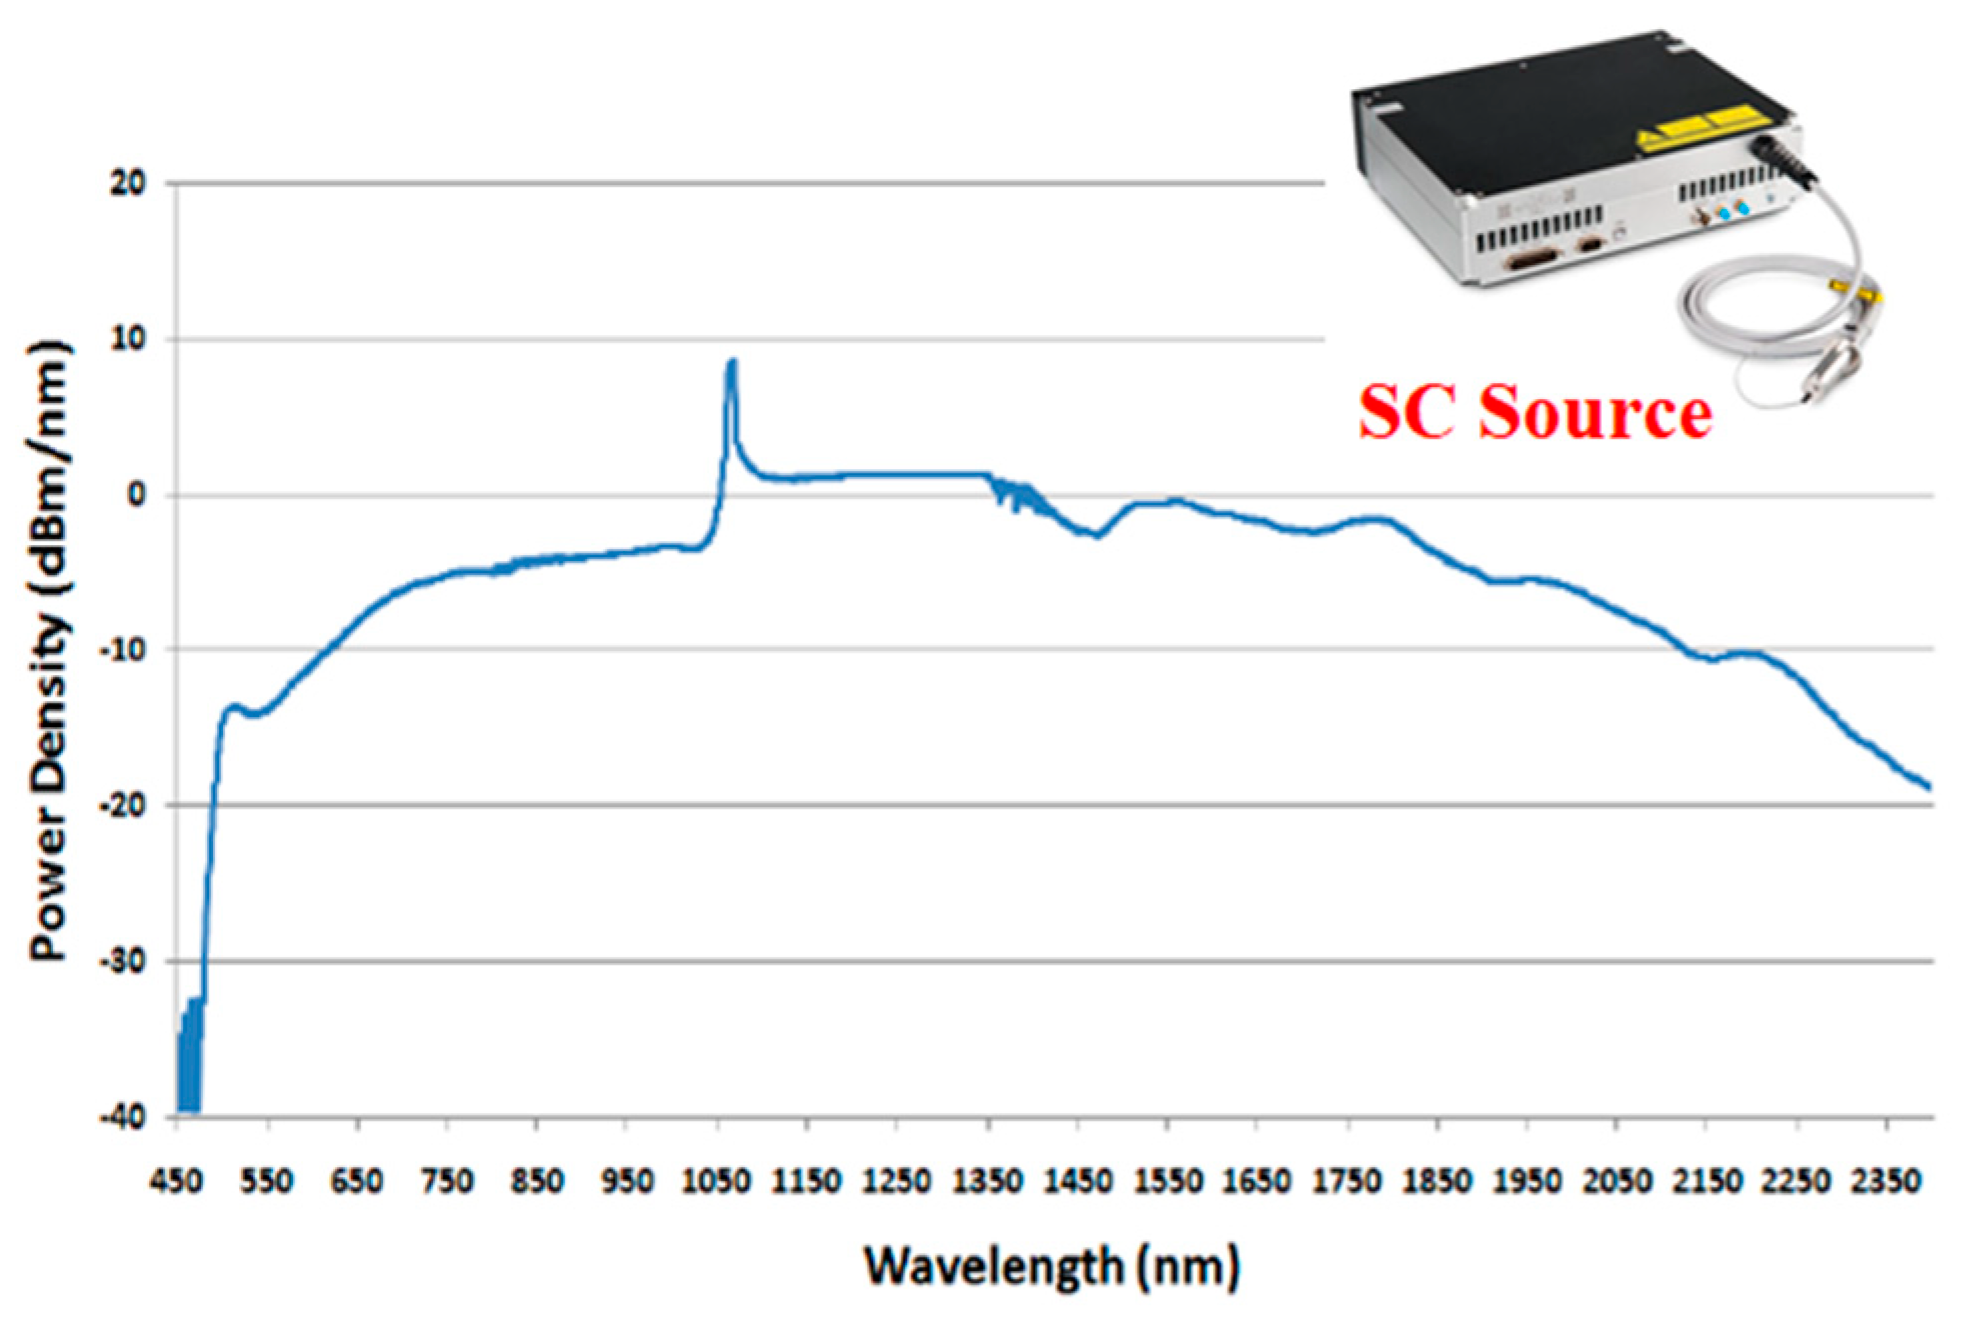
21]. The second solution is to develop the HSL through employing a super-continuum (SC) laser source replacing the above monochromatic laser sources of different wavelengths, and the SC laser source is able to emit ultra-wideband coherent laser transmissions with spectral ranging from approximately 400 nm to 2500 nm [
19,
20,
21]. Scientists from the Finnish Geospatial Research Institute (FGI) proposed the SC laser source-based spectral measurement concept in 2007 [
22]. The first results with the prototype instrument were presented with a discussion of improvements and applications in laser-based hyperspectral remote sensing [
22]. Further, in 2010, a two-channel multispectral LiDAR with 600 nm and 800 nm spectral wavelengths was developed and demonstrated, which was capable of distinguishing between a vegetation target (Norway spruce) and inorganic material using the Normalized Difference Vegetation Index (NDVI) parameter [
23]. In 2012, the first full-waveform HSL with eight spectral channels was constructed by FGI. The novel instrument produced 3D point clouds with spectral back-scattered reflectance data [
24]. Then, HSL was investigated in vegetation content estimation, leaf level chlorophyll estimation, leaf biochemical content estimation, landcover classification, and artificial object classification [
25,
26,
27,
28,
29,
30]. However, compared with the hyperspectral imager, these HSLs had restricted and discrete spectral bands and channels. For broadening the applications of HSL, attention should be paid to develop a HSL enabling continuous spectral band collection with higher spectral resolution [
31,
32,
33].
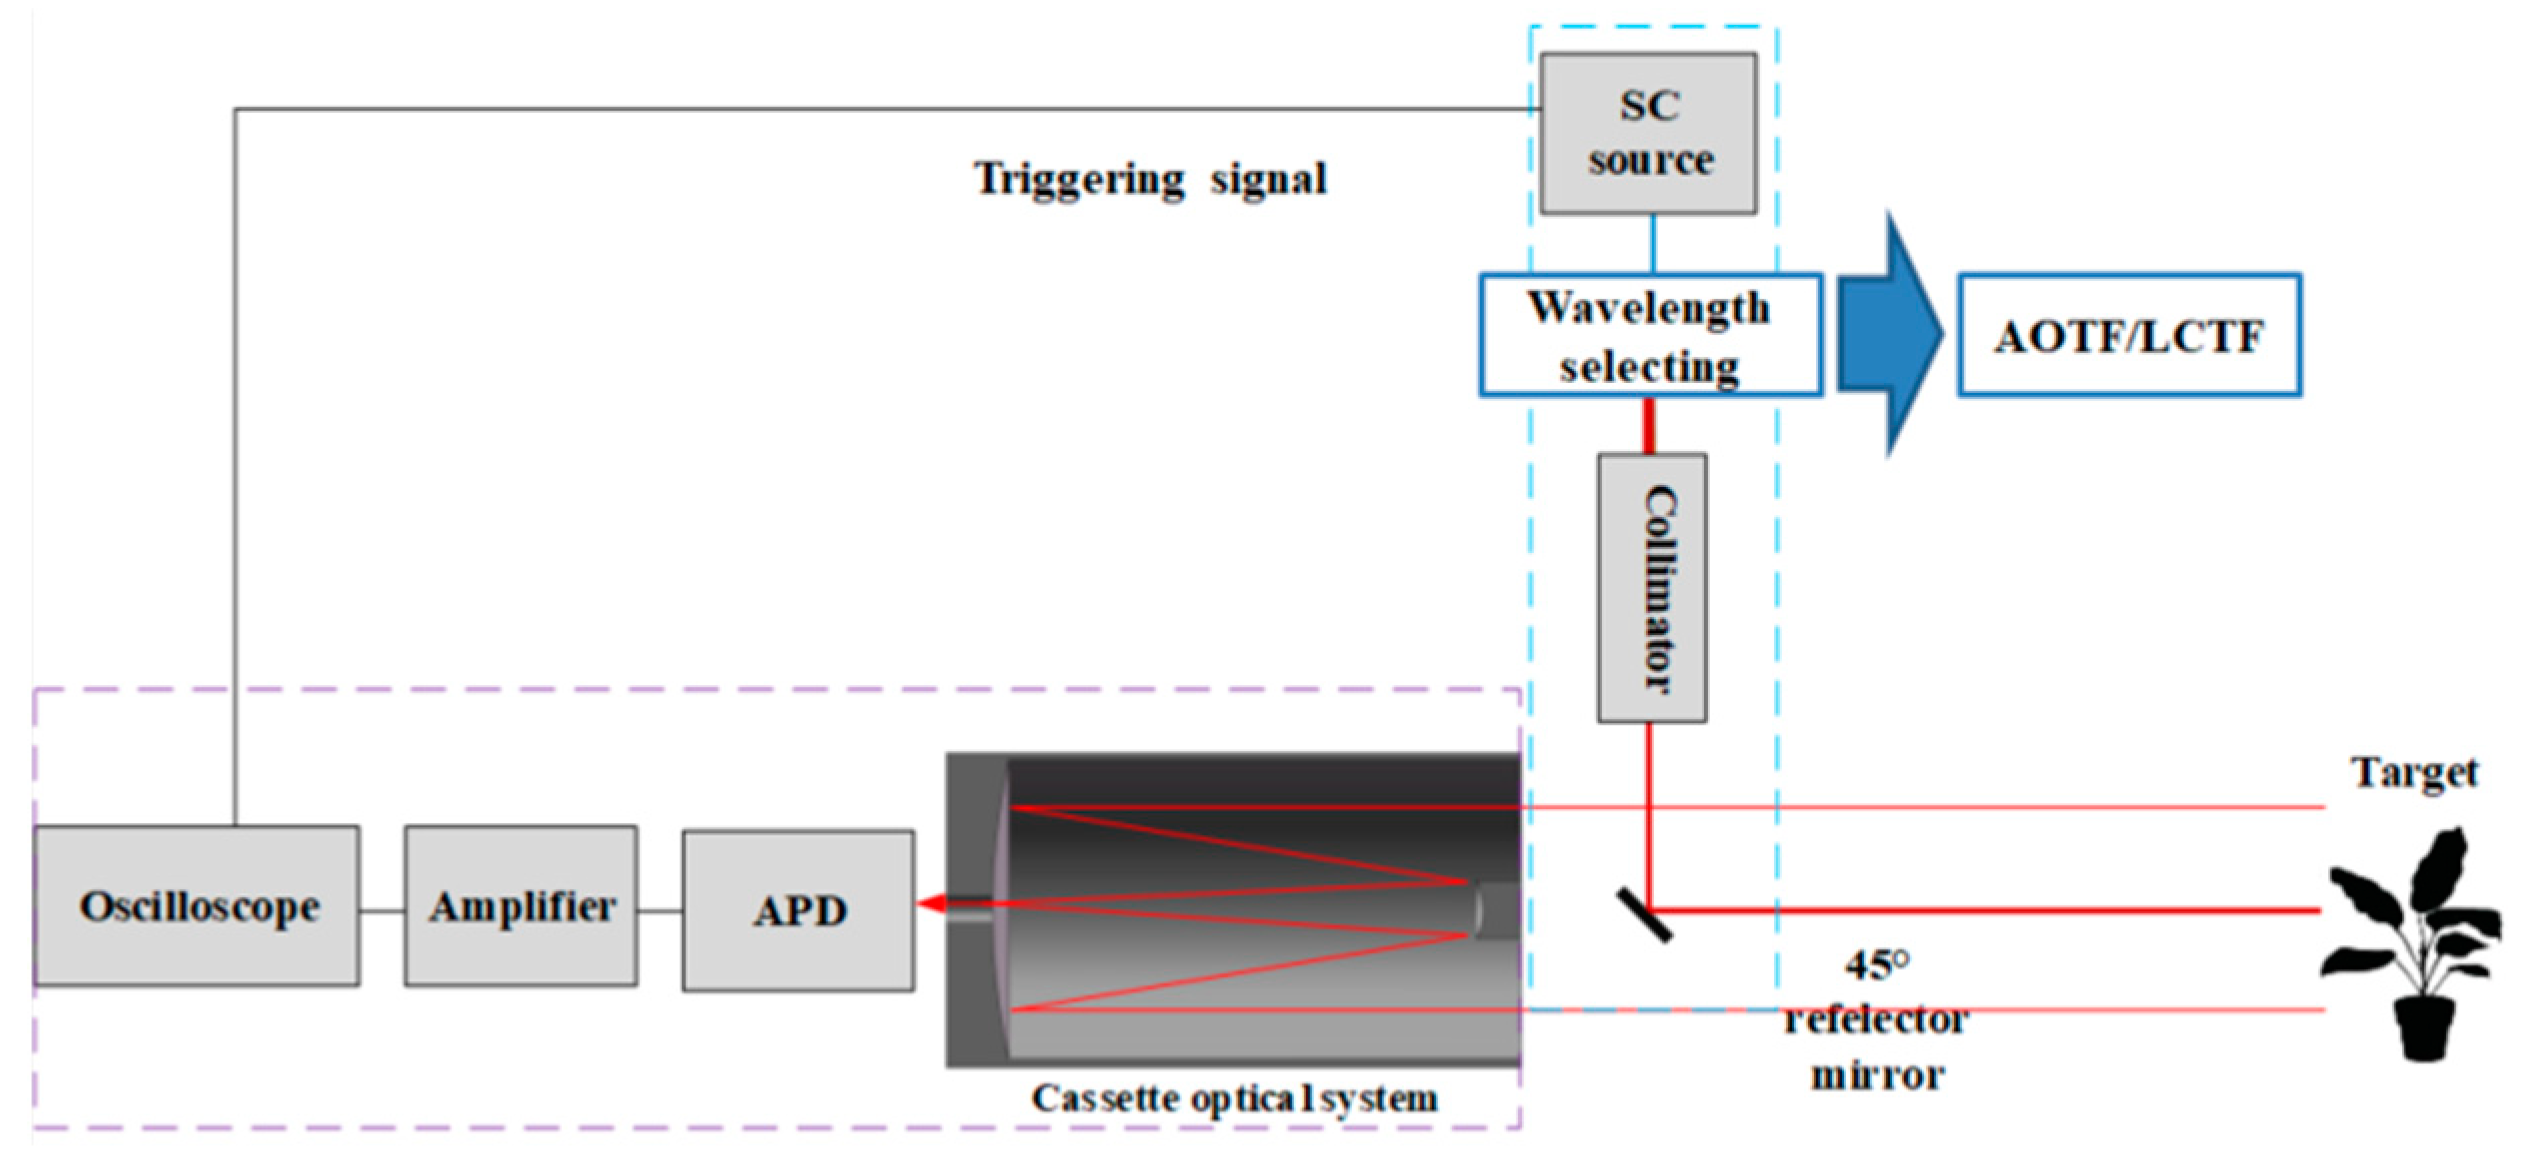
As an active instrument to acquire abundant spectral profiles, HSL usually has limited spectral bands and coverage, and a more universal and practical HSL with fine spectral resolution and coverage is of great significance for non-contact and active vegetation parameter extraction. Motivated by this, in this paper, an Acousto-optical Tunable Filter HSL (AOTF-HSL) with 10 nm spectral resolution covering 500–1000 nm was developed, and the HSL was evaluated by comparing the selected “Red Edge” (RE) vegetation parameter-related results from AOTF-HSL with those obtained using an SVC HR-1024 spectrometer.
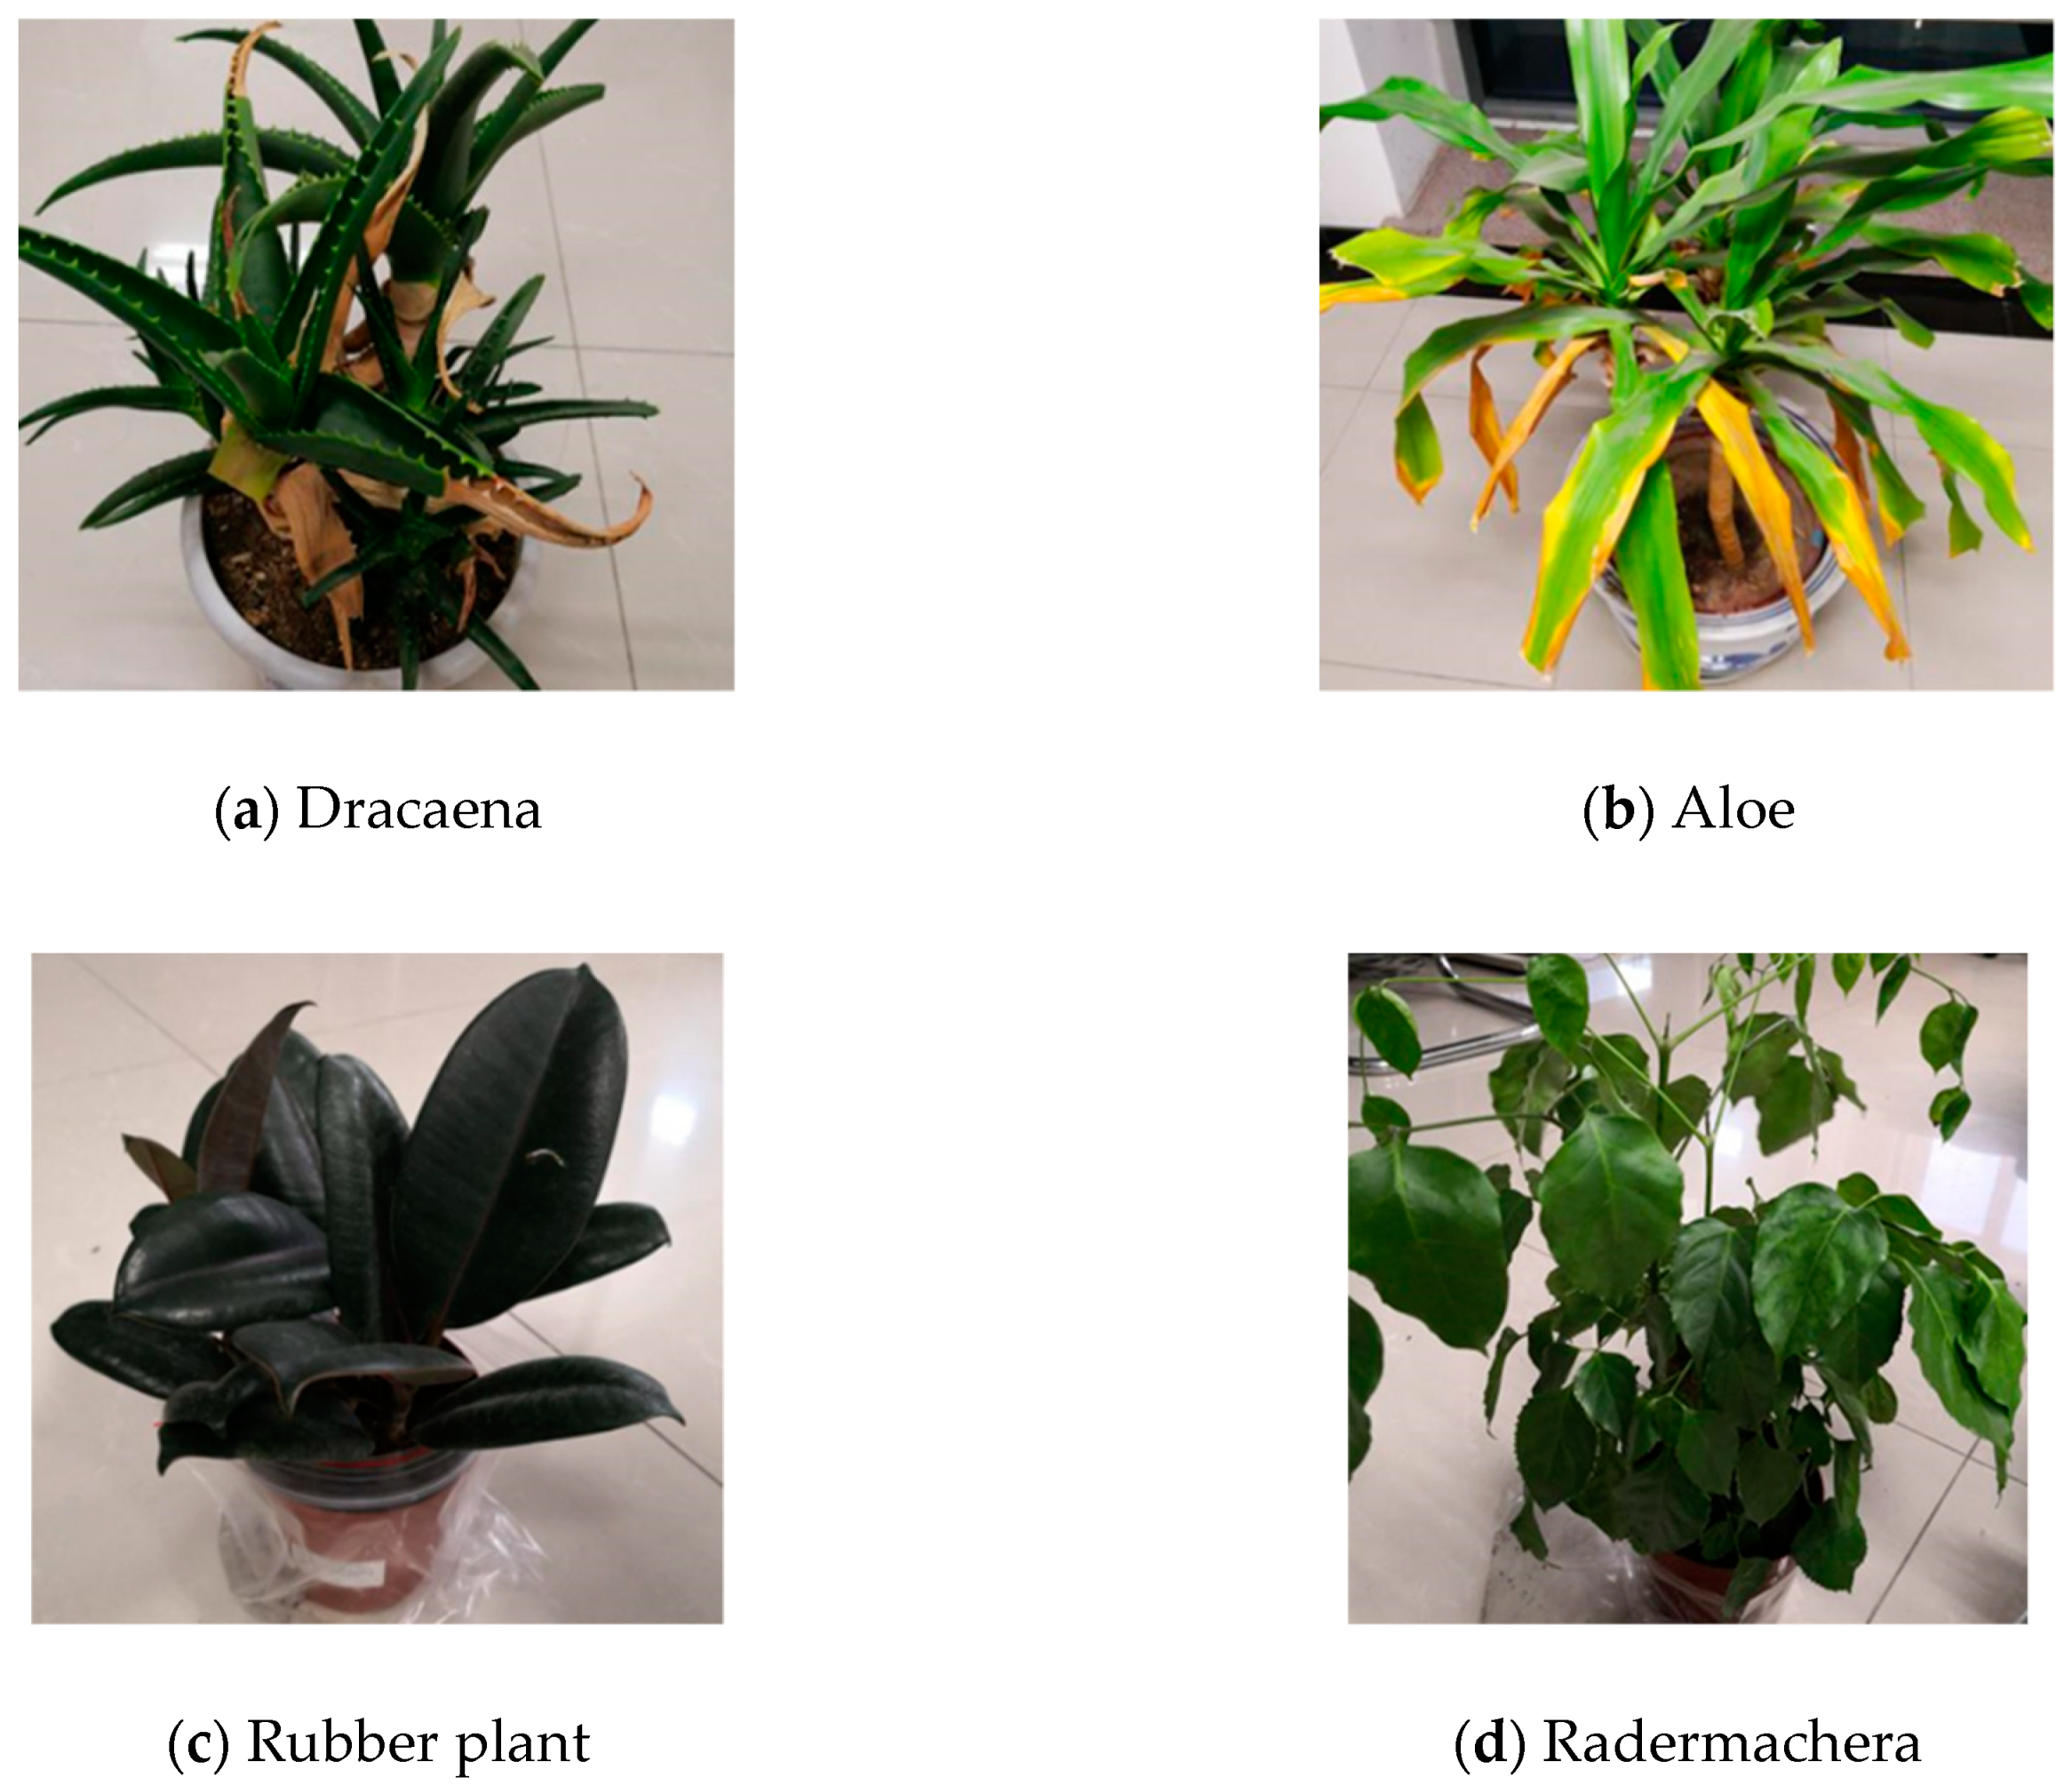
In this research, leaves from four different plants were measured to evaluate the capacity of using the spectral from the AOTF-HSL for vegetation RE-related parameter extraction. In the vegetation research community, the important “Red Edge” position (REP) parameter is closely related to various physical and chemical parameters of vegetation, and it is commonly employed to indicate the growing states of the vegetation and monitor the plant activity [
34,
35]. Thus, the RE related parameters were selected as the representative for evaluating the HSL in vegetation applications. As shown in
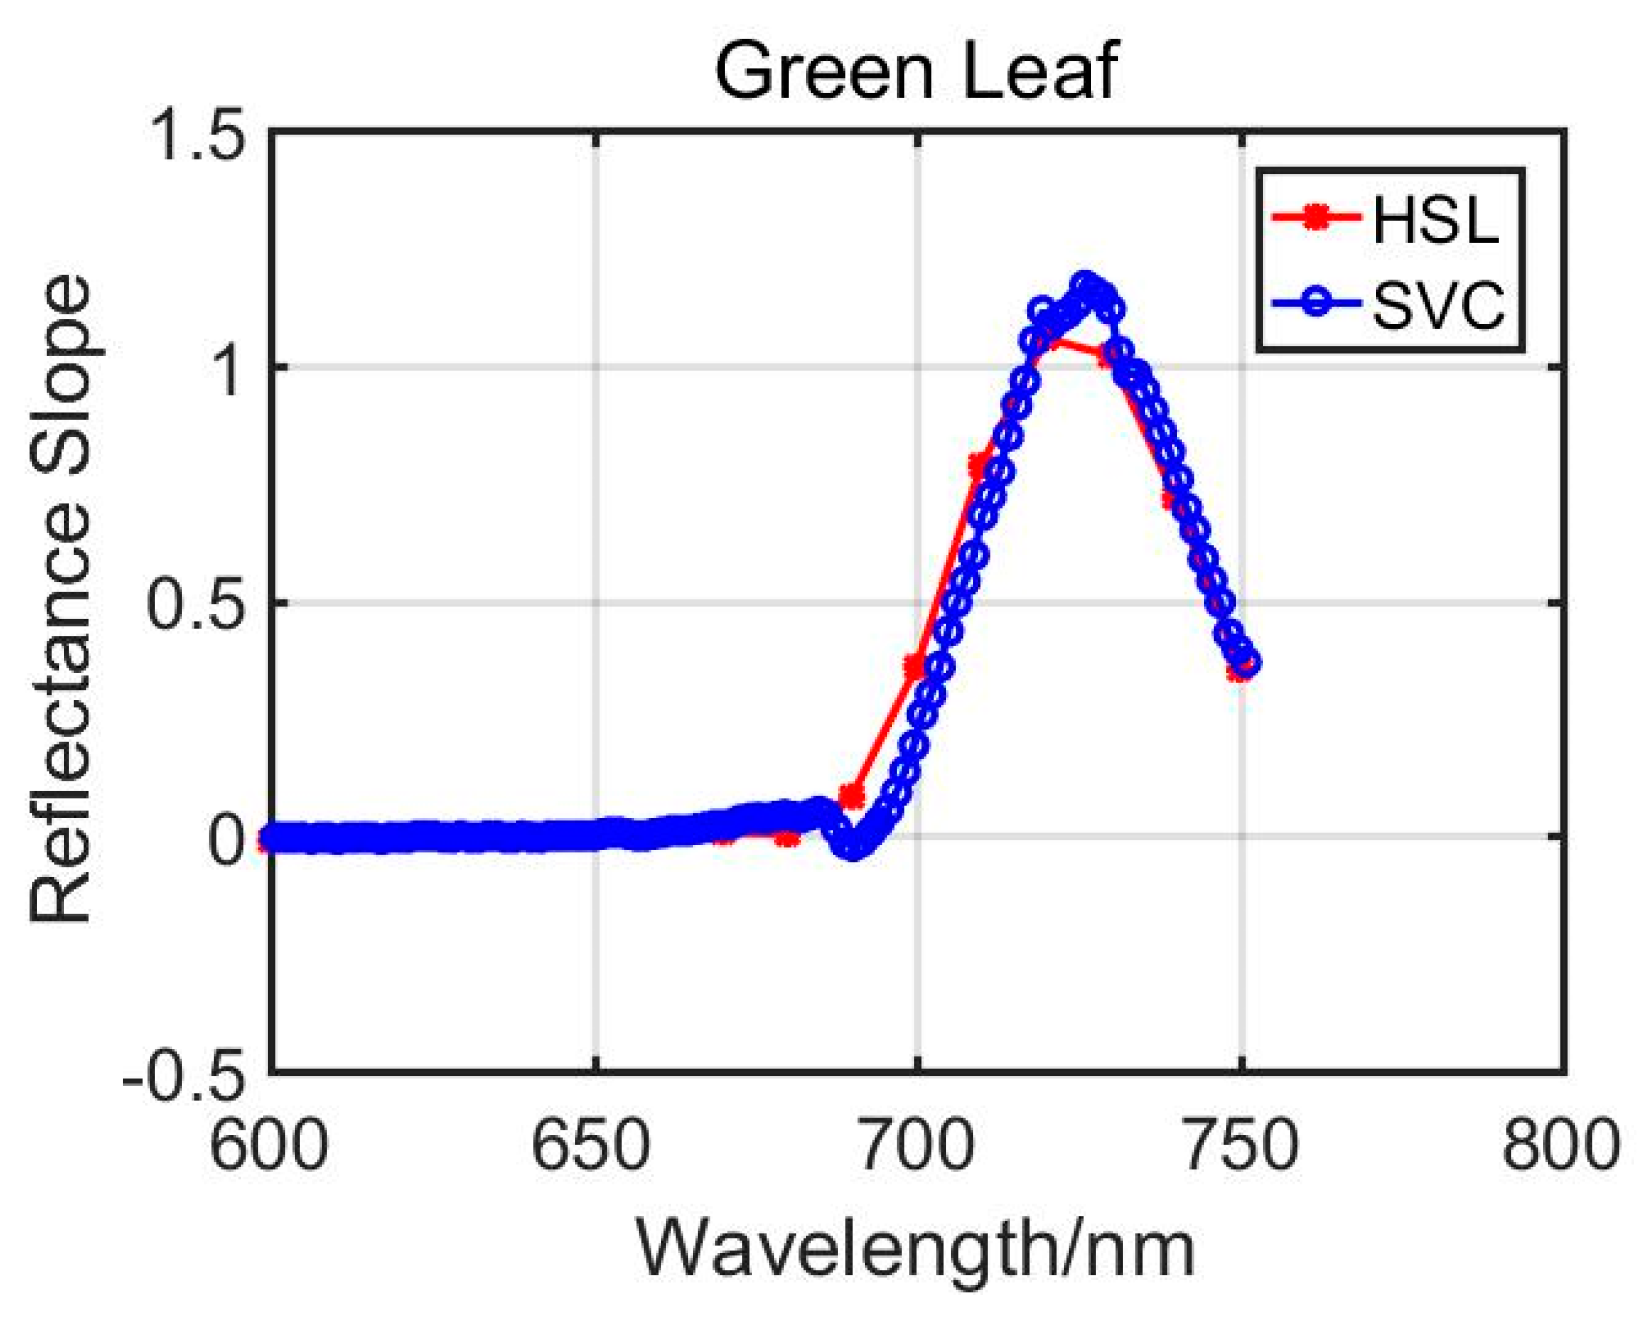
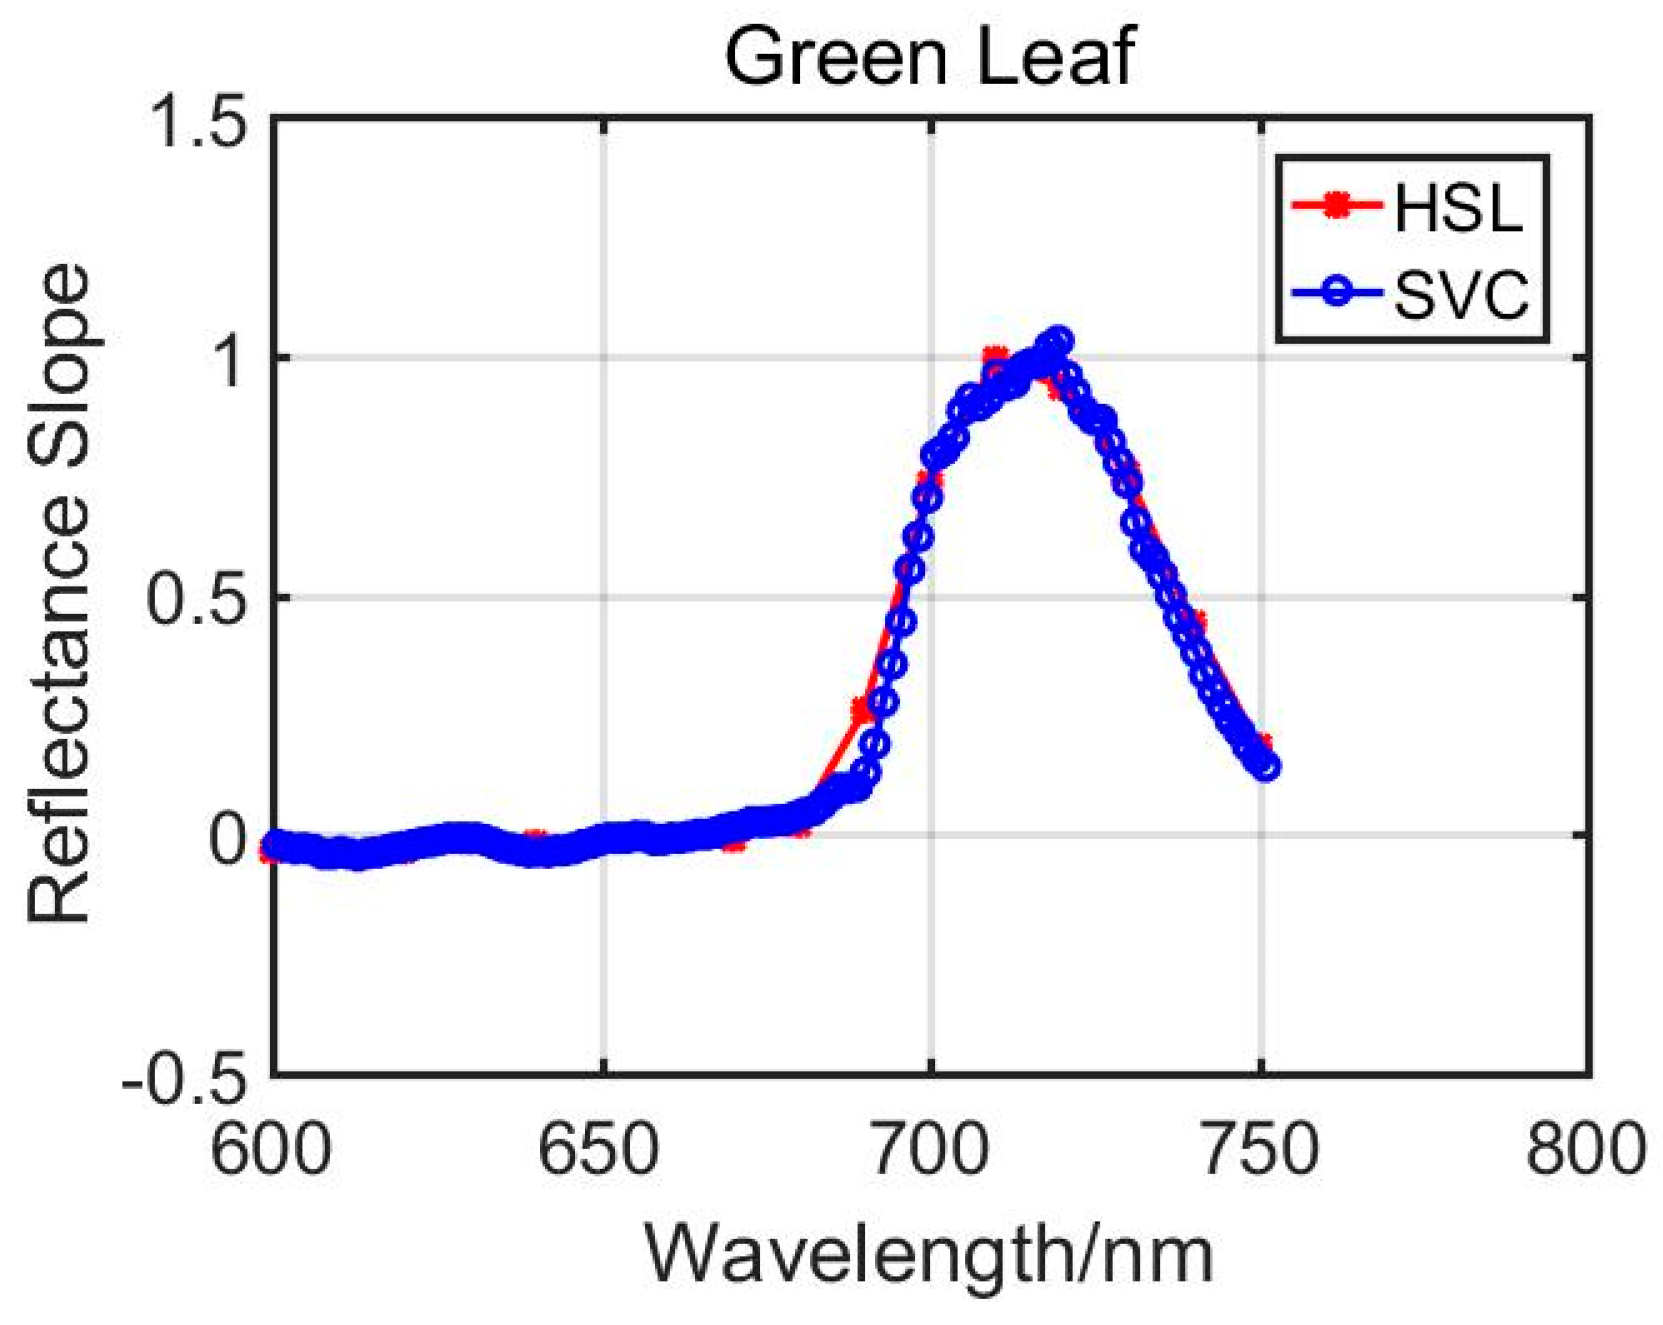
Figure 1, REP refers to the position of an inflection point of the first derivative of reflectance values, and it usually locates in the red spectrum band [
33,
34,
35,
36]. REP result comparison between the HSL and SVC spectrometer could provide a preliminary evaluation of the utility of HSL in vegetation parameter extraction.
In addition, three most common used methods (First-order Reflectance Slope (FRS), Linear Four-point Interpolation technology (LFPIT) and Linear Extrapolation technology (LET)) were investigated in this research for fully and furtherly evaluating the HSL capacity in spectral profiles acquirement and vegetation parameters extraction.
The contribution of this paper was summarized as follows:
This paper presents a more universal and applicable HSL with high spectral resolution to obtain vegetation spectral profiles, and three different RE position extraction methods were firstly employed for addressing the acquired HSL spectral profiles;
This paper is just the beginning of using the high spectral resolution HSL for vegetation index detection, which might inspire estimation of other vegetation parameters or biochemical content using this advanced HSL.
The remainder of this paper is organized as follows:
Section 2 presents the system design of the AOTF-HSL and the REP determination methods in detail;
Section 3 presents the results and analysis of the laboratory experiments concerning the RE-related parameters measurements, result comparisons between different methods and the analysis; and then the conclusions are drawn in
Section 4.
4. Discussion
The development of active measuring methods to obtain spectral information is of great significance. The AOTF-HSL technique presented in this paper has the unique characteristic of collecting a continuous spectrum in the visible and near infrared (VNIR) regions with 10 nm spectral resolution, which is the best spectral resolution in any published paper. However, limited by the HSL hardware configuration and the data processing capacity, compared with SVC spectrometer, the spectral resolution is still slightly restricted. We presume this is the major reason contributing to the slight differences between AOTF-HSL and SVC in green leaves measuring results. In addition, for REP slope and REA, these results are quite distinctive and the percentages are all larger than 30%. We think that these following reasons might account for this phenomenon:
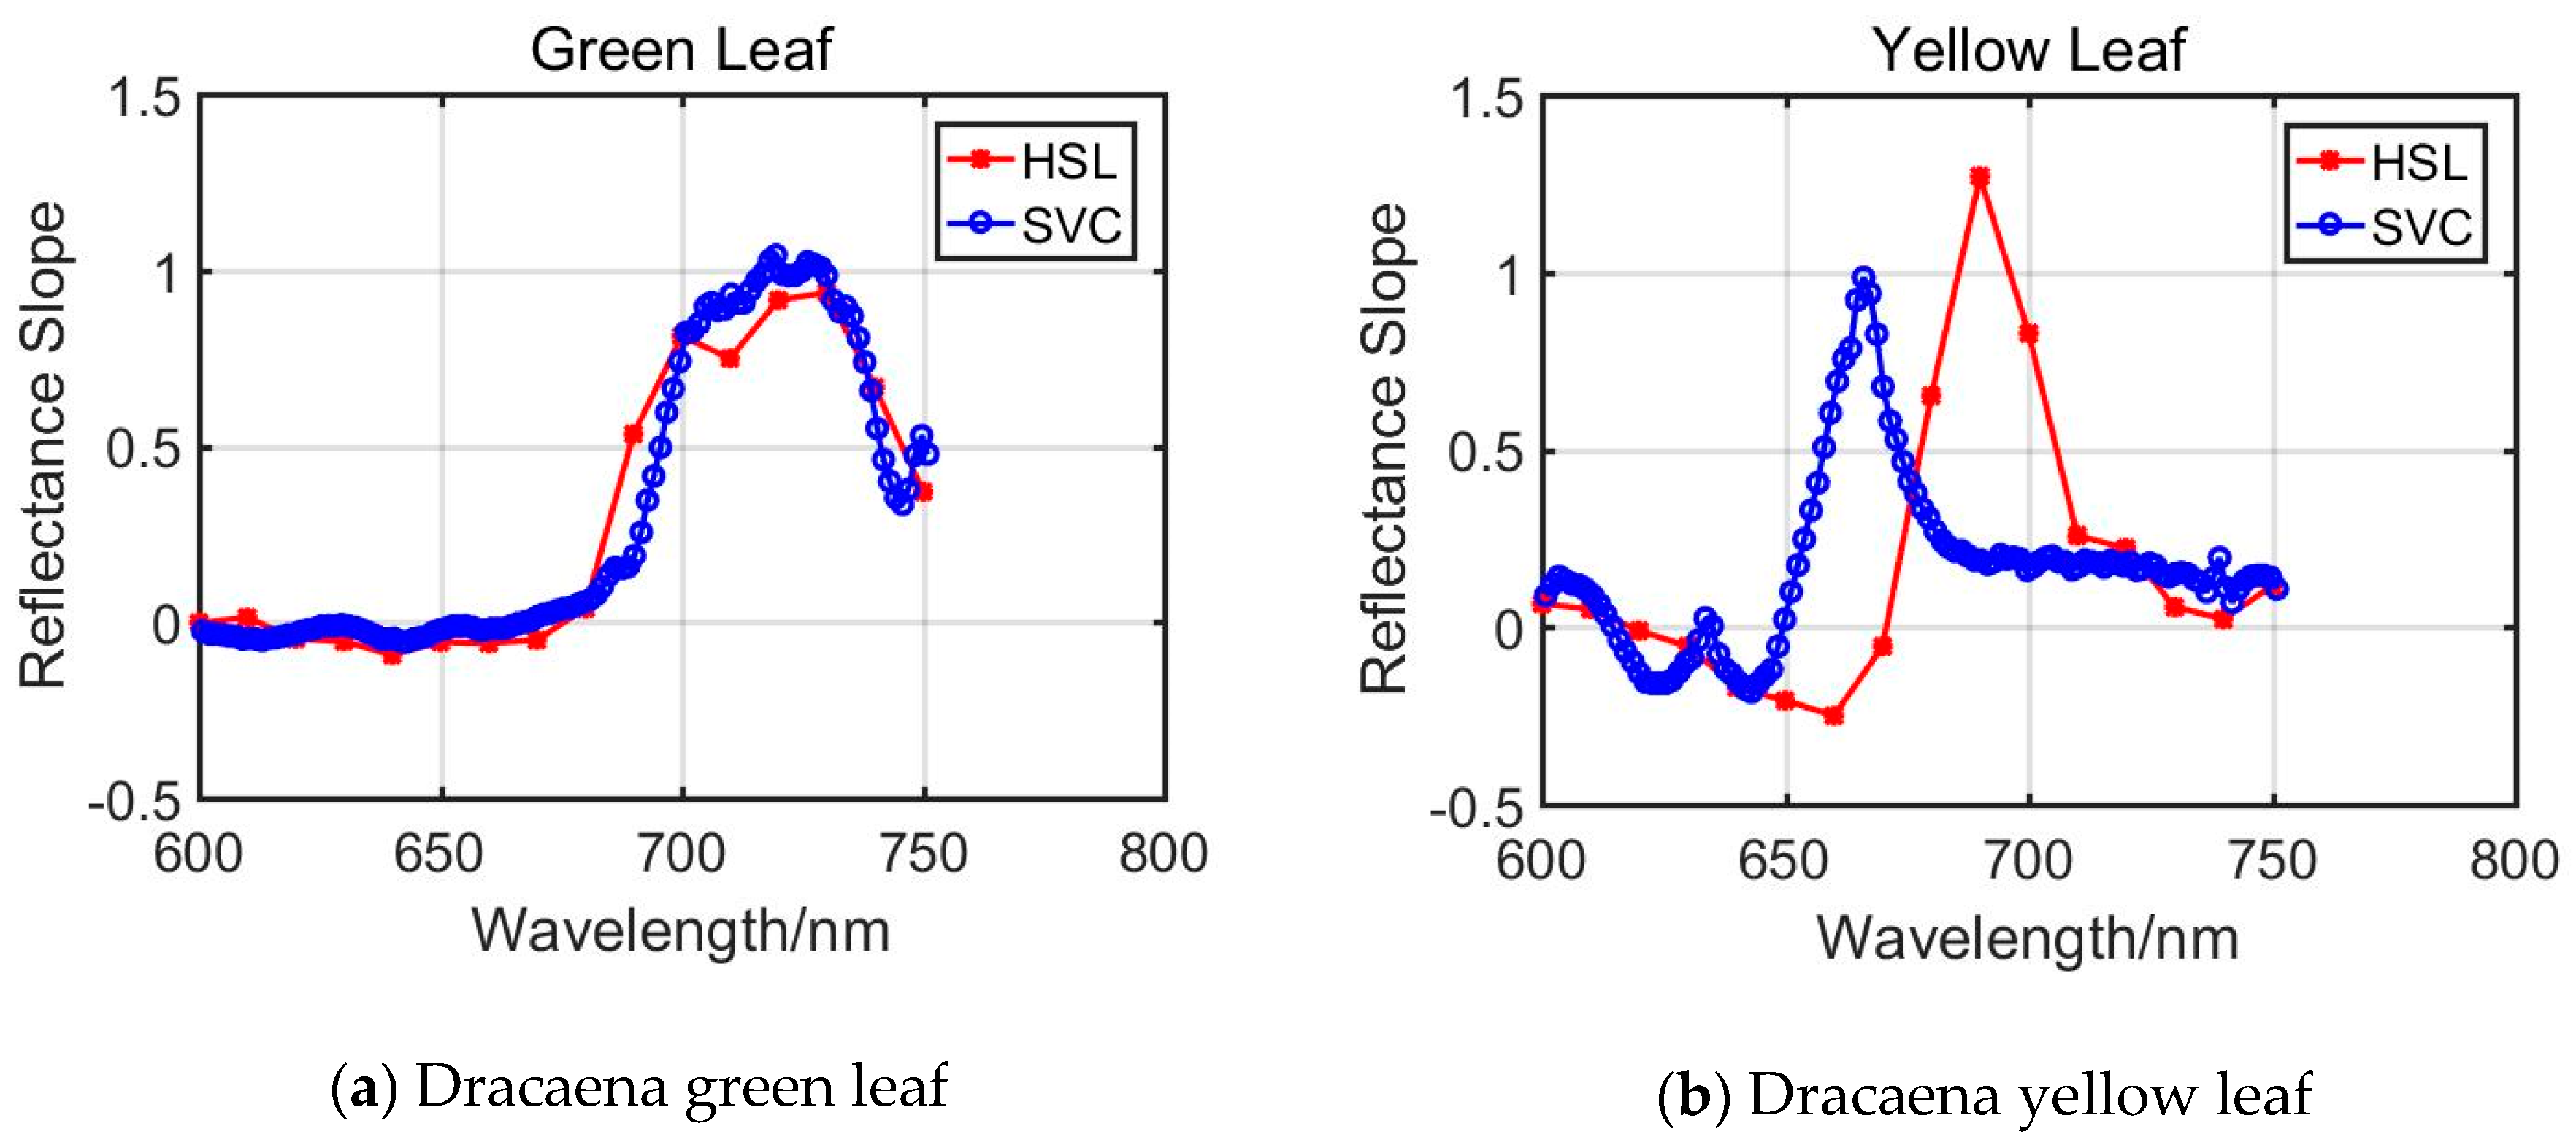
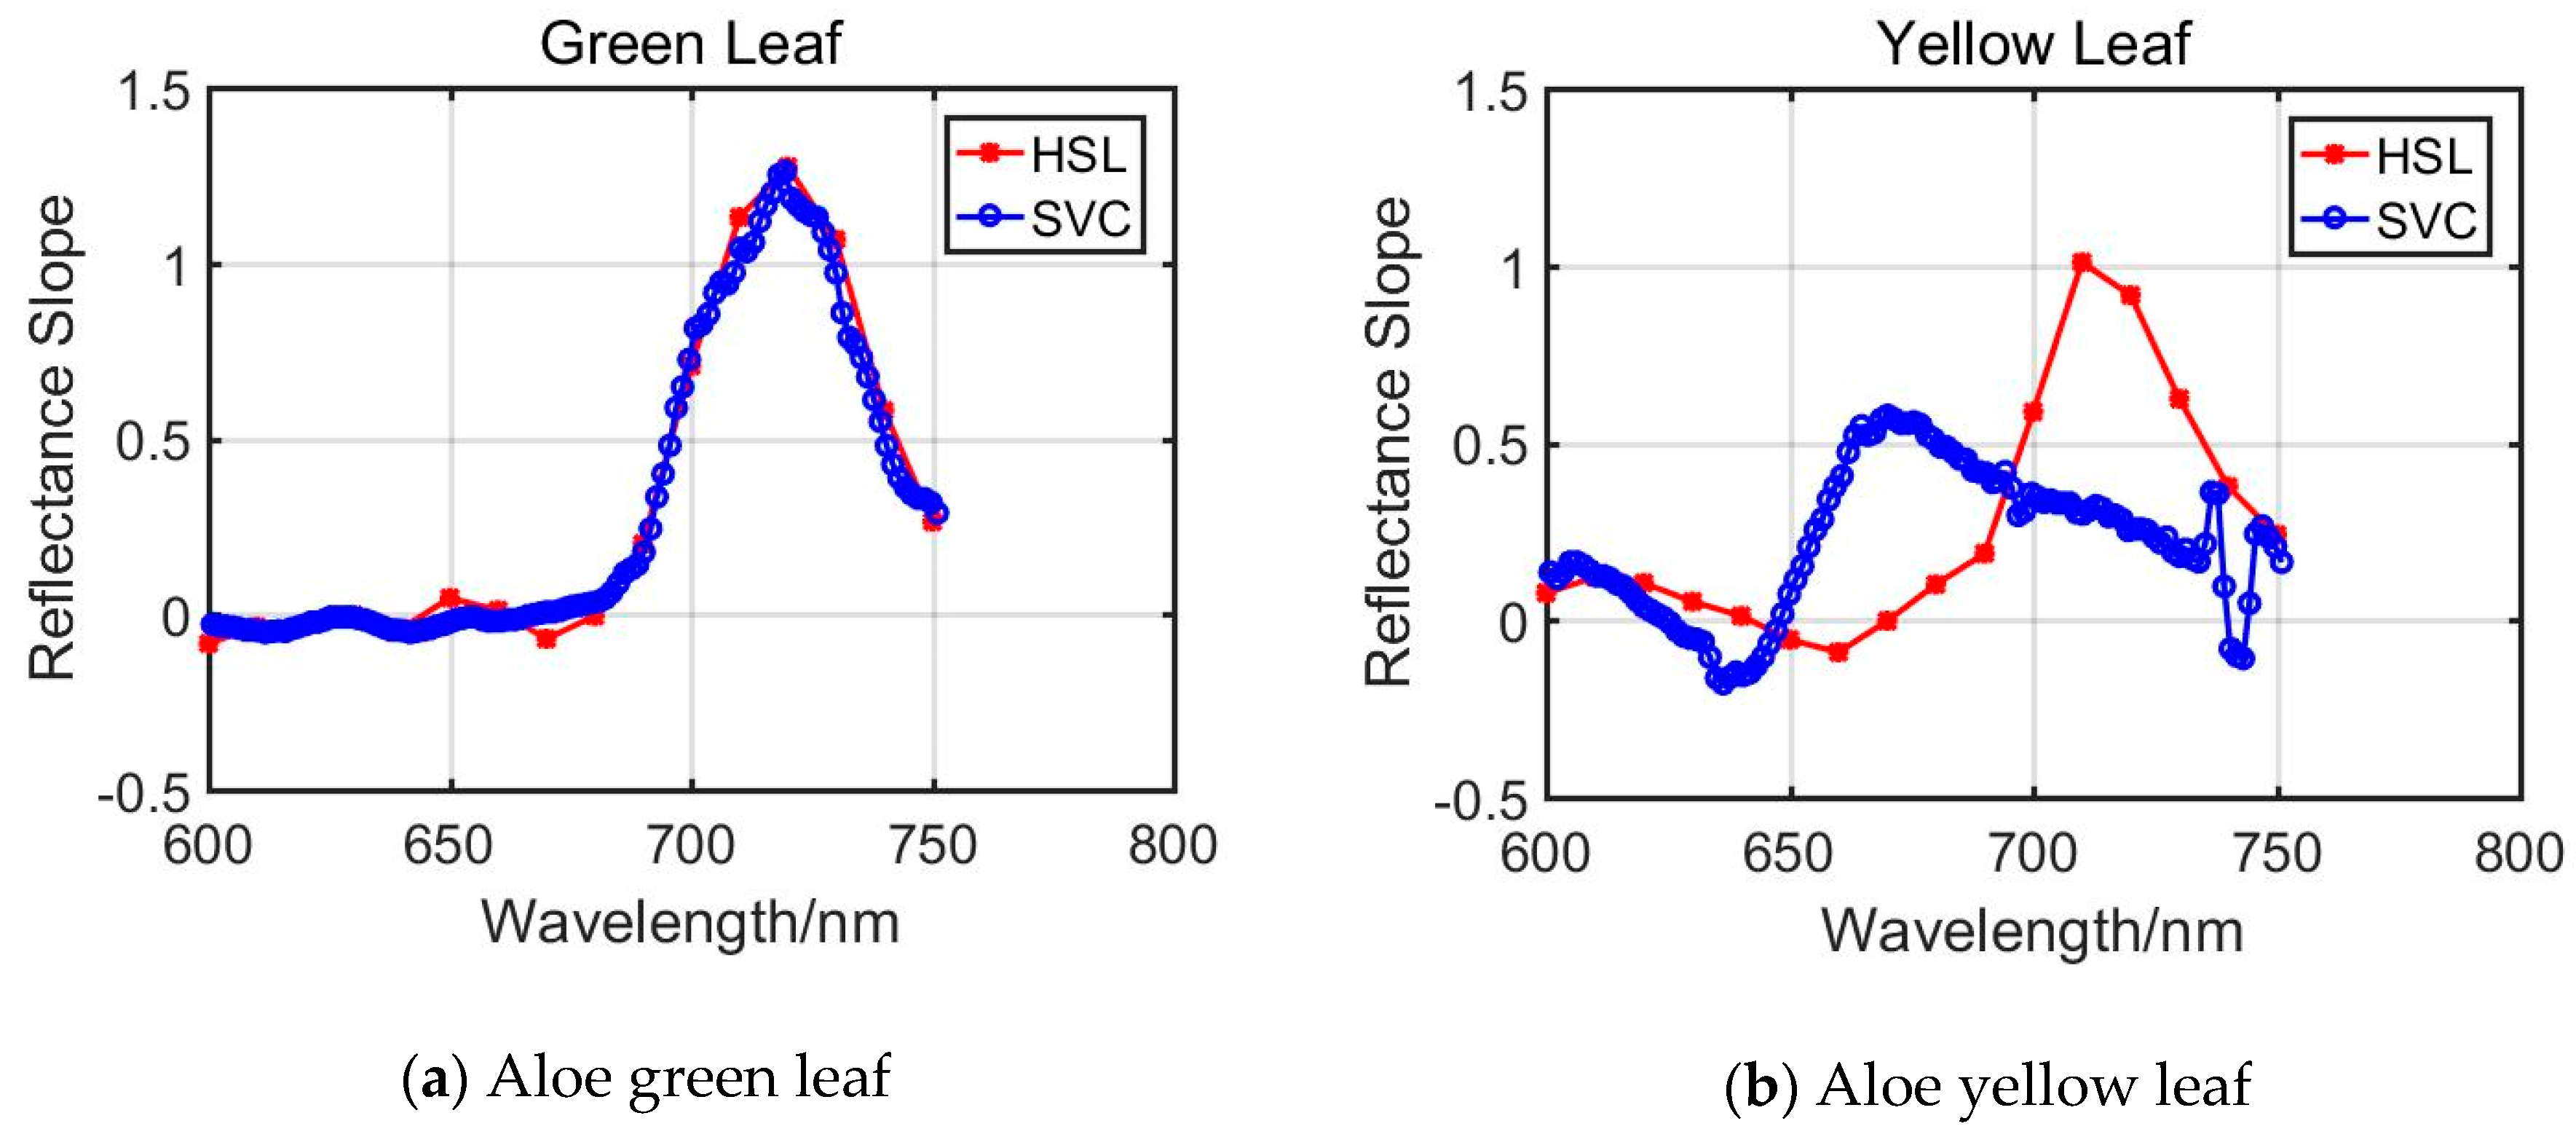
Green leaves have more uniform spectral reflectivity over their surface, since the contents affecting “Red Edge” related parameters are distributed evenly on them; in contrast to this, yellow leaves have uneven distributions of these contents as
Figure 7a,b present and the reflectivity varies for different parts of the yellow leaf;
As aforementioned in
Section 2, the hardware design, optics system, and the measurement distance determine the diameter of the laser pulse footprint for sampling, which is approximately 1 cm in this experiment with a field of view (FOV) of 0.2 mill radian. The sampled area of the spectrometer is larger (resulting in a 5.5 cm radius footprint with a 25◦ field of view). Area coverage by the laser pulse has different reflectivity due to the non-uniformity of the yellow leaves.
For the FRS method, the spectral resolution affects the calculation results. Due to the higher spectral resolution of the SVC, the spectral profile collected by SVC could contribute to more detailed descriptions of the reflectance slope changes. In the LET and LPFIT methods, the parameters are calculated using the selected reflectance at several specific spectral wavelengths, and some of them are not consistent with the selected wavelength of the AOTF-HSL. Some spectral reflectance values are calculated using the average values of the intensities from the nearby spectral wavelength. For instance, in the LET method, the 725 nm reflectance is calculated through averaging that of 720 nm and 730 nm, which might slightly affect the results. Moreover, in the LET method, only three spectral reflectance values from AOTF-HSL are employed to fit the FDR1 (680, 690 and 700 nm), which might bias the final results. Thus, we think following future works are necessary for extending the HSL enabling vegetation index estimation and determination:
HSL with finer spectral resolution is anticipated to improve the performance in vegetation index or parameter extraction, and the ultimate HSL will have similar spectral resolution with the referenced SVC spectrometer. With better spectral resolution, it is of great significance to estimate the vegetation content and produce more comparable measurements. HSL spectral profiles covering the 500–1000 nm wavelength band with 2 nm resolution is anticipated for future work, whose resolution is more feasible to produce reliable results for vegetation-related applications.
In this paper, the influence of the spectral resolution on the REP or further vegetation resolution is not investigated, limited by the hardware design. A 10 nm spectral resolution is employed in this paper, which is determined by the LiDAR raw measurement processing capacity; actually, the spectral resolution of the AOTF-HSL can be adjusted from 2 nm to 10 nm, it is of great significance for exploring the influence of the spectral resolution on the performance of the above REP extraction method.
REP is one of the most important indicators for vegetation health monitoring, but there are still some other vegetation indexes for presenting vegetation growth or content; more work would be carried out on using HSL to extract these vegetation indexes.


 ,
, 


