Article

Urbanization-Driven Changes in Land-Climate Dynamics: A Case Study of Haihe River Basin, China

1
Institute of Ecology, College of Urban and Environmental Sciences, and Ministry of Education Laboratory for Earth Surface Processes, Peking University, Beijing 100871, China
2
Resource Ecology Group, Wageningen University and Research, 6708PB Wageningen, The Netherlands
3
NEO.B.V, 3811HN Amersfoort the Netherlands; Laboratory of Geo-Information Science and Remote Sensing, Wageningen University and Research, 6700AA Wageningen, The Netherlands
4
Faculty of Geographical Science, Beijing Normal University, Beijing 100875, China
5
Vocational and Technical Education College, Fujian Normal University, No.8 Shangsan Road, Cangshan District, Fuzhou 350007, China
*
Author to whom correspondence should be addressed.
Remote Sens. 2020, 12(17), 2701; https://doi.org/10.3390/rs12172701
Submission received: 26 July 2020 / Accepted: 18 August 2020 / Published: 20 August 2020
(This article belongs to the Special Issue Understanding Urban Systems Using Remote Sensing)

Abstract

:
Urbanization changes the land surface environment, which alters the regional climate system. In this study, we took the Haihe River Basin in China as a case study area, as it is highly populated and experienced rapid urbanization from 2000–2015. We investigated how land use and cover change (LUCC) was driven by urban land development affects land-climate dynamics. From 2000–2015, we collected data from the land use and cover database, the remote sensing database of the Moderate Resolution Imaging Spectroradiometer (MODIS) series, and the meteorological database to process and generate regional datasets for LUCC maps. We organized data by years aligned with the selected indicators of land surface, normalized difference vegetation index (NDVI), albedo, and land surface temperature (LST), as well as of regional climate, cloud water content (CWC), and precipitation (P). The assembled datasets were processed to perform statistical analysis and conduct structural equation modelling (SEM). Based on eco-climatology principles and the biophysical process in the land-climate dynamics, we made assumptions on how the indicators connected to each other. Moreover, we testified and quantified them in SEM. LUCC results found that from 2000–2015 the urban area proportion increased by 214% (2.20–6.91%), while the agricultural land decreased by 7.2% (53.05–49.25%) and the forest increased by 4.3% (10.02–10.45%), respectively. This demonstrated how cropland intensification and afforestation happened in the urbanizing basin. SEM results showed that the forest had both positive and negative effects on the regional hydrological cycle. The agricultural land, grassland, and shrub had indirect effects on the P via different biophysical functions of LST. The overall effects of urbanization on regional precipitation was positive (pathway correlation coefficient = 0.25). The interpretation of how urbanization drives LUCC and alters regional climate were herein discussed in different aspects of socioeconomic development, biophysical processes, and urbanization-related atmospheric effects. We provided suggestions for further possible research on monitoring and assessment, putting forth recommendations to advance sustainability via land planning and management, including agricultural land conservation, paying more attention to the quality growth of forest rather than the merely area expansion, integrating the interdisciplinary approach, and assessing climatic risk for extreme precipitation and urban flooding.

Graphical Abstract

1. Introduction

Urbanization, industrialization, cropland intensification, and climate change are major anthropogenic drivers that significantly alter land surface properties and processes of terrestrial ecosystems [1,2,3]. The biophysics and chemical properties of land surface, characterized by land use and cover change (LUCC), regulate atmosphere transportation and solar radiation processes, and thus the heat-hydro environment [4,5]. Since the 1990s, uncovering the interaction between LUCC and climate change has become a hot spot in earth system studies [6,7]. Two main directions in the research of land-climate interaction are the impact of climate change on the land surface ecosystem processes and the effects of land surface processes on the regional climate system [8,9,10]. The recent accumulation of remote sensing databases released by European, US, and Chinese agencies, including hundreds of environmental indicators at the global scale, offered new opportunities to investigate the relationship between LUCC and regional climate systems over space and time [11,12]. However, previous studies have mostly focused on the statistical relationships between specific pairs of variables [4,6,7]. In the face of global changes, an integrated framework linking major factors of land-climate dynamics is required to disentangle the complexity of such coupled systems and their underlying mechanisms.
Here, we focus on urbanization-driven LUCC, which may alter land-climate dynamics and regional climate, which could potentially feedback to human society. Specifically, urbanization-related land uses—including architecture building, farming, and afforestation—with the massive use of artificial and natural materials at the large scale of landscape, could affect the spatial distribution of land surface energy balance through the urban heat island effect [13,14]. Such land use changes can also affect the regional hydrological cycle through evapotranspiration and the shaping of the wind profile, water areas, and heat fluxes [15,16,17]. The heat-hydro environment in turn influences the societal preference in living and producing as the regional climatic effect on human residence and movement. Thus, urbanization-driven LUCC has the regulating function by altering regional climate, which can be quantified and monetarized under the framework of ecosystem services for optimizing the land ecological and economic benefits in land planning and management [14,18,19].
The Haihe River Basin in China is a highly populated area, serving as the economic and social development center of the nation. Over the past two decades, the basin has experienced significant urbanization and population growth [20]. Moreover, massive afforestation projects have been implemented to provide natural goods and services for the populated plain in the basin. The major ecological projects—including the Three-North Shelter Forest Program and Afforestation Program for Taihang Mountain—aimed to restore ecosystems and control desertification for protecting local people from sandstorms, in addition conserving water resources and developing forestry to supply food and other woody products to regional industries [21,22]. Evaluating the regional climatic effects of urbanization-driven LUCC is important for understanding the ecosystem function of the basin and for regional sustainable development.
In this study, we investigated the urbanization-driven changes in the land-climate dynamics in the Haihe River basin by combining datasets of satellite imagery and meteorological assimilation. In particular, we examined how urbanization-driven LUCC changes key indicators of land surface characteristics and hydrological cycle, i.e., the normalized difference vegetation index (NDVI), albedo, land surface temperature (LST), cloud water content (CWC), and precipitation (P). We aimed to answer two questions: (1) how urbanization drives the LUCC and (2) how LUCC alter regional land-climate dynamics. The original input datasets of the indicators cover range from 2000 to 2015 at the monthly temporal resolution. We conduct structural equations to model and testify the effects of urbanization on LUCC and land-climate indicators at the year-scale. We conclude with a discussion on the detailed interpretations and implications of our results for regional land planning and management.

2. Materials and Methods
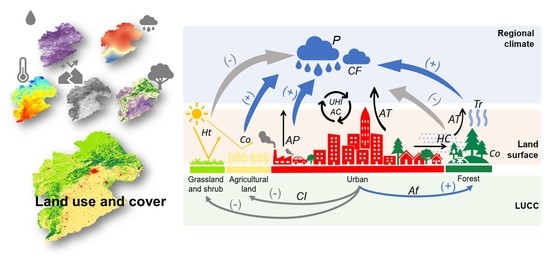
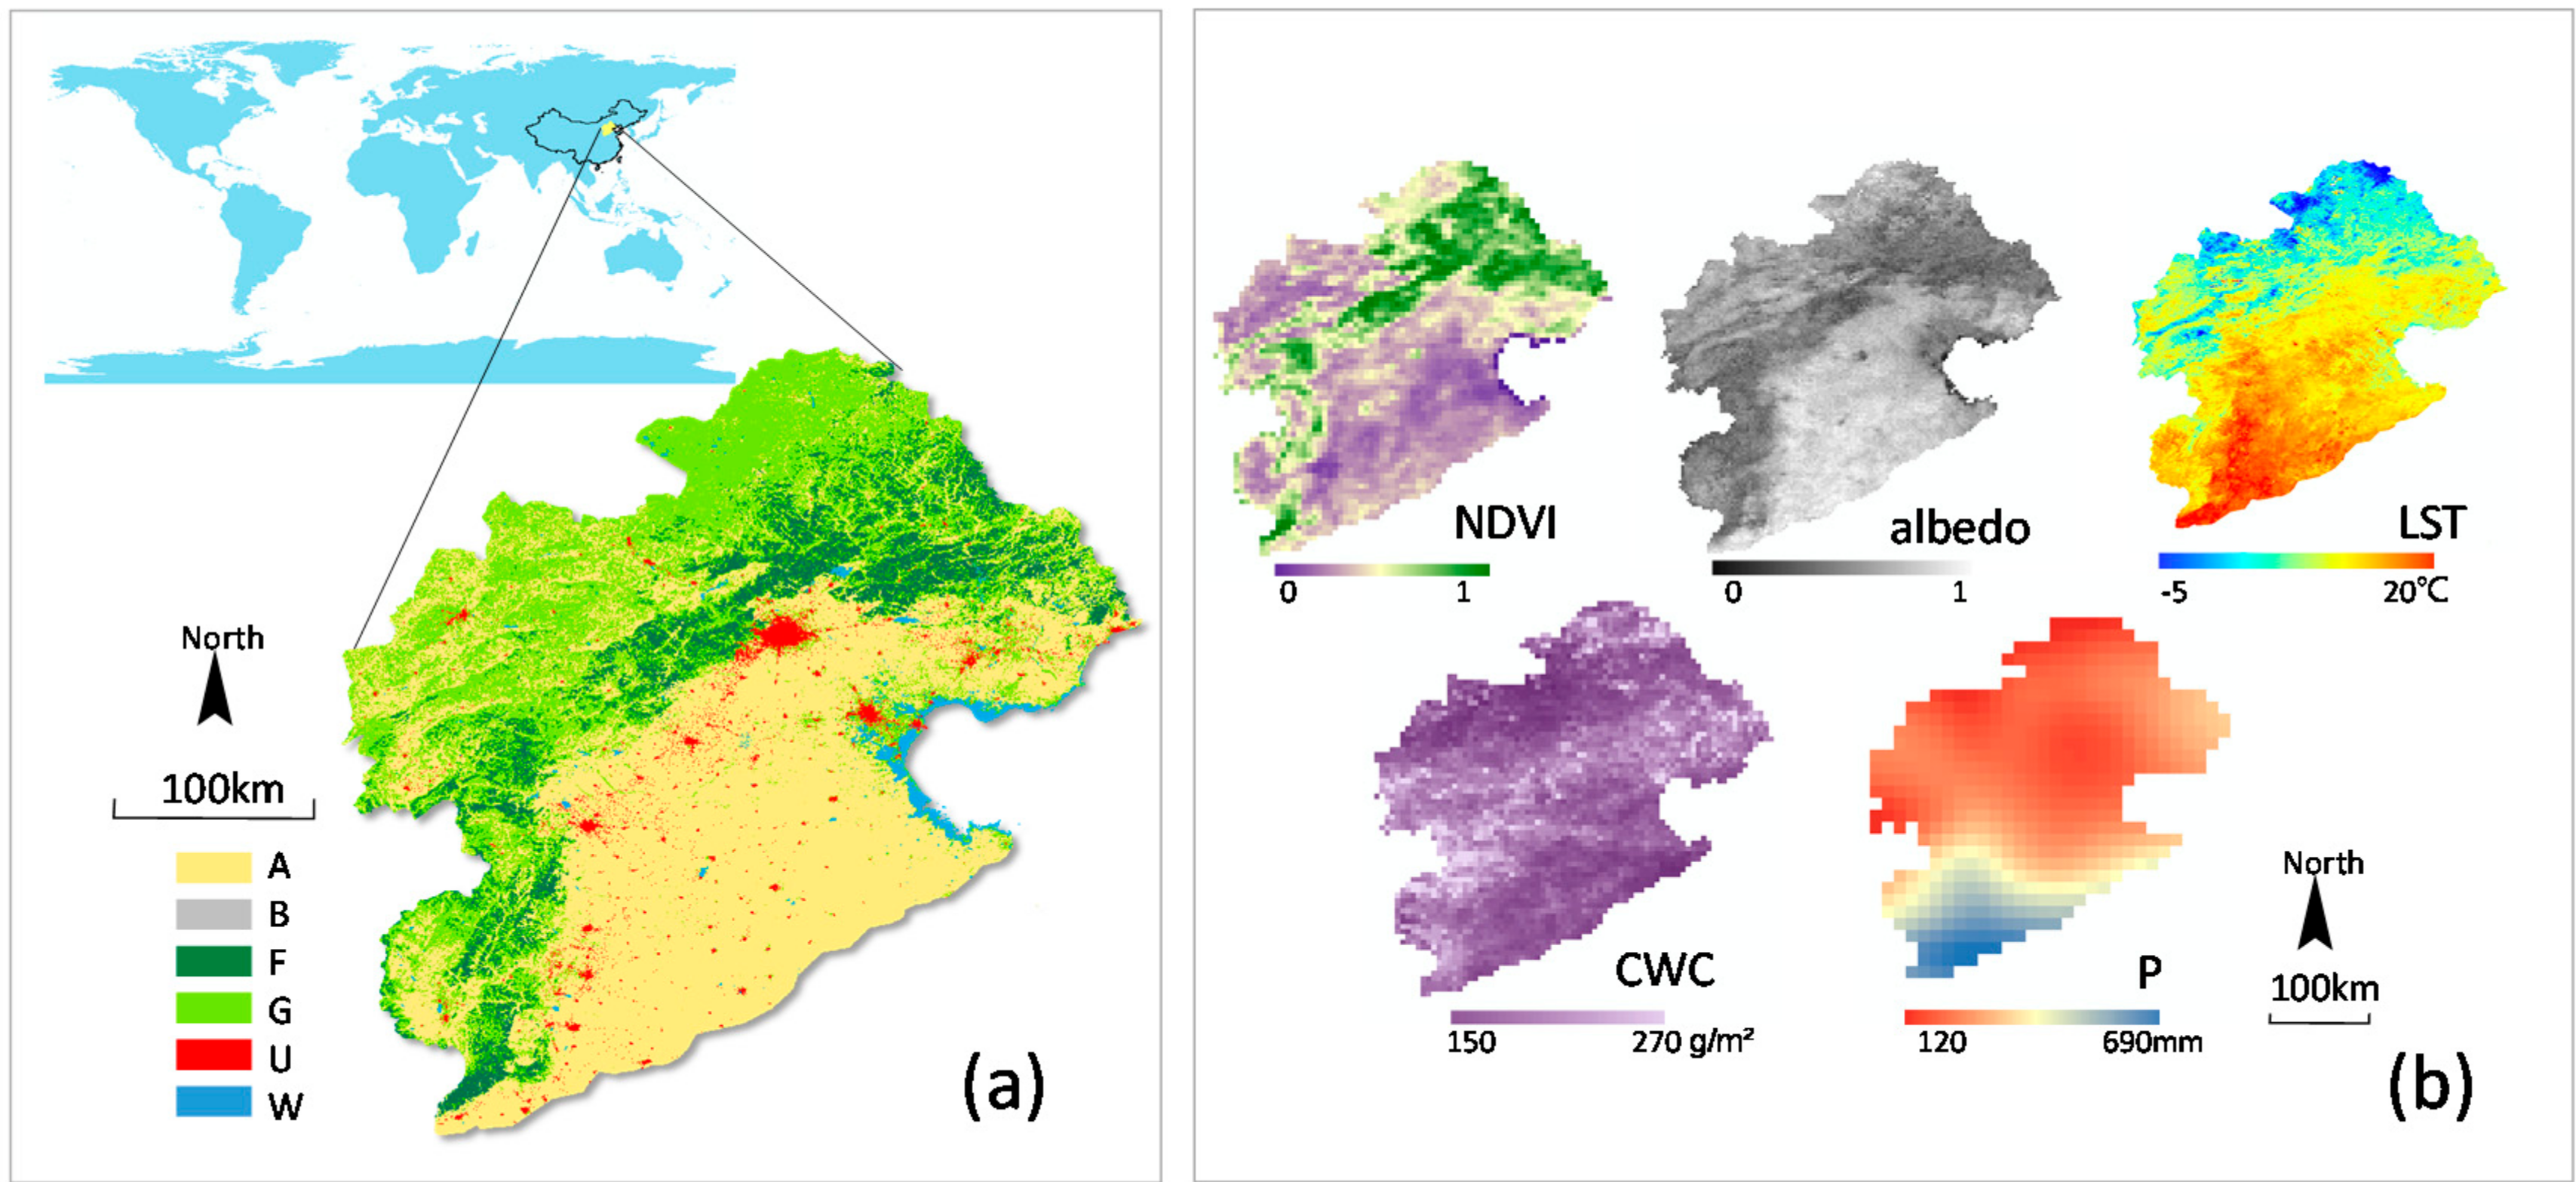
2.1. Study Area

Haihe River Basin is a populated and developed zone in northern China, mainly covering Beijing, Tianjin, the Hebei Province, as well as a part of the Inner Mongolia, Shanxi, and Shandong Provinces (Figure 1a), including 26 cities. The area of the basin is 318,200 km2, which is ~3.3% of the whole China. The topography is higher in the northwestern part and lower in the southeastern part (elevation ranges: 3.5~3061 m). The plateau and the mountainous areas count for approximately 60% of the whole basin and the plain counts for ~40%. The climatic type of the area is Temperate East Asian Monsoon Climate. The annual average temperature ranges between 4.4 and 14.6 °C, and the average annual precipitation is about 535.7 mm [23,24].
The resources development and the LUCC of the basin were mostly driven by population growth and urbanization in the plain area. Around Beijing, a megacity group of Jing-Jin-Ji (Beijing-Tianjin-Hebei) has been developing and radiating its surrounding areas since the 1970s, which plays a critical role in China and East Asia’s economic and social development [25,26]. The population was over 130 million in 2015, which is 10% of the national population. In the mid-1990s, across the river basin, national ecological restoration and greening projects were implemented. Around 2008, Beijing and its surrounding cities devoted efforts to improving their environmental conditions to host the Olympic Games. The national and provincial economic areas have been established and developed in the basin. Following these changes, the land use and policy has constantly changed, and urban environmental problems like heat island effect and haze pollution have emerged [18].

2.2. Data Source and Data Processing

To obtain LUCC data in the Haihe River Basin, we selected a satellite imagery product from the global land cover database, which was generated and released under the Climate Change Initiative and European Space Agency. We downloaded the original dataset that covered the whole world from 2000 to 2015 (one scene for each year) at a spatial resolution of 300 m from the online service. The original land use and cover classification included 6 generalized categories, i.e., agriculture, forest, grassland, wetland, settlement (urban), and ‘other’, as well as 22 sub-categories in the original spatial dataset [12]. We applied the ‘extraction by mask’ tool on the vector shapefile of the Haihe River Basin profile to clip out the LUCC maps covering the range of our study area from 2000 to 2015. According to the local situation, we then combined the sub-categories and adjusted the LUCC classification into 6 types, i.e., agricultural land, bare land, forest, grassland/shrub, urban, waters, and wetland, for the following analysis.
The principle of eco-climatology indicates that at the regional scale, the ecosystem succession accumulates its effects on the atmospheric system by both spatial and temporal dimensions through the cause-effect chain from basic land surface biophysical characteristics to the heat and hydrological cycle distribution environment, which was theorized as the land-climate interaction [15,27]. Following the eco-climatology principle, we first selected a set of relevant key variables including vegetation, land surface physical structure, aerodynamic properties, solar radiation, thermal, and hydrological cycles to analyze the land-climate compounding system of the study area. Then, based on considerations of representativity, non-collinearity, data availability, and scale matchiness, we finally screened out 5 key indicators: NDVI, albedo, LST, cloud water content (CWC), and precipitation (P), to capture the land-climate interaction (Figure 1b). NDVI represents the vegetation condition by monitoring the growth quality of plants on the land surface; LST represents the surface heat environment as being retrieved with the thermal infrared band reflectance; CWC represents cloud formation and the aerial water condition; P represents the regional hydrological cycle. The datasets of these key indicators were collected from different global or national databases (Table S1), including MOD13Q1.006 Terra for NDVI (250 m spatial resolution), MCD43A1.005 BRDF for albedo (500 m spatial resolution), MODLT1M for LST (1km spatial resolution), MOD08 V6 Atmosphere Monthly Global Product for CWC (1 arc degree spatial resolution), and Global Land Data Assimilation System for P (0.25 arc degree spatial resolution) [28,29]. The dataset of LST was downloaded from Geospatial Data Cloud platform. All other datasets of the indicators, except LST, were preprocessed and downloaded from the Google Earth Engine, which were unified and converted to be the monthly raster data. The quality assurance files were used in the band combination and selection for the monthly dataset preparation. Using ArcGIS, we overlaid the layers of LUCC and the five land-climate indicators to resample them to unify spatial resolution as the same of the LUCC map (300 m) and then extracted the pixel values in the monthly raster datasets. The annual averages of NDVI, albedo, LST, CWC, and annual sum of P were calculated using different land use and cover types for demonstration and further analysis.

2.3. Statistical Analysis

With the above LUCC dataset, the area proportions of six land use and cover types (i.e., agricultural land, bare land, forest, grassland and shrub, urban, water, and wetland) were calculated to exhibit the dynamics of land surface from 2000 to 2015. With the annual average of the land-climate indicators, we applied linear regressions to examine the temporal trend of each indicator by different land cover types. The coefficient of variation (CV) was calculated to measure the variability of the indicators. We performed structural equation modeling (SEM) to testify and quantify the relationship between urbanization and indicators of LUCC, and land-climate (Table 1). Based on the eco-climatology principle, we categorized the indicators into three-layer subsystems, i.e., LUCC, land surface indicators (NDVI, albedo, and LST), and reginal climate indicators (P and CWC). Our hypothesized relationships between these layers were explained below.
In the first layer (i.e., LUCC), we assumed the dynamics of land covers were basically driven by urbanization. Following the process of urbanization, the urban construction takes space from other types of land covers, including cropland, water/wetland, and natural vegetation [30,31]. In the meanwhile, the increasing demand for food productivity and other ecosystem services changes the land resource management, e.g., cropland intensification and afforestation [3]. In light of the Environmental Kuznets Curve, urbanization decreased the forest area at the early stage of urbanization. At a certain stage, urban expansion starts to be accompanied by increased forest area, thanks to the efforts for a long-term regional sustainability and environmental quality improvement [32,33,34,35,36] (Figure 2). In the Haihe River Basin, the massive afforestation embodied such a positive effect of urbanization-driven LUCC on the local forest. The multiple major afforestation projects following the state policy have been implemented since the 1980s, including ‘Three-North Shelter Forest Program’ (1980), ‘Grain for Green Program’ (2000), ‘Sandstorm Source Control Project’ (2002), ‘Urban Greenery for Hosting Olympic Game’ (2003), ‘Afforestation in Plain’ (2012), ‘Natural Forest Conservation Program’ (2015), etc. [37,38]. Thus, in the LUCC layer, we assumed that urban land development positively affected forest area (pathway ①: +), but negatively affected agricultural land by pressing cropland space and cropland intensification (pathway ③: −) [31] (Figure 3). The bare land and water/wetland were not taken into the SEM model because of their very low proportion (under 1.5% in total).
We then considered how LUCC were linked with land surface indicators (e.g., NDVI, albedo, and LST), i.e., between the first and second layers. Because forests have higher NDVI compared to the other land covers (e.g., agricultural land, grassland/shrub) [39], we assumed that the forest area positively affected regional NDVI (pathway ④: +). Previous studies suggested that forest had the effects of stabilization and buffering on regional LST, which diminishes LST change [27,39,40]. Compared to forests, agricultural land, grassland, and shrub have a lower heat capacity due to their much lower biomass and water storage volume per unit area [40]. Because the total average area of agricultural land and grassland/shrub is approximately 8.1 times the average area of forest in our study area, the change in LST should be mainly driven by the area change of agricultural land, and grassland/shrub [4,39,41] (pathway ⑥ and ⑦: +/−). Besides, albedo indicates the land surface roughness and radiation reflectance, which can be jointly determined by many types of artificial and vegetational landscape [16,42,43]. Since we assumed urbanization as a major driving force on LUCC types in the intensively developed area, we made a direct link from urban area proportion to albedo (pathway ⑤: +/−).
Between the second and third layers, we constructed all potential links to quantify the interaction between land surface indicators (NDVI, albedo, and LST) and regional climate indicators (P and CWC). Among these links, we assumed that NDVI had the positive effects on P and CWC (pathway ⑨ and ⑩: +) because the evapotranspiration of vegetation promotes the regional hydrological cycle [27,44]. In contrast, we assumed that LST had the negative effects on P and CWC (pathway ⑬ and ⑭: −) by heating land surface and drying air water [15,39]. Moreover, because forest ecosystems play a vital role in the regional hydrological cycle [45,46], we added a direct link from forest area proportion to the regional P (pathway ⑧: +/−).
All statistical analyses were conducted with the software R. The hypothesized SEM model was visualized below (Figure 3) and was fitted using the package of ‘piecewiseSEM’ [47]. We calculated the net effects of urbanization by summing up direct and indirect pathways.

3. Results

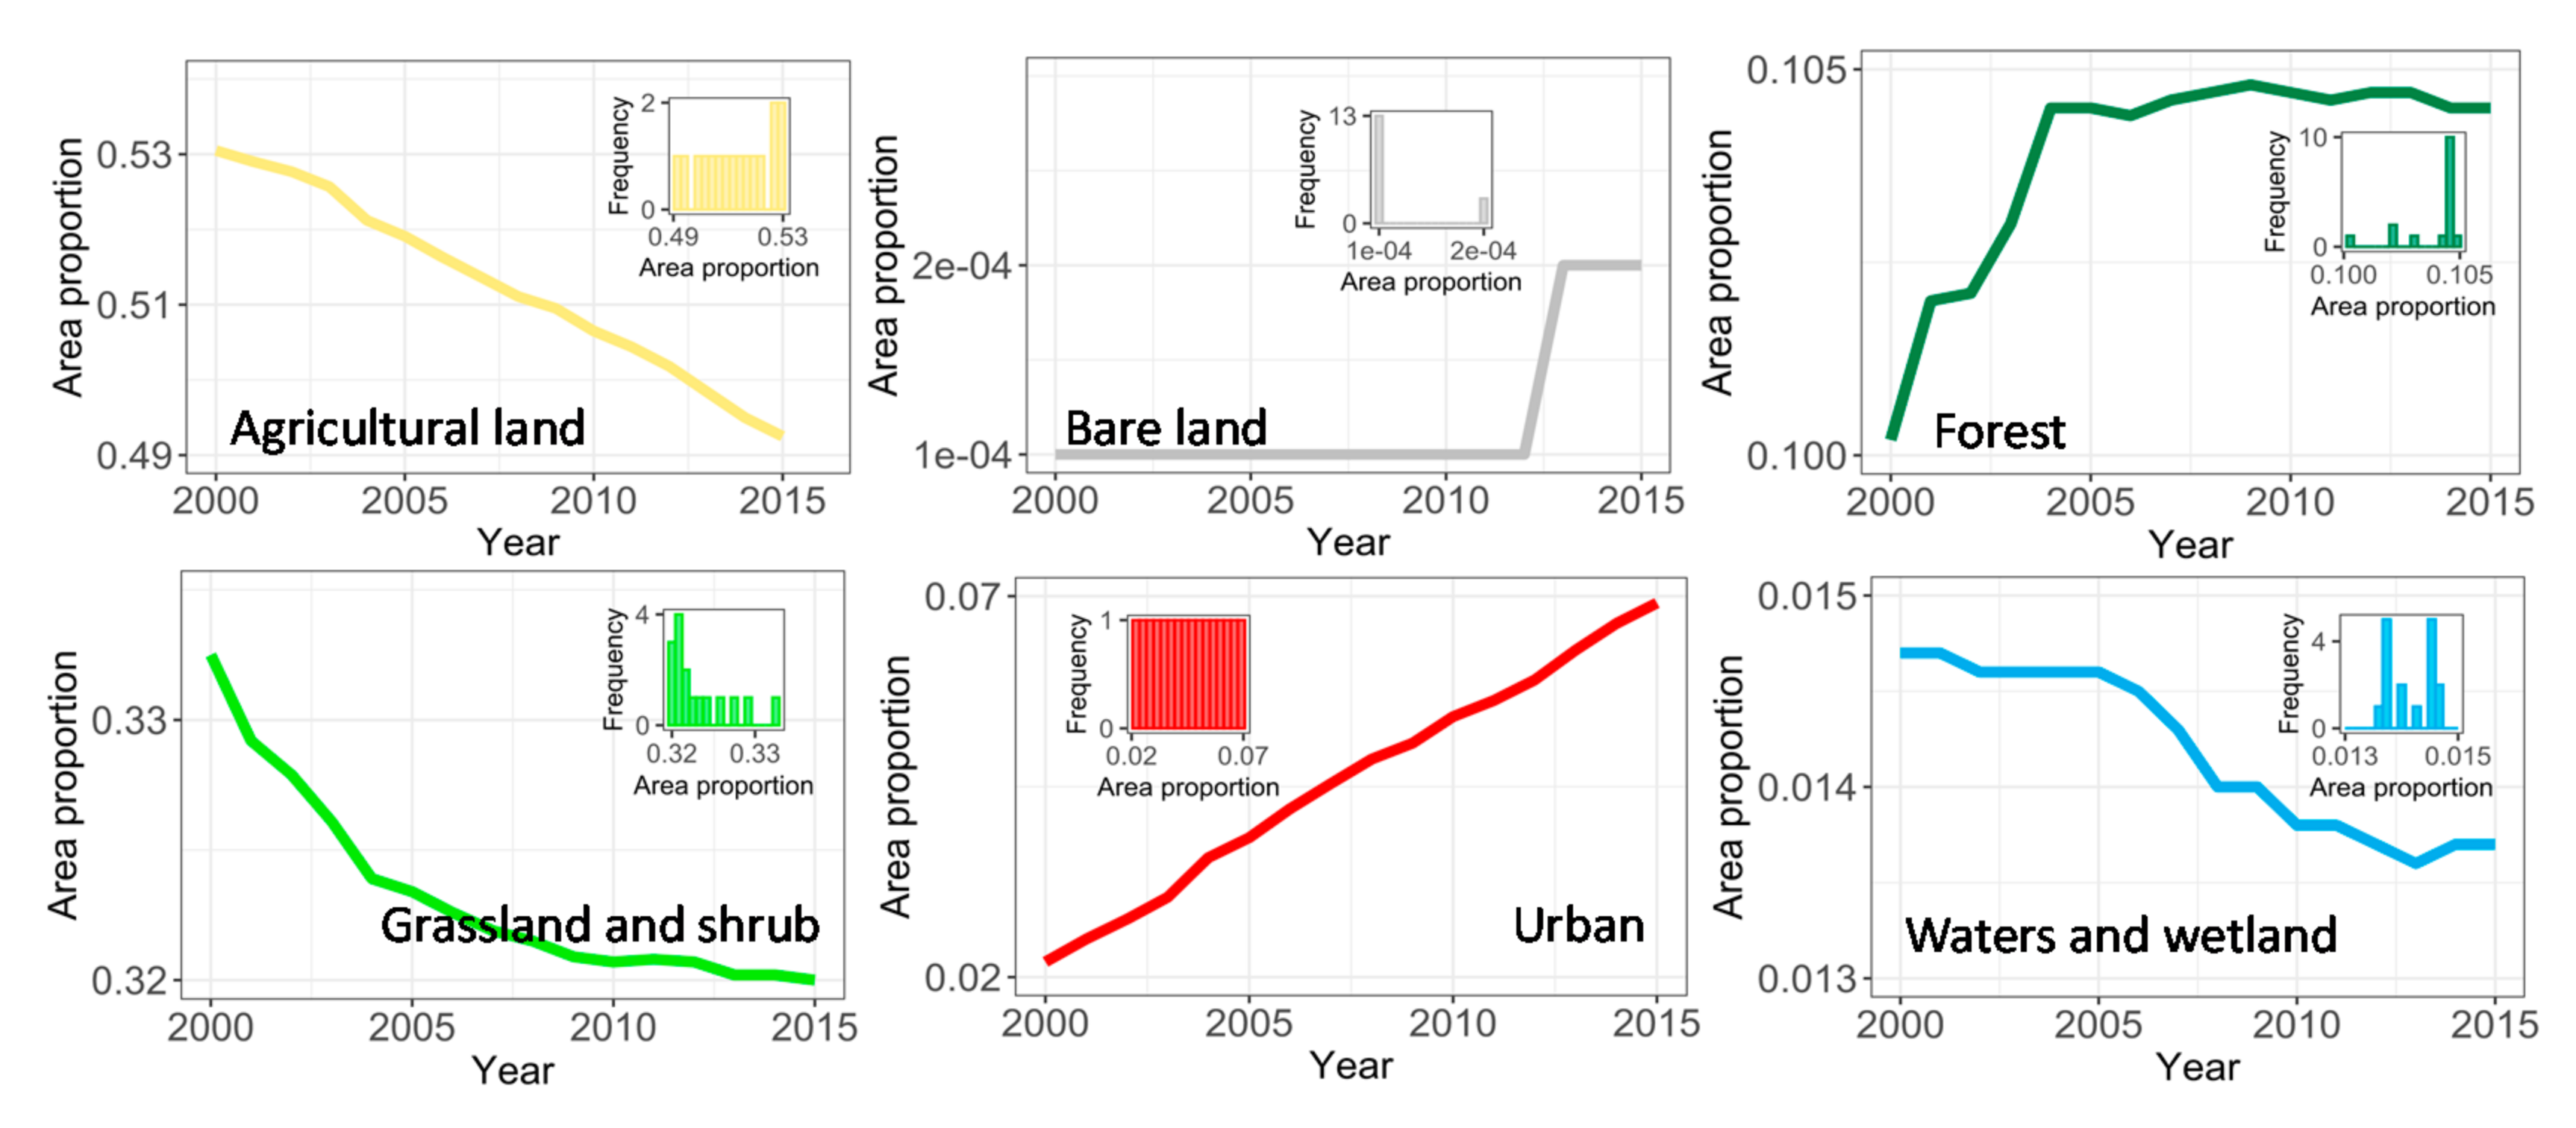
3.1. Land Use and Cover Change

From 2000 to 2015, the urban area increased from 2.2% to ~6.9%. Following the process of urbanization, different land cover types exhibited different temporal trends (Figure 4; Table S2). The agricultural land decreased from 53.1% to 49.3%. The forest area increased in the first years but reached a plateau of ~10.5% since 2004. Grassland/shrub gradually went down from 33.3% to ~32.0%. The waters and wetland area decreased gradually from 1.5% to 1.4%. The bare land remained steady at a level around 0.01%.

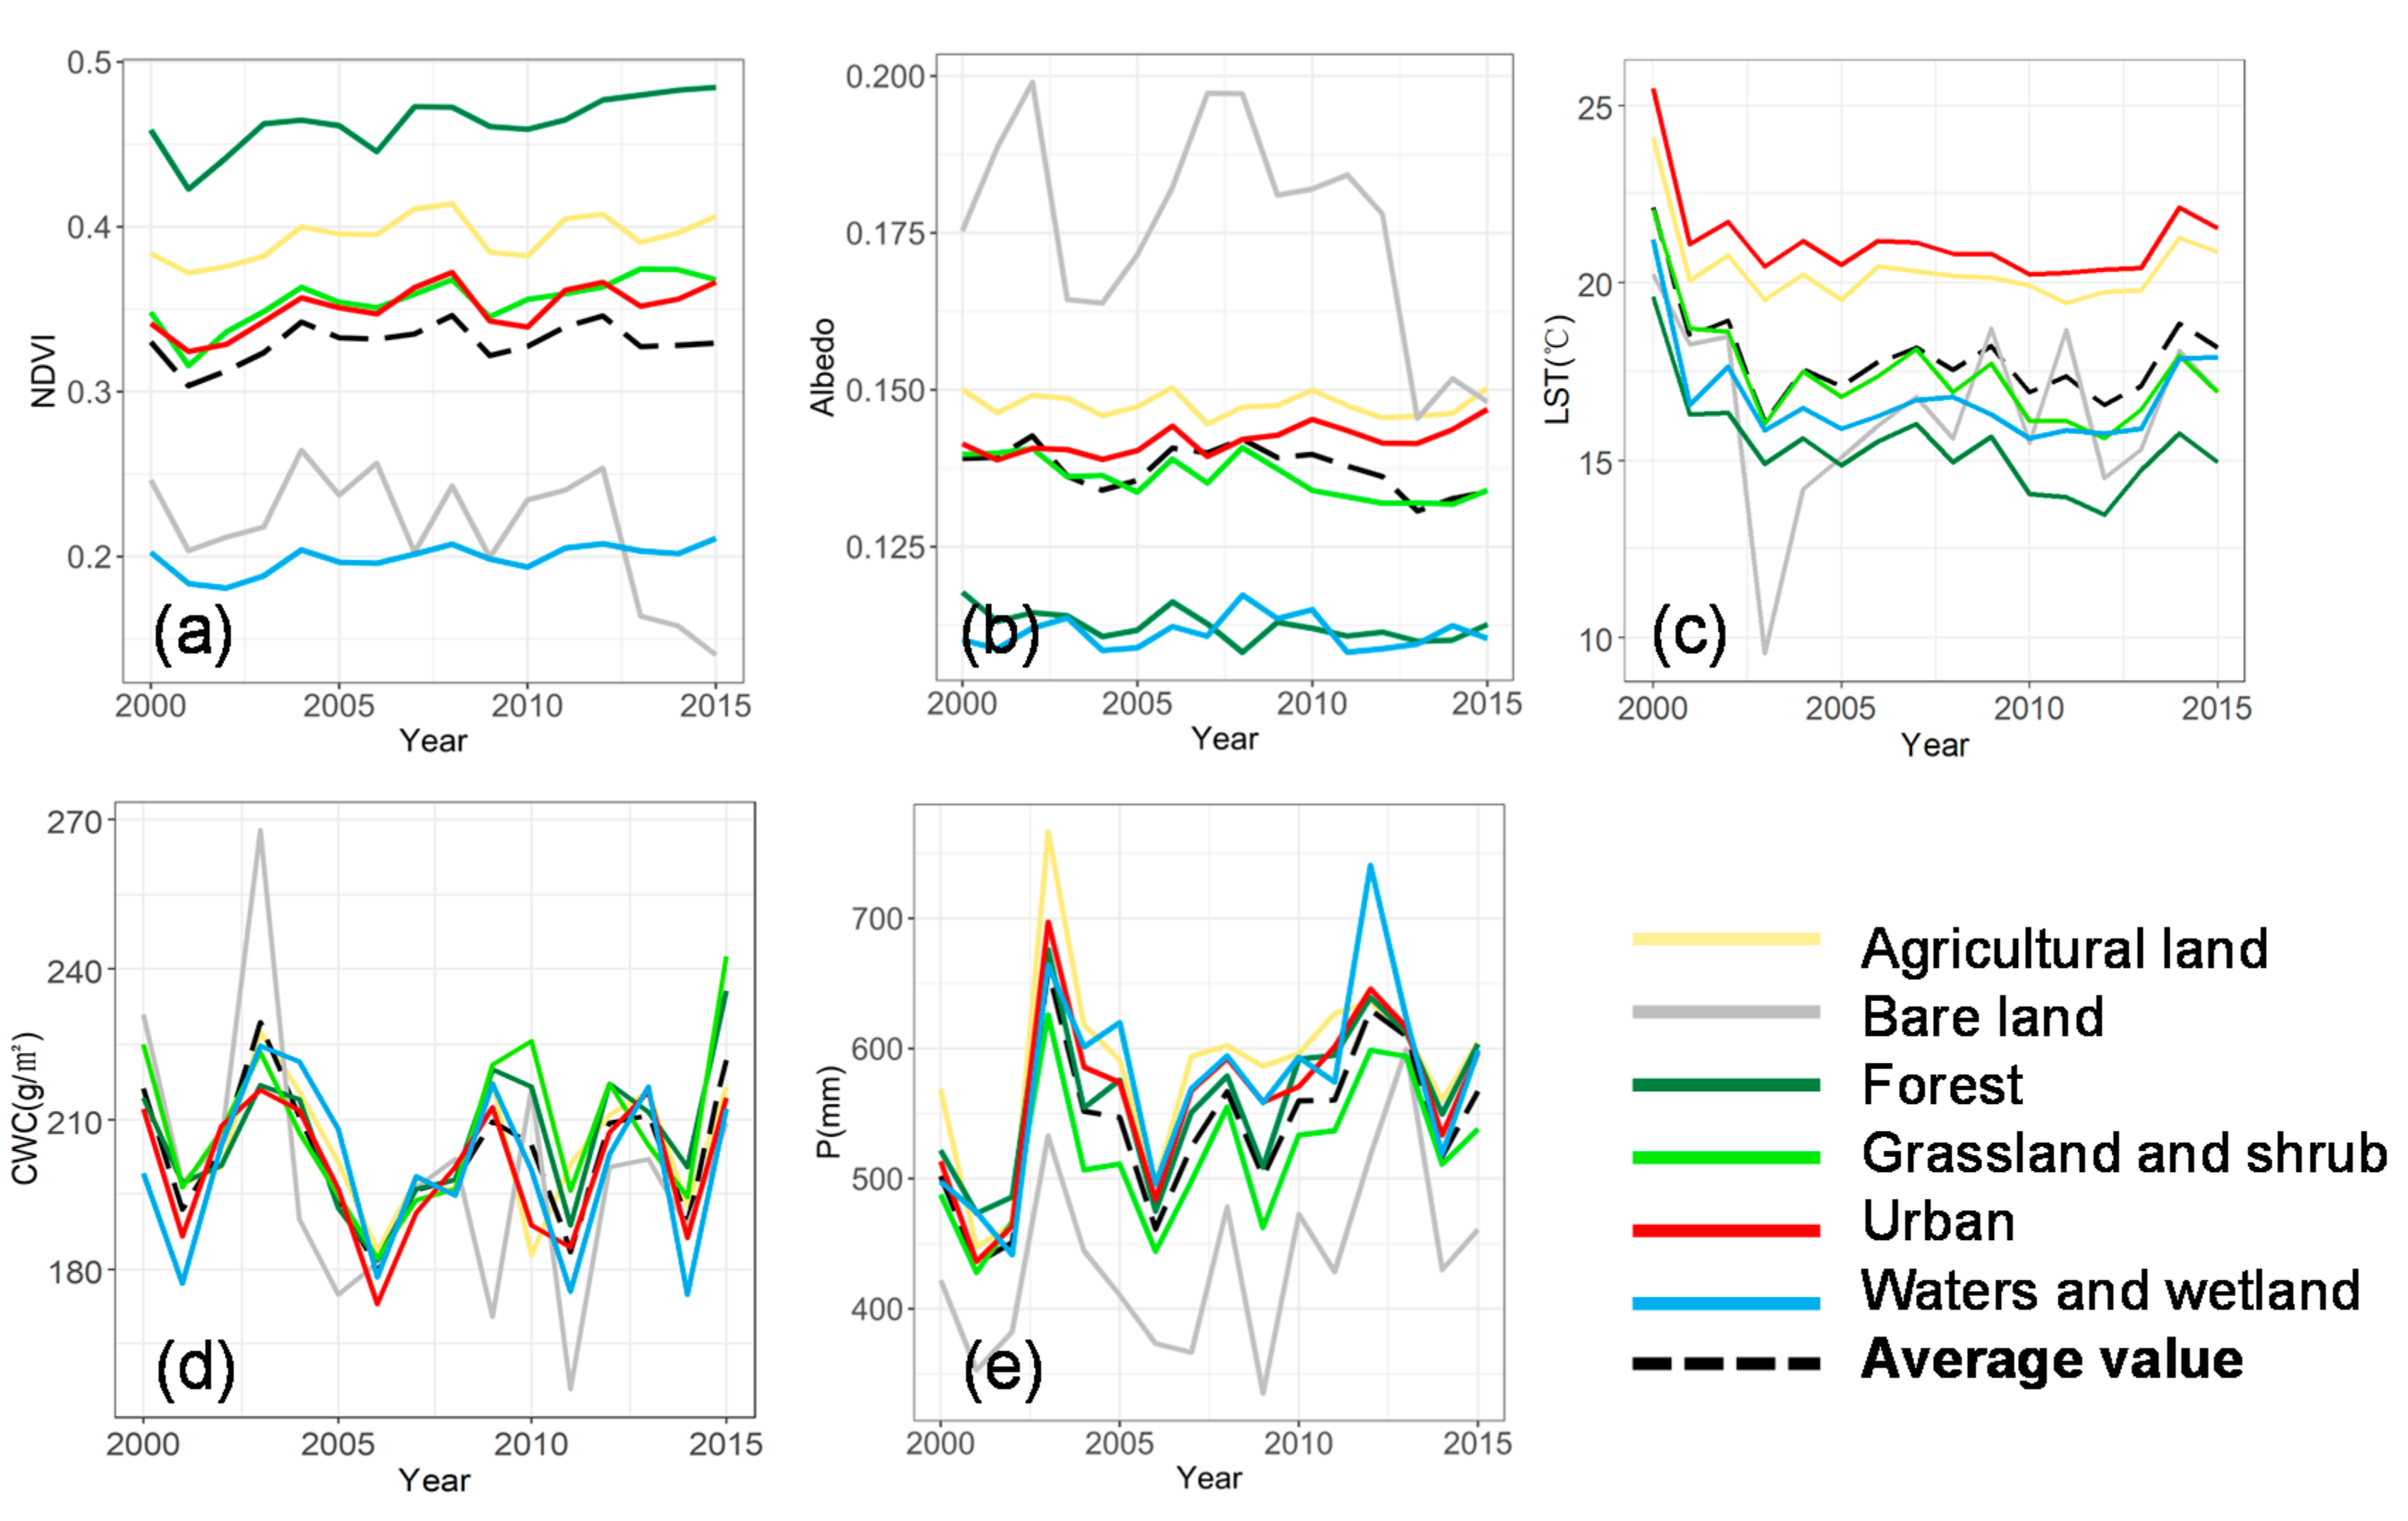
3.2. Temporal Trends of the Land Surface and the Regional Climate Indicators

The annual average NDVI of the basin increased from 0.34 in 2001 to 0.38 in 2004, and had since fluctuated around the latter level (Figure 5). The annual average albedo exhibited an overall decreasing trend from 2000 to 2015. The annual average LST decreased in the first four years (i.e., from 2000 to 2003) and then got steady around the level of 17.4 °C since 2004. The CWC and P showed similar temporal dynamics, both peaking in 2003 and reflecting the accordance in the atmospheric hydrological cycle indicators. The trends of these five indicators in each land use and cover type are summarized in Table 2. The results showed that the natural vegetation, including forest and grassland/shrub, experienced significant trends in NDVI (increasing), albedo (decreasing), and LST (decreasing). The urban area showed a significant increase in both NDVI and albedo.

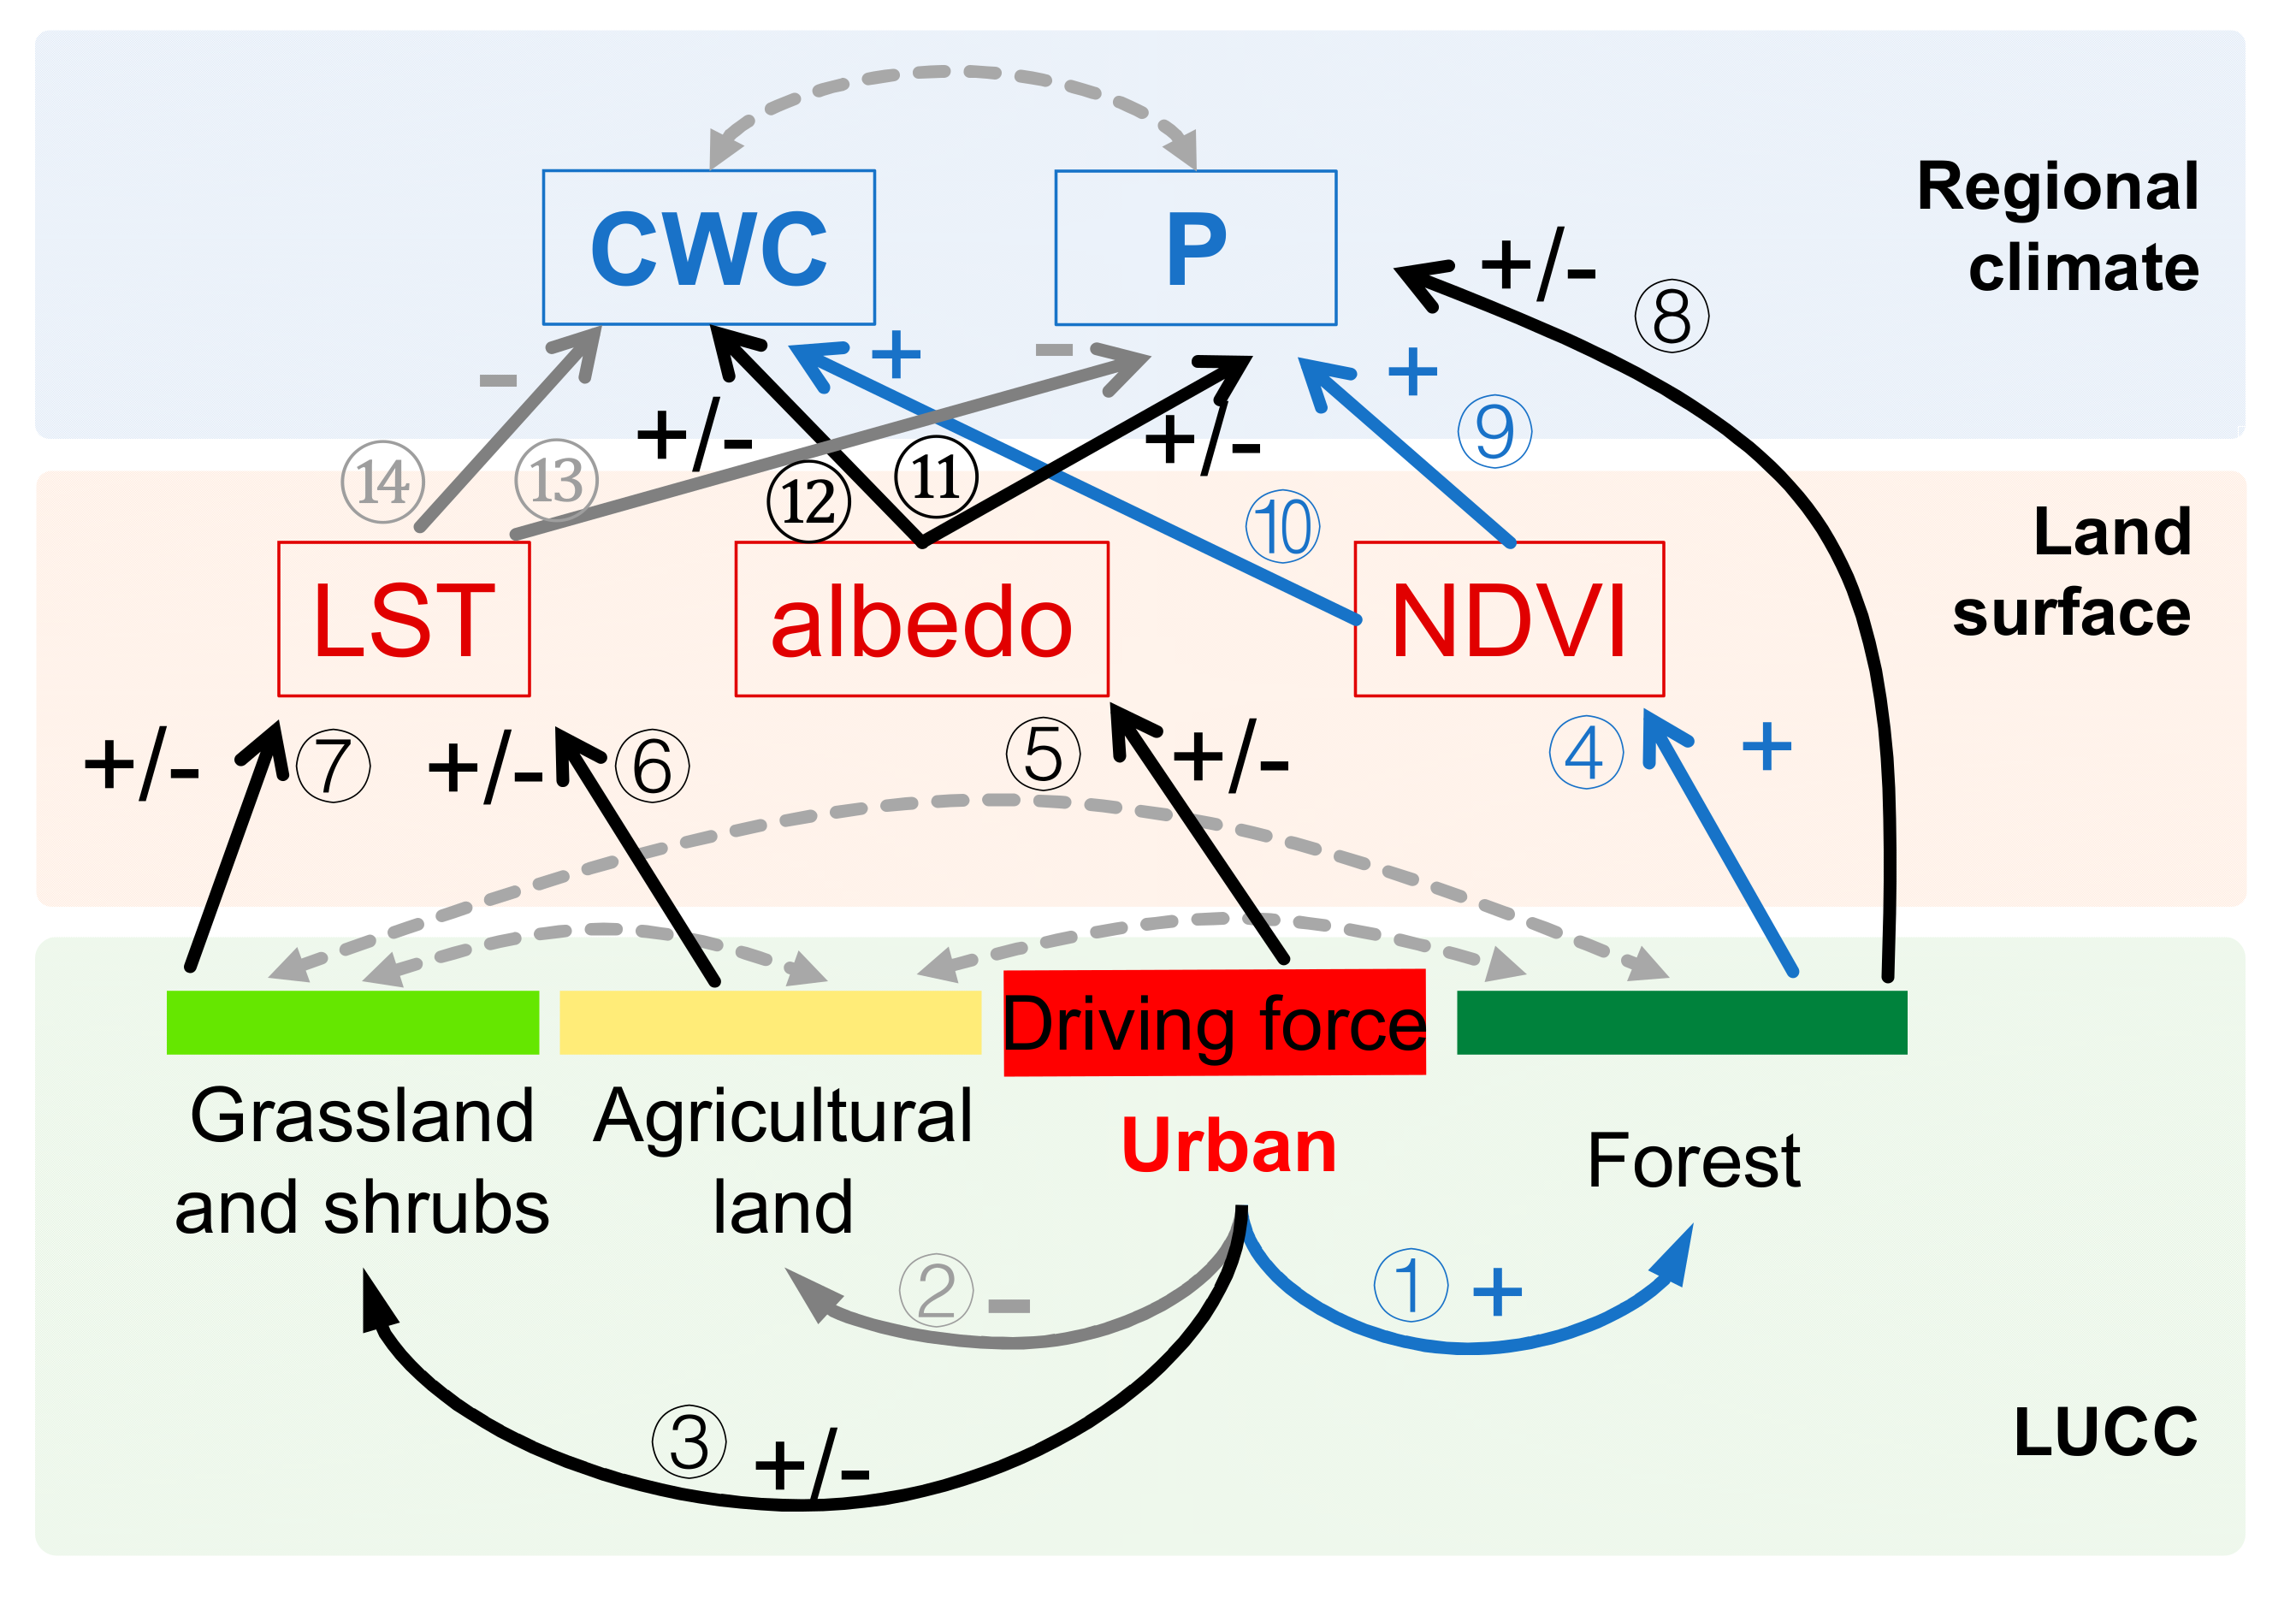
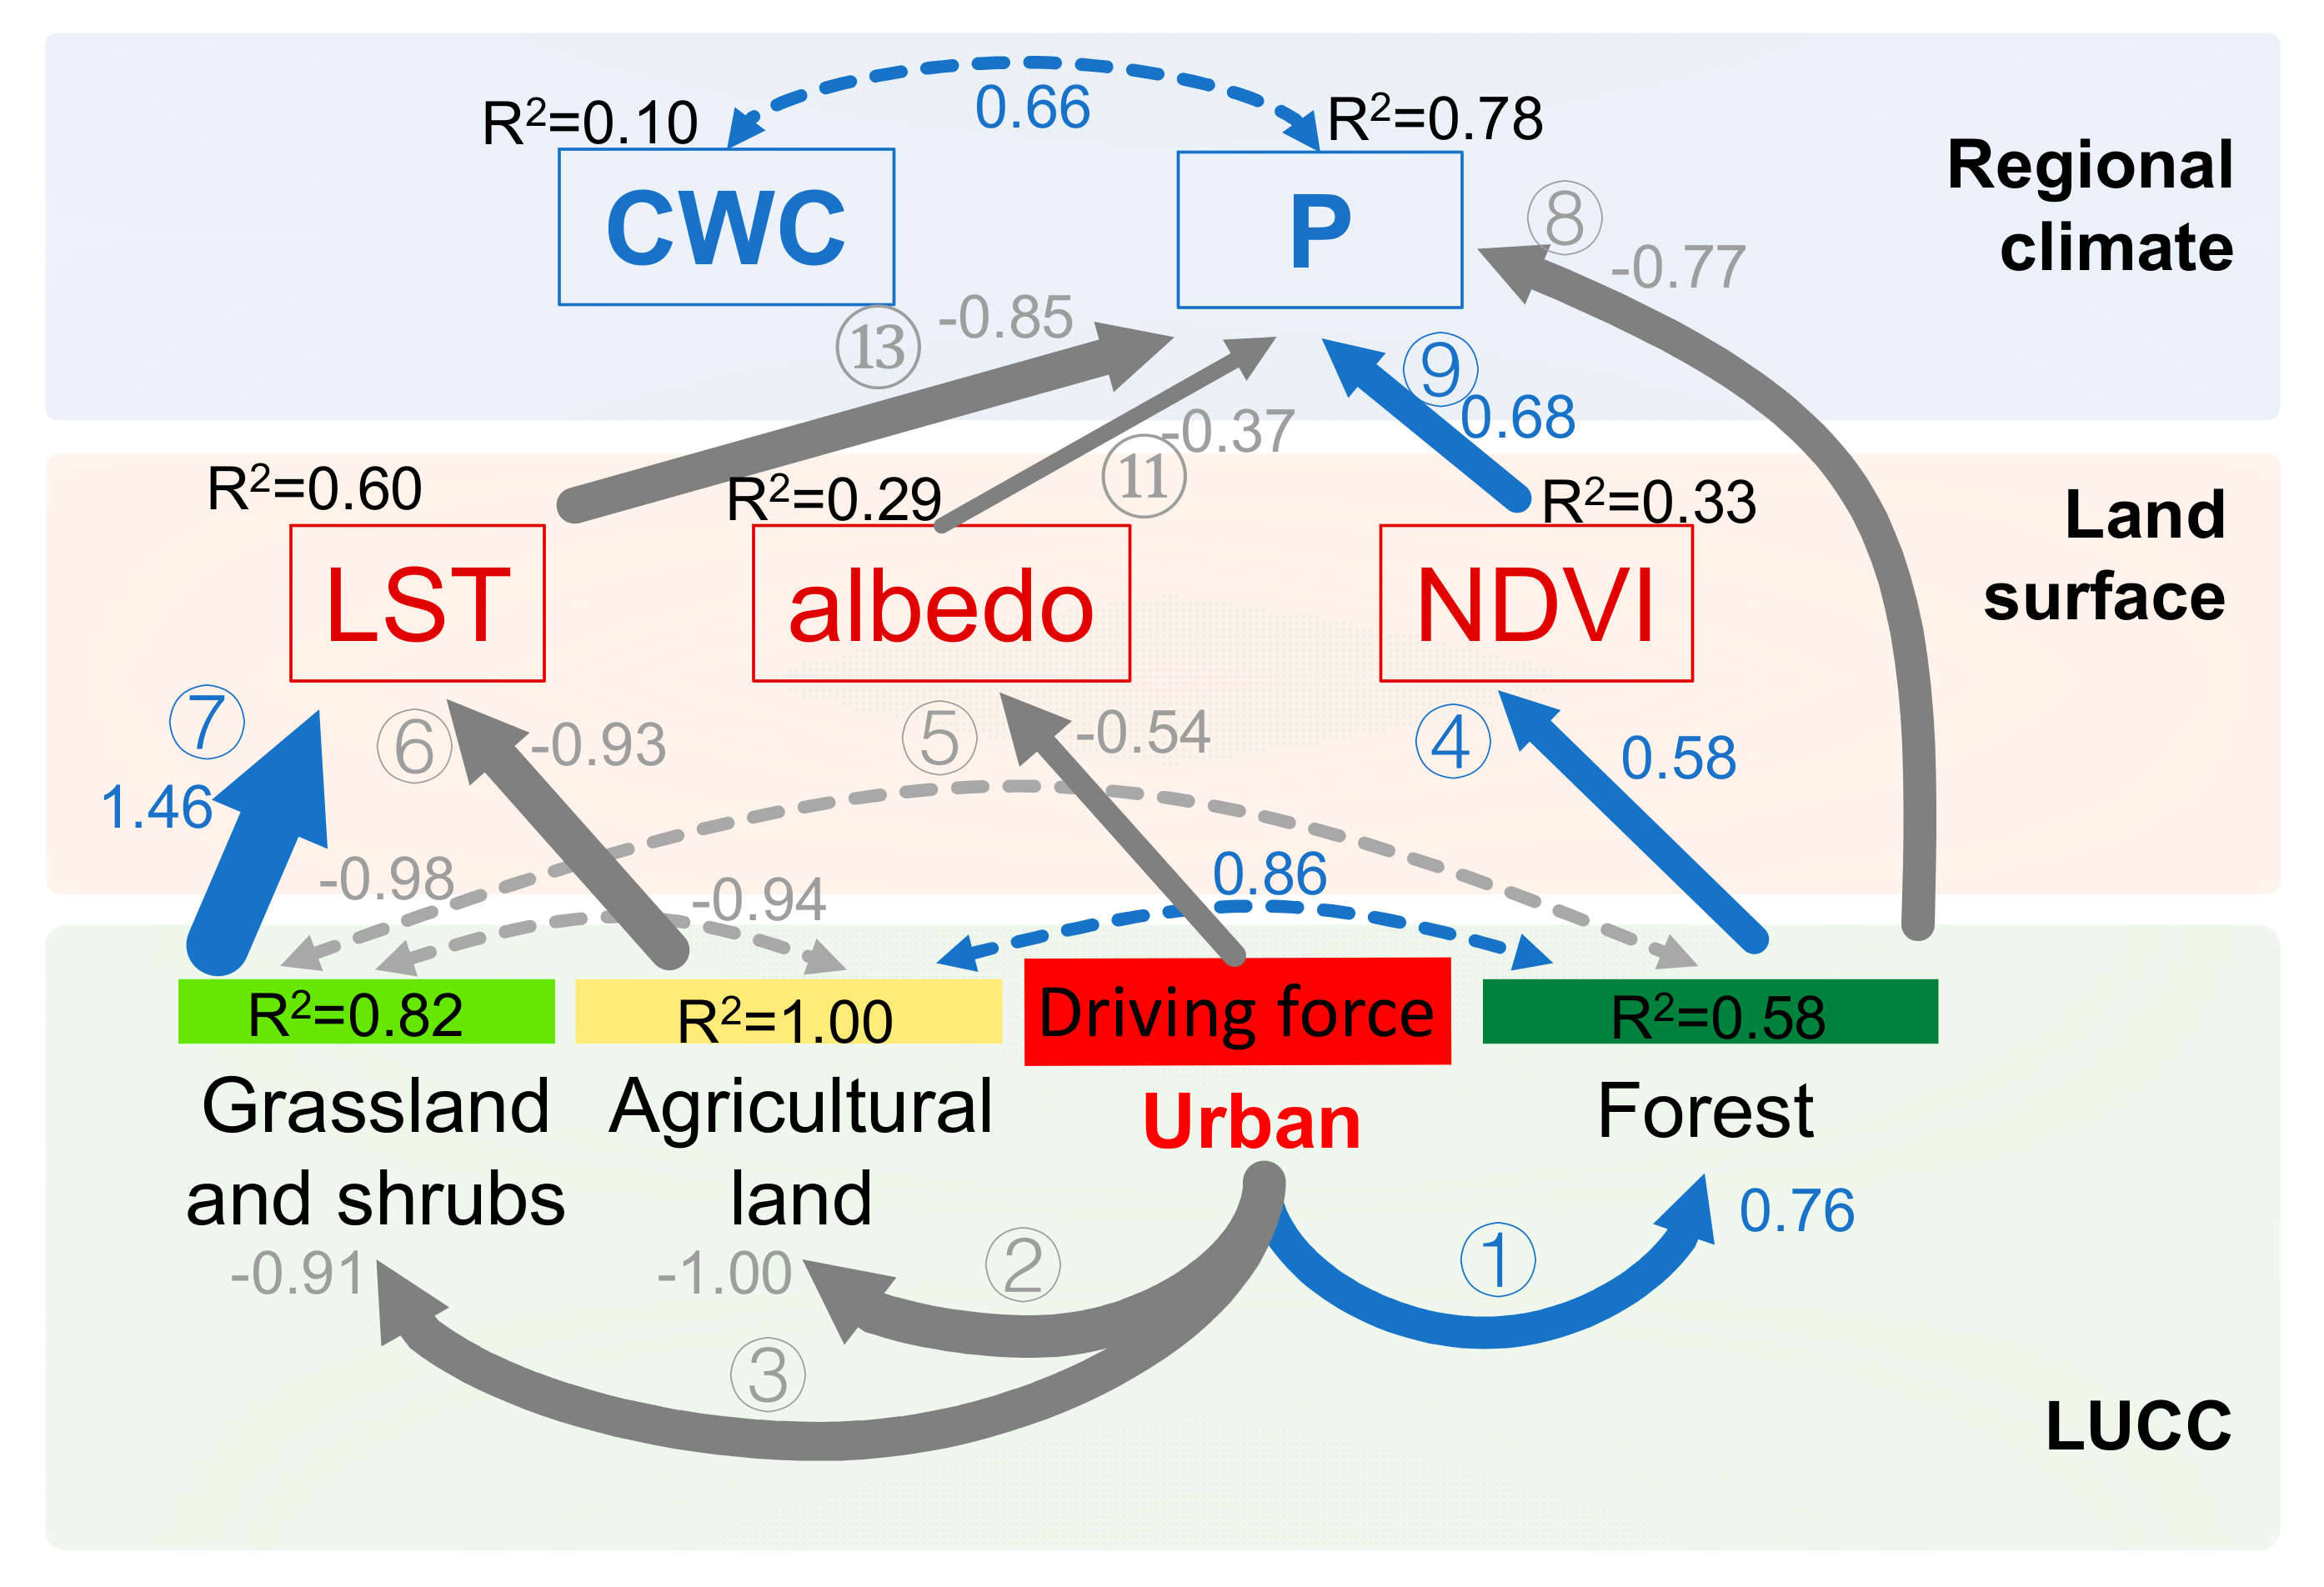
3.3. Urbanization Drives Land-Climate Dynamics

We performed SEM analysis to investigate how urbanization drives changes in land-climate dynamics (Figure 6). Over our study period, urbanization resulted in a reduced area of grassland/shrub and agricultural land, as the area proportion expanding of the urban area. In contrast, the forest area proportion increased with urbanization in the basin. These land cover changes further altered the land surface and hydrological cycle indicators. Specifically, the increment of forest area improved NDVI, which in turn promoted a higher P. The forest area proportion, however, had a negative direct effect on the regional P. Urbanization led to the decrement of albedo, which in turn had a negative effect on P. The decrease of the grassland/shrub area resulted in a reduced LST, but the decrease of agricultural land increased LST. The LST in turn had a negative effect on the regional P. After combining these pathways, the overall effect of urbanization on P was positive (Table 3). In addition, the SEM results indicated that there was no significant direct relationship with CWC between NDVI, albedo, and LST, even though CWC and P had a significant correlation with each other.

4. Discussion

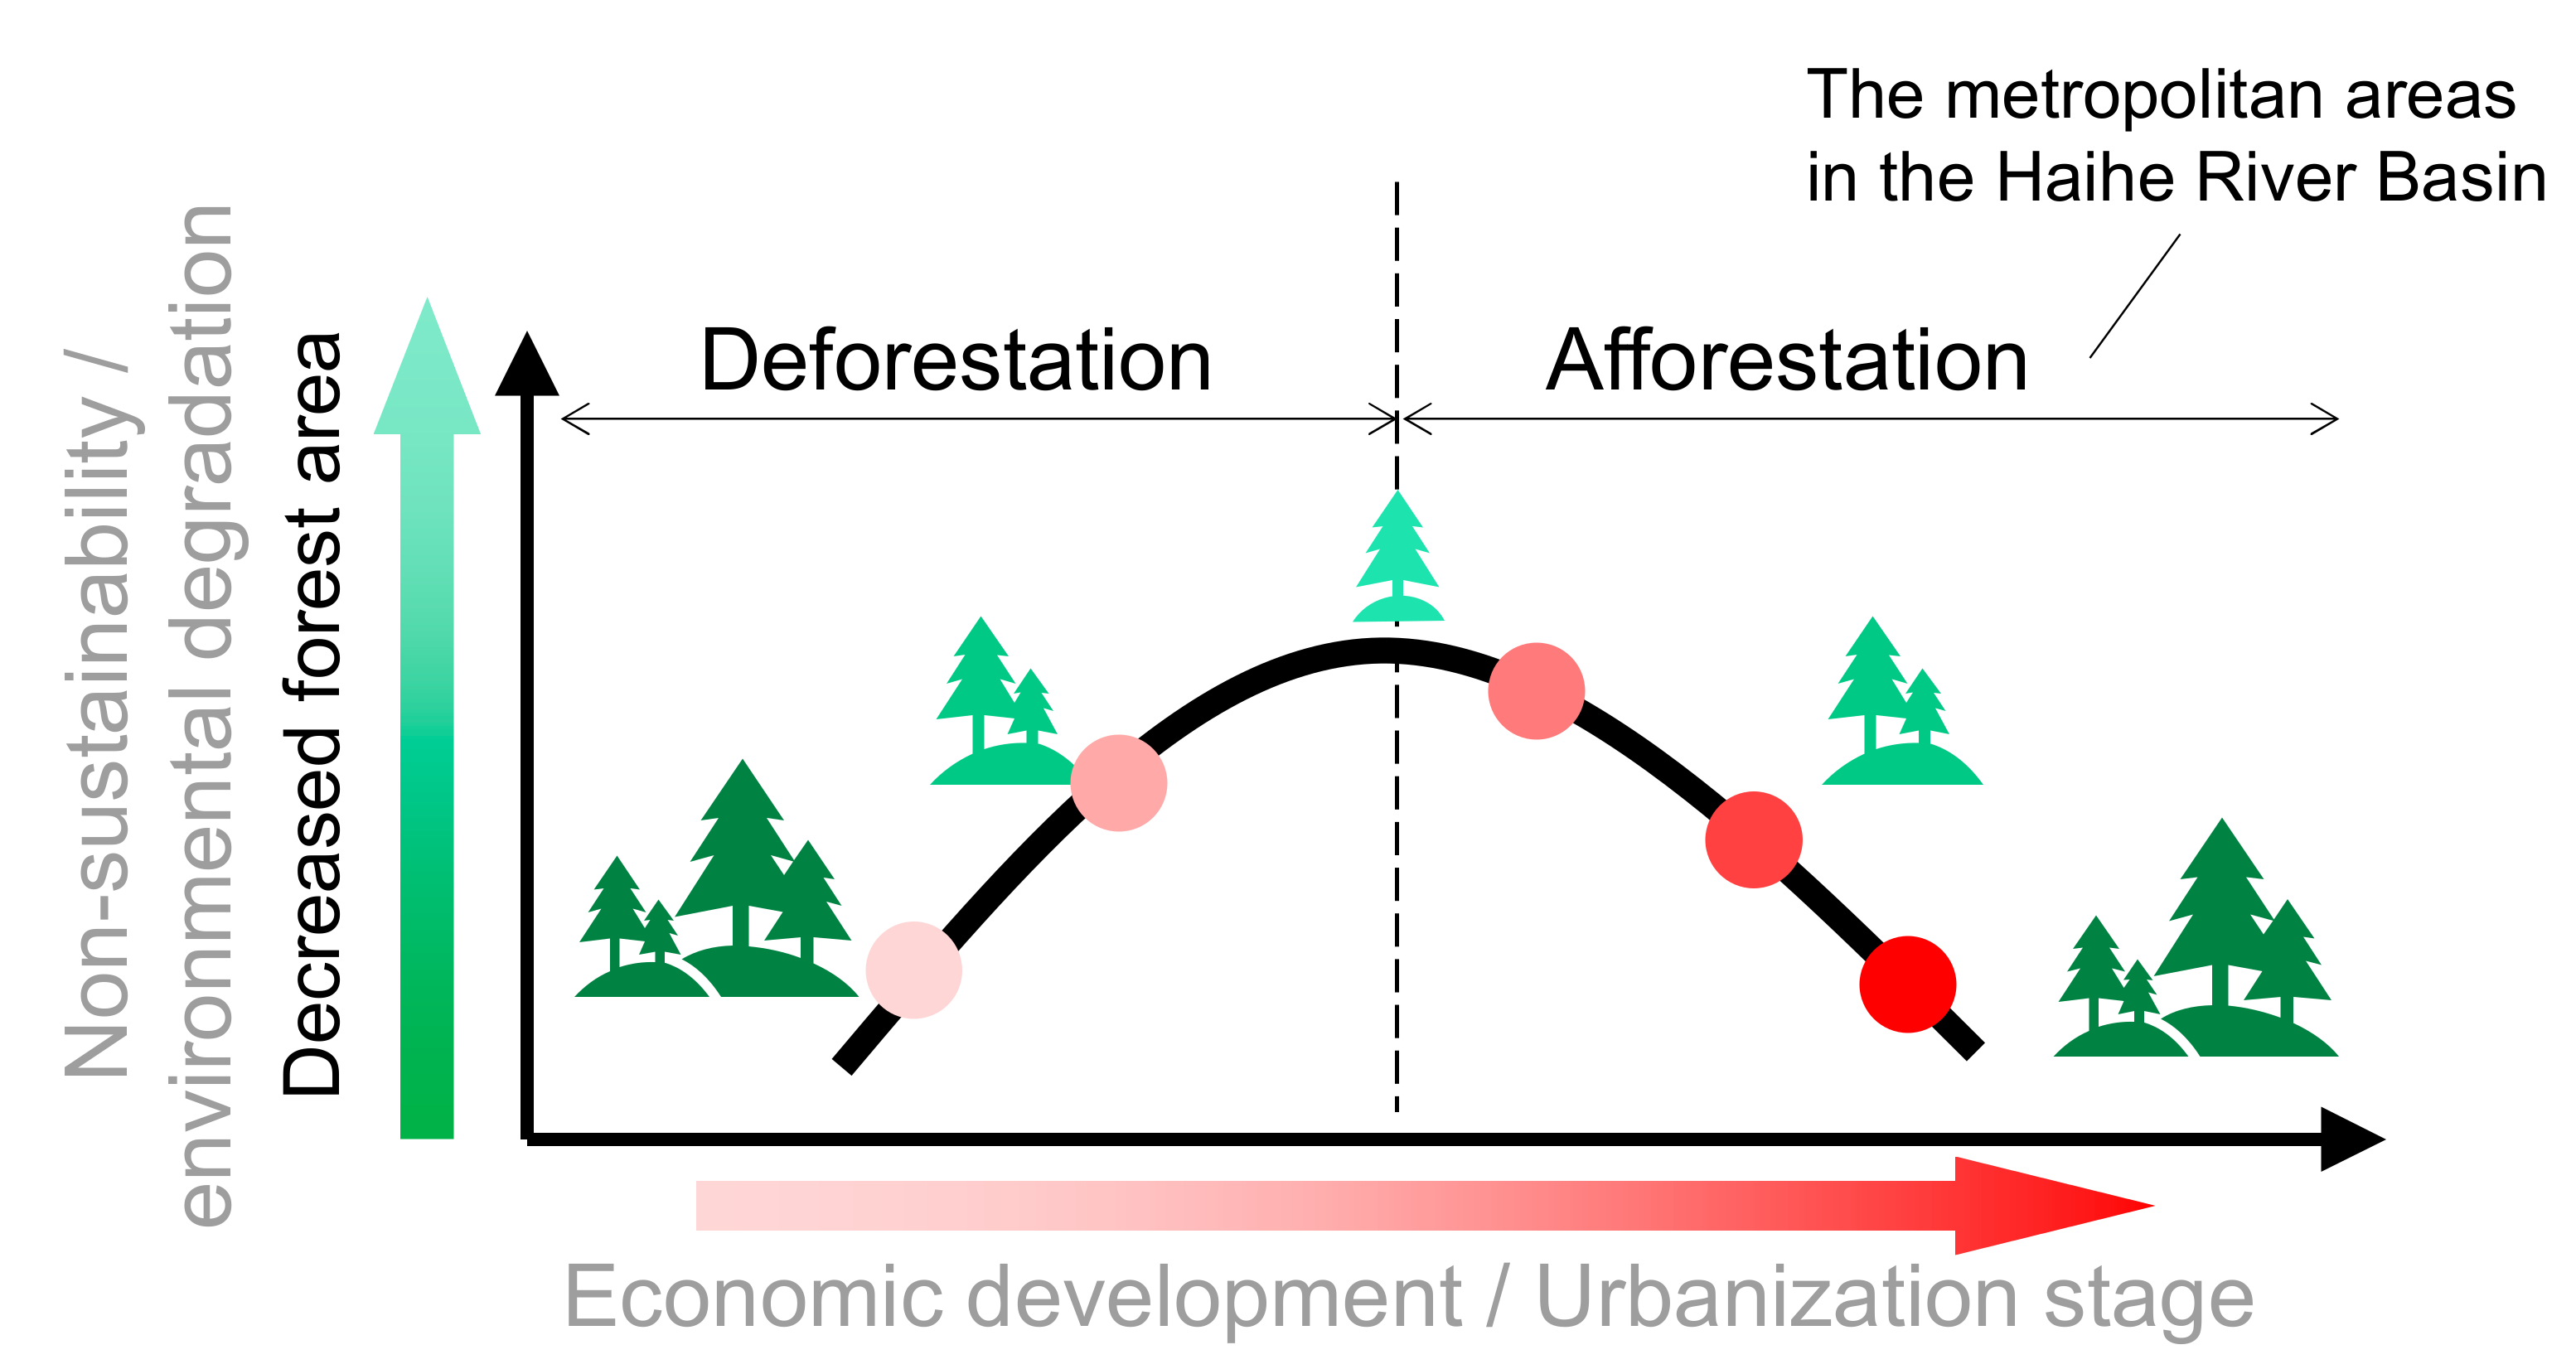
4.1. Urbanization Drives the Land Use and Cover Change in the Haihe River Basin

Our results showed that urbanization decreased the area of cropland and grassland/shrub (pathways ② and ③ in the SEM), but increased the forest area (pathway ①). To understand the latter, we need to take into account the local economic development as an intermediate variable. Whereas urbanization generally promotes the economic development, the forest area may first decrease but then increase through the process of economic development in light of the Environmental Kuznets Curve (Figure 2). To further verify our hypothesis, we collected information from the China National Socioeconomic Big Data Platform and used the annual census data in 26 cities in the Haihe River Basin to test the relationship between urbanization (i.e., urban population ratio), economic development (gross domestic product (GDP) per capita per area), and afforestation area [48,49]. Our results showed that the GDP per capita per area increased with the urban population ratio and the afforestation area ratio exhibited a U-shaped curve as the GDP per capita per area increased (Figure S1). These preliminary analyses are consistent with our hypothesis, although future research is needed for a more rigorous test with improved data.
Across our study region, the grassland/shrub are mainly located in two places, i.e., the northwestern plain of the basin adjacent to the Inner Mongolia and the medium- and high-altitude mountain area in the western and northern part of the basin (Figure 1). As previous studies show, grassland in the plain area had partially been transferred for urban infrastructure and architecture under the pressure of regional population growth [50] (pathway ③). For the other part of grassland/shrub in the high-altitude mountainous areas, a small proportion was transformed to forest following natural succession [19] thanks to the more favorable regional climate, e.g., increasing air temperature and atmospheric CO2 concentration [51].

4.2. The LUCC Alters the Rigional Climate

Our SEM revealed both direct and indirect effects of urbanization-induced LUCC on land-climate dynamics. First, the regional NDVI increased due to an increased forest area. Whereas forest growth and its area expansion both promote land surface greenness and thereby increase regional NDVI (pathway ④), they may have contrasting effects on the net effect of forests on the regional hydrological cycle [46,52]. The NDVI reflects vegetation quality so a higher NDVI means better vegetation growth, which has a more intensive transpiration process and biomass volume (more heights and canopy). In the vertical direction, the land surface vegetation with more intensive transpiration generates more atmospheric water and absorbs near-ground heat, facilitating condensation and formation of clouds in a wetter and cooler atmosphere. In the meanwhile, tree heights and forest canopy can reshape regional land surface roughness to increase atmospheric dynamic turbulence and transport water vapor to higher positions, making more atmospheric water saturation in the cloud layer [45,53,54]. Both of these ways promote forests for the regional vertical precipitation (pathway ④ to ⑨). In the horizontal direction, vegetation has the detention effects of near-ground water vapor via their leaves and branches, which prevents gaseous water in the air from rising up and detaching from vertical rainfall [55] (pathway ⑧). The eco-hydrological effects of forests have been broadly controversial due to the complexity in terms of multi-dimensionality and multi-scale [56]. Our study provided binary angles with the empirical evidence to rethink this issue, i.e., the quality growth and the area expansion under the regional progress of afforestation.
Because grassland/shrub have far fewer biomass per unit areas than agricultural land, grassland/shrub have weaker water storage ability, transpiration, and lower heat capacity than cropland. The area increasing grassland/shrub means the area developing into more open space and receiving more direct solar radiation with less absorption of the energy input, leading to more surface heating processes and higher LST [15,39]. This situation is contrary to the land surface with crops, as there are more cooling effects on agricultural land. In addition, we inferred the regular irrigation contributed to cooling down the LST for cropland. Such opposite relationships between the land area and the LST for grassland and cropland in the basin (pathway ⑥ and ⑦ of SEM) reflected these differences in the biophysical process.
Overall, there was a positive effect of the urban area expansion on the regional P in the basin. Apart from the vegetational land covers effects as discussed above, it could be explained by the following three possible causes from the angle of urban environmental changes itself. First, the enlarged scale of the city landscape building, including the concrete infrastructure, the intensively-developed residential communities, and the air-condition-equipped commercial skyscrapers, exacerbate the urban heat island effect in a mega-city area. The previous study pointed out that the urban heat island effect encourages near-ground convection and brings more frequent precipitation to the region [14,57]. Second, the vertically growing dimension of cities increases aerodynamic resistance and reshapes the wind profile by decreasing albedo with more land surface obstacles that enhance dynamic turbulence, which can uplift water vapor and promote regional precipitation (pathway ⑤ and ⑪). Third, due to local energy consumption structure and population and transportation development, urbanization in the Haihe River Basin inevitably brought massive air pollution. This pollution was especially bad in the 1990s and even heavier from 2000–2015 [18,58]. We inferred that an abundance of pollution particles acted as condensation nuclei and contributed to cloud formation and precipitation increase. In the specified investigations on the East Asian tropospheric aerosols and their impact on regional clouds and precipitation, based on more rigorous and detailed analysis, we concluded that aerosols suppress light rain while enhancing heavy rain. Thus, rainfall becomes more inhomogeneous and more extreme in heavily air polluted urban regions [59]. All aforementioned processes explained were summarized in the following conceptual diagram (Figure 7).
In the results of the land surface and climate indicators by different land use and cover types, we noted that variations of indicators on the bare land was significantly higher than on every other land cover (through paired T-test, p < 0.05), which is visually reflected in Figure 5. The bare land with very low vegetation coverage had a lower heat capacity and water retention ability, and so land surface energy and water environment on bare land is easier to alter through solar radiation and reflection [27,39]. That is why it has higher variability in the land surface and climate indicators than other land covers. Among different land surface and climate indicators, the variation of albedo was significantly lower than every other indicator, and the variation of P was significantly higher than every other indicator (through paired T-test, p < 0.05). This can be explained by how albedo reflects land surface microtopography and texture in building and vegetation landscapes in the local geographic system with relatively lower temporal variability. However, for P, it is in the open environment atmospheric hydrological cycle and largely influenced by the global climate system. Thus, it naturally has higher temporal variability [15].

4.3. The Recommendations on the Land Planning and Management

Based on the results and discussion in our study, we provide several recommendations for regional environmental sustainability from the macroscopic perspective of land planning and management.
First, agricultural land shrinkage (pathway ②) or the so-called ‘cropland loss’ has been previously attributed to societal modernization under rapid urbanization [31,60]. However, considering that cropland has a cooling effect and contributes to regional precipitation (pathway ⑥ to ⑬), maintaining such ecosystem functions to regulate the regional climate, a certain area of cropland in the rural area and city outskirt should be conserved and planned to keep the balance with urban land development. Since 2014, in regional environmental management practices, the Chinese central government introduced the permanent basic farmland conservation policy to protect both food and ecosystem security under constant pressure of urban expansion [61]. In the Haihe River Basin, the Beijing and Hebei provinces delineated redlines of local permanent basic farmland in 2016 and 2017, respectively.
Second, we suggest paying more attention and investment to the quality of afforestation rather than mere area expansion. On the one hand, as urbanization and economic development promote sustainable forestry and afforestation in the surrounding area, it is good to embrace such benefits from urbanization, especially considering its positive effect on precipitation via improving land surface greenness, or the increasing NDVI. On the other hand, rapidly expanding the forest area with limited forest tending and growth quality management, or inadequate planting design for optimizing the eco-hydrological function, would probably cause negative effects on the regional hydrological cycle, like distracting the water from the cloud formation and precipitation.
Third, the current remote sensing approach applied in this study had the uncertainty and limitation in terms of seasonality in the land-climate dynamic, because the biophysical process depends on the phenological change of surface vegetation [62]. In addition, since land-climate dynamics involve socioeconomic causes, atmospheric physical and chemical processes cannot be fully reflected through remote sensing data only. To explore the relationship and process in the land-climate relationship requires further integrated analysis and simulations within the multi-source data in temporal and spatial dimensions.
Fourth, the Haihe River Basin is located in the Northern Plain of China, where regional climate is relatively drought-prone, so promoting urbanization on the regional hydrological cycle is beneficial for the water supplies in the local ecosystem (i.e., cropland, forest) and for moisturizing the atmospheric and soil environment. Simultaneously, as cited above, haze pollution introduced by rapid urbanization can cause more frequent extreme rainfall [18,59], leading to secondary disasters like flooding, mudslide, and soil erosion. We should keep vigilant on this double-edged sword of precipitation increasing and be aware of the tipping point of the land-climate system change. To enhance the regional climate risk analysis, land development planning and strategic environmental assessment is highly recommended as responses to extreme precipitation and urban flooding. These are widely shared trends in modern city planning and regional environmental governance [63,64]. Such analysis and assessment on climate change potential requires the adequate length of precipitation monitoring data, considering its periodicity at different scales. How to effectively merge ground records and the limited-period remote sensing products to develop more reliable and fine assimilation, as well as prediction models for regional precipitation to cover the continuity of temporal and spatial dimensions is urgent for meteorologists and data scientists [65].

5. Conclusions

Urbanization changes the land surface environment, which profoundly impacts the regional climate system. In this study, we took the Haihe River Basin in China as a case study area, a location that has experienced rapid urbanization in the past several decades. Additionally, we investigated LUCC effects on the land-climate dynamics driven by urban area expansion. From 2000 to 2015, we collected the land use and cover classification dataset, as well as aligned key macroscopic indicators of land surface and regional climate (i.e., NDVI, albedo, LST, CWC, and P) to analyze and quantify dynamics and effects among factors with different land covers. The results showed that, in the basin, regional urbanization decreased agricultural land through cropland intensification. Meanwhile, urbanization promoted the forest to increase as it brought local economic development to enhance ecological conservation, which can be explained by a relevant theory of environmental economics. An increase in forest area had both positive and negative effects on the regional hydrological cycle. The agricultural land and grassland/shrub had indirect effects on P via different biophysical functions of LST. The overall effects of urbanization on regional precipitation was positive. The possible contributions from urbanization were herein discussed (i.e., convection of the urban heat island effect, turbulence via surface roughness change, air pollution, and regional precipitation promoting). Based on the main results and interpretations, we provided suggestions for future research on monitoring and assessment, and also gave recommendations to advance sustainability in further land planning and management.

Supplementary Materials

The following are available online at https://www.mdpi.com/2072-4292/12/17/2701/s1, Table S1: The databases of the key land-climate indicators. Table S2: The area proportion dynamics of the land use and cover change from 2000 to 2015 in the Haihe River Basin and the trends regression. Figure S1: The bivariate regression between the urban population ratio and regional gross domestic product (GDP) per capita per area (a). The bivariate regression between regional GDP and regional afforestation area ratio in the 26 cities of the Haihe River Basin during the period 2000–2015.

Author Contributions

Conceptualization, Z.L.; data curation, Y.S., M.W., and B.Z.; formal analysis, Z.L., Y.X., Y.S., and M.W.; methodology, Z.L.; writing—original draft, Z.L.; writing—review and editing, Z.L. and Y.X. All authors have read and agreed to the published version of the manuscript.

Funding

This research was funded by the Youth Fund of Ministry of Education Laboratory for Earth Surface Processes, Peking University, grant number 7100602014.

Acknowledgments

We appreciate Shaopeng Wang from the Institute of Ecology, College of Urban and Environmental Sciences, Peking University, for his advising.

Conflicts of Interest

The authors declare no conflict of interest. The funders had no role in the design of the study; in the collection, analyses, or interpretation of data; in the writing of the manuscript; or in the decision to publish the results.

References

  1. Pontius, R.G.; Shusas, E.; McEachern, M. Detecting Important Categorical Land Changes While Accounting for Persistence. Agric. Ecosyst. Environ. 2004, 101, 251–268. [Google Scholar] [CrossRef]
  2. Bren d’Amour, C.; Reitsma, F.; Baiocchi, G.; Barthel, S.; Güneralp, B.; Erb, K.-H.; Haberl, H.; Creutzig, F.; Seto, K.C. Future Urban Land Expansion and Implications for Global Croplands. Proc. Natl. Acad. Sci. USA 2017, 114, 8939–8944. [Google Scholar] [CrossRef] [PubMed] [Green Version]
  3. Song, X.-P.; Hansen, M.C.; Stehman, S.V.; Potapov, P.V.; Tyukavina, A.; Vermote, E.F.; Townshend, J.R. Global Land Change from 1982 to 2016. Nature 2018, 560, 639–643. [Google Scholar] [CrossRef] [PubMed]
  4. Teuling, A.J.; Seneviratne, S.I.; Stockli, R.; Reichstein, M.; Moors, E.; Ciais, P.; Luyssaert, S.; Van Den Hurk, B.; Ammann, C.; Bernhofer, C.; et al. Contrasting Response of European Forest and Grassland Energy Exchange to Heatwaves. Nat. Geosci. 2010, 722–727. [Google Scholar] [CrossRef]
  5. Anderson, R.G.; Canadell, J.G.; Randerson, J.T.; Jackson, R.B.; Hungate, B.A.; Baldocchi, D.D.; Ban-Weiss, G.A.; Bonan, G.B.; Caldeira, K.; Cao, L. Biophysical Considerations in Forestry for Climate Protection. Front. Ecol. Environ. 2011, 9, 174–182. [Google Scholar] [CrossRef] [Green Version]
  6. Li, Y.; Liu, C.; Yu, W.; Tian, D.; Bai, P. Response of streamflow to environmental changes: A Budyko-type analysis based on 144 river basins over China. Sci. Total Environ. 2019, 664, 824–833. [Google Scholar] [CrossRef]
  7. Turner, P.A.; Field, C.B.; Lobell, D.B.; Sanchez, D.L.; Mach, K.J. Unprecedented Rates of Land-Use Transformation in Modelled Climate Change Mitigation Pathways. Nat. Sustain. 2018, 1, 240–245. [Google Scholar] [CrossRef]
  8. Tian, H.; Chen, G.; Liu, M.; Zhang, C.; Sun, G.; Lu, C.; Xu, X.; Ren, W.; Pan, S.; Chappelka, A. Model Estimates of Net Primary Productivity, Evapotranspiration, and Water Use Efficiency in the Terrestrial Ecosystems of the Southern United States during 1895–2007. For. Ecol. Manag. 2010, 259, 1311–1327. [Google Scholar] [CrossRef]
  9. Haddeland, I.; Clark, D.B.; Franssen, W.; Ludwig, F.; Voß, F.; Arnell, N.W.; Bertrand, N.; Best, M.; Folwell, S.; Gerten, D.; et al. Multimodel Estimate of the Global Terrestrial Water Balance: Setup and First Results. J. Hydrometeorol. 2011, 12, 869–884. [Google Scholar] [CrossRef] [Green Version]
  10. van Vliet, M.T.H.; Flörke, M.; Wada, Y. Quality Matters for Water Scarcity. Nat. Geosci. 2017, 10, 800. [Google Scholar] [CrossRef]
  11. Xiao, Z.; Liang, S.; Wang, J.; Chen, P.; Yin, X.; Zhang, L.; Song, J. Use of General Regression Neural Networks for Generating the GLASS Leaf Area Index Product from Time-Series MODIS Surface Reflectance. IEEE Trans. Geosci. Remote Sens. 2013, 52, 209–223. [Google Scholar] [CrossRef]
  12. UCL-Geomatics. Land Cover CCI Product User Guide (Version 2.0). 2017. Available online: https://www.esa-landcover-cci.org/?q=webfm_send/84 (accessed on 20 August 2020).
  13. Lee, X.; Goulden, M.L.; Hollinger, D.Y.; Barr, A.; Black, T.A.; Bohrer, G.; Bracho, R.; Drake, B.; Goldstein, A.; Gu, L.; et al. Observed Increase in Local Cooling Effect of Deforestation at Higher Latitudes. Nature 2011, 479, 384. [Google Scholar] [CrossRef] [PubMed]
  14. Zhao, L.; Lee, X.; Smith, R.B.; Oleson, K. Strong Contributions of Local Background Climate to Urban Heat Islands. Nature 2014, 511, 216. [Google Scholar] [CrossRef] [PubMed]
  15. Bonan, G. Ecological Climatology: Concepts and Applications, 3rd ed.; Cambridge University Press: Cambridge, UK, 2015. [Google Scholar] [CrossRef]
  16. Li, Z.; Liu, X.; Ma, T.; Kejia, D.; Zhou, Q.; Yao, B.; Niu, T. Retrieval of the Surface Evapotranspiration Patterns in the Alpine Grassland-Wetland Ecosystem Applying SEBAL Model in the Source Region of the Yellow River, China. Ecol. Model. 2013, 270. [Google Scholar] [CrossRef]
  17. Karimi, P.; Bastiaanssen, W.G.M. Spatial Evapotranspiration, Rainfall and Land Use Data in Water Accounting—Part 1: Review of the Accuracy of the Remote Sensing Data. Hydrol. Earth Syst. Sci. 2015, 19, 507–532. [Google Scholar] [CrossRef] [Green Version]
  18. Cao, C.; Lee, X.; Liu, S.; Schultz, N.; Xiao, W.; Zhang, M.; Zhao, L. Urban Heat Islands in China Enhanced by Haze Pollution. Nat. Commun. 2016, 7, 12509. [Google Scholar] [CrossRef]
  19. Yang, Y.; Zheng, H.; Xu, W.; Zhang, L.; Ouyang, Z. Temporal Changes in Multiple Ecosystem Services and Their Bundles Responding to Urbanization and Ecological Restoration in the Beijing–Tianjin–Hebei Metropolitan Area. Sustainability 2019. [Google Scholar] [CrossRef] [Green Version]
  20. Luo, K.; Tao, F.; Moiwo, J.P.; Xiao, D. Attribution of Hydrological Change in Heihe River Basin to Climate and Land Use Change in the Past Three Decades. Sci. Rep. 2016, 6, 33704. [Google Scholar] [CrossRef] [Green Version]
  21. Zhao, H.; Wang, Q.-R.; Fan, W.; Song, G.-H. The Relationship between Secondary Forest and Environmental Factors in the Southern Taihang Mountains. In Scientific Reports; Nature Publishing Group: London, UK, 2017; pp. 16410–16431. [Google Scholar] [CrossRef]
  22. Chu, X.; Zhan, J.; Li, Z.; Zhang, F.; Qi, W. Assessment on Forest Carbon Sequestration in the Three-North Shelterbelt Program Region, China. J. Clean. Prod. 2019, 382–389. [Google Scholar] [CrossRef]
  23. Wang, Z.; Luo, Y.; Liu, C.; Xia, J.; Zhang, M. Spatial and Temporal Variations of Precipitation in Haihe River Basin, China: Six Decades of Measurements. Hydrol. Process. 2011, 25, 2916–2923. [Google Scholar] [CrossRef]
  24. Liu, B.; Yan, Z.; Sha, J.; Li, S. Drought Evolution Due to Climate Change and Links to Precipitation Intensity in the Haihe River Basin. Water 2017. [Google Scholar] [CrossRef] [Green Version]
  25. Yang, S.; Chen, B.; Fath, B. Trans-Boundary Total Suspended Particulate Matter (TSPM) in Urban Ecosystems. Ecol. Model. 2015, 318, 59–63. [Google Scholar] [CrossRef]
  26. Cui, X.; Fang, C.; Liu, H.; Liu, X. Assessing Sustainability of Urbanization by a Coordinated Development Index for an Urbanization-Resources-Environment Complex System: A Case Study of Jing-Jin-Ji Region, China. Ecol. Indic. 2019, 96, 383–391. [Google Scholar] [CrossRef]
  27. Li, Z.; Wang, Z.; Liu, X.; Fath, B.; Liu, X.; Xu, Y.; Hutjes, R.; Kroeze, C. Causal Relationship in the Interaction between Land Cover Change and Underlying Surface Climate in the Grassland Ecosystems in China. Sci. Total Environ. 2019, 647, 1080–1087. [Google Scholar] [CrossRef] [PubMed] [Green Version]
  28. Rodell, M.; Houser, P.R.; Jambor, U.; Gottschalck, J.; Mitchell, K.; Meng, C.-J.; Arsenault, K.; Cosgrove, B.; Radakovich, J.; Bosilovich, M.; et al. The Global Land Data Assimilation System. Bull. Am. Meteorol. Soc. 2004, 85, 381–394. [Google Scholar] [CrossRef] [Green Version]
  29. Platnick, S.; King, M.; Hubanks, P. MODIS Atmosphere L3 Monthly Product; NASA MODIS Adaptive Processing System; Goddard Space Flight Center: Greenbelt, MD, USA, 2015. [Google Scholar] [CrossRef]
  30. Hu, Y.; Zhen, L.; Zhuang, D. Assessment of Land-Use and Land-Cover Change in Guangxi, China. Sci. Rep. 2019, 9, 2189. [Google Scholar] [CrossRef] [PubMed] [Green Version]
  31. Qiu, B.; Li, H.; Tang, Z.; Chen, C.; Berry, J. How Cropland Losses Shaped by Unbalanced Urbanization Process? Land Use Policy 2020, 96, 104715. [Google Scholar] [CrossRef]
  32. Hao, Y.; Xu, Y.; Zhang, J.; Hu, X.; Huang, J.; Chang, C.-P.; Guo, Y. Relationship between Forest Resources and Economic Growth: Empirical Evidence from China. J. Clean. Prod. 2019, 214, 848–859. [Google Scholar] [CrossRef]
  33. Xiong, L.; Yu, C.; de Jong, M.; Wang, F.; Cheng, B. Economic Transformation in the Beijing-Tianjin-Hebei Region: Is It Undergoing the Environmental Kuznets Curve? Sustainability 2017, 9. [Google Scholar] [CrossRef] [Green Version]
  34. Xu, Q.; Dong, Y.; Yang, R. Urbanization Impact on Carbon Emissions in the Pearl River Delta Region: Kuznets Curve Relationships. J. Clean. Prod. 2018, 180, 514–523. [Google Scholar] [CrossRef]
  35. Dongfeng, Y.; Chengzhi, Y.; Ying, L. Urbanization and Sustainability in China: An Analysis Based on the Urbanization Kuznets-Curve. Plan. Theory 2013, 12, 391–405. [Google Scholar] [CrossRef]
  36. Vaca, R.A.; Golicher, D.J.; Cayuela, L.; Hewson, J.; Steininger, M. Evidence of Incipient Forest Transition in Southern Mexico. PLoS ONE 2012, 7, e42309. [Google Scholar] [CrossRef]
  37. Wang, C.; Gao, Q.; Wang, X.; Yu, M. Spatially Differentiated Trends in Urbanization, Agricultural Land Abandonment and Reclamation, and Woodland Recovery in Northern China. Sci. Rep. 2016, 6, 37658. [Google Scholar] [CrossRef] [Green Version]
  38. Qiu, B.; Chen, G.; Tang, Z.; Lu, D.; Wang, Z.; Chen, C. Assessing the Three-North Shelter Forest Program in China by a Novel Framework for Characterizing Vegetation Changes. ISPRS J. Photogramm. Remote Sens. 2017, 133, 75–88. [Google Scholar] [CrossRef]
  39. Li, Z.; Wu, W.; Liu, X.; Fath, B.D.; Sun, H.; Liu, X.; Xiao, X.; Cao, J. Land Use/Cover Change and Regional aClimate Change in an Arid Grassland Ecosystem of Inner Mongolia, China. Ecol. Model. 2017, 353, 86–94. [Google Scholar] [CrossRef]
  40. Li, Y.; Zhao, M.; Motesharrei, S.; Mu, Q.; Kalnay, E.; Li, S. Local Cooling and Warming Effects of Forests Based on Satellite Observations. Nat. Commun. 2015, 6, 6603. [Google Scholar] [CrossRef] [Green Version]
  41. Peng, S.-S.; Piao, S.; Zeng, Z.; Ciais, P.; Zhou, L.; Li, L.Z.; Myneni, R.B.; Yin, Y.; Zeng, H. Afforestation in China Cools Local Land Surface Temperature. Proc. Natl. Acad. Sci. USA 2014, 111, 2915–2919. [Google Scholar] [CrossRef] [PubMed] [Green Version]
  42. Wang, L.; Lee, X.; Schultz, N.; Chen, S.; Wei, Z.; Fu, C.; Gao, Y.; Yang, Y.; Lin, G. Response of Surface Temperature to Afforestation in the Kubuqi Desert, Inner Mongolia. J. Geophys. Res. Atmos. 2018, 123, 948–964. [Google Scholar] [CrossRef]
  43. Oehri, J.; Schmid, B.; Schaepman-Strub, G.; Niklaus, P.A. Terrestrial Land-Cover Type Richness Is Positively Linked to Landscape-Level Functioning. Nat. Commun. 2020, 11, 154. [Google Scholar] [CrossRef] [PubMed]
  44. Nagler, P.L.; Glenn, E.P.; Kim, H.; Emmerich, W.; Scott, R.L.; Huxman, T.E.; Huete, A.R. Relationship between Evapotranspiration and Precipitation Pulses in a Semiarid Rangeland Estimated by Moisture Flux Towers and MODIS Vegetation Indices. J. Arid Environ. 2007, 70, 443–462. [Google Scholar] [CrossRef]
  45. Bonan, G.B. Forests and Climate Change: Forcings, Feedbacks, and the Climate Benefits of Forests. Science 2008, 320, 1444–1449. [Google Scholar] [CrossRef] [PubMed] [Green Version]
  46. Sun, J.; Yu, X.; Wang, H.; Jia, G.; Zhao, Y.; Tu, Z.; Deng, W.; Jia, J.; Chen, J. Effects of Forest Structure on Hydrological Processes in China. J. Hydrol. 2018, 561, 187–199. [Google Scholar] [CrossRef]
  47. Lefcheck, J.S. PiecewiseSEM: Piecewise Structural Equation Modelling in r for Ecology, Evolution, and Systematics. Methods Ecol. Evol. 2016, 7, 573–579. [Google Scholar] [CrossRef]
  48. Aubrecht, C.; Gunasekera, R.; Ungar, J.; Ishizawa, O. Consistent yet Adaptive Global Geospatial Identification of Urban–Rural Patterns: The IURBAN Model. Remote Sens. Environ. 2016, 187, 230–240. [Google Scholar] [CrossRef] [Green Version]
  49. Pata, U.K. Renewable Energy Consumption, Urbanization, Financial Development, Income and CO2 Emissions in Turkey: Testing EKC Hypothesis with Structural Breaks. J. Clean. Prod. 2018, 187, 770–779. [Google Scholar] [CrossRef]
  50. Tang, H.; Liu, W.; Yun, W. Spatiotemporal Dynamics of Green Spaces in the Beijing–Tianjin–Hebei Region in the Past 20 Years. Sustainability 2018, 10, 2949. [Google Scholar] [CrossRef] [Green Version]
  51. Lei, H.; Yang, D.; Huang, M. Impacts of Climate Change and Vegetation Dynamics on Runoff in the Mountainous Region of the Haihe River Basin in the Past Five Decades. J. Hydrol. 2014, 511, 786–799. [Google Scholar] [CrossRef]
  52. Bonnesoeur, V.; Locatelli, B.; Guariguata, M.R.; Ochoa-Tocachi, B.F.; Vanacker, V.; Mao, Z.; Stokes, A.; Mathez-Stiefel, S.-L. Impacts of Forests and Forestation on Hydrological Services in the Andes: A Systematic Review. For. Ecol. Manag. 2019, 433, 569–584. [Google Scholar] [CrossRef] [Green Version]
  53. Bonan, G.B.; Patton, E.G.; Harman, I.N.; Oleson, K.W.; Finnigan, J.J.; Lu, Y.; Burakowski, E.A. Modeling Canopy-Induced Turbulence in the Earth System: A Unified Parameterization of Turbulent Exchange within Plant Canopies and the Roughness Sublayer (CLM-Ml V0). Geosci. Model Dev. 2018, 11, 1467–1496. [Google Scholar] [CrossRef] [Green Version]
  54. Li, E.; Endter-Wada, J.; Li, S. Dynamics of Utah’s Agricultural Landscapes in Response to Urbanization: A Comparison between Irrigated and Non-Irrigated Agricultural Lands. Appl. Geogr. 2019, 105, 58–72. [Google Scholar] [CrossRef]
  55. Wei, J.; Knoche, H.R.; Kunstmann, H. Contribution of Transpiration and Evaporation to Precipitation: An ET-Tagging Study for the Poyang Lake Region in Southeast China. J. Geophys. Res. Atmos. 2015, 120, 6845–6864. [Google Scholar] [CrossRef]
  56. Li, Q.; Wei, X.; Zhang, M.; Liu, W.; Fan, H.; Zhou, G.; Giles-Hansen, K.; Liu, S.; Wang, Y. Forest Cover Change and Water Yield in Large Forested Watersheds: A Global Synthetic Assessment. Ecohydrology 2017, 10, e1838. [Google Scholar] [CrossRef]
  57. Manoli, G.; Fatichi, S.; Schläpfer, M.; Yu, K.; Crowther, T.W.; Meili, N.; Burlando, P.; Katul, G.G.; Bou-Zeid, E. Magnitude of Urban Heat Islands Largely Explained by Climate and Population. Nature 2019, 573, 55–60. [Google Scholar] [CrossRef] [PubMed]
  58. Huang, R.-J.; Zhang, Y.; Bozzetti, C.; Ho, K.-F.; Cao, J.-J.; Han, Y.; Daellenbach, K.R.; Slowik, J.G.; Platt, S.M.; Canonaco, F.; et al. High Secondary Aerosol Contribution to Particulate Pollution during Haze Events in China. Nature 2014, 514, 218–222. [Google Scholar] [CrossRef] [PubMed] [Green Version]
  59. Li, Z.; Wang, Y.; Guo, J.; Zhao, C.; Cribb, M.C.; Dong, X.; Fan, J.; Gong, D.; Huang, J.; Jiang, M.; et al. East Asian Study of Tropospheric Aerosols and Their Impact on Regional Clouds, Precipitation, and Climate (EAST-AIRCPC). J. Geophys. Res. Atmos. 2019, 124, 13026–13054. [Google Scholar] [CrossRef] [Green Version]
  60. Ke, X.; van Vliet, J.; Zhou, T.; Verburg, P.H.; Zheng, W.; Liu, X. Direct and Indirect Loss of Natural Habitat Due to Built-up Area Expansion: A Model-Based Analysis for the City of Wuhan, China. Land Use Policy 2018, 74, 231–239. [Google Scholar] [CrossRef]
  61. Qianwen, C.; Penghui, J.; Lingyan, C.; Jinxia, S.; Yunqian, Z.; Liyan, W.; Manchun, L.; Feixue, L.; Axing, Z.; Dong, C. Delineation of a Permanent Basic Farmland Protection Area around a City Centre: Case Study of Changzhou City, China. Land Use Policy 2017, 60, 73–89. [Google Scholar] [CrossRef]
  62. Peng, J.; Jia, J.; Liu, Y.; Li, H.; Wu, J. Seasonal Contrast of the Dominant Factors for Spatial Distribution of Land Surface Temperature in Urban Areas. Remote Sens. Environ. 2018, 215, 255–267. [Google Scholar] [CrossRef]
  63. Jiang, Y.; Zevenbergen, C.; Fu, D. Understanding the Challenges for the Governance of China’s “Sponge Cities” Initiative to Sustainably Manage Urban Stormwater and Flooding. Nat. Hazards 2017, 89, 521–529. [Google Scholar] [CrossRef]
  64. Dai, L.; Wörner, R.; van Rijswick, H.F.M.W. Rainproof Cities in the Netherlands: Approaches in Dutch Water Governance to Climate-Adaptive Urban Planning. Int. J. Water Resour. Dev. 2018, 34, 652–674. [Google Scholar] [CrossRef] [Green Version]
  65. Cui, X.; Guo, X.; Wang, Y.; Wang, X.; Zhu, W.; Shi, J.; Lin, C.; Gao, X. Application of Remote Sensing to Water Environmental Processes under a Changing Climate. J. Hydrol. 2019, 574, 892–902. [Google Scholar] [CrossRef]
Figure 1. Study area of the Haihe River Basin and the land use and cover pattern. On the legend: A=agricultural land, B = bare land, F = forest, G = grassland and shrub, U = urban, W = waters and wetland (a). The spatial patterns of the selected land surface and regional climate indicators (NDVI = normalized difference vegetation index, LST = land surface temperature, CWC = cloud water content, P = precipitation) (b).
Remotesensing 12 02701 g001
Figure 2. Conceptual diagram illustrating how urbanization drives regional forest increase by afforestation after a certain stage of economic development (indicated by the vertical dashed line) under the framework of the Environmental Kuznets Curve (adapted from [35]).
Remotesensing 12 02701 g002
Figure 3. The hypothesized structural equation modelling urbanization-driven changes in land-climate interaction in the Haihe River Basin, with the assumed pathways (the gray single-arrow lines) and correlation pairs (the light gray double-arrow dashed lines). (U = urban, F = forest, A = agricultural land, G = grassland and shrub, NDVI = normalized difference vegetation index, LST = land surface temperature, CWC = cloud water content, P = precipitation).
Remotesensing 12 02701 g003
Figure 4. The area proportion dynamics of land use and cover in Haihe River Basin from 2000 to 2015.
Remotesensing 12 02701 g004
Figure 5. The dynamics of the land-climate indicators, normalized difference vegetation index (NDVI) (a), albedo (b), land surface temperature (LST) (c), cloud water content (CWC) (d), and precipitation (P) (e), by the different land cover types over the period of 2000–2015 in the Haihe River Basin.
Remotesensing 12 02701 g005
Figure 6. The results of the structural equation modeling for the annual land-climate dynamics driven by urbanization. (The solid blue single-arrow lines mean the positive effect pathways testified at the significance level of p < 0.05; while the grey ones mean the negative. The dashed blue double-arrow lines mean the positive correlation testified at the significance level of p < 0.05; while the grey ones mean the negative.) (Global goodness of model fit: Fisher’s C = 43.36, p = 0.186).
Remotesensing 12 02701 g006
Figure 7. The conceptualized summary diagram of the three sub-systems to demonstrate key processes and effects enhanced in the land-climate dynamics under the land use and cover change (LUCC) driven by the urbanization in the Haihe River Basin. (The abbreviations of processes or effects: Cl = crop intensification, Af = afforestation, HC = horizontal condensation, Ht = land surface heating, Co = land surface cooling, AP = air pollution emission, UHI = urban heat island, AC = atmospheric convection, AT = atmospheric turbulence, Tr = transpiration, CF = cloud formation, P = precipitation, (+) = increasing, (−) = decreasing).
Remotesensing 12 02701 g007
Table 1. The main qualitative assumptions of the pathways in the structural equation modelling. (U = urban, F = forest, A = agricultural land, G = grassland and shrub, NDVI = normalized difference vegetation index, LST = land surface temperature, CWC = cloud water content, P = precipitation).
SubsystemPathwayProcessRelationshipReferences
LUCC① U→FAfforestation[3,32,33,35,36,37,38]
③ U→ACrop intensification+[3,30,31]
LUCC→land surface
LUCC→regional climate
④ F→NDVIVegetational biomass growth+[39]
⑤ U→albedoLand surface roughness change+/−[16,42,43]
⑥ A→LST, ⑦ G→LST Land surface energy balance+/−[4,27,39,40,41]
⑧ F→PEco-hydrological process+/−[45,46]
Land surface→regional climate⑨ NDVI→P, ⑩ NDVI→CWCEvapotranspiration promoting the regional hydrological cycle+[27,44]
⑬ LST→P, ⑭ LST→CWCLand surface heating drying the regional air[15,39]
Table 2. The temporal trends, mean, and coefficient of variation (CV) of the land-climate indicators by different land use and cover types over the period of 2000~2015 in the Haihe River Basin.
IndicatorsStatistical IndexDifferent Land Use and Cover TypesAverage of All Land Use and Cover Types
Agricultural LandBare LandForestGrassland and ShrubUrbanWaters and Wetland
NDVIR2↑0.29↓0.26↑0.57↑0.55↑0.39↑0.410.14↑
p-value0.032 *0.045 *0.0007 ***0.001 **0.0096 **0.007 **0.15
Mean0.39 0.22 0.46 0.36 0.35 0.20 0.32
CV3.3%17.2%3.5%4.2%3.9%4.3%3.42%
albedoR2↓0.026↓0.23↓0.34↓0.56↑0.44↑0.0020.26↓
p-value0.55 0.06 0.018 *0.0009 ***0.005 **0.86 0.044 *
Mean0.15 0.18 0.11 0.14 0.14 0.11 0.14
CV1.3%9.7%2.1%2.4%1.6%2.4%2.53%
LST
(°C)
R2↓0.088↓<0.001↓0.39↓0.33↓0.15↓0.0850.13↓
p-value0.27 0.98 0.0099 **0.019*0.14 0.27 0.16
Mean20.39 16.36 15.41 17.43 21.20 16.78 17.93
CV5.5%15.5%9.1%8.9%6.0%8.3%7.67%
CWC
(g/m2)
R2↓0.0037↓0.096↑0.074↑0.022↓0.0014↓0.00430.003↓
p-value0.82 0.24 0.31 0.59 0.89 0.81 0.85
Mean204.37 199.24 206.27 207.97 200.27 200.32 202.07
CV6.3%13.0%6.8%7.8%6.9%8.3%6.72%
P
(mm)
R2↑0.071↑0.16↑0.22↑0.18↑0.18↑0.190.18↑
p-value0.32 0.13 0.08 0.10 0.10 0.09 0.10
Mean585.63 437.99 561.98 518.61 564.81 572.77 540.30
CV12.6%16.3%10.4%10.8%11.9%13.2%11.57%
↑: increasing trend; ↓: decreasing trend; marks for significance level: * p < 0.05, ** p < 0.01, *** p < 0.001.
Table 3. The overall effect of urbanization on the regional precipitation based on the path coefficients of structural equation modeling.
PathwayCoefficient Product
U→F→NDVI→P0.30
U→F→P−0.59
U→albedo→P0.20
U→G→LST→P1.13
U→A→LST→P−0.79
Total U→P0.25

