Author Contributions
Conceptualization, J.W., Y.W. and Y.X.; methodology, J.W., L.Y. and Y.W.; software, J.W. and L.Y.; validation, J.W. and Q.W.; investigation, L.Y.; resources, J.W.; data curation, J.W. and Y.W.; writing—original draft preparation, J.W.; writing—review and editing, J.W., L.Y. and Y.W.; visualization, L.Y.; supervision, Y.X. and Y.W.; project administration, Y.X.; funding acquisition, Y.X. and Y.W.; investigation, J.Y.; software, J.W. and L.Y. All authors have read and agreed to the published version of the manuscript.
Figure 1.
The location of the Yangtze River Delta region and rain gauges. Black dots represent the locations of the gauge stations. Black squares in the right figure represent the IMERG products gridboxs nearest gauge station. The blue and black lines represent the best track of Jondari and Rumbia with 6h interval, respectively. Track data is obtained from IBTrACS (
ftp://eclipse.ncdc.noaa.gov/pub/ibtracs/v04r00/provisional/csv/).
Figure 2.
Spatial distribution of accumulated precipitation from IMERG: (a–c) for TC Jondari during 0600 UTC 02 to 1800 UTC 03 August 2018; (d–f) for TC Rumbia during 0400 UTC to 1400 UTC 17 August 2018. Each dot represents an observed accumulation precipitation during TC landfalling.
Figure 2.
Spatial distribution of accumulated precipitation from IMERG: (a–c) for TC Jondari during 0600 UTC 02 to 1800 UTC 03 August 2018; (d–f) for TC Rumbia during 0400 UTC to 1400 UTC 17 August 2018. Each dot represents an observed accumulation precipitation during TC landfalling.
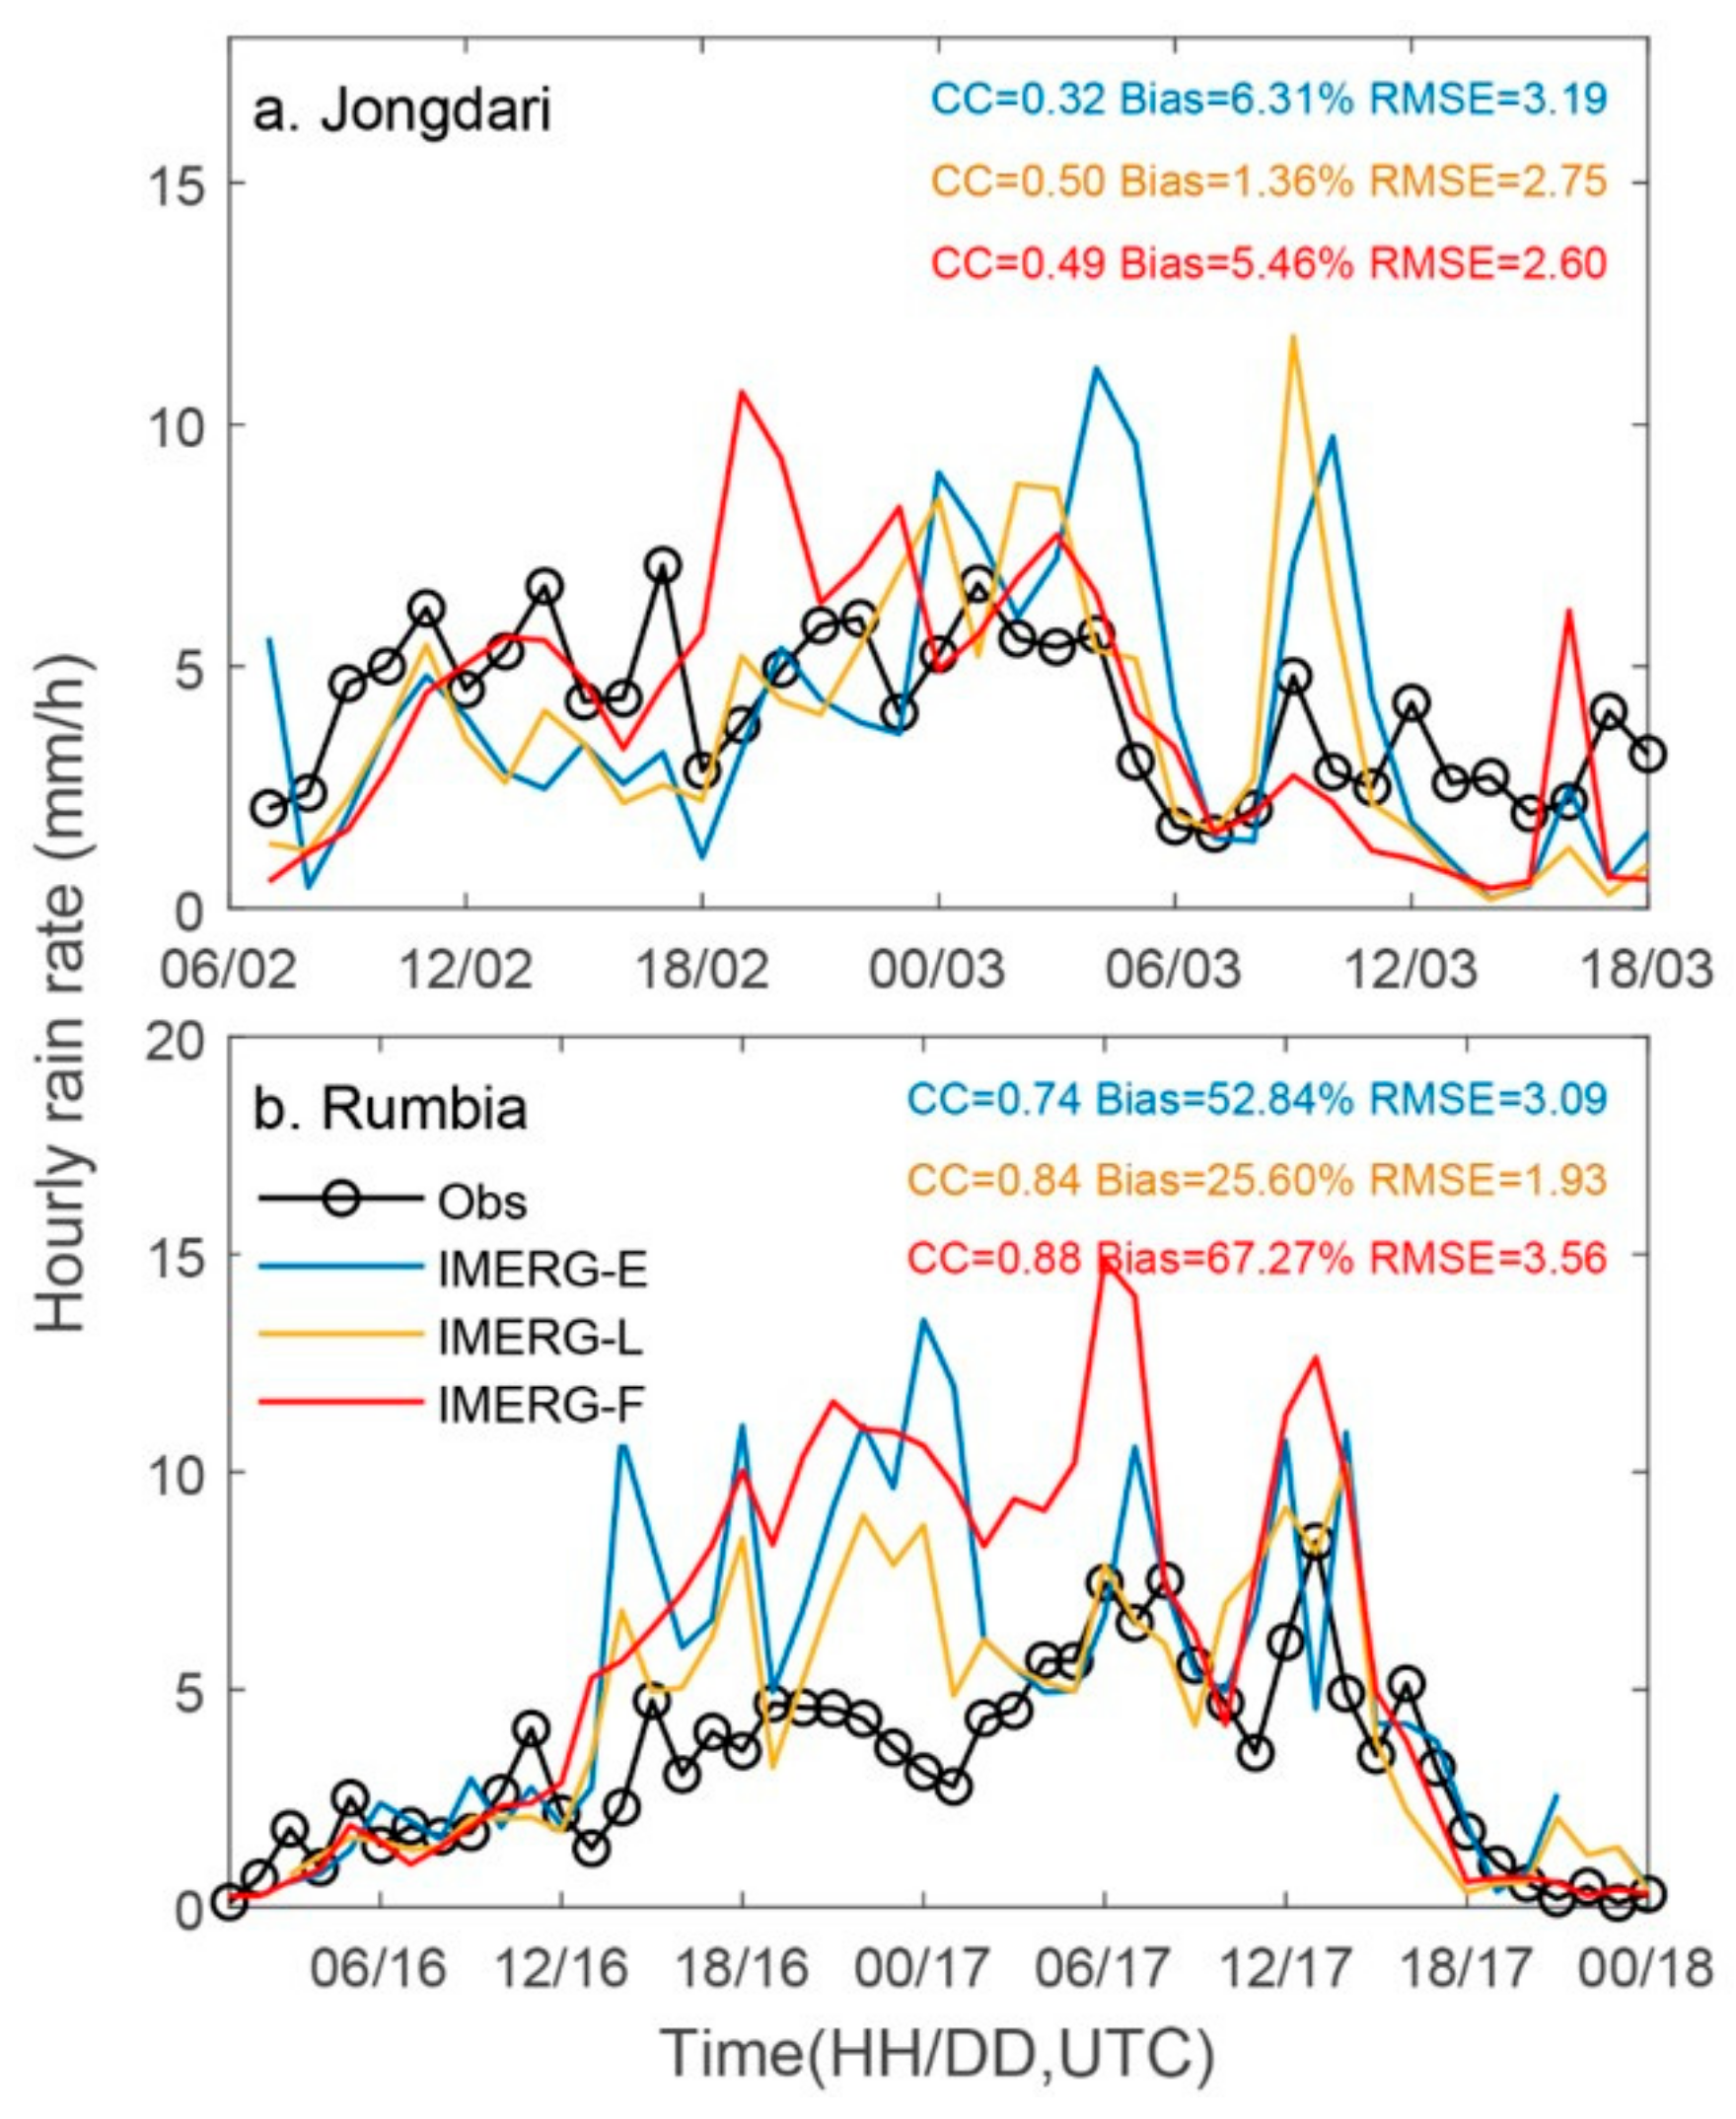
Figure 3.
Temporal distribution of hourly rain rate over Yangtze River Delta (YRD).
Figure 3.
Temporal distribution of hourly rain rate over Yangtze River Delta (YRD).
Figure 4.
Temporal distribution of hourly frequency accumulation for: (a,d) light rain (0.1 ≤ R < 2.5 mm) (b,e) moderate rain (2.5 ≤ R < 8 mm), and (c,f) heavy rain (R ≥ 8 mm) over YRD.
Figure 4.
Temporal distribution of hourly frequency accumulation for: (a,d) light rain (0.1 ≤ R < 2.5 mm) (b,e) moderate rain (2.5 ≤ R < 8 mm), and (c,f) heavy rain (R ≥ 8 mm) over YRD.
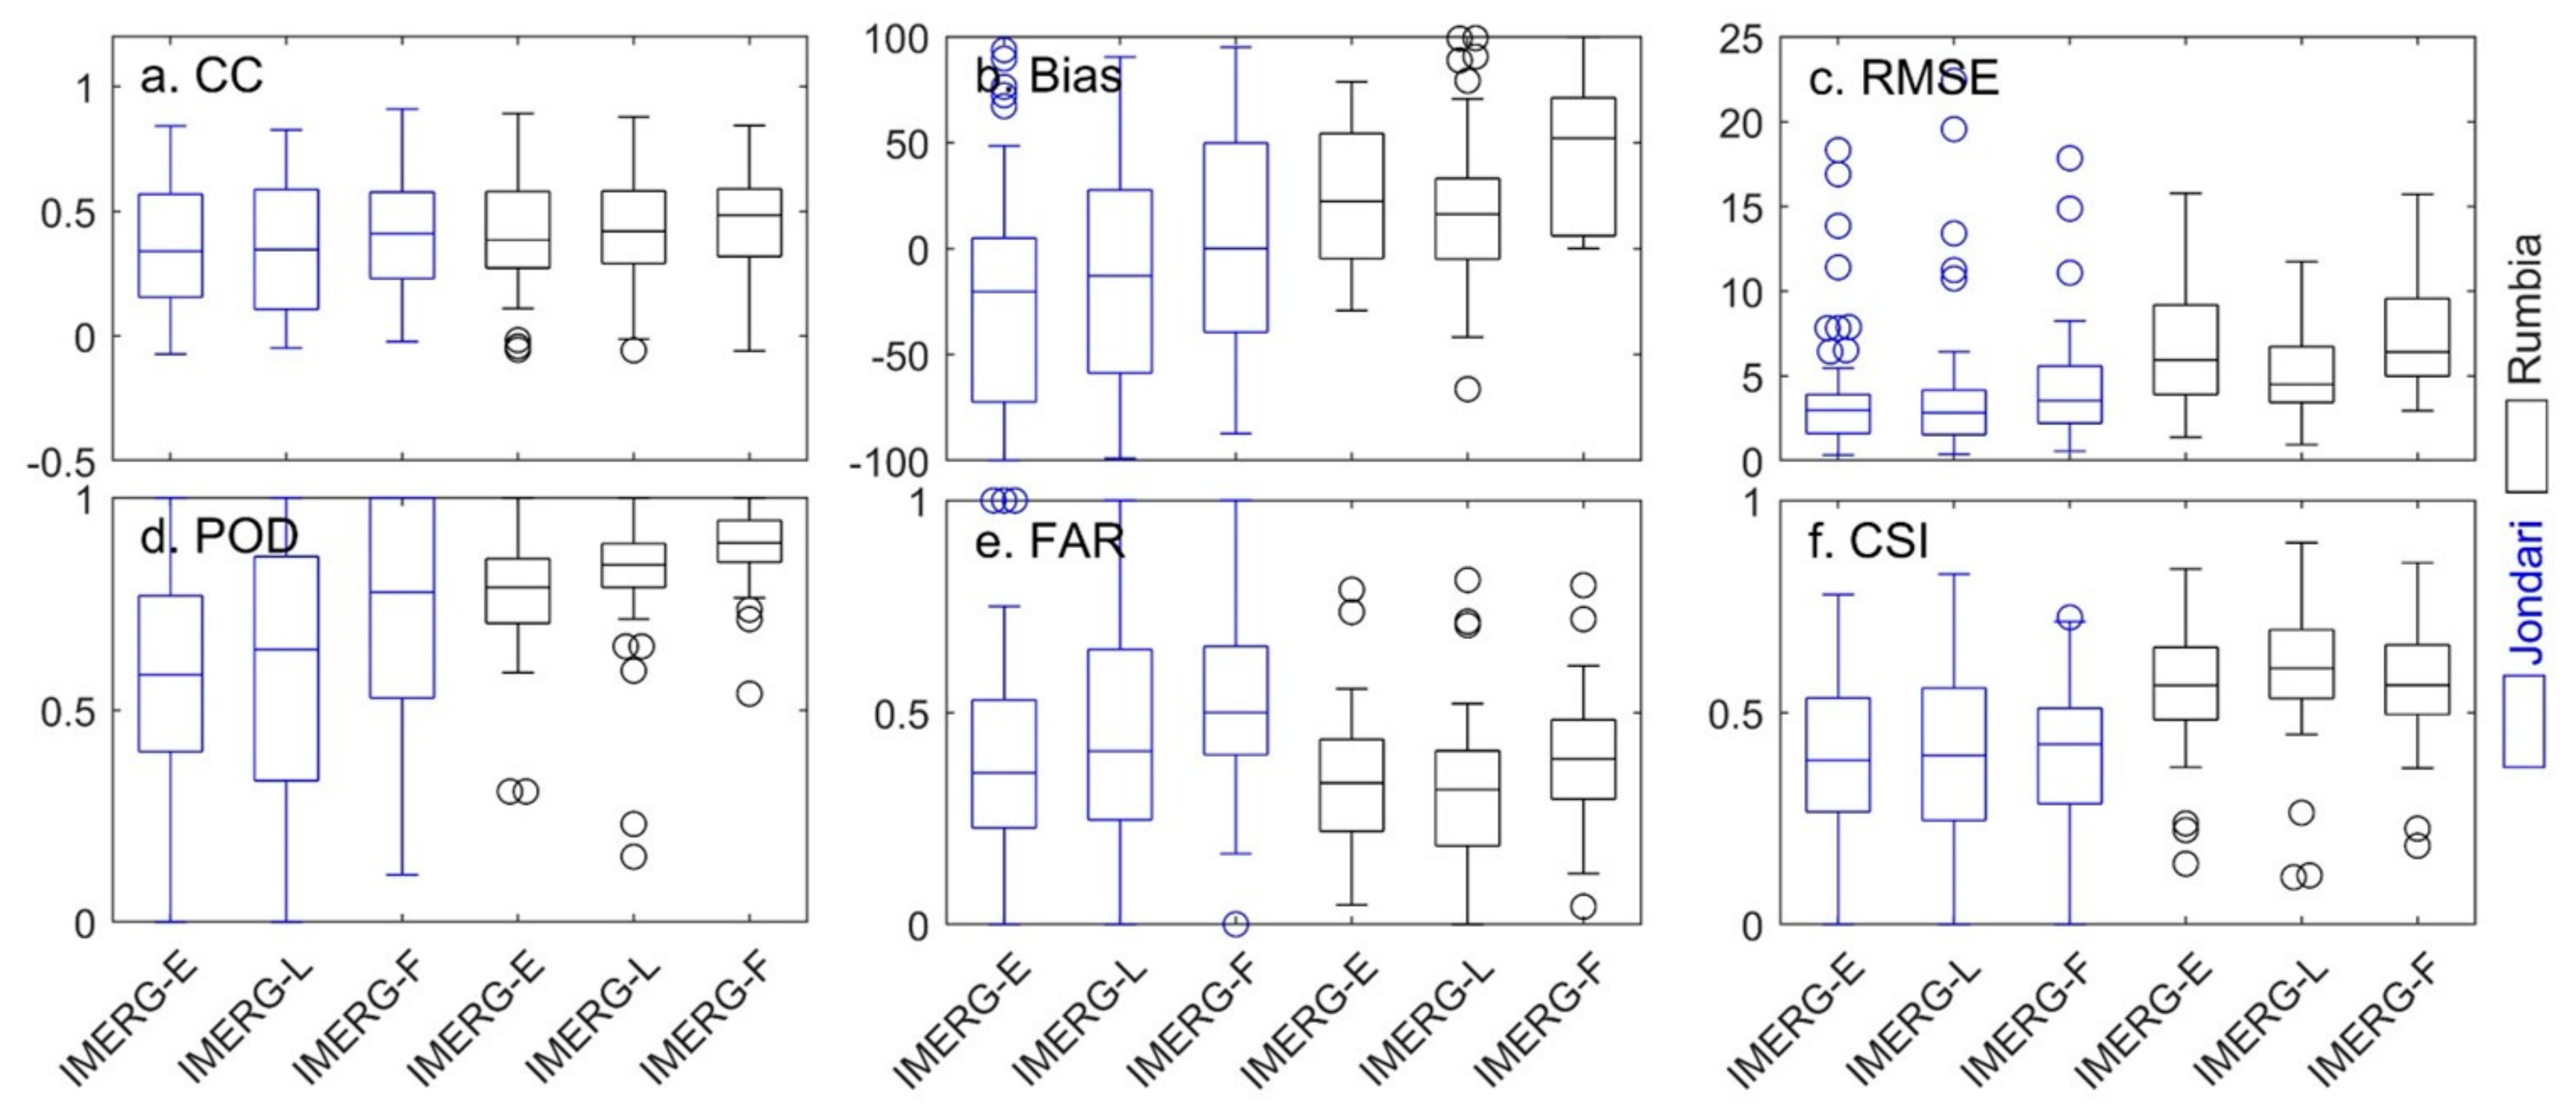
Figure 5.
Box plots of the statistical indices of IMERG at an hourly scale versus the gauge observations over YRD.
Figure 5.
Box plots of the statistical indices of IMERG at an hourly scale versus the gauge observations over YRD.
Figure 6.
The increments of several variables at the lowest model level from 4D-Var assimilated 6h accumulated precipitation of IMERG-L at 0600 UTC 16 Aug 2018 for TC Rumbia: (a) zonal wind (m/s), (b) meridional wind (m/s), (c) surface pressure (Pa), (d) potential temperature (K), (e) surface dry air mass pressure (Pa), and (f) specific humidity (kg/kg).
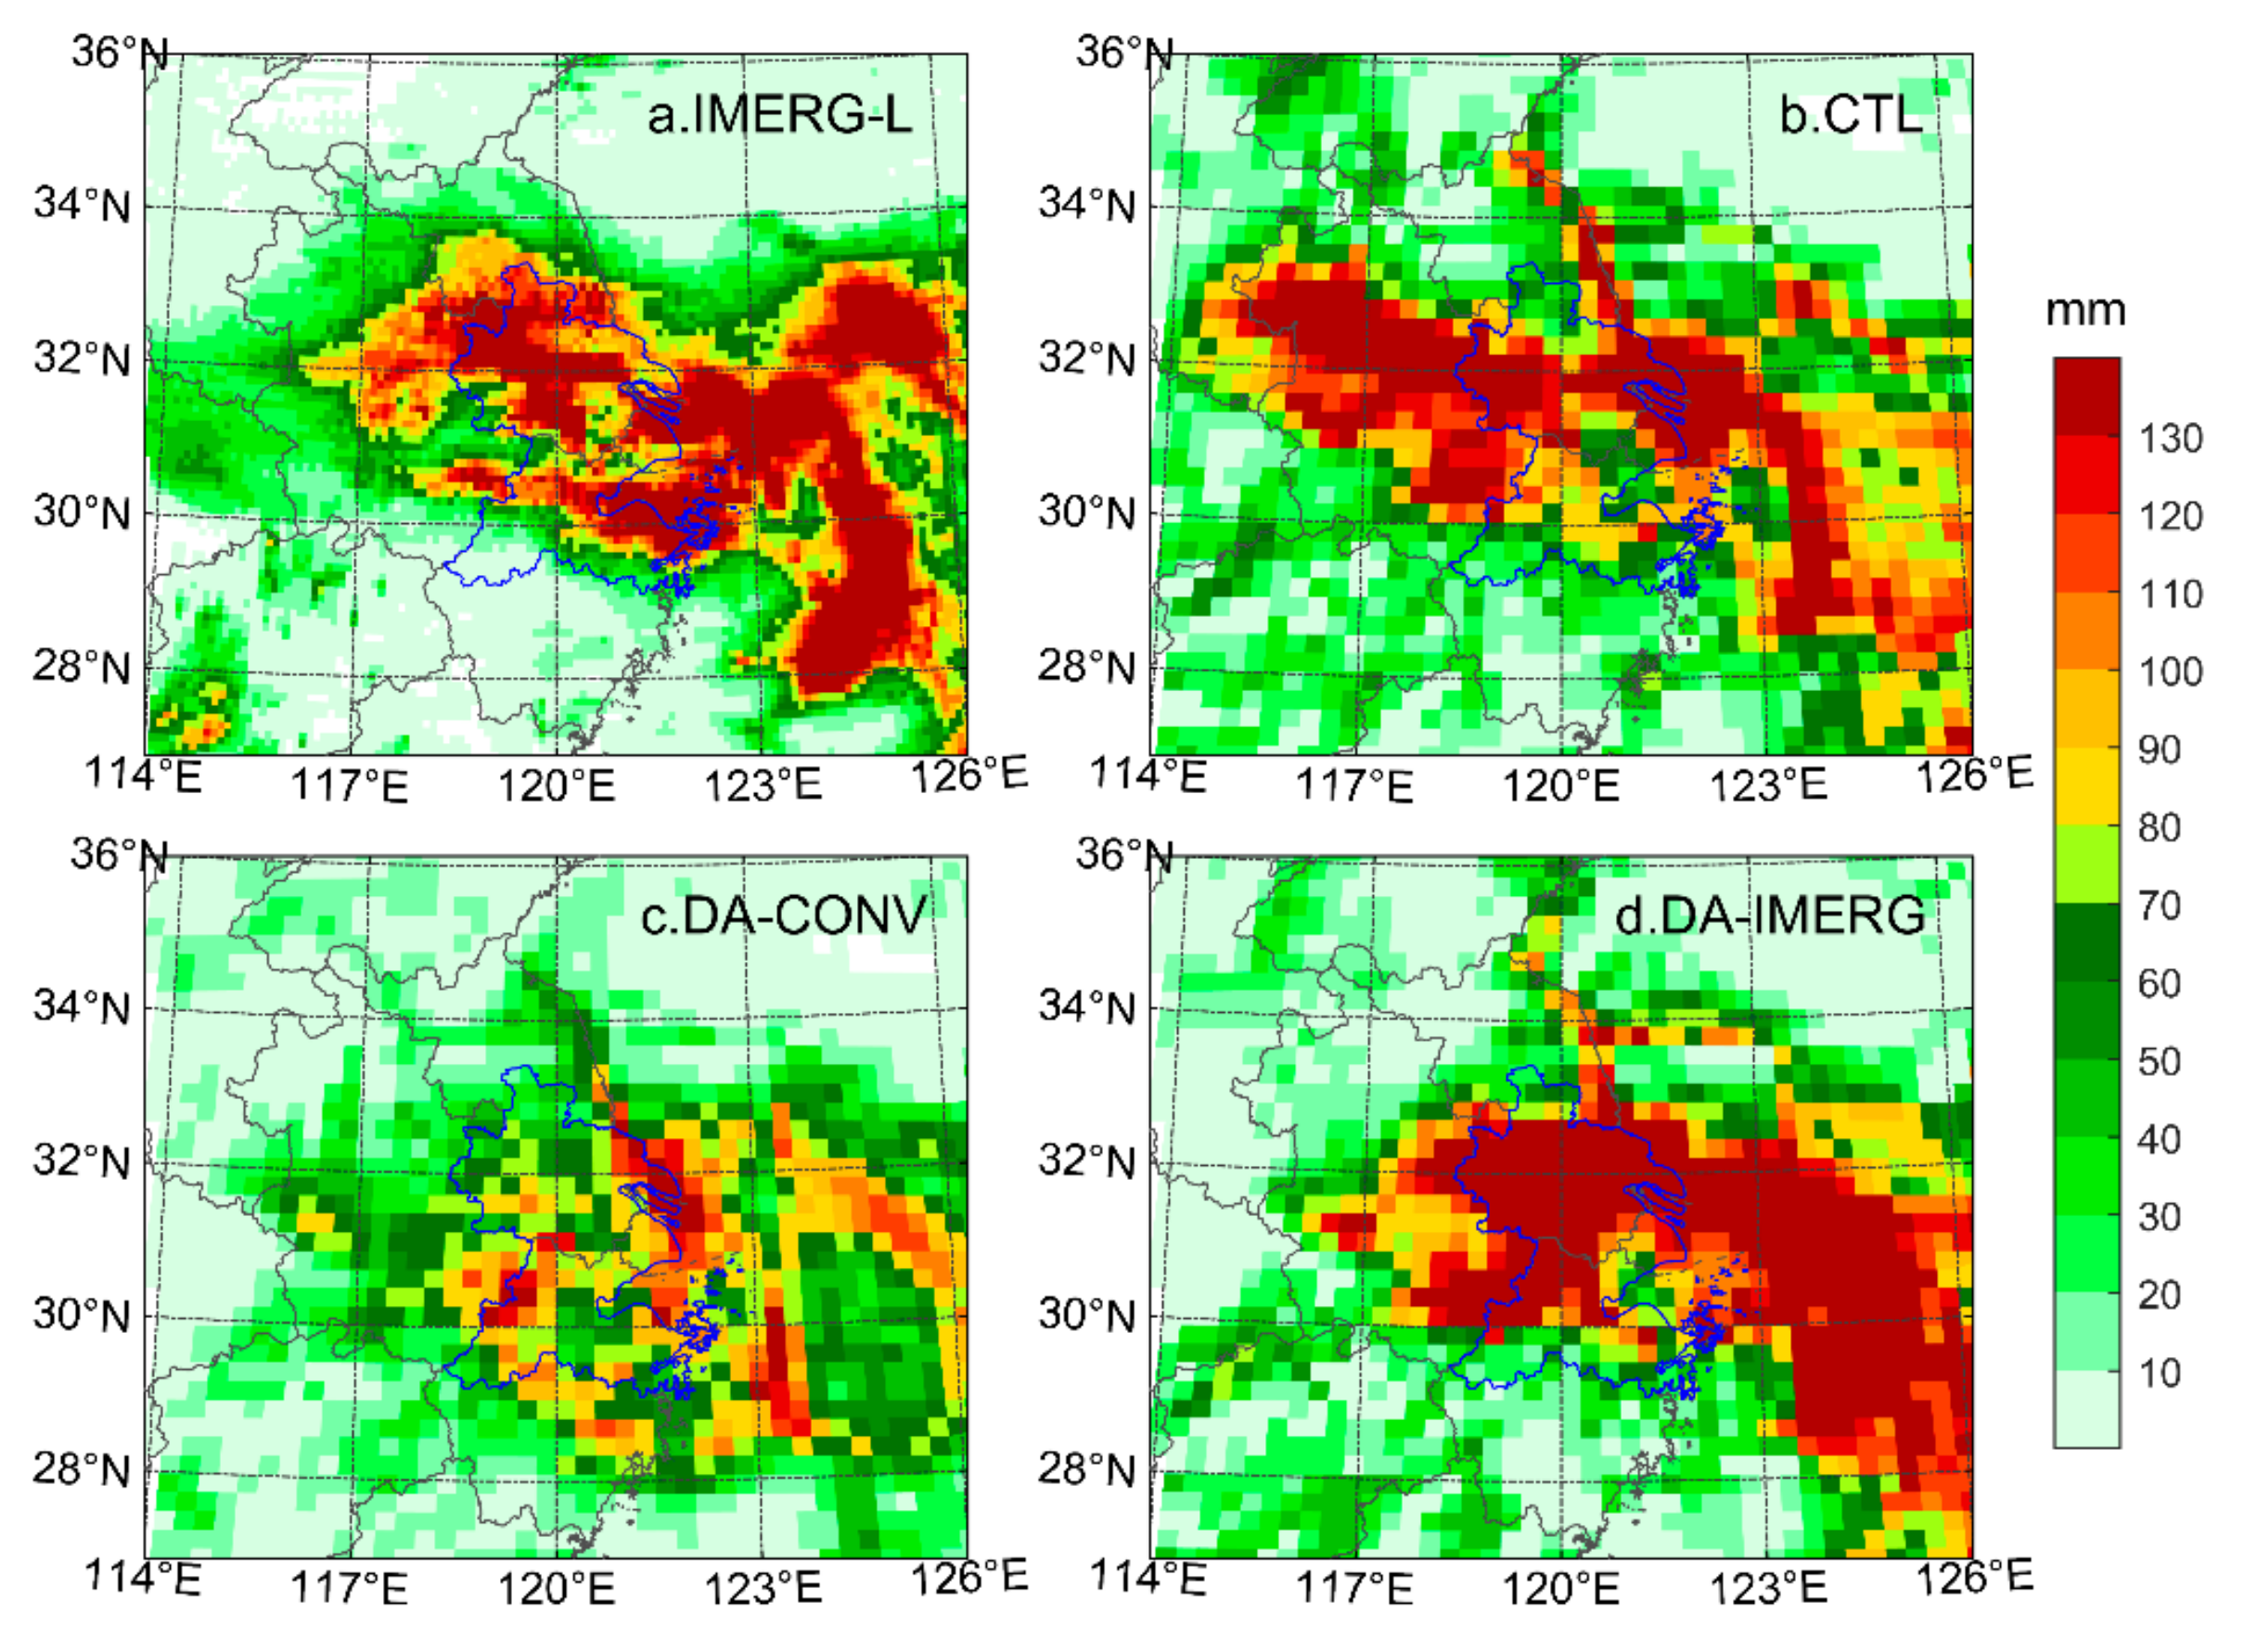
Figure 7.
Precipitation accumulation of IMERG-L (a), CTL experiment (b), DA-CONV experiment (c), and DA-IMERG experiment (d) for TC Jondari during 0600 UTC 02 to 1800 UTC 3 August 2018.
Figure 7.
Precipitation accumulation of IMERG-L (a), CTL experiment (b), DA-CONV experiment (c), and DA-IMERG experiment (d) for TC Jondari during 0600 UTC 02 to 1800 UTC 3 August 2018.
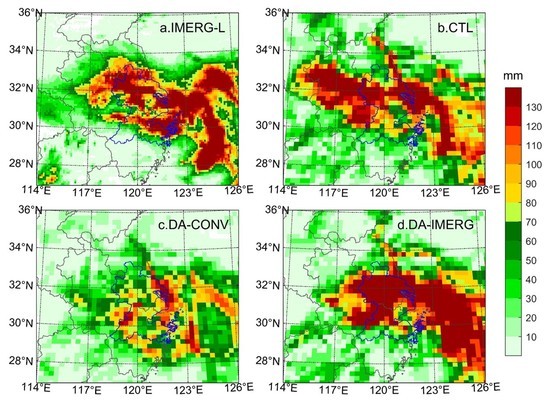
Figure 8.
Precipitation accumulation of IMERG-L (a), CTL experiment (b), DA-CONV experiment (c), and DA-IMERG experiment (d) for TC Rumbia during 0000 UTC 16 to 1800 UTC 17 August 2018.
Figure 8.
Precipitation accumulation of IMERG-L (a), CTL experiment (b), DA-CONV experiment (c), and DA-IMERG experiment (d) for TC Rumbia during 0000 UTC 16 to 1800 UTC 17 August 2018.
Figure 9.
Spatial distribution of 6 h accumulated precipitation (mm) for: (a,e,i) IMERG, (b,f,j) CTL, (c,g,k) DA-CONV, and (d,h,l) DA-IMERG.
Figure 9.
Spatial distribution of 6 h accumulated precipitation (mm) for: (a,e,i) IMERG, (b,f,j) CTL, (c,g,k) DA-CONV, and (d,h,l) DA-IMERG.
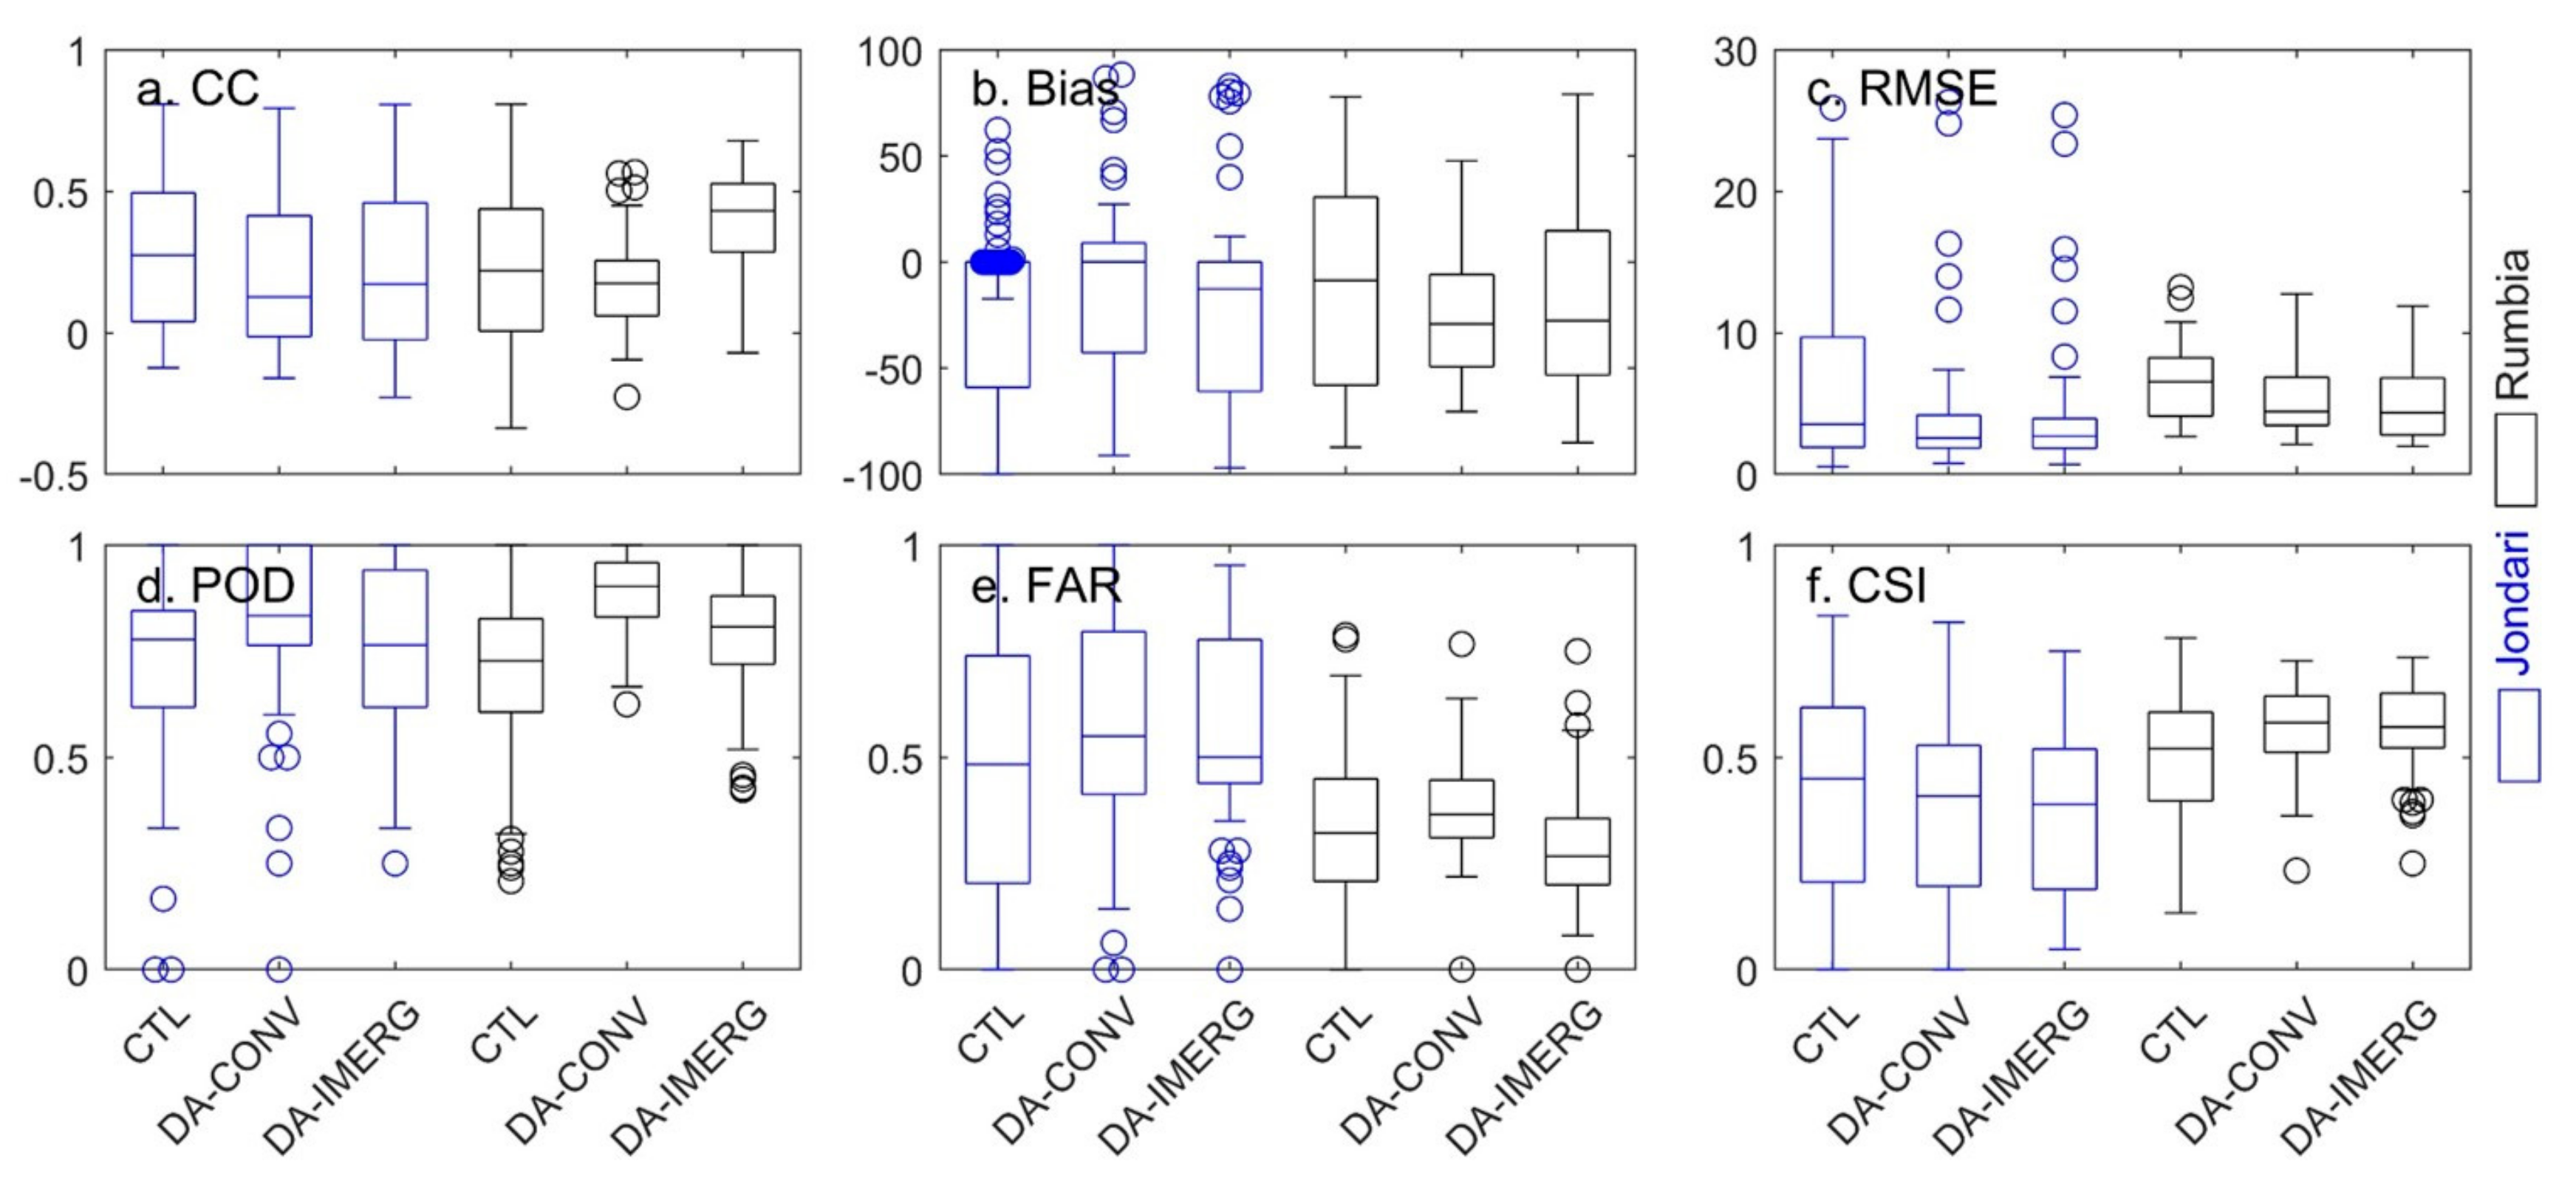
Figure 10.
Boxplots of statistical indices of CC (a), Bias (b), RMSE (c), POD (d), FAR (e), and CSI (f) for the CTL, DA-CONV, and DA-IMERG.
Figure 10.
Boxplots of statistical indices of CC (a), Bias (b), RMSE (c), POD (d), FAR (e), and CSI (f) for the CTL, DA-CONV, and DA-IMERG.
Figure 11.
Fractions skill scores for the hourly precipitation threshold of (a) 1.0 mm/h, (b) 2.5 mm/h, (c) 5.0 mm/h, and (d) 10 mm/h at grid scale in the domain D2 for the TC Jondari. The precipitation observation used in the score is from the IMERG-L.
Figure 11.
Fractions skill scores for the hourly precipitation threshold of (a) 1.0 mm/h, (b) 2.5 mm/h, (c) 5.0 mm/h, and (d) 10 mm/h at grid scale in the domain D2 for the TC Jondari. The precipitation observation used in the score is from the IMERG-L.
Figure 12.
Fractions skill scores for the hourly precipitation threshold of (a) 1.0 mm/h, (b) 2.5 mm/h, (c) 5.0 mm/h, and (d) 10 mm/h at grid scale in the domain D2 for the TC Rumbia. The precipitation observation used in the score is from the IMERG-L.
Figure 12.
Fractions skill scores for the hourly precipitation threshold of (a) 1.0 mm/h, (b) 2.5 mm/h, (c) 5.0 mm/h, and (d) 10 mm/h at grid scale in the domain D2 for the TC Rumbia. The precipitation observation used in the score is from the IMERG-L.
Figure 13.
The aggregated fractions skill scores for hourly precipitation threshold of (a,e) 1.0 mm/h, (b,f) 2.5 mm/h, (c,g) 5.0 mm/h, and (d,h) 10 mm/h at different horizontal scales.
Figure 13.
The aggregated fractions skill scores for hourly precipitation threshold of (a,e) 1.0 mm/h, (b,f) 2.5 mm/h, (c,g) 5.0 mm/h, and (d,h) 10 mm/h at different horizontal scales.
Table 1.
Overview of the WRF model configuration.
Table 1.
Overview of the WRF model configuration.
| Configuration | Outer Domain | Inner Domain |
|---|
| Model Version | Version 3.9.1 |
| Horizontal grid | 90 × 90 | 76 × 76 |
| Grid spacing (km) | 27 | 9 |
| Vertical grids | 38 layer/Top 50hPa |
| Time step (s) | 60 | 30 |
| Microphysics | Morrison two-moment scheme |
| Longwave radiation | RRTMG scheme |
| Shortwave radiation |
| Surface layer | Monin–Obukhov scheme |
| Land-surface process | Noah land-surface model |
| Planetary boundary layer process | Mellor–Yamada–Jajic TKE scheme |
| Cumulus scheme | Kain–Fritsch (KF) |
Table 2.
Brief description of experiment design.
Table 2.
Brief description of experiment design.
| Experiment | Analysis Time | Assimliation Data |
|---|
| Jongdari | Rumbia |
|---|
| CTL | 0000 UTC 02 to 1800 UTC 03 August | 1800 UTC 15 to 0000 UTC 18 August | No |
| DA-CONV | 0600 UTC 02 to 1800 UTC 03 August | 0000 UTC 16 to 0000 UTC 18 August | Surface and upper air observations |
| DA-IMERG | 0600 UTC 02 to 1800 UTC 03 August | 0000 UTC 16 to 0000 UTC 18 August | IMERG-L |
Table 3.
Statistical indices for evaluating IMERG and WRF precipitation.
Table 3.
Statistical indices for evaluating IMERG and WRF precipitation.
| Statistical Indices | Unit | Equation | Target Value |
|---|
| Correlation coefficient (CC) | None | | 1 |
| Relative bias (Bias) | None | | 0 |
| Root-mean-square error (RMSE) | mm | | 0 |
| Probability of detection (POD) | None | | 1 |
| False alarm ratio (FAR) | None | | 0 |
| Critical success index (CSI) | None | | 1 |
| Fractions skill score (FSS) | None |
| 1 |
Table 4.
Statistical metrics of satellite rainfall products for frequency at different intensities within the YRD. Bias, RMSE, and CC represent mean bias, root mean square error, and correlation coefficient, respectively.
Table 4.
Statistical metrics of satellite rainfall products for frequency at different intensities within the YRD. Bias, RMSE, and CC represent mean bias, root mean square error, and correlation coefficient, respectively.
| | | Jongdari | Rumbia |
|---|
| | | IMERG-E | IMERG-L | IMERG-F | IMERG-E | IMERG-L | IMERG-F |
|---|
| CC | R < 2.5 | 0.56 | 0.59 | 0.52 | 0.41 | 0.83 | 0.81 |
| 2.5 ≤ R < 8 | 0.75 | 0.68 | 0.79 | 0.55 | 0.89 | 0.89 |
| R ≥ 8 | 0.78 | 0.83 | 0.85 | 0.18 | 0.80 | 0.90 |
| Bias(%) | R < 2.5 | −27.82 | −25.97 | 13.91 | −13.37 | 14.45 | 62.55 |
| 2.5 ≤ R < 8 | 11.06 | 21.28 | 22.55 | −8.40 | 21.58 | 29.45 |
| R ≥ 8 | −18.18 | −16.58 | 49.20 | 12.03 | 17.82 | 138.55 |
| RMSE(mm) | R < 2.5 | 10.27 | 9.90 | 11.23 | 13.24 | 5.71 | 7.39 |
| 2.5 ≤ R < 8 | 4.25 | 4.82 | 4.07 | 11.78 | 5.86 | 4.32 |
| R ≥ 8 | 3.30 | 3.06 | 5.79 | 15.78 | 6.05 | 12.2 |
Table 5.
Statistical indices of mean hourly precipitation from IMERG over YRD.
Table 5.
Statistical indices of mean hourly precipitation from IMERG over YRD.
| | | CC | Bias (%) | RMSE (mm) | POD | FAR | CSI |
|---|
| Jondari | IMERG-E | 0.35 | 7.12 | 3.93 | 0.56 | 0.41 | 0.38 |
| IMERG-L | 0.35 | 17.17 | 4.08 | 0.60 | 0.45 | 0.40 |
| IMERG-F | 0.42 | 46.43 | 4.32 | 0.73 | 0.50 | 0.41 |
| Rumbia | IMERG-E | 0.40 | 82.38 | 6.65 | 0.78 | 0.31 | 0.58 |
| IMERG-L | 0.43 | 49.85 | 5.20 | 0.83 | 0.30 | 0.61 |
| IMERG-F | 0.45 | 135.11 | 7.52 | 0.92 | 0.39 | 0.58 |
Table 6.
Statistical indices of mean hourly precipitation for the CTL, DA-CONV, and DA-IMERG.
Table 6.
Statistical indices of mean hourly precipitation for the CTL, DA-CONV, and DA-IMERG.
| | | CC | Bias (%) | RMSE (mm) | POD | FAR | CSI |
|---|
| Jondari | CTL | 0.28 | 3.73 | 5.92 | 0.71 | 0.47 | 0.42 |
| DA-CONV | 0.21 | 15.88 | 4.41 | 0.81 | 0.57 | 0.39 |
| DA-IMERG | 0.20 | −4.81 | 4.32 | 0.73 | 0.58 | 0.36 |
| Rumbia | CTL | 0.23 | 25.29 | 6.44 | 0.69 | 0.35 | 0.49 |
| DA-CONV | 0.18 | −19.25 | 5.44 | 0.89 | 0.39 | 0.56 |
| DA-IMERG | 0.41 | −13.84 | 5.09 | 0.78 | 0.30 | 0.57 |


