1. Introduction
Emissions from land-use changes, such as deforestation, logging, and intensive cultivation of cropland, are the second-largest anthropogenic emissions source after fossil fuel emissions [
1]. Annually, 15–25% of global greenhouse gas emissions are produced by the loss of tropical rainforests due to human activities [
2]. Although deforestation contributes to carbon emissions, forest degradation is the result of human-induced activities that lead to a long-term reduction in forest carbon stocks. In Borneo, most lowland primary forest has disappeared as a result of deforestation and forest degradation over the past decades [
3,
4]. The remaining upland rainforests are severely threatened by increasing anthropogenic activities, particularly in the mountains of the Malaysian Borneo adjacent to the Indonesian border (Sarawak) in which rates of loss are 10-times greater than across the border [
5]. Much of the forest loss and degradation could affect cover, structure, and carbon stocks or biomass of the remaining forests. To monitor the change of carbon stocks caused by these human disturbances, it is necessary to obtain periodical information about the aboveground biomass (AGB) of a forest. However, historical forest structure information, such as diameter at breast height (DBH) and/or height that are needed for AGB calculations, are seriously lacking in this part of the tropics [
6], and ground inventory for monitoring AGB in the area can be time-consuming and laborious. Alternatively, remote sensing coupled with field sampling plots can be used to estimate the AGB of a relatively large area at an acceptable cost [
7].
Spaceborne optical and Synthetic Aperture Radar (SAR) data have been used to develop models to estimate above-ground biomass (AGB) in different types of forests on various spatial scales [
8,
9]. Optical satellite imagery is advantageous in terms of the acquisition cost, revisiting frequency, and broad spatial coverage. However, the capability of this type of imagery to estimate AGB is critically limited by the spectral saturation in high-biomass forests [
10,
11,
12,
13,
14]. Backscatters from SAR data correlate with forest AGB, but this approach suffers from signal saturation at the high forest AGB, thus adversely affecting the AGB estimation [
15,
16,
17,
18]. Nevertheless, digital elevation data that were calculated using the interferometry SAR technique could contain rich forest canopy height information [
19].
The Shuttle Radar Topographic Mission Digital Elevation Model (SRTM) is a fixed-baseline interferometry mission that was implemented in 2000. The 30 m digital elevation model (DEM) covers 80% of the Earth’s land surface with varying vertical height accuracies depending on several factors, such as topography and vegetation cover. The absorption and reflection effects of vegetation in steep areas may prevent the SRTM radar phase center from reaching the land surface [
20]. Some studies have found that the SRTM elevation is located somewhere between the actual ground surface and canopy top [
21,
22]. For vegetated mountain areas, the SRTM DEM values were found at 10 to 20 m above ground levels as derived with airborne Light Detection and Ranging (LiDAR) [
23]. Mean canopy height is an aggregation of trees in the overstory, and it can be estimated using the SRTM DEM [
24,
25,
26,
27].
Forest canopy height can be very accurately derived using LiDAR, a technology that emits laser pulses and measures the return time to directly capture the forest canopy vertical structure [
28]. Forest canopy height is the three-dimensional (3D) determinant of a forest’s AGB [
29]. Large-footprint LiDAR, such as the Geoscience laser Altimeter System (GLAS) sensor attached to the platform of ICESat, can generate a spatially explicit height and AGB information over a large area [
30,
31,
32]. On the other hand, small-footprint LiDAR on an airborne platform (such as a helicopter or fixed-wing aircraft) has been increasingly used to accurately estimate and quantify forest AGB [
33,
34,
35]. Combining texture variables from Landsat 8 with LiDAR variables could further improve AGB estimations in tropical forests [
36].
These studies deal with a static spatial representation of AGB, but repetitive measurements are needed to provide an understanding of AGB changes over time. To date, very few studies deal with estimations of forest biomass changes for determining the trajectory of carbon storages over time. Multitemporal LiDAR data have been used to examine AGB changes in temperate forests [
37,
38,
39,
40,
41], but such studies for tropical forests are rare. To our knowledge, only very few studies have examined AGB changes in tropical regions, which include a human-modified tropical lowland rainforest in the eastern Amazon in Brazil [
42] and a neotropical forest in French Guiana [
43]. Historical multi-temporal LiDAR data is rare because the technology is relatively new, and the technology is expensive to operate and collect data.
As remotely sensed digital elevation data, such as LiDAR and SRTM DEM, correlate well with forest canopy height, we took this opportunity to examine forest AGB changes using these datasets that are different in spatial resolution. Specifically, our objectives were to examine the correlation between the canopy height information in SRTM data and LiDAR canopy height model (CHM) for developing an SRTM-to-LiDAR canopy height calibration model and to determine the best spatial resolution for developing an AGB estimation model using field and LiDAR data that can be applied to the SRTM canopy height values. Using the developed model, we examined the AGB changes between 2000 and 2012 in the study area.
4. Discussion
This study investigated the use of LiDAR CHM and the canopy height information in SRTM data to estimate the AGB changes. Remotely sensed digital elevation data from different sensors, LiDAR and SRTM CHMs, correlate well with the mean canopy height of the forest [
23,
27]. In our study, we found a strong correlation between the LiDAR CHM mean and the mean tree height. LiDAR CHM mean has been widely used to estimate AGB in tropical forests [
36,
51,
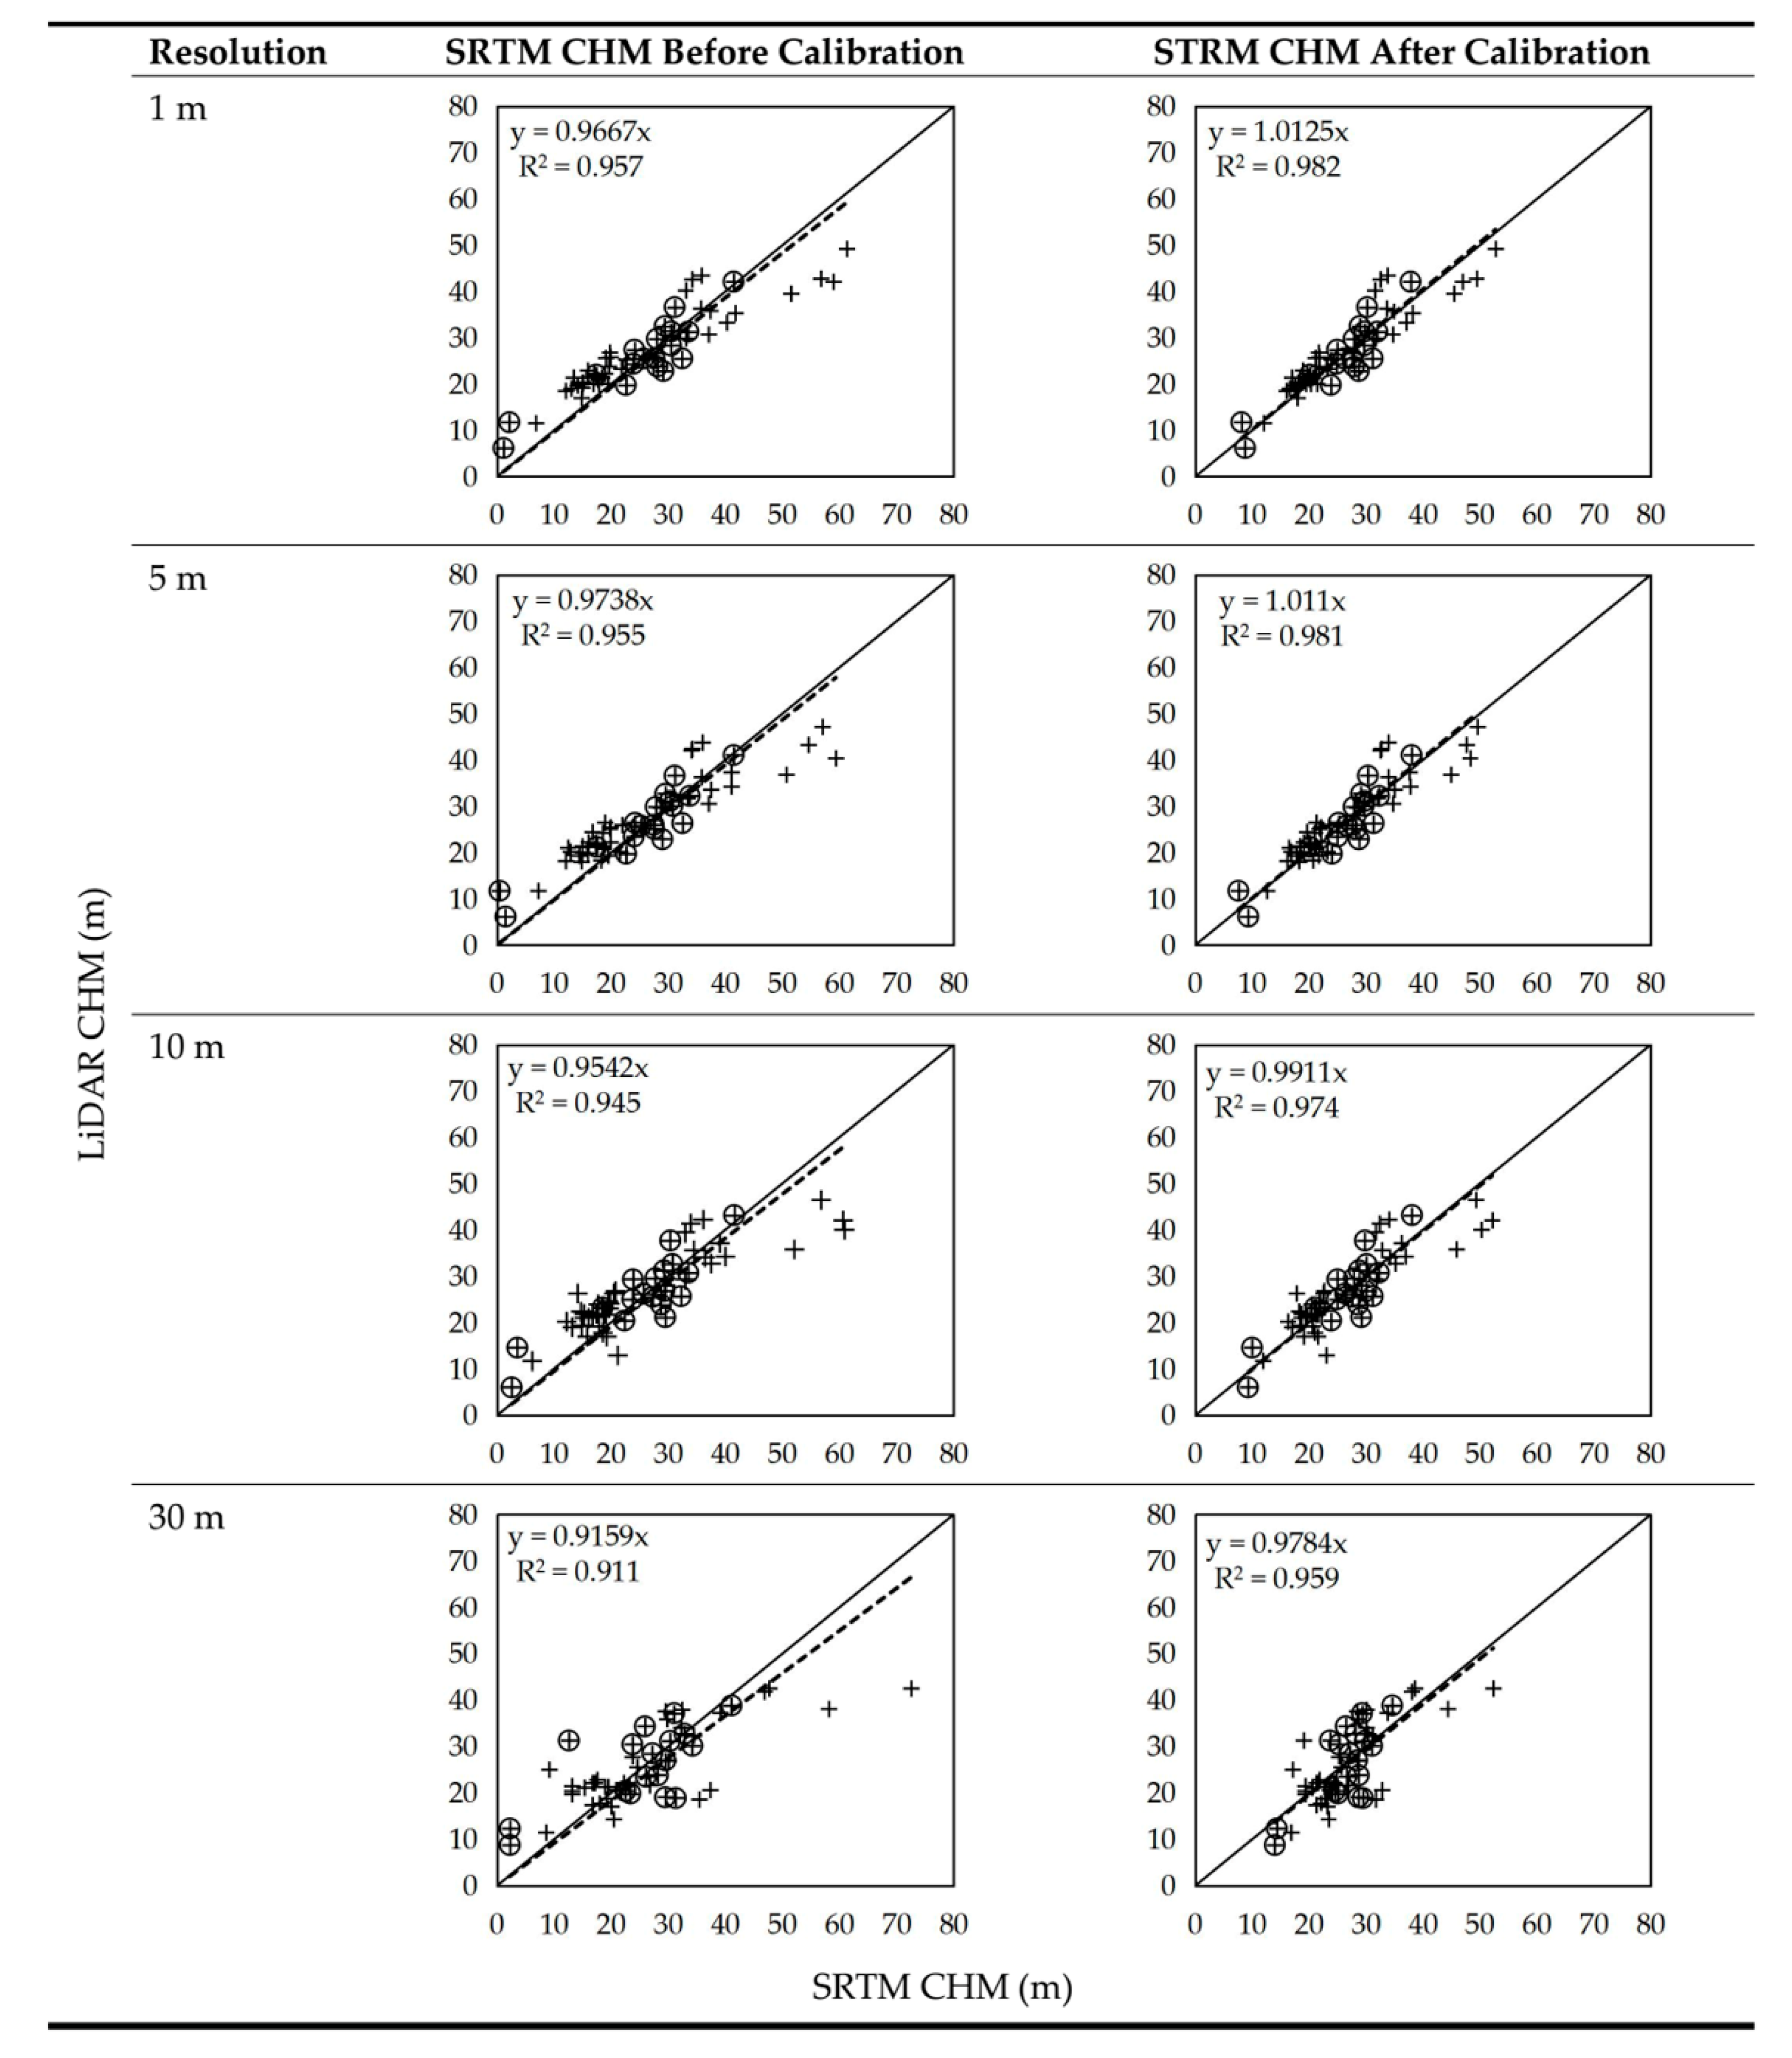
52]. This suggests that SRTM CHM can be calibrated using LiDAR CHM for AGB estimation if these CHMs are strongly correlated. In this study, the LiDAR CHM mean was strongly correlated with SRTM CHM except for 30 m resolution, thus allowing the calibration of SRTM CHM for spatial resolutions of 1, 5, and 10 m using the LiDAR CHM mean. While we found a high goodness-of-fit for the calibration models of the CHMs (R
2 = 0.740–0.843) in the tropical montane forest, past studies indicate that the regression fit might depend on forest type. Notable regression fits were reported for the CHMs in mangrove and boreal pine forests [
27,
53] but not for the CHMs in boreal hardwood forests [
53]. In this study, the calibrated SRTM CHMs showed an improved regression fit when plotted against the LiDAR CHMs (R
2 ≥ 0.959) compared to the uncalibrated ones and became well distributed along the x = y line (
Figure 3).
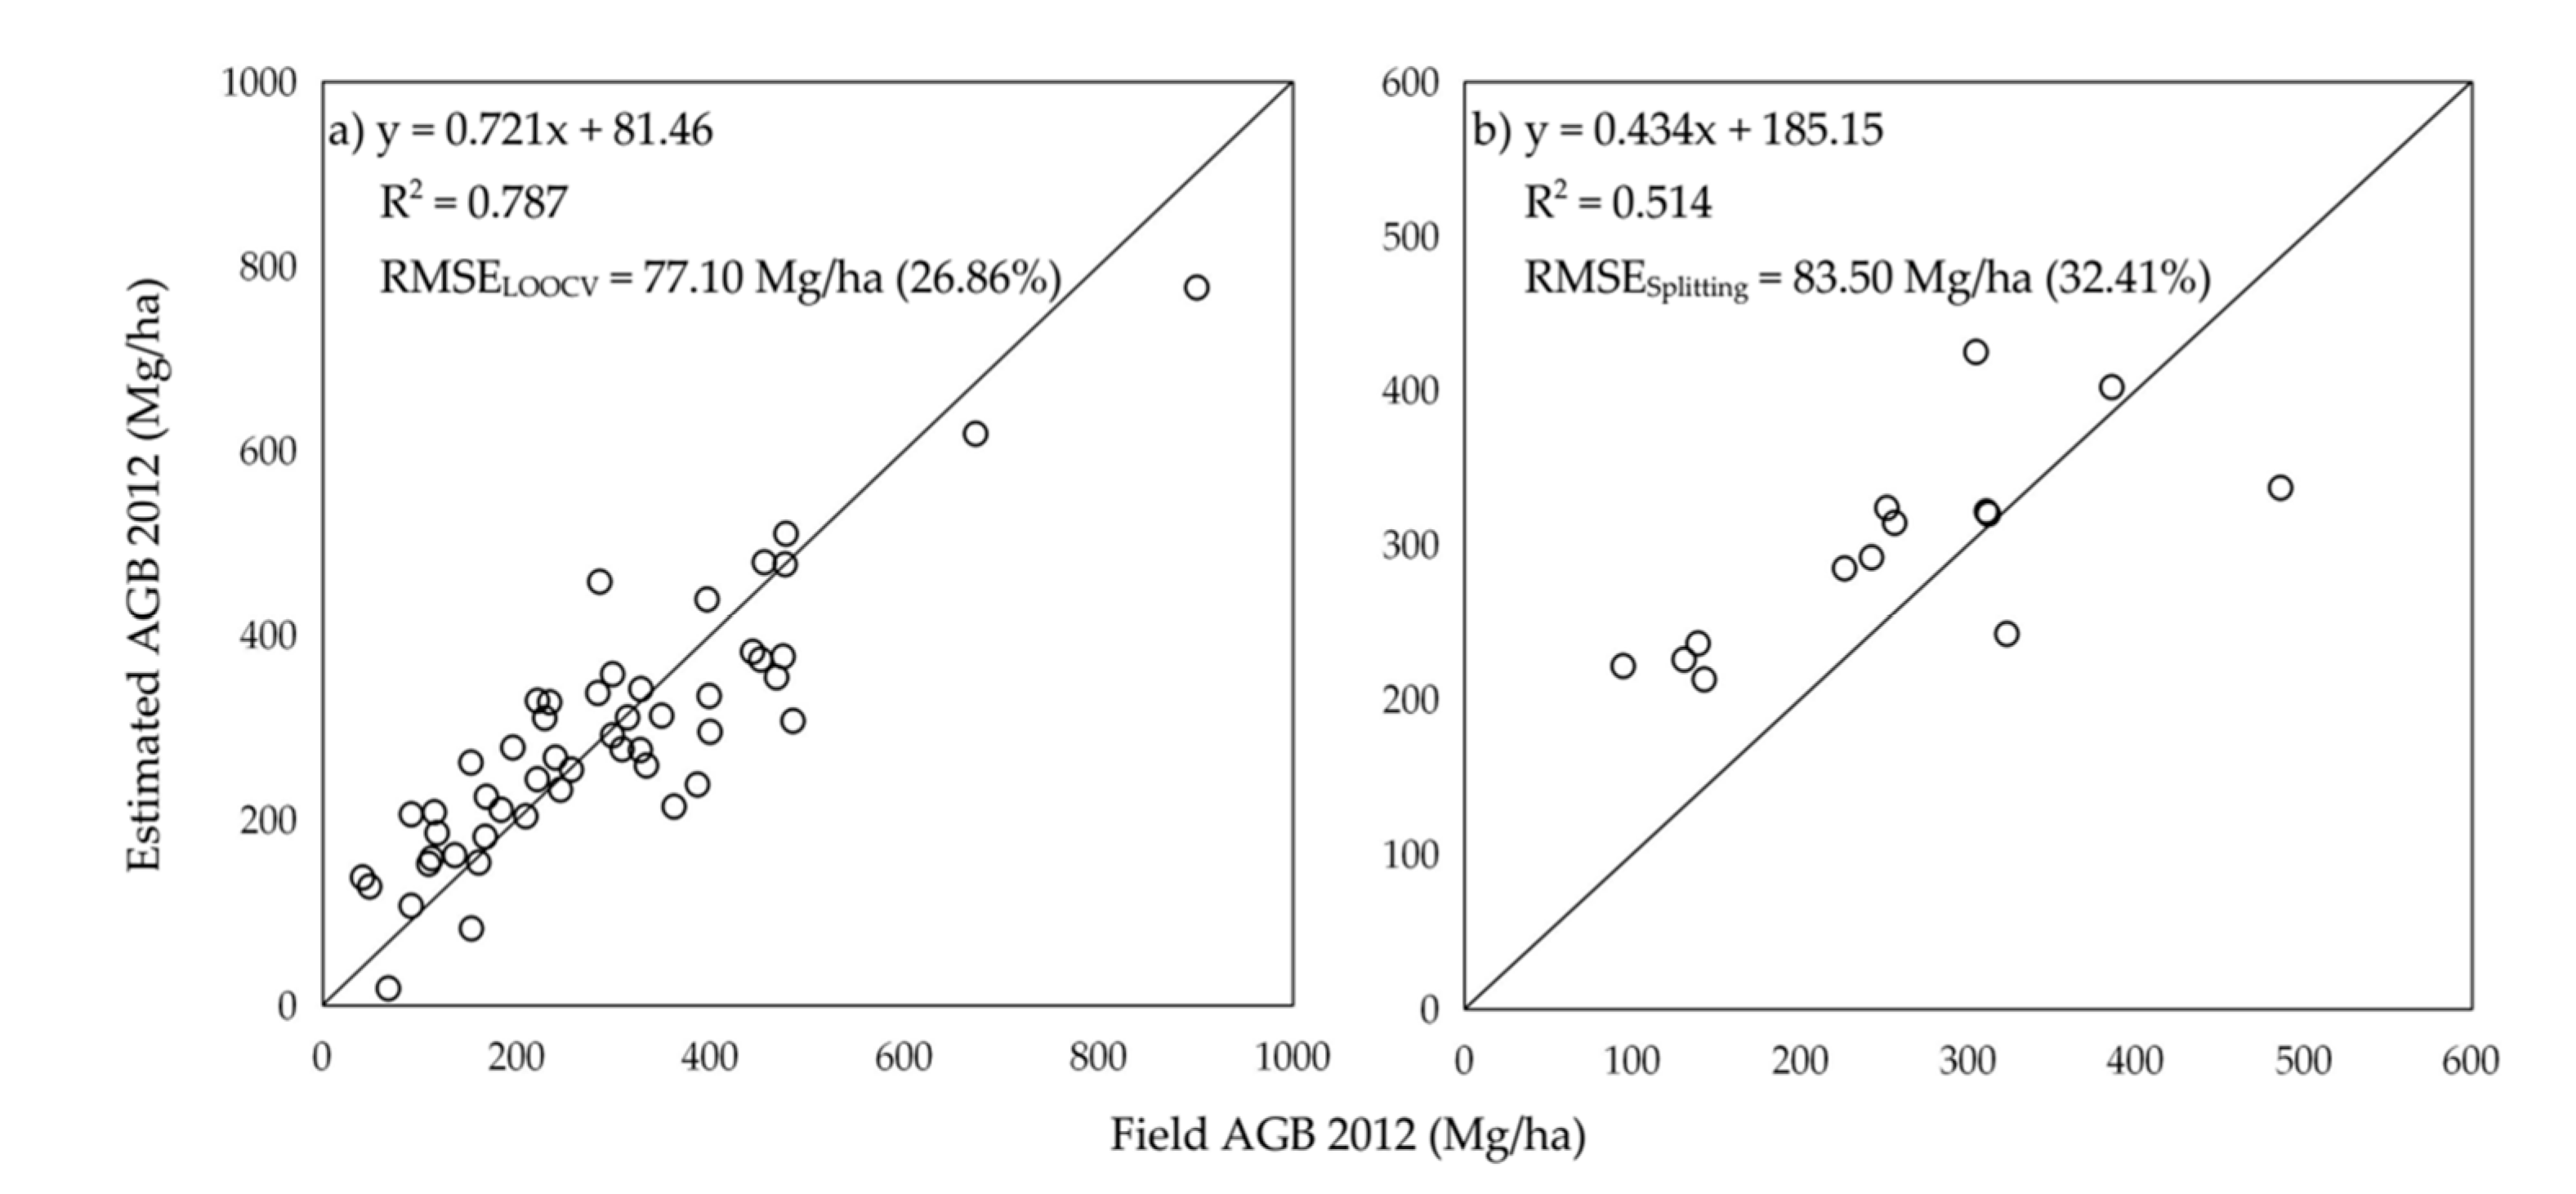
In the tropical montane forest, the LiDAR-CHM mean was examined as the estimator of field AGB for different spatial resolutions. The AGB estimation model using 1 m resolution LiDAR CHM had the best fit and explained the AGB variance better than other spatial resolutions in the regression analysis. The model EF decreased with decreasing the spatial resolution of the LiDAR CHM. When the LiDAR CHM resolution became coarser, the extracted information became more uncertain, thus leading to a decrease in spatial resolution. When the pixel size increased, the small forest canopy gaps could be overlooked, which could have led to an overestimation of the forest canopy height [
54]. The best model using LiDAR CHM mean at 1 m resolution had a relatively low estimation error (RMSE
LOOCV = 77.10 Mg/ha, corresponding to about 26.86% of the average AGB). By randomly repeating the sample partitioning, we found that the relative RMSE of the independent validation ranged between 25.89% and 34.54%, with an average of 29.84%. Overall, these RMSE values were in a similar range to the RMSE of a multivariate AGB estimation model described by Ioki et al. (2014).
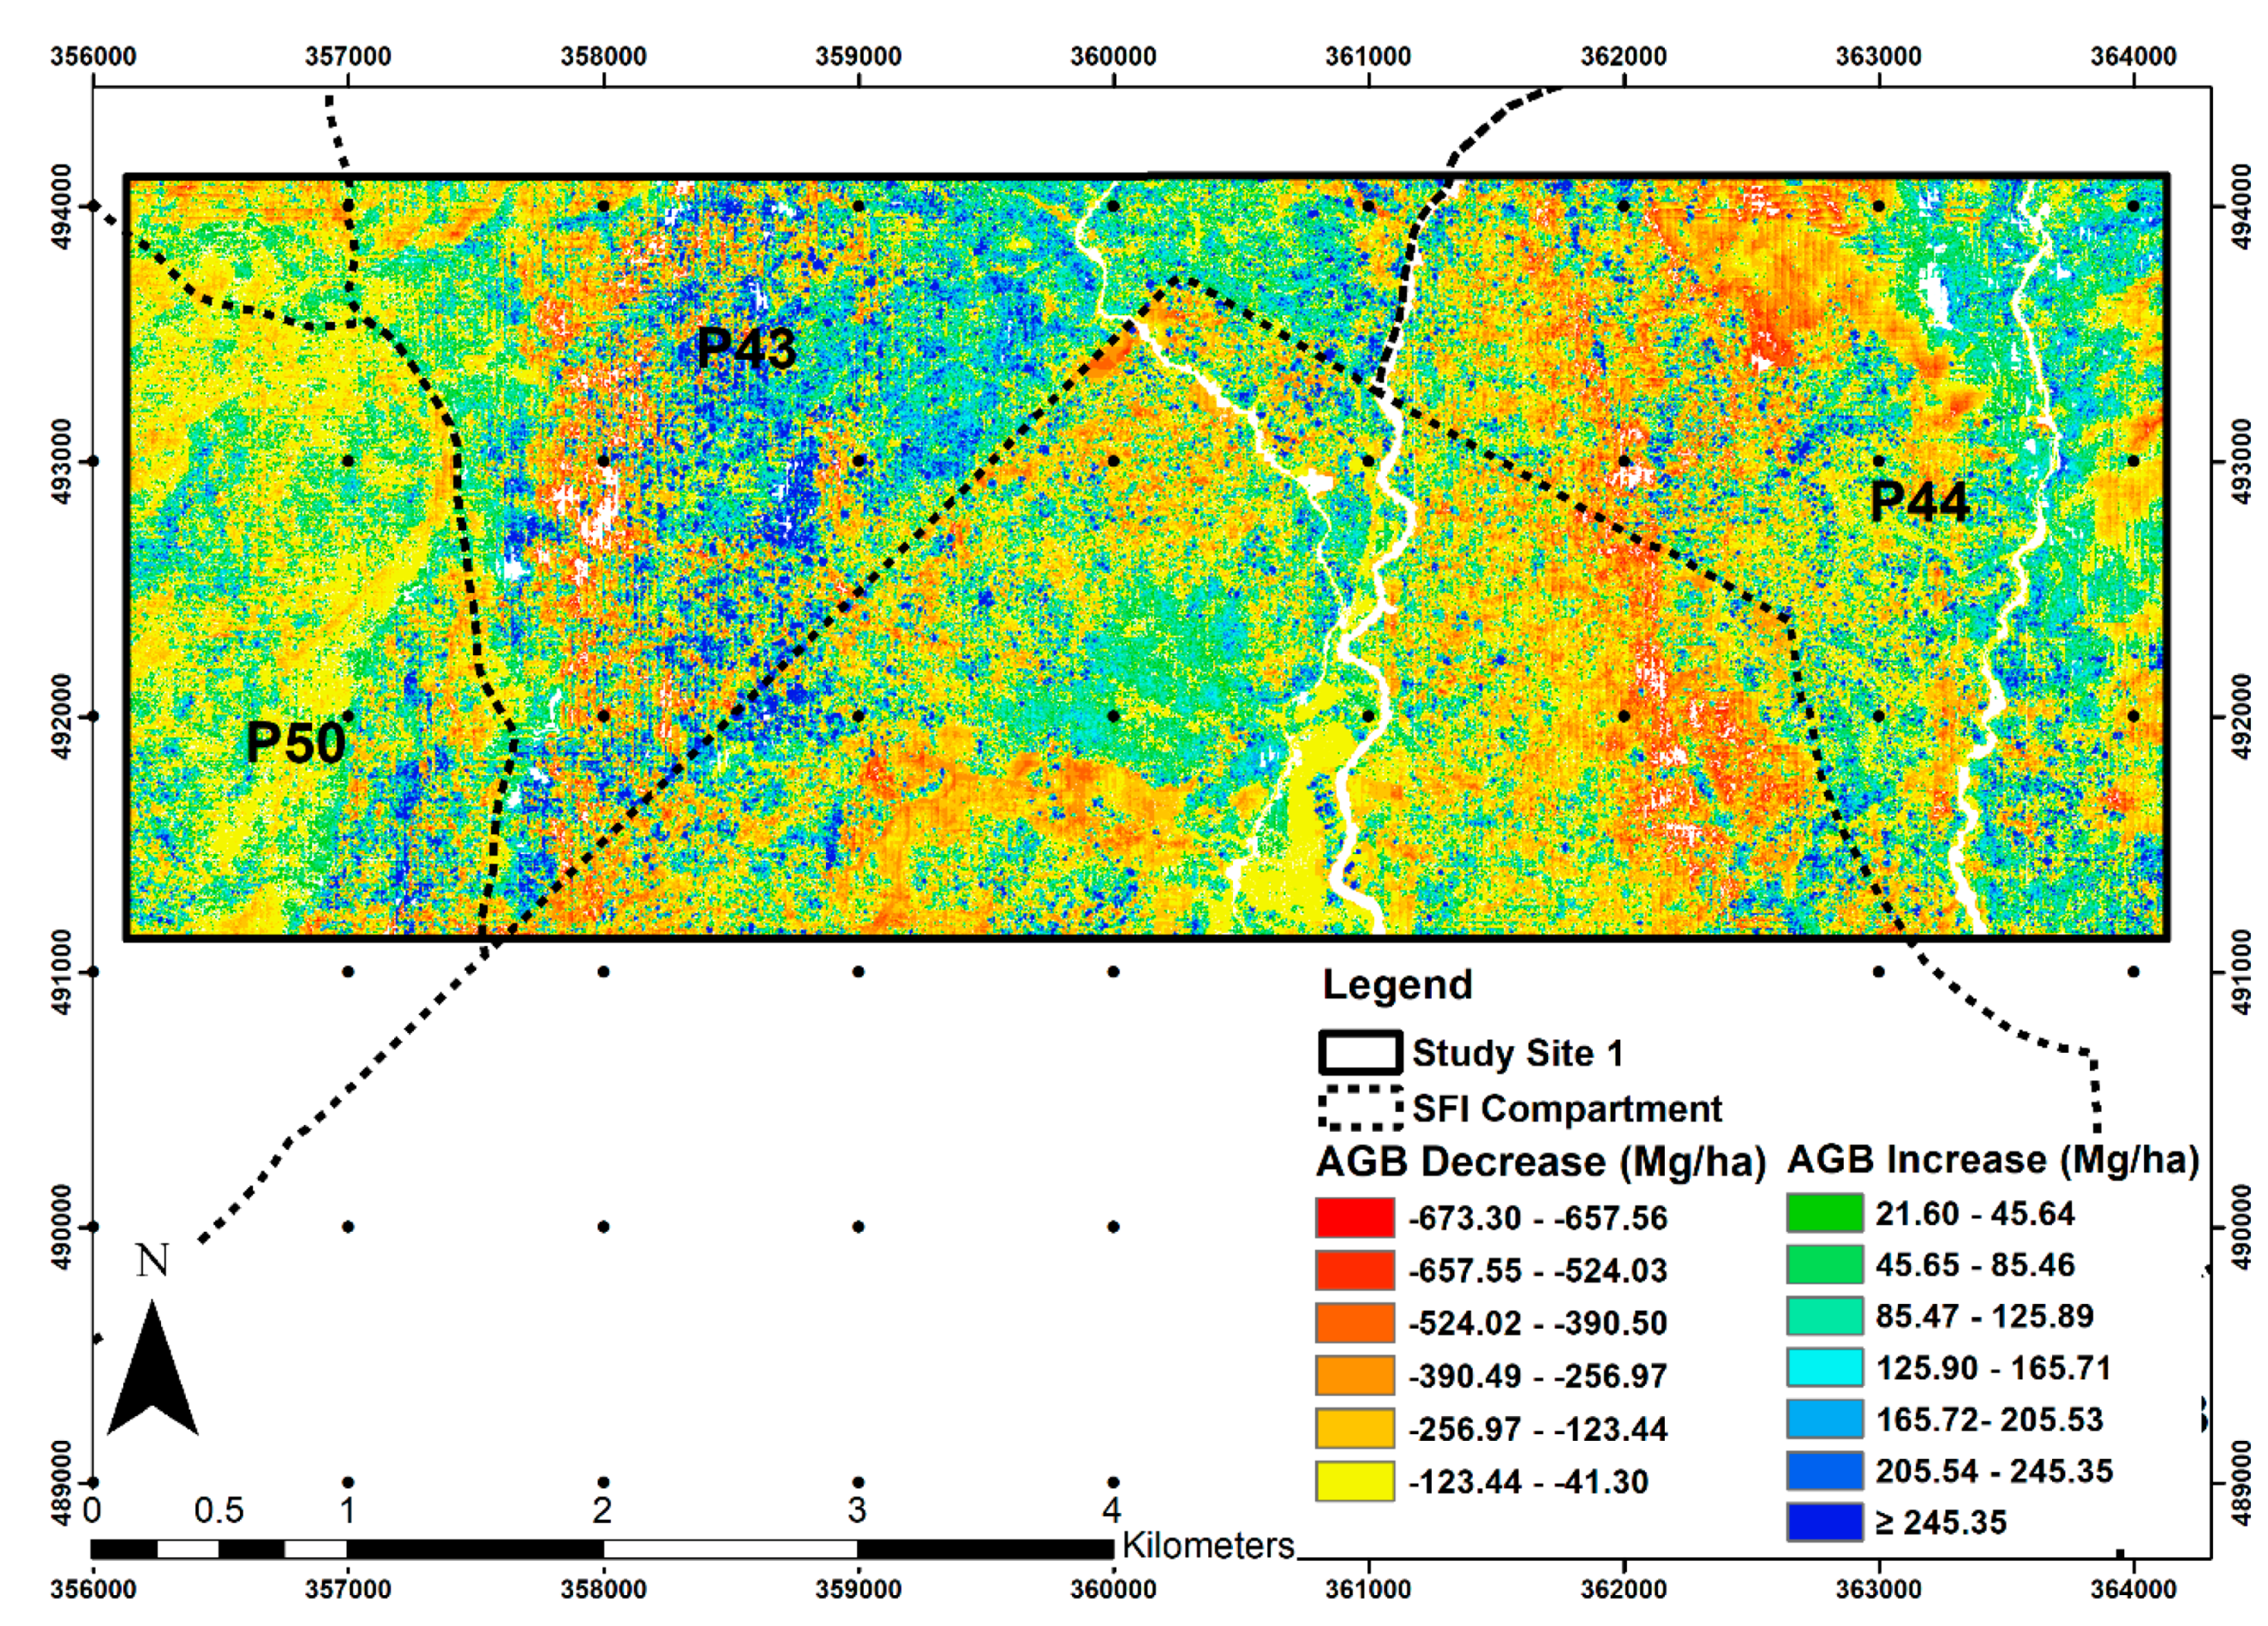
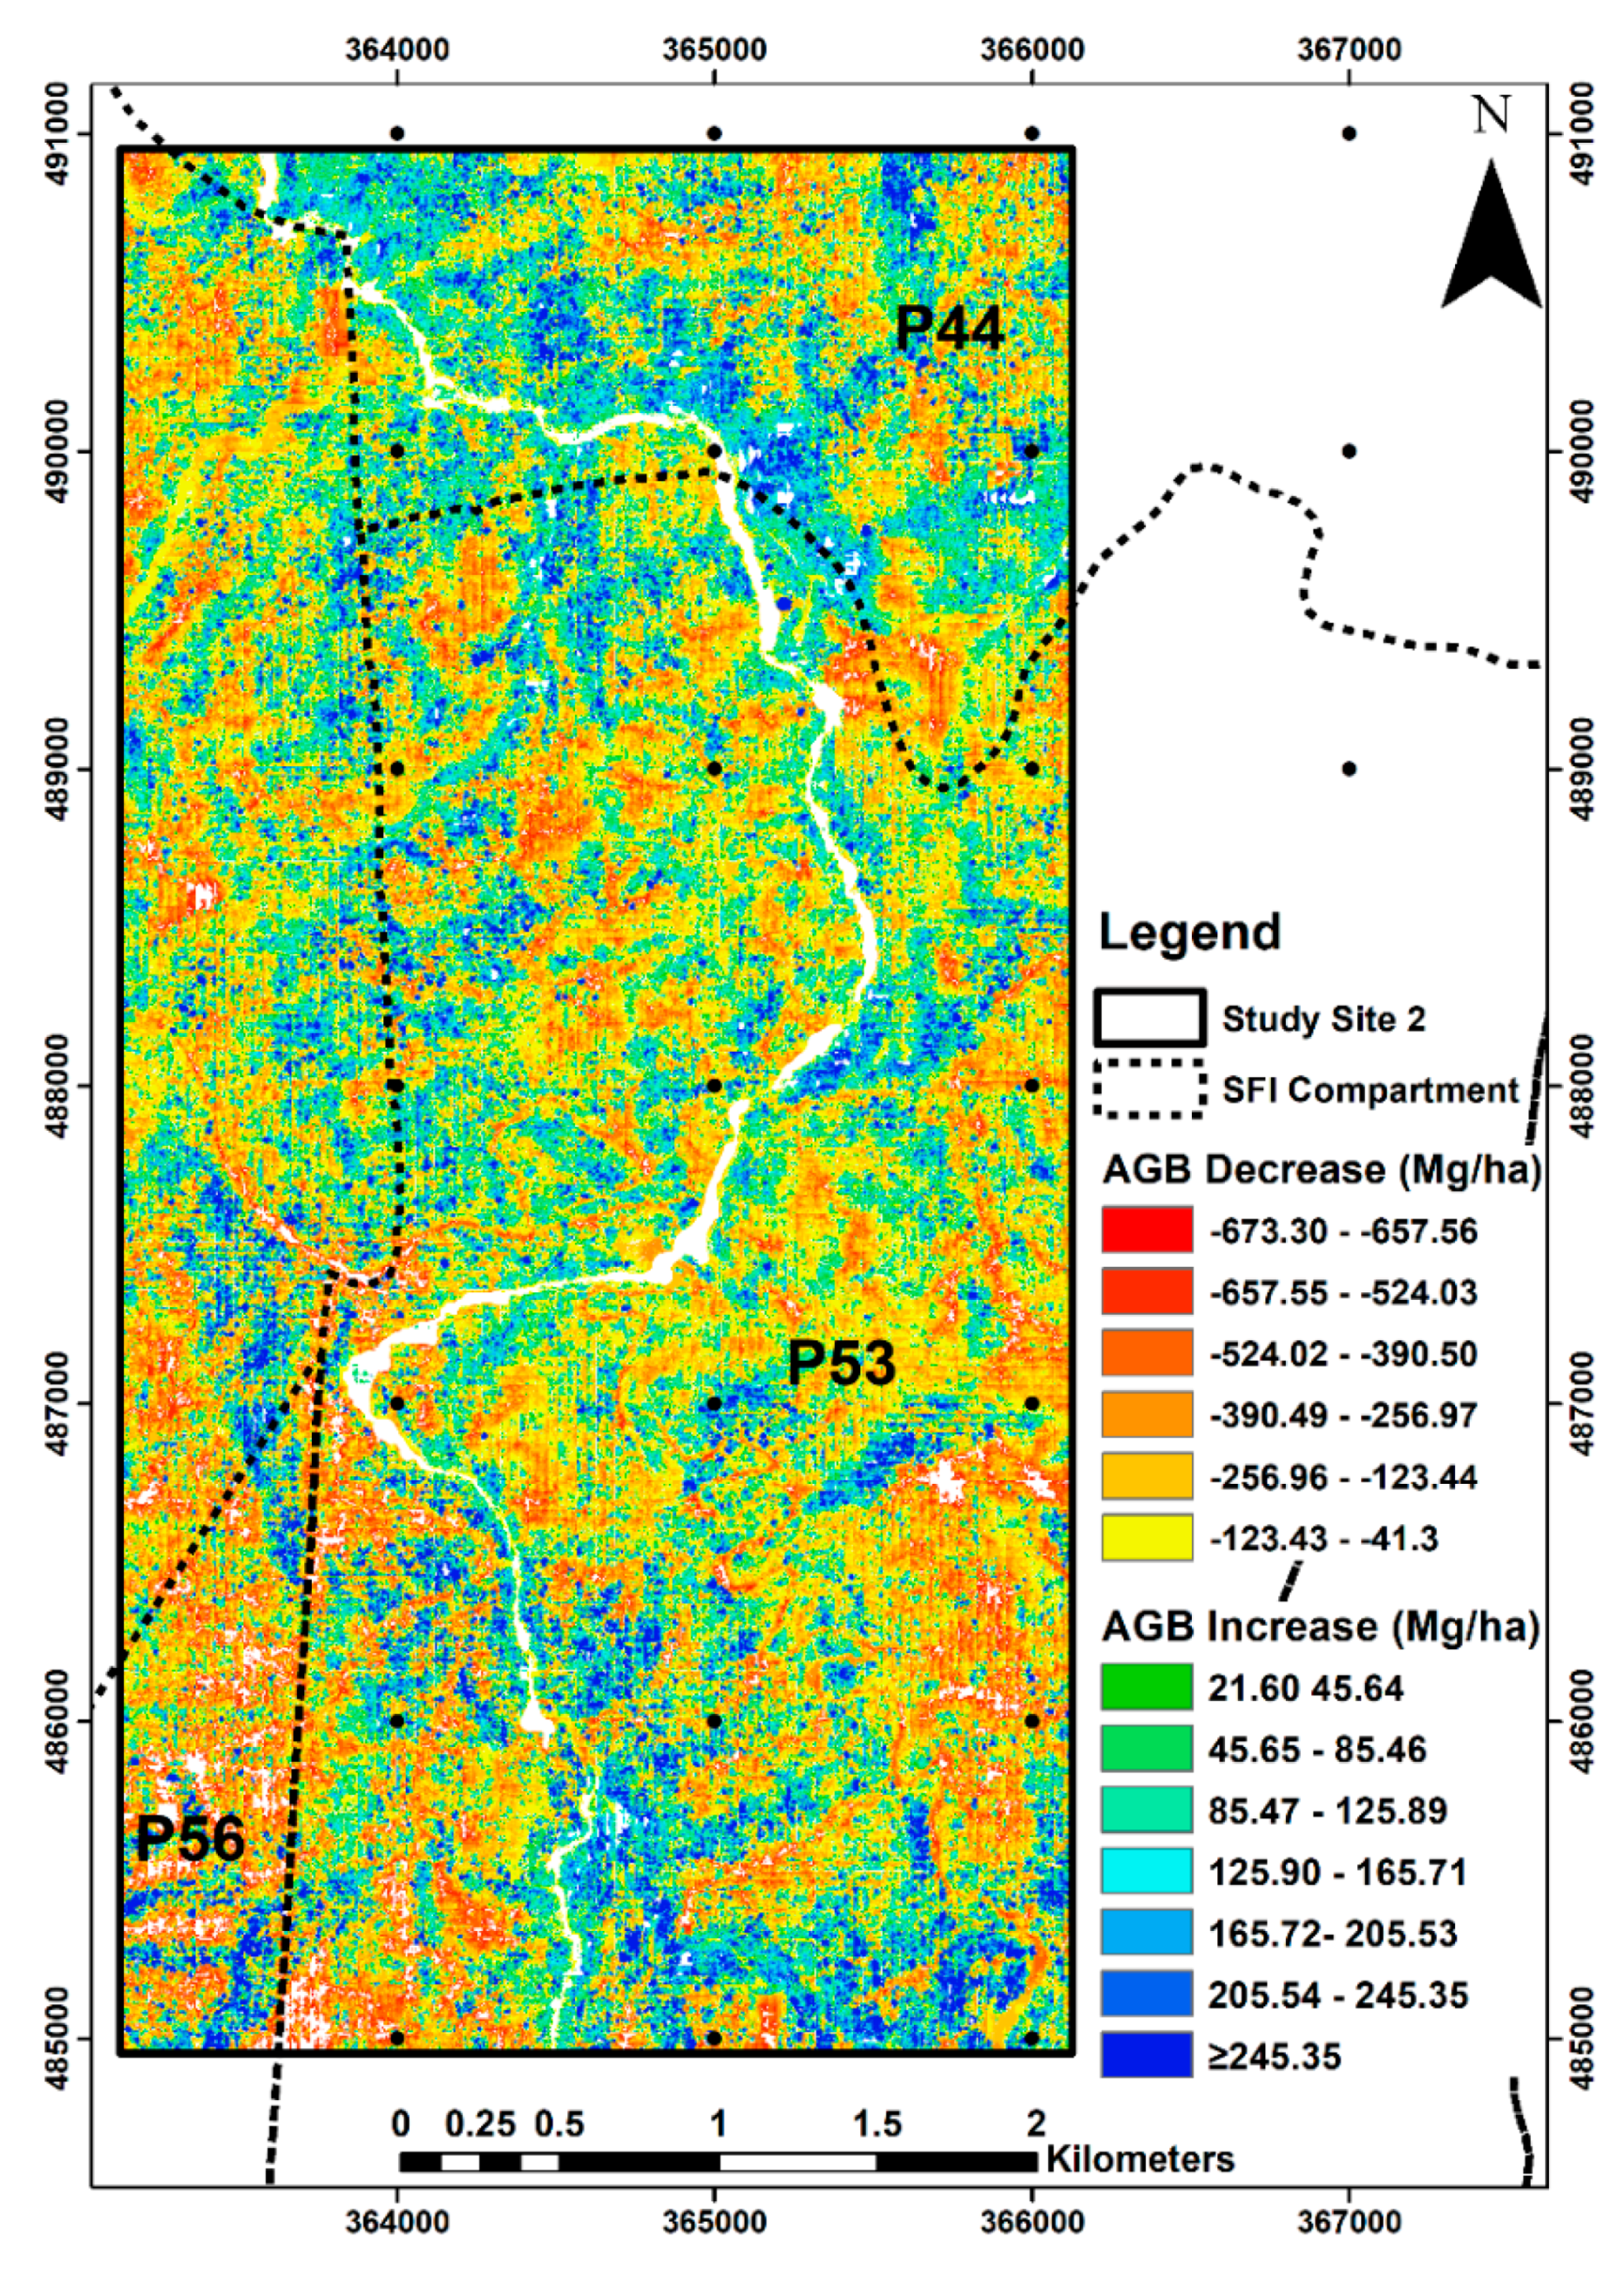
The time series AGB estimates allowed us to examine the pattern and driver of AGB changes in the study area. Most mountain communities in Sabah depend on slash-and-burn cultivation for their livelihoods, and this transforms the vegetation into a secondary forest landscape [
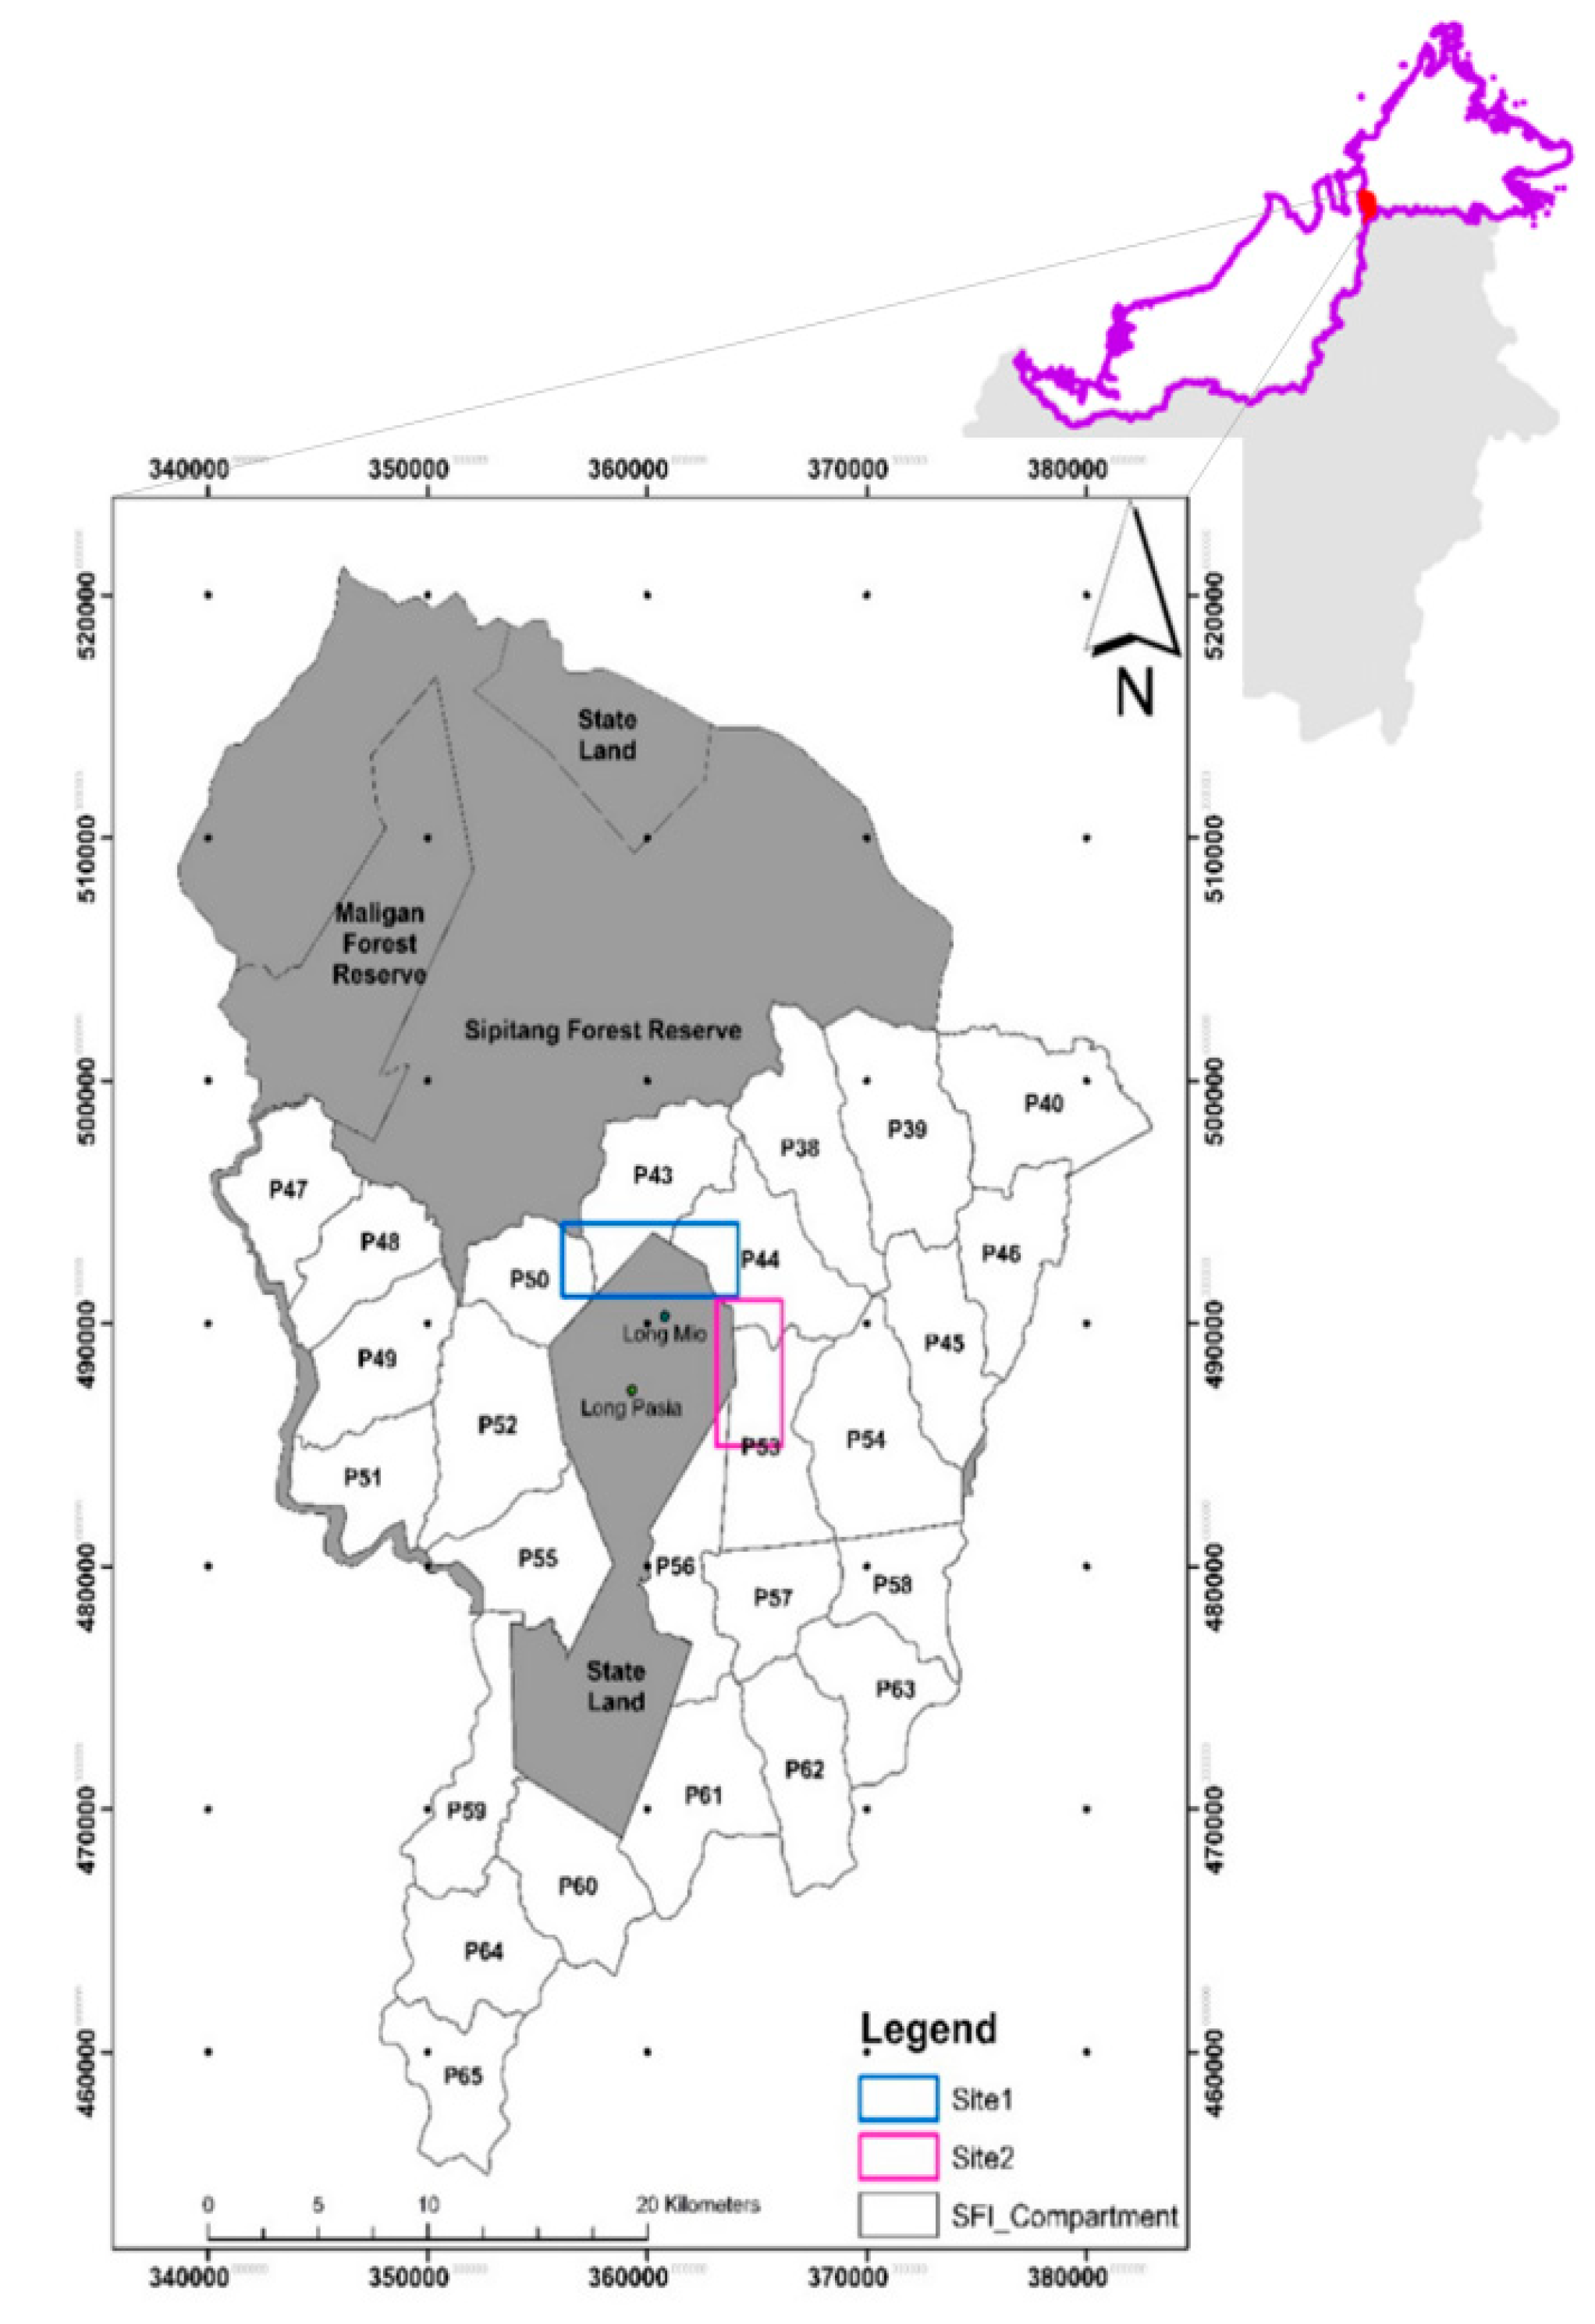
55]. Nevertheless, AGB removal by the local villagers is likely to be small-scale and limited to the immediately accessible areas. The main driver of AGB removal identified in this study was timber harvesting in the managed forests. The mean AGB decrease was 158.97 up to 673.30 Mg/ha, suggesting that timber extraction occurred in both logged-over and primary forests. The SFI confirmed that all compartments except compartment P50 at sites 1 and 2 were commercially logged. These logging activities started in 1997 and continued until the early 2000s when the state’s forestry policy changed from conventional logging to sustainable forest management [
56].
Overall, there was a significant gain of AGB in the previously disturbed areas as a result of natural regeneration, especially in the managed forests. In a regenerating forest, small trees with DBH less than 10 cm can store up to 50% of the total AGB [
57]. The mean AGB accumulation rate estimated in this study was 10.44 Mg/ha/yr over the 12 years. Our estimates match those reported elsewhere in the tropics. In a secondary tropical montane forest in southern Ecuador, the annual rate of AGB increase was estimated at 10 Mg/ha/yr [
58]. In the montane forest of Mount Kinabalu, Sabah, the mean annual rates of aboveground net primary productivity range widely from 1.60 to 9.44 Mg C/ha/yr with a mean of 4.30 Mg C/ha/yr [
59].
Figure 5 and
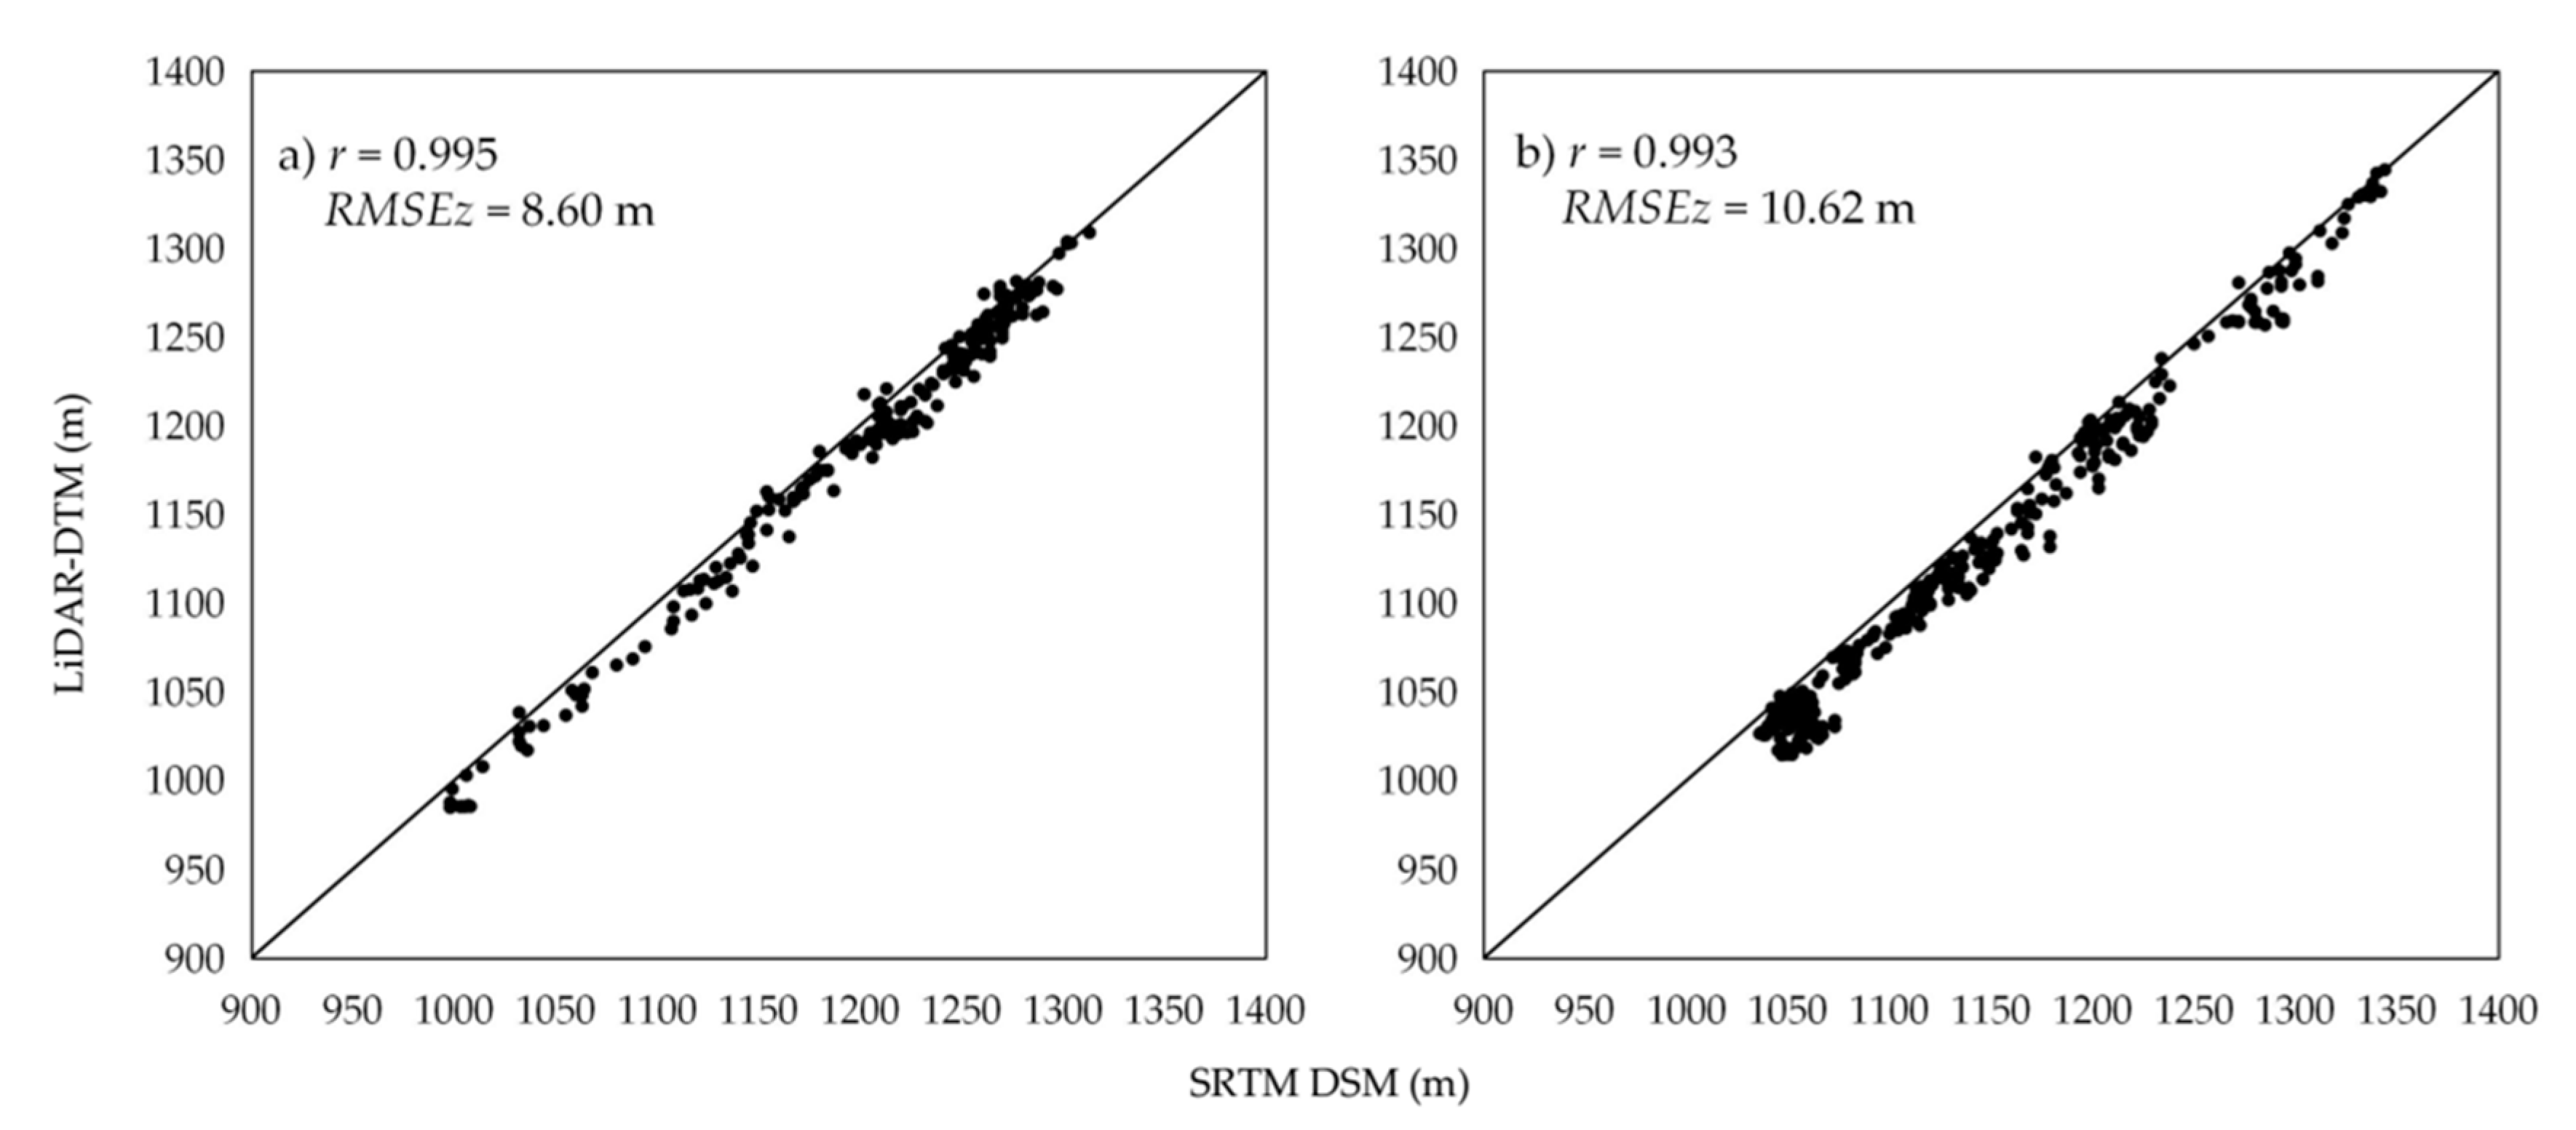
Figure 6 showed that some areas had AGB increases of more than three standard deviations (>20.4 Mg/ha/yr), which were likely to be overestimated. As LiDAR is currently the most accurate remote sensing method for estimating AGB, the overestimation was probably due to underestimation of the AGB 2000 values, especially in rugged terrain areas, because the accuracy of SRTM DSM of steep-sloped areas can be significantly affected by slope and aspect characteristics in relation to the incidence angle [
60].


 ,
, 


