1. Introduction
Image registration is a traditional computer vision problem for applications in various domains ranging from military, medical, surveillance, robotics, as well as remote sensing [
1]. With advances in robotics, cameras can be effortlessly mounted on a UAV to capture the ground images from a top view. A UAV is often operated in a lawn-mower scanning pattern to capture a region of interests (ROI). These captured ROI images are then stitched together to provide an overview representation of the entire region. Drones are relatively low-cost and can be operated in remote areas.
The process of image stitching is useful in a number of tasks, such as disaster prevention, environment change detection, road surveillance, land monitoring, and land measurement. The task of image matching can be divided into two sub-tasks: feature detection and feature description. Researchers have extensively used advanced handcraft feature descriptor algorithms, such as SIFT [
2,
3], SURF [
4,
5], and ORB [
6]. In the task of feature detection, the distinctive and repetitive features are first detected and input into a non-ambiguous matching algorithm [
7,
8]. These features are further summarized by region descriptor algorithms such as SIFT, SURF, or ORB. These handcrafted descriptors work by summarizing the histogram of gradient in the region surrounding the feature. SIFT is the pioneer in the work of descriptor handcrafting that is robust to scale and orientation changes. SURF and ORB are approximate and fast versions of SIFT. Features are then matched based on several measures such as brute force matching and Flann-based matching, which is based on the nearest descriptor distance and the matches that satisfy a ratio test as suggested by Lowe et al. [
2]. As the raw matches based on these measures often contain outliers, the Random Sample Consensus (RANSAC) [
9] is often adopted to perform a match consistency check to filter the outliers. The drone image motion is generally caused by the movement of the camera. Hence, the camera motion can be modeled as a global motion in which every pixel in the image shares a single motion. The global motion is generally modeled as a transformation matrix, which can be estimated by as few as four matching pairs.
Recent advances in deep learning and convolutional neural networks have been applied in various fields such as natural language processing and subsequently in computer vision, especially in the tasks of object detection and object classification [
10,
11]. The concept of the convolutional neural network was first introduced in LeNet [
12]. AlexNet [
13] made it well-known after winning the 2012 ImageNet Large-Scale Visual Recognition Challenge (ILSVRC) [
14]. Various studies have shown that training a deep network on a large dataset can lead to a better testing accuracy [
13,
14,
15,
16]. The advances in the hardware such as the graphics processing unit (GPU) made it possible to process larger data in a shorter time. Recent deep learning methods specifically YOLOv3 [
17] have shown consistent good results for object detection and classification.
The most straightforward idea for enhancing the computational time of the drone image registration is the use of high-performance computing (HPC) approach. This study introduces a novel method to integrate the GPU-based deep learning algorithm into traditional image matching methods. The use of a GPU is a significant recent advance for making the training stage of deep network methods more practical [
18,
19,
20,
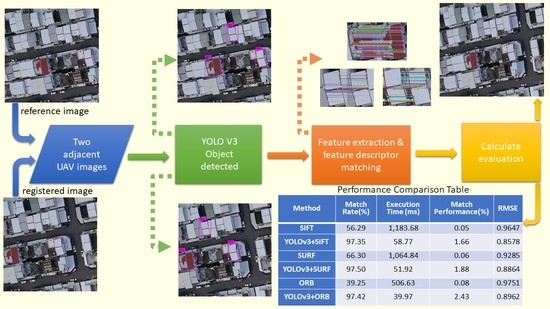
21]. The proposed method generates robust candidate regions by adopting YOLOv3 [
17] and performs the traditional image matching only on the candidate regions. Similar to Fast R-CNN [
22,
23], the use of candidate regions are applied for the image matching tasks instead of image classification.
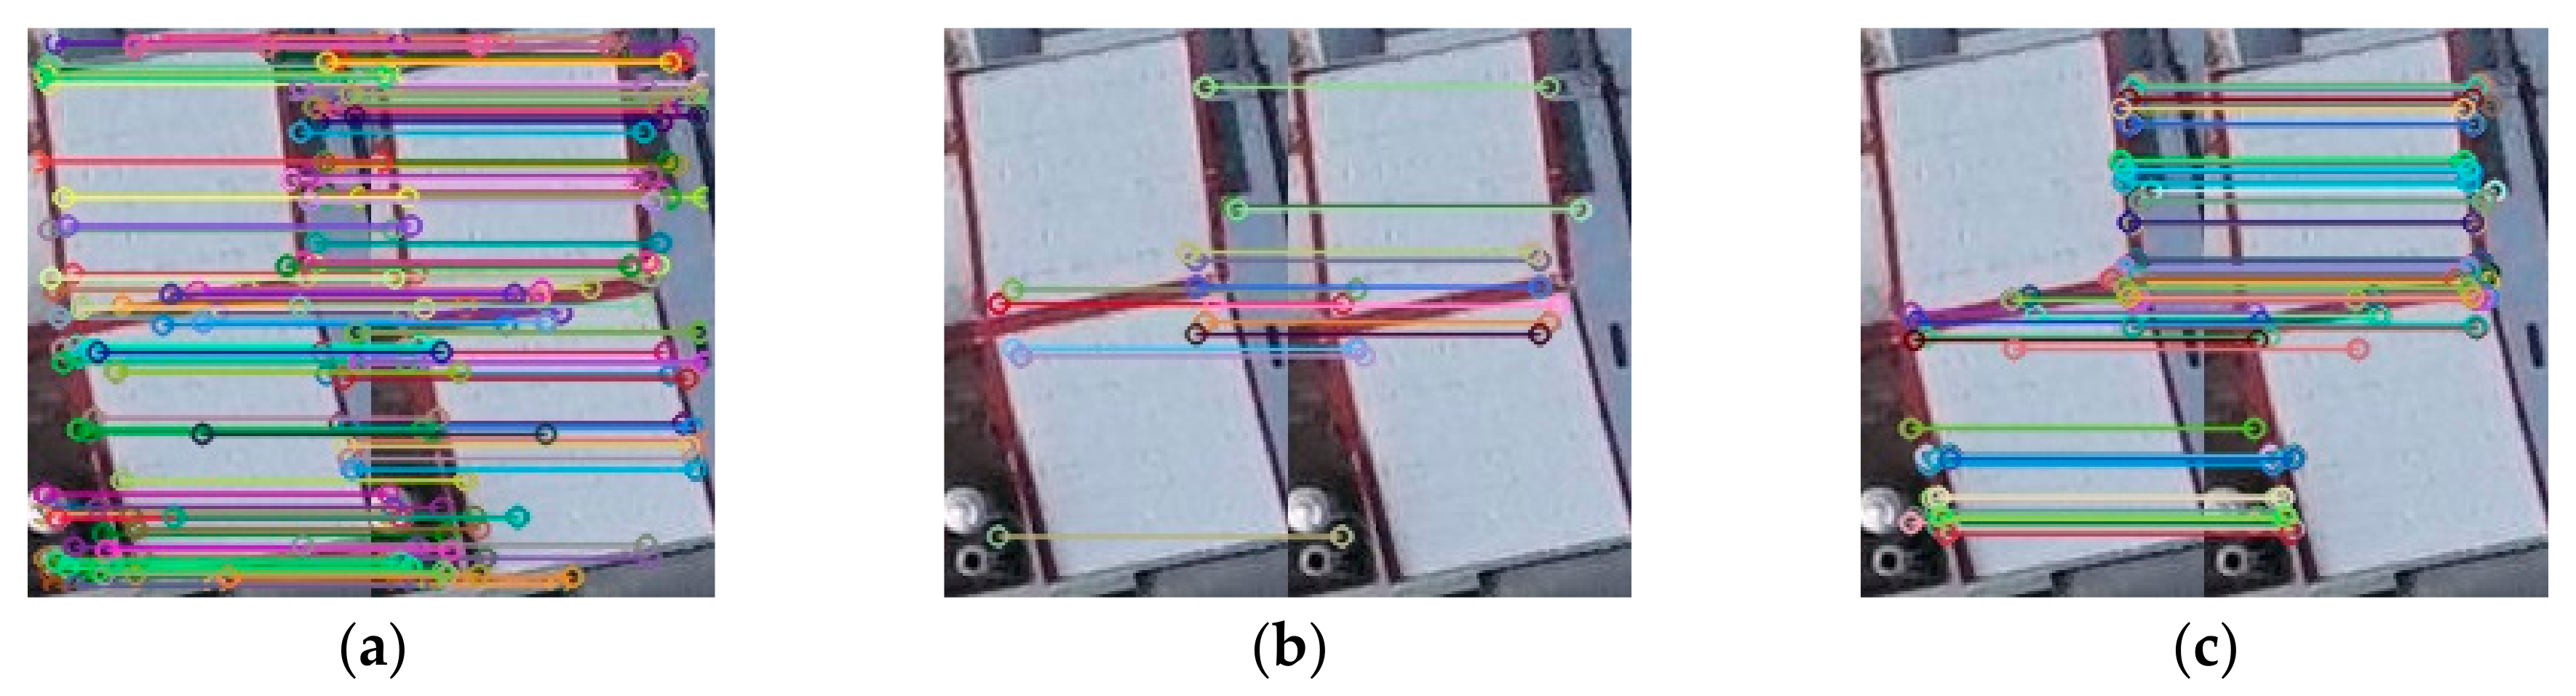
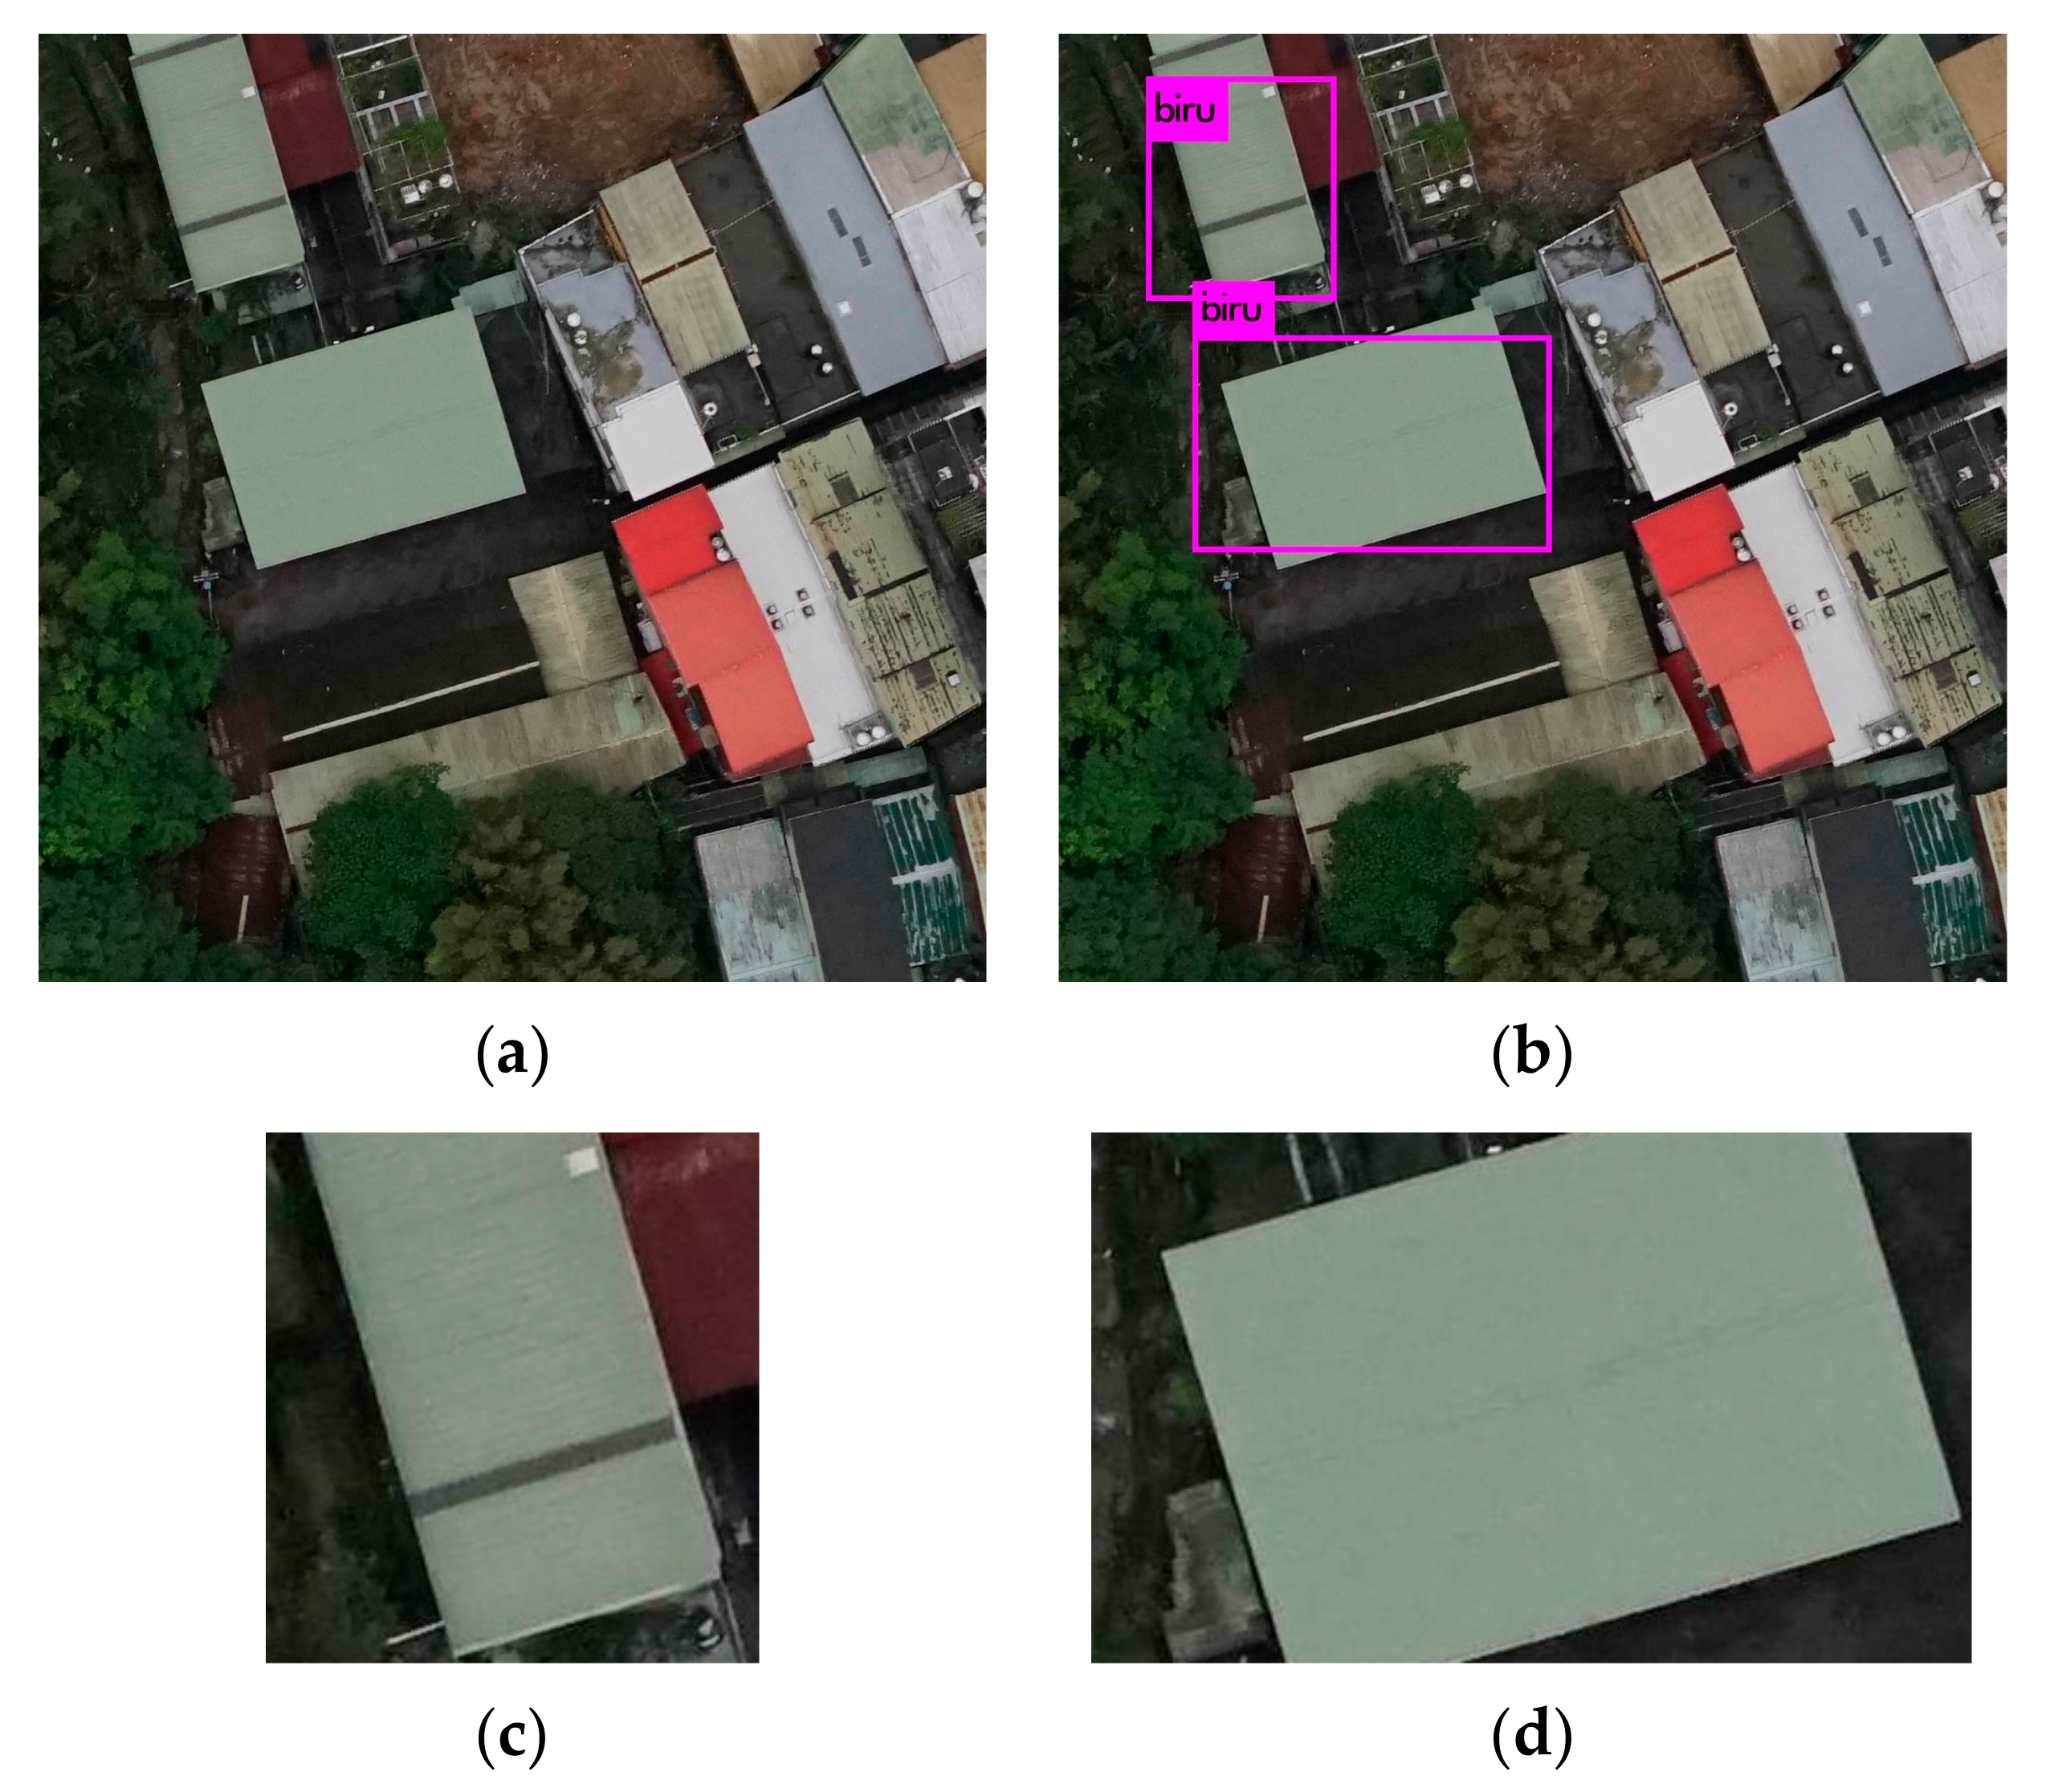
Structural similarity (SSIM) is then adopted to determine the similarity of the candidates’ regions. The mismatched regions are then filtered and the overlaps are matched to confirm the corresponding relationship of the overlapping regions on two adjacent images. The traditional feature extraction algorithm is then run to extract features from the matched regions and match the features. The search region is thus limited to very small area of the image, reducing the matching error. In the urban, the roof is an important information infrastructure [
20]. Therefore, it led to a significant reduction in the computational requirements as the image matching is only performed on the candidate roof regions which is well suited for real-time image registration applications. In this paper, it is shown that our proposed method has achieved 13× faster than the traditional methods of SIFT, SURF, and ORB.
3. Proposed Method
This study presents a novel method to generate a few plausible candidate regions using YOLOv3 [
17] object detection for two subsequent drone images on NVIDIA TITAN Xp. The proposed method performs traditional image matching procedures, such as feature extraction and description methods, only in the candidate roof region, thus significantly reducing complexity compared to conventional methods (such as SIFT [
2], SURF [
4], and ORB [
6]).
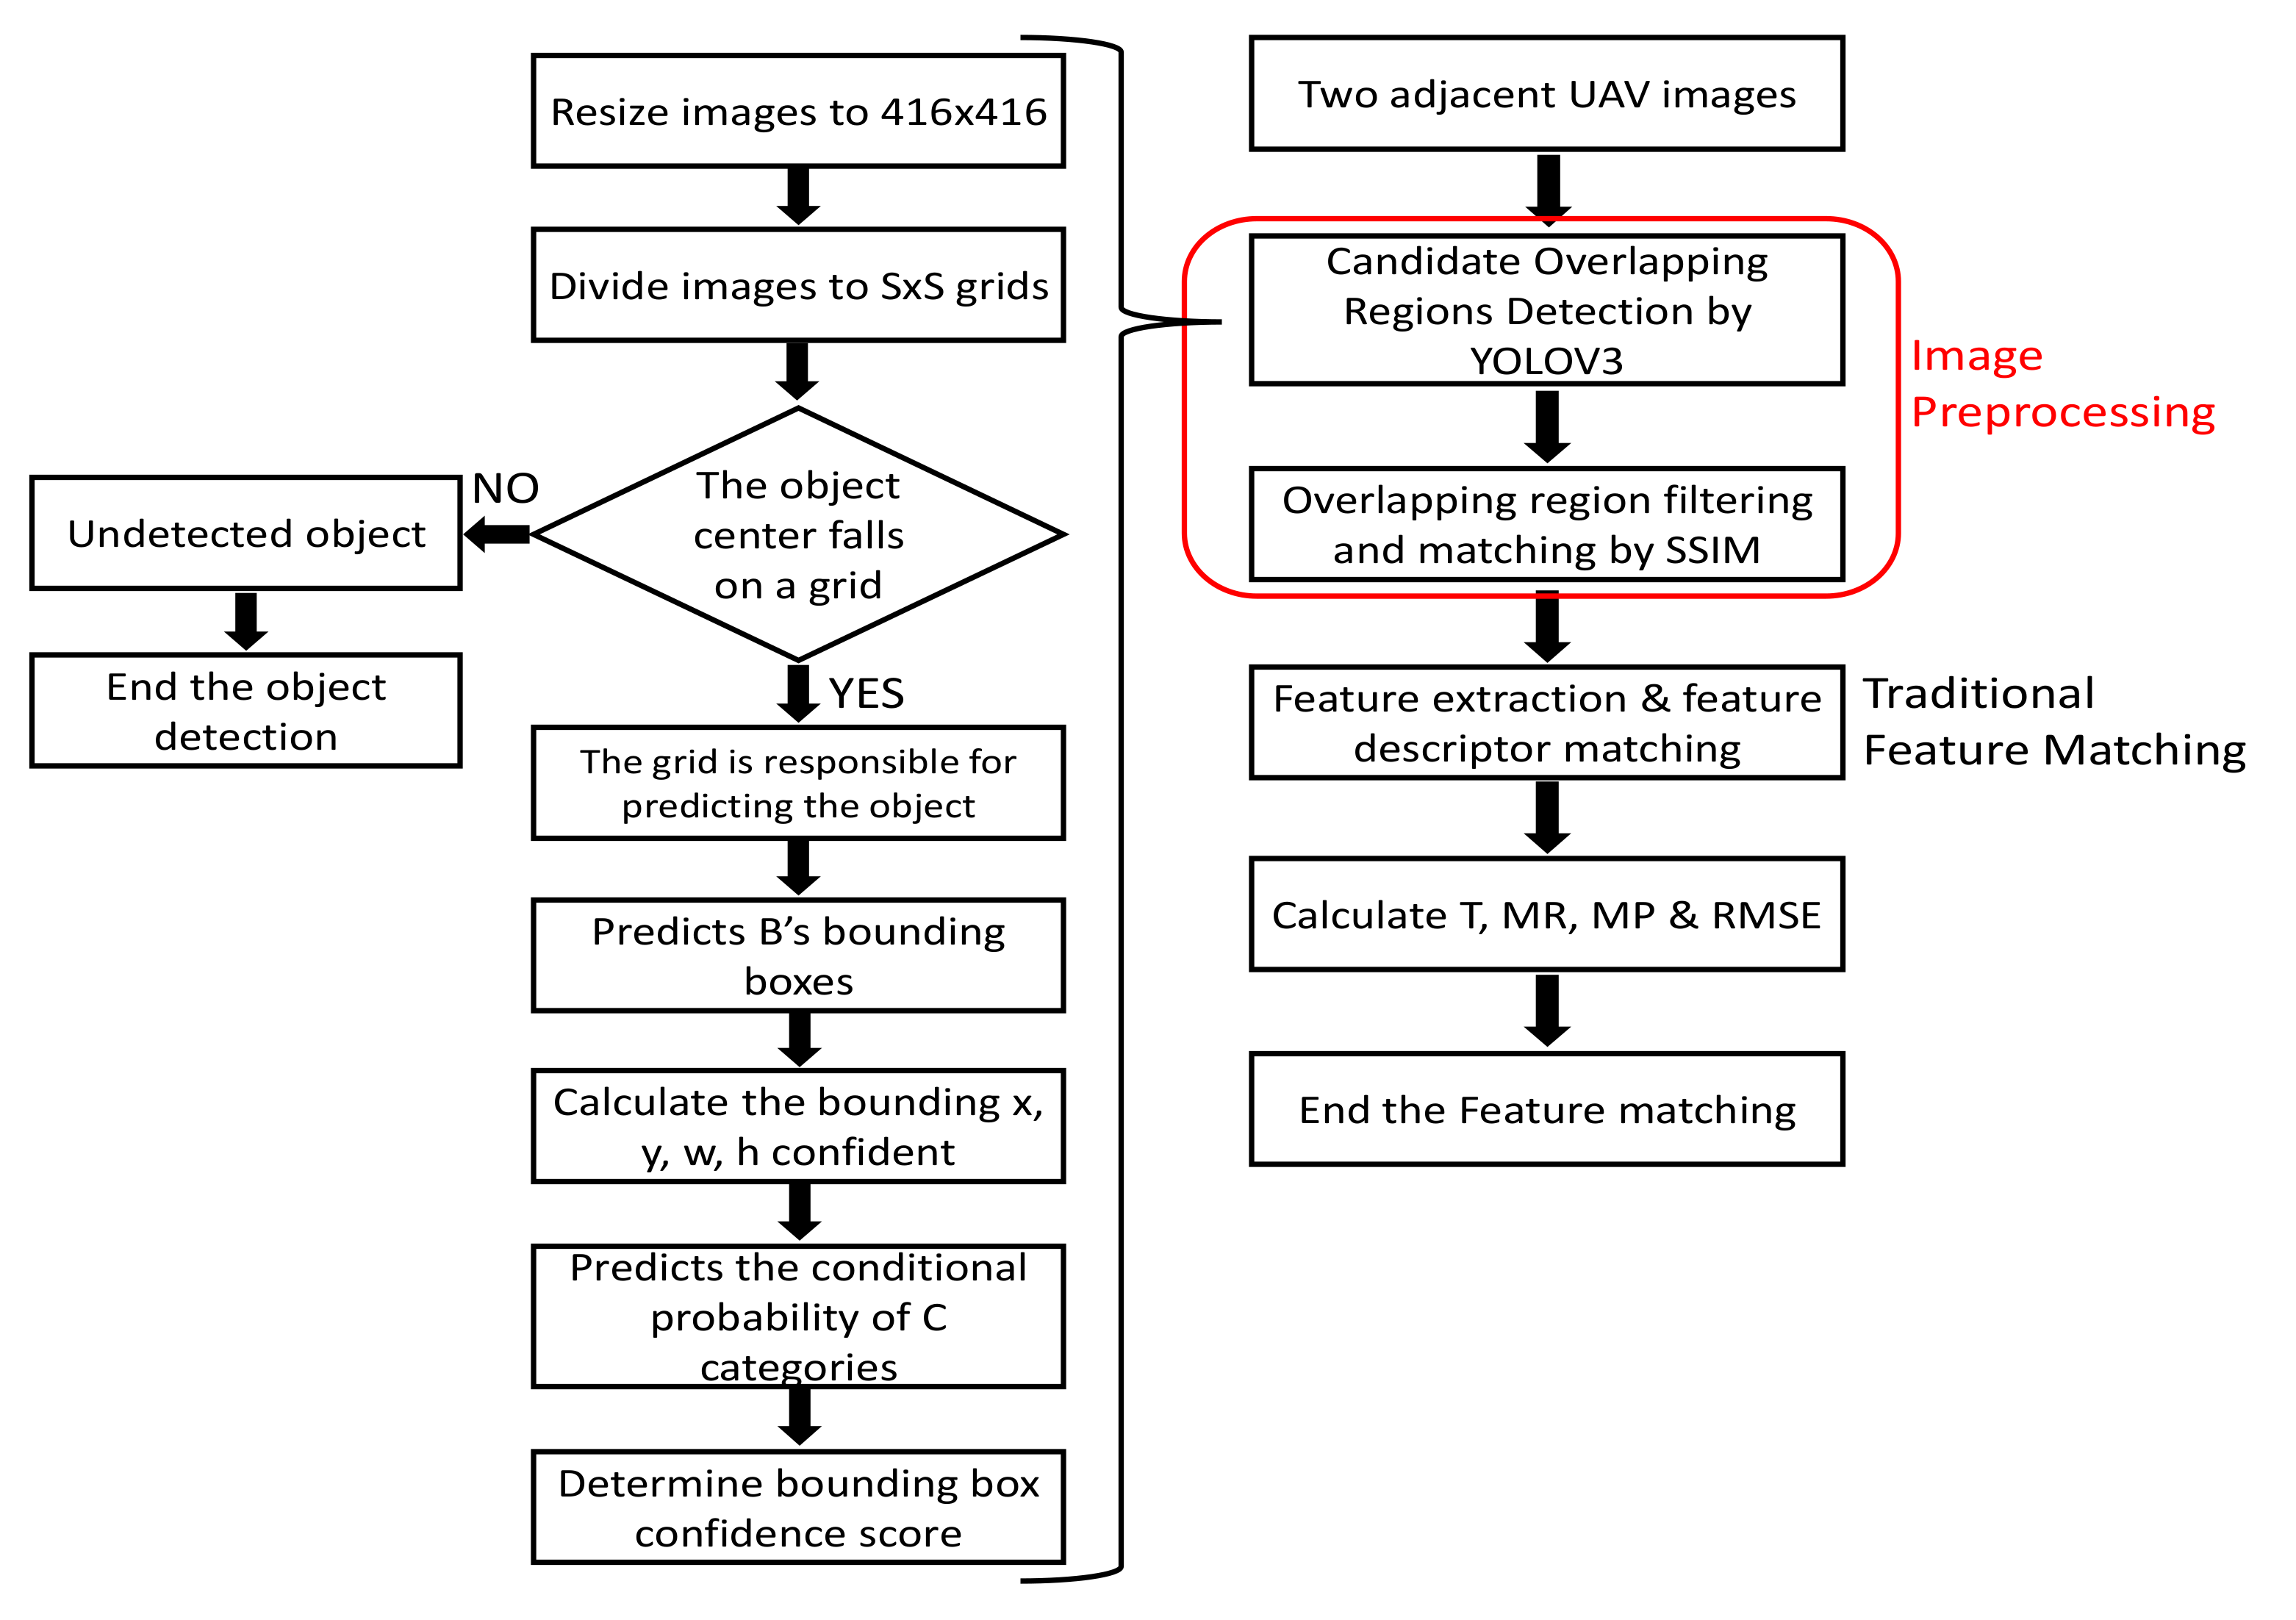
Figure 2 shows the complete flow chart of the algorithm.
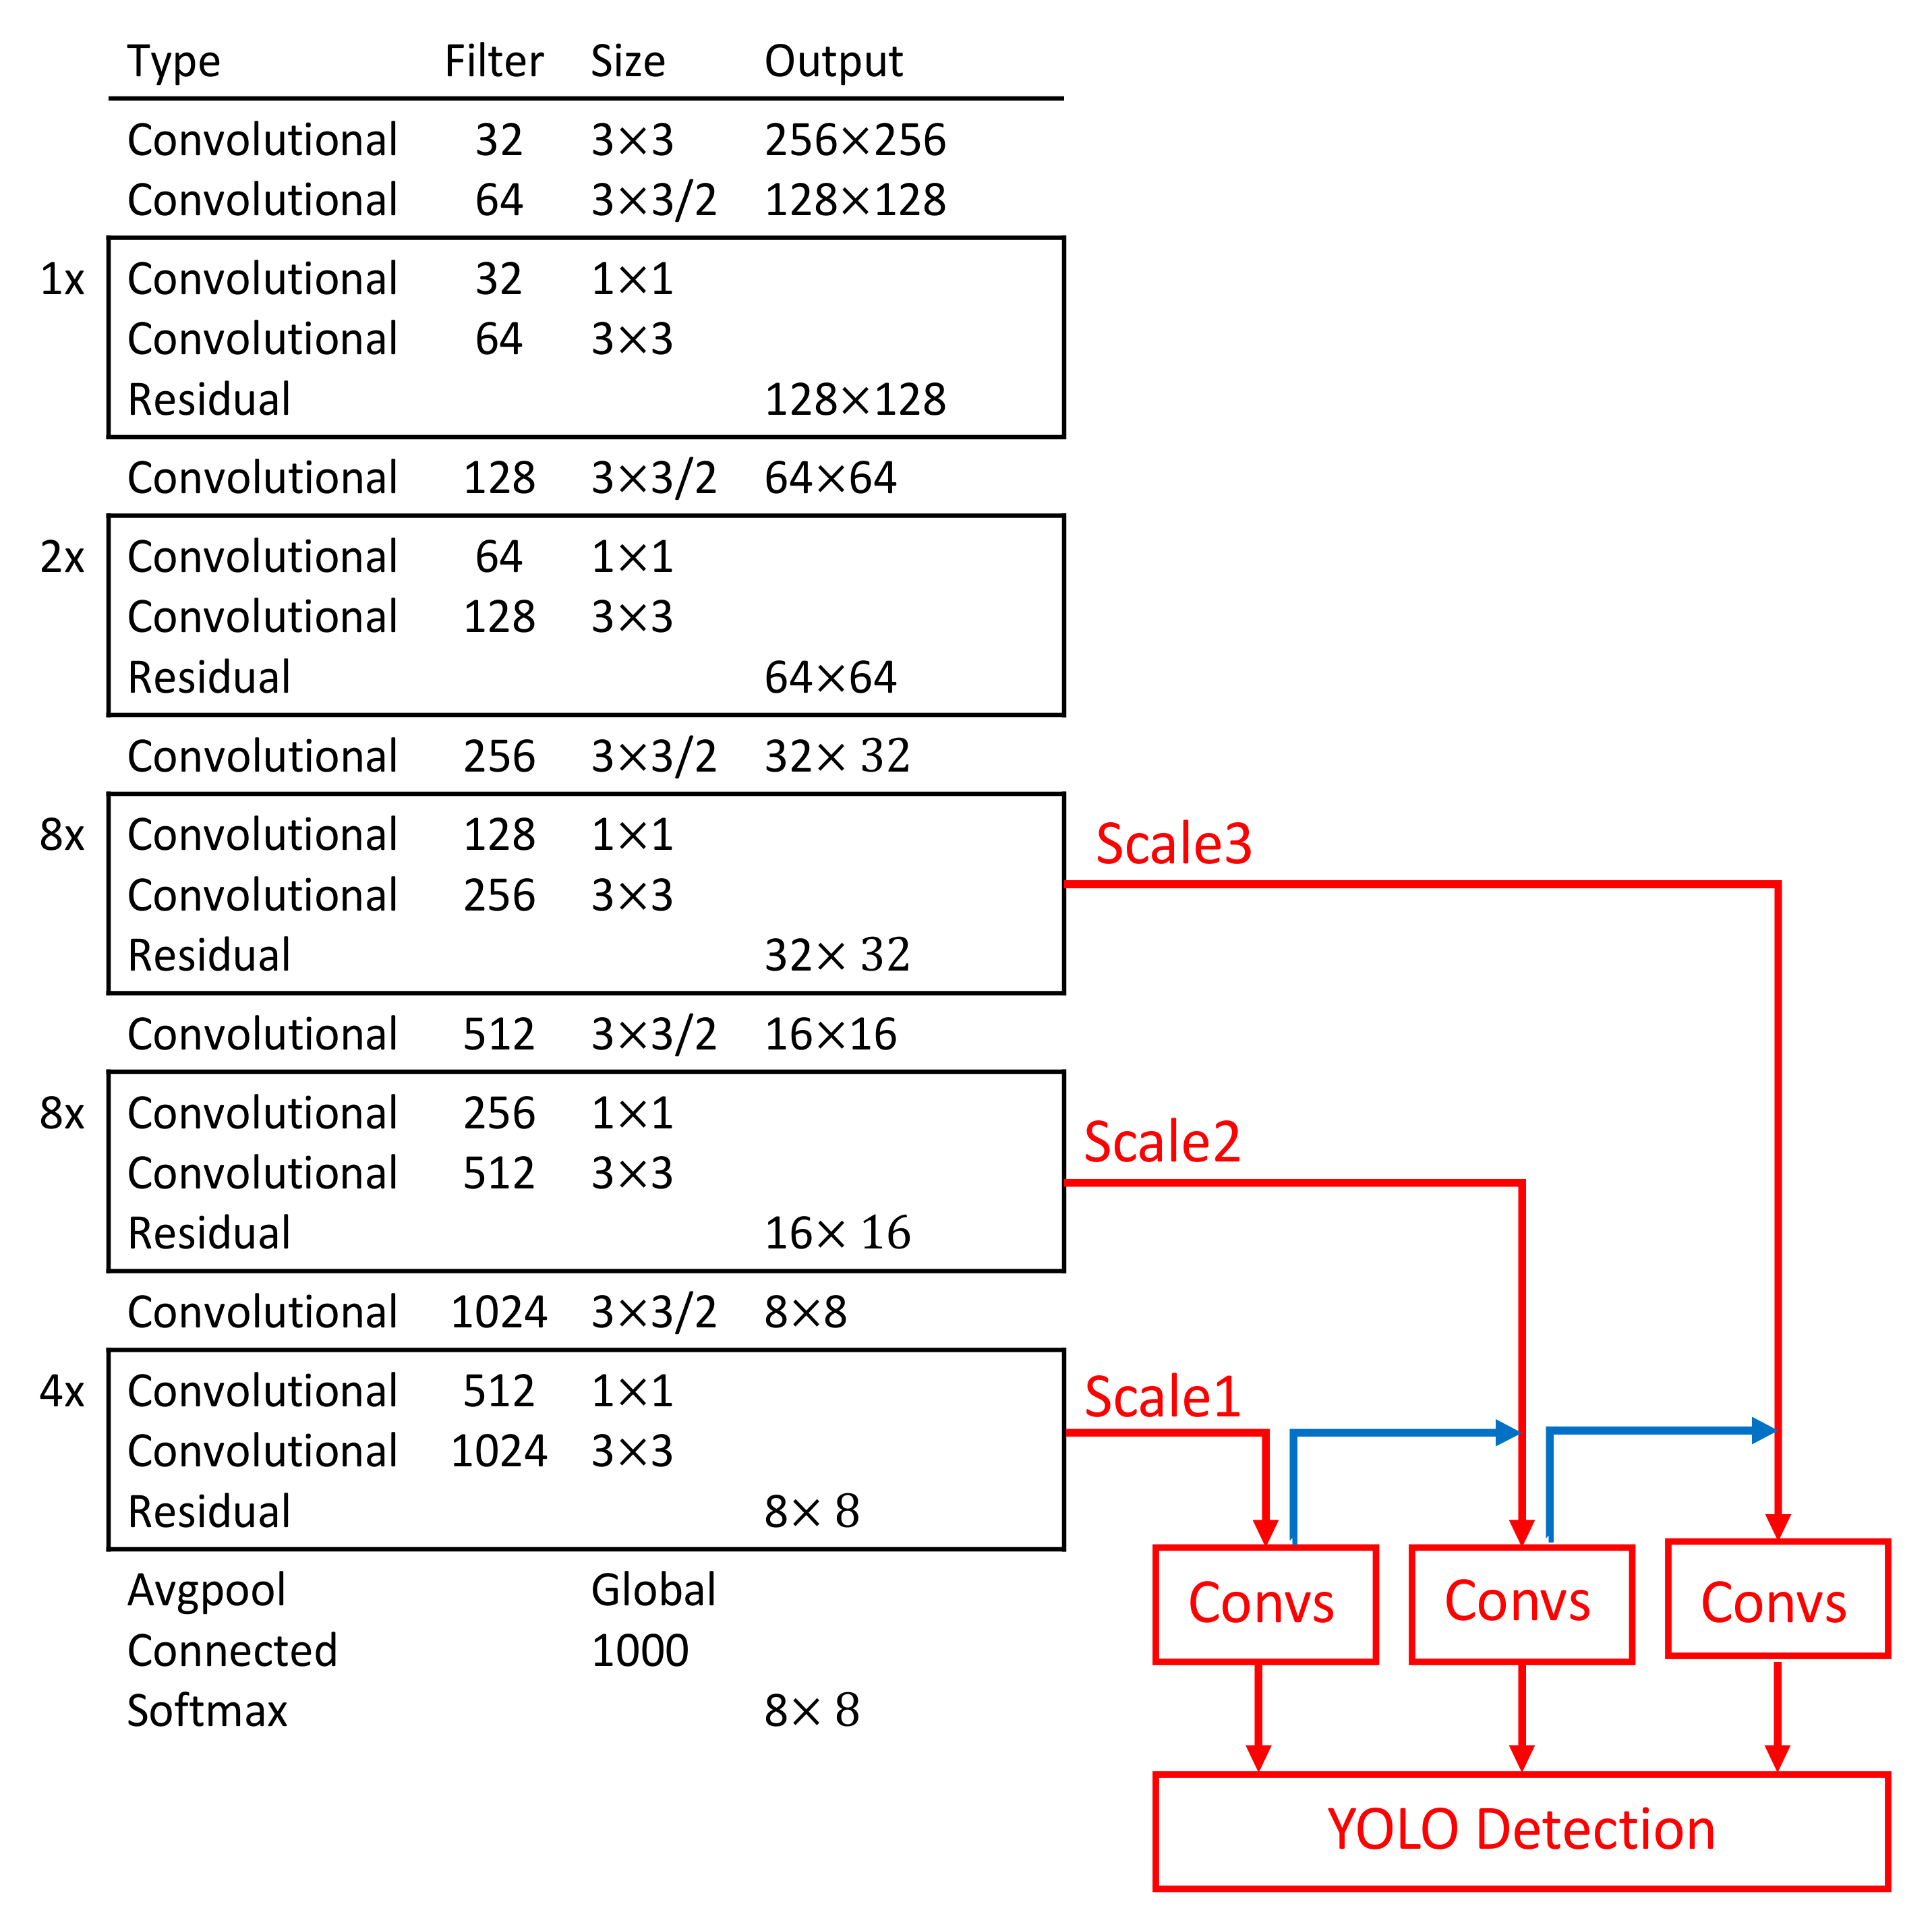
All the default YOLOv3 [
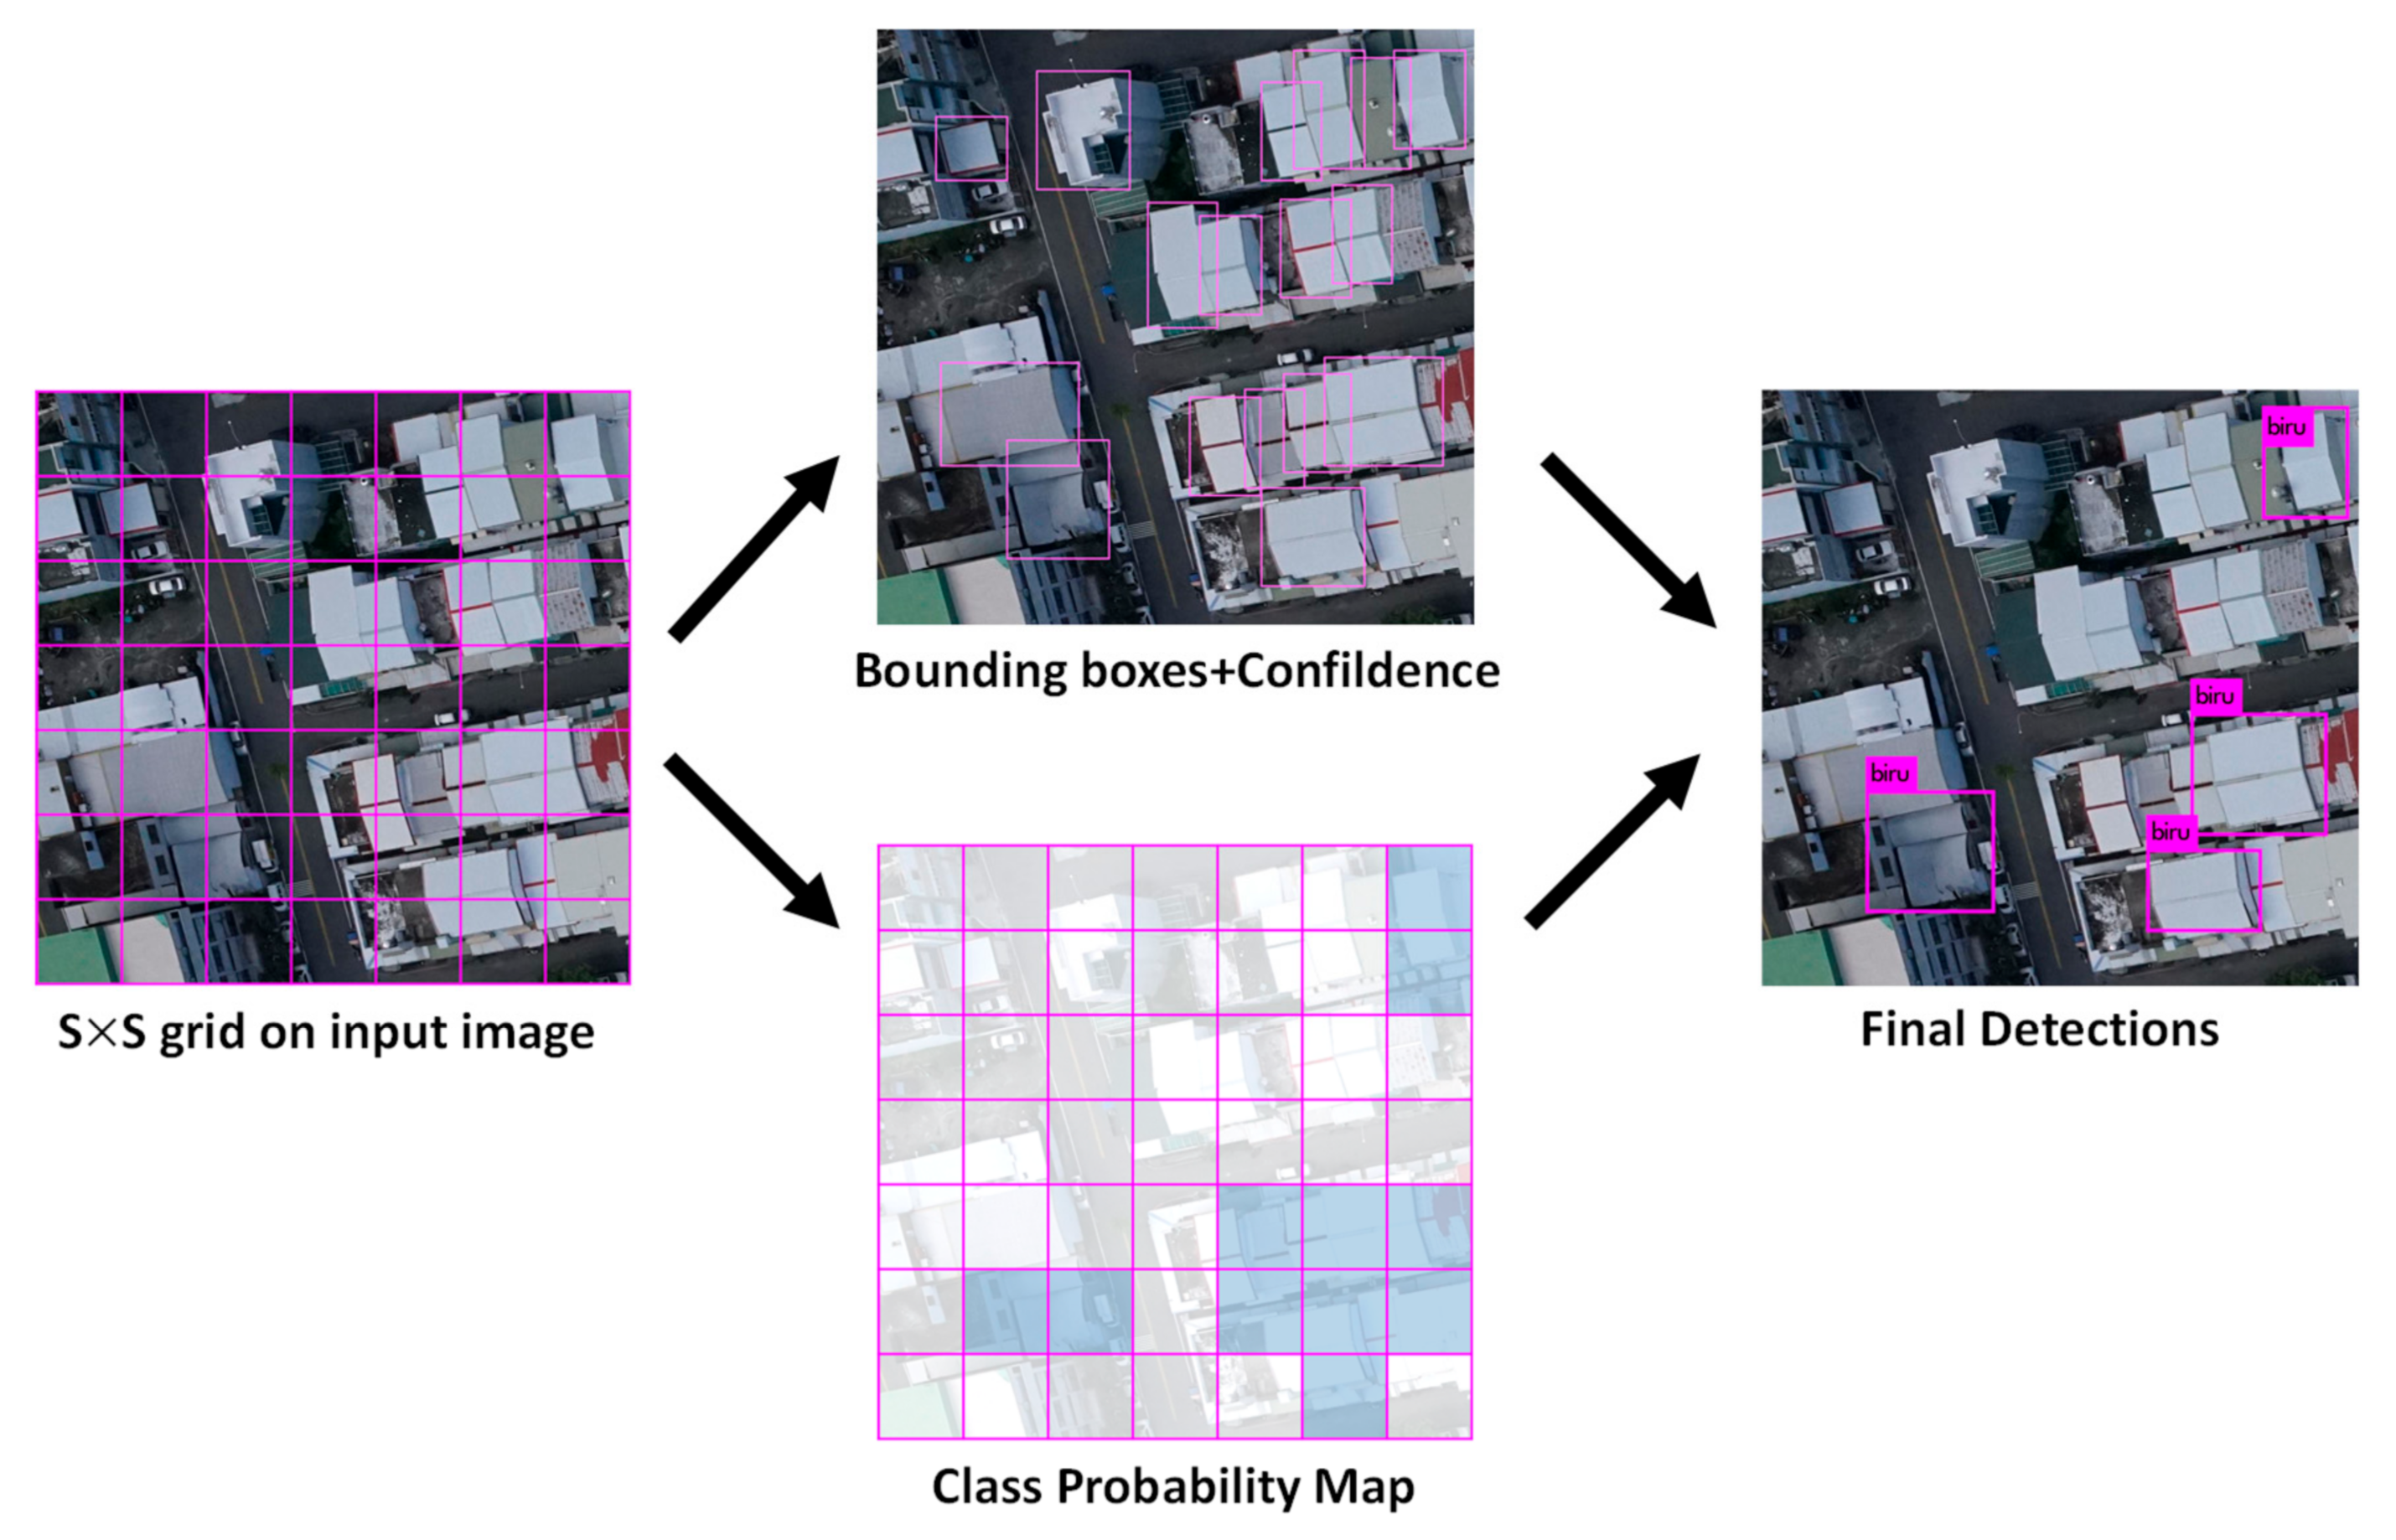
17] parameter settings were applied, except that the network was only trained for a single class “roof”. The image was divided into S × S grid cells of 13 × 13, 26 × 26 and 52 × 52 for detection on the corresponding scales. Each grid cell is responsible for outputting three bounding boxes, B = 3. Each bounding box outputs five parameters x, y, w, h, and confidence (refers Equation (6)) which define the bounding box location as well as a confidence score indicating the likelihood that the bounding box contains an object.
denotes the probability that the box contains an object. If a cell has no object, then the confidence scores should be 0, otherwise the confidence score should equal the intersection over union (IOU) between the predicted box and ground truth. IOU is a ratio between the intersection and the union of the predicted boxes and the ground truth boxes, when IOU exceeds the threshold, the bounding box is correct, as shown in Equation (7). This standard is used to measure the correlation between ground truth, and prediction,
; a higher value represents a higher correlation.
IOU is frequently adopted as an evaluation metric to measure the accuracy of an object detector. The importance of IOU is not limited to assigning anchor boxes during preparation of the training dataset but is also very useful when adopting the non-max suppression algorithm for cleaning up whenever multiple boxes are predicted for the same object. The IOU is assigned to 0.5 (the default threshold is usually 0.5), which means that at least half of the ground truth and the predicted box cover the same region. When IOU is greater than 50% threshold, the test case is predicted as containing an object.
Each grid cell is assigned 1 conditional class probability,
, which is the probability that the object belongs to the class “roof” given an object is presence. The class confidence score for each prediction box is then calculated as Equation (8), which gives the classification confidence as well as the localization confidence.
The detection output tensor is of size
S × S × B × (5 + C). The value 5 is for the four bounding attributes and one confidence score.
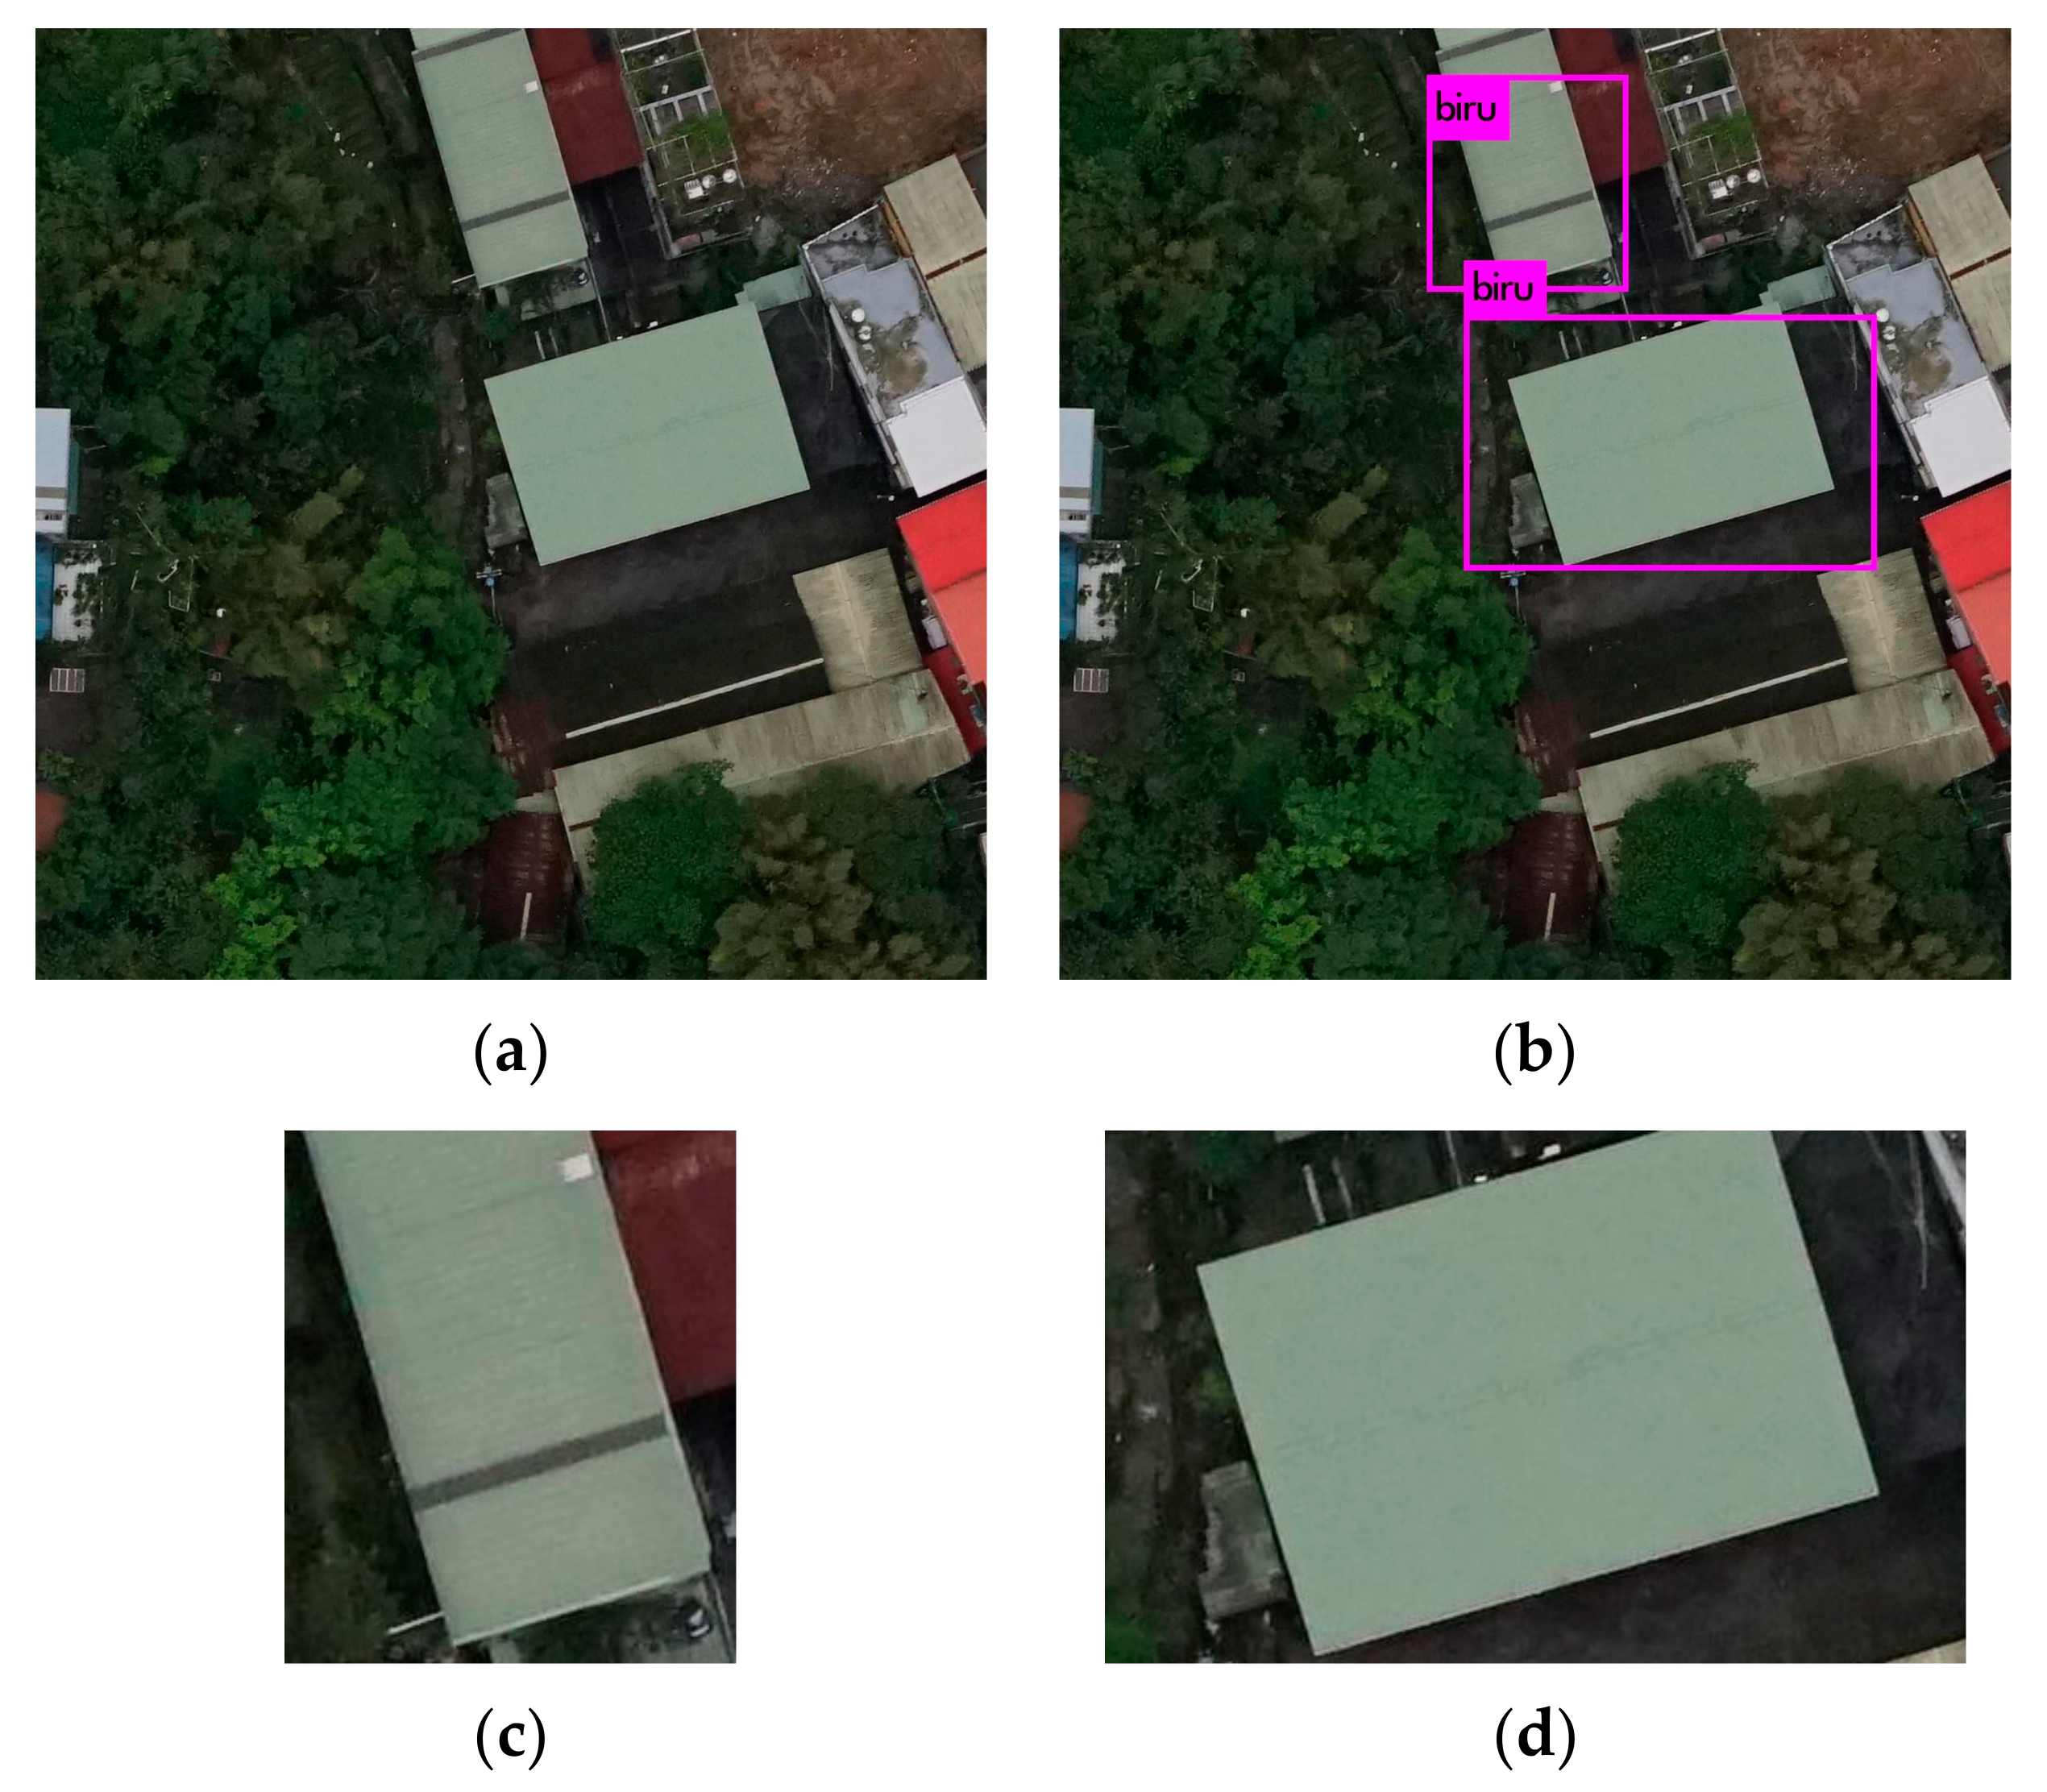
Figure 3 shows the detection process using YOLOv3 [
17].
Figure 4 shows a backbone network adopted in YOLOv3 [
17] for a multiscale object detection. This study adopted the network model for a single class object “roof”. The object “roof” became our candidate regions.
3.1. Dataset and Training Process
3.1.1. Experiment Environment
The experiment environment includes Intel(R) core (TM) i7-8770 @3.2GHz (CPU) and 24 GB of memory, NVIDIA GeForce TITAN Xp GPU with 24 GB memory and using CUDA 9.0.
Table 1 shows the hardware and software configurations for the training process.
3.1.2. The Datasets
To evaluate the effectiveness of this research method, we used a set of real images acquired by a UAV equipped with imaging sensors spanning the visible range. The camera is SONY a7R, characterized by a Exmor R full frame CMOS sensor with 36.4 megapixels. All images have been acquired from the National Science and Technology Center for Disaster Reduction, New Taipei, on 13 October 2016, at 10:00 a.m. The images are characterized by three channels (RGB) with 8 bits of radiometric resolution and a spatial resolution of 25 cm ground sample distance (GSD).
Table 2 shows the UAV platform and sensor characteristics.
In this study, the dataset comprises 99 drone images with 6000 × 4000 pixel size, captured in the Xizhi District, New Taipei City, Taiwan. As YOLOv3 [
17] is designed to train and test the images of 416 × 416 pixel size, the original images were cropped into 1000 × 1000 pixel size with overlapping areas of 70% between the subsequent images. The cropped images were then randomly split into training and testing data at ratio 9:1.
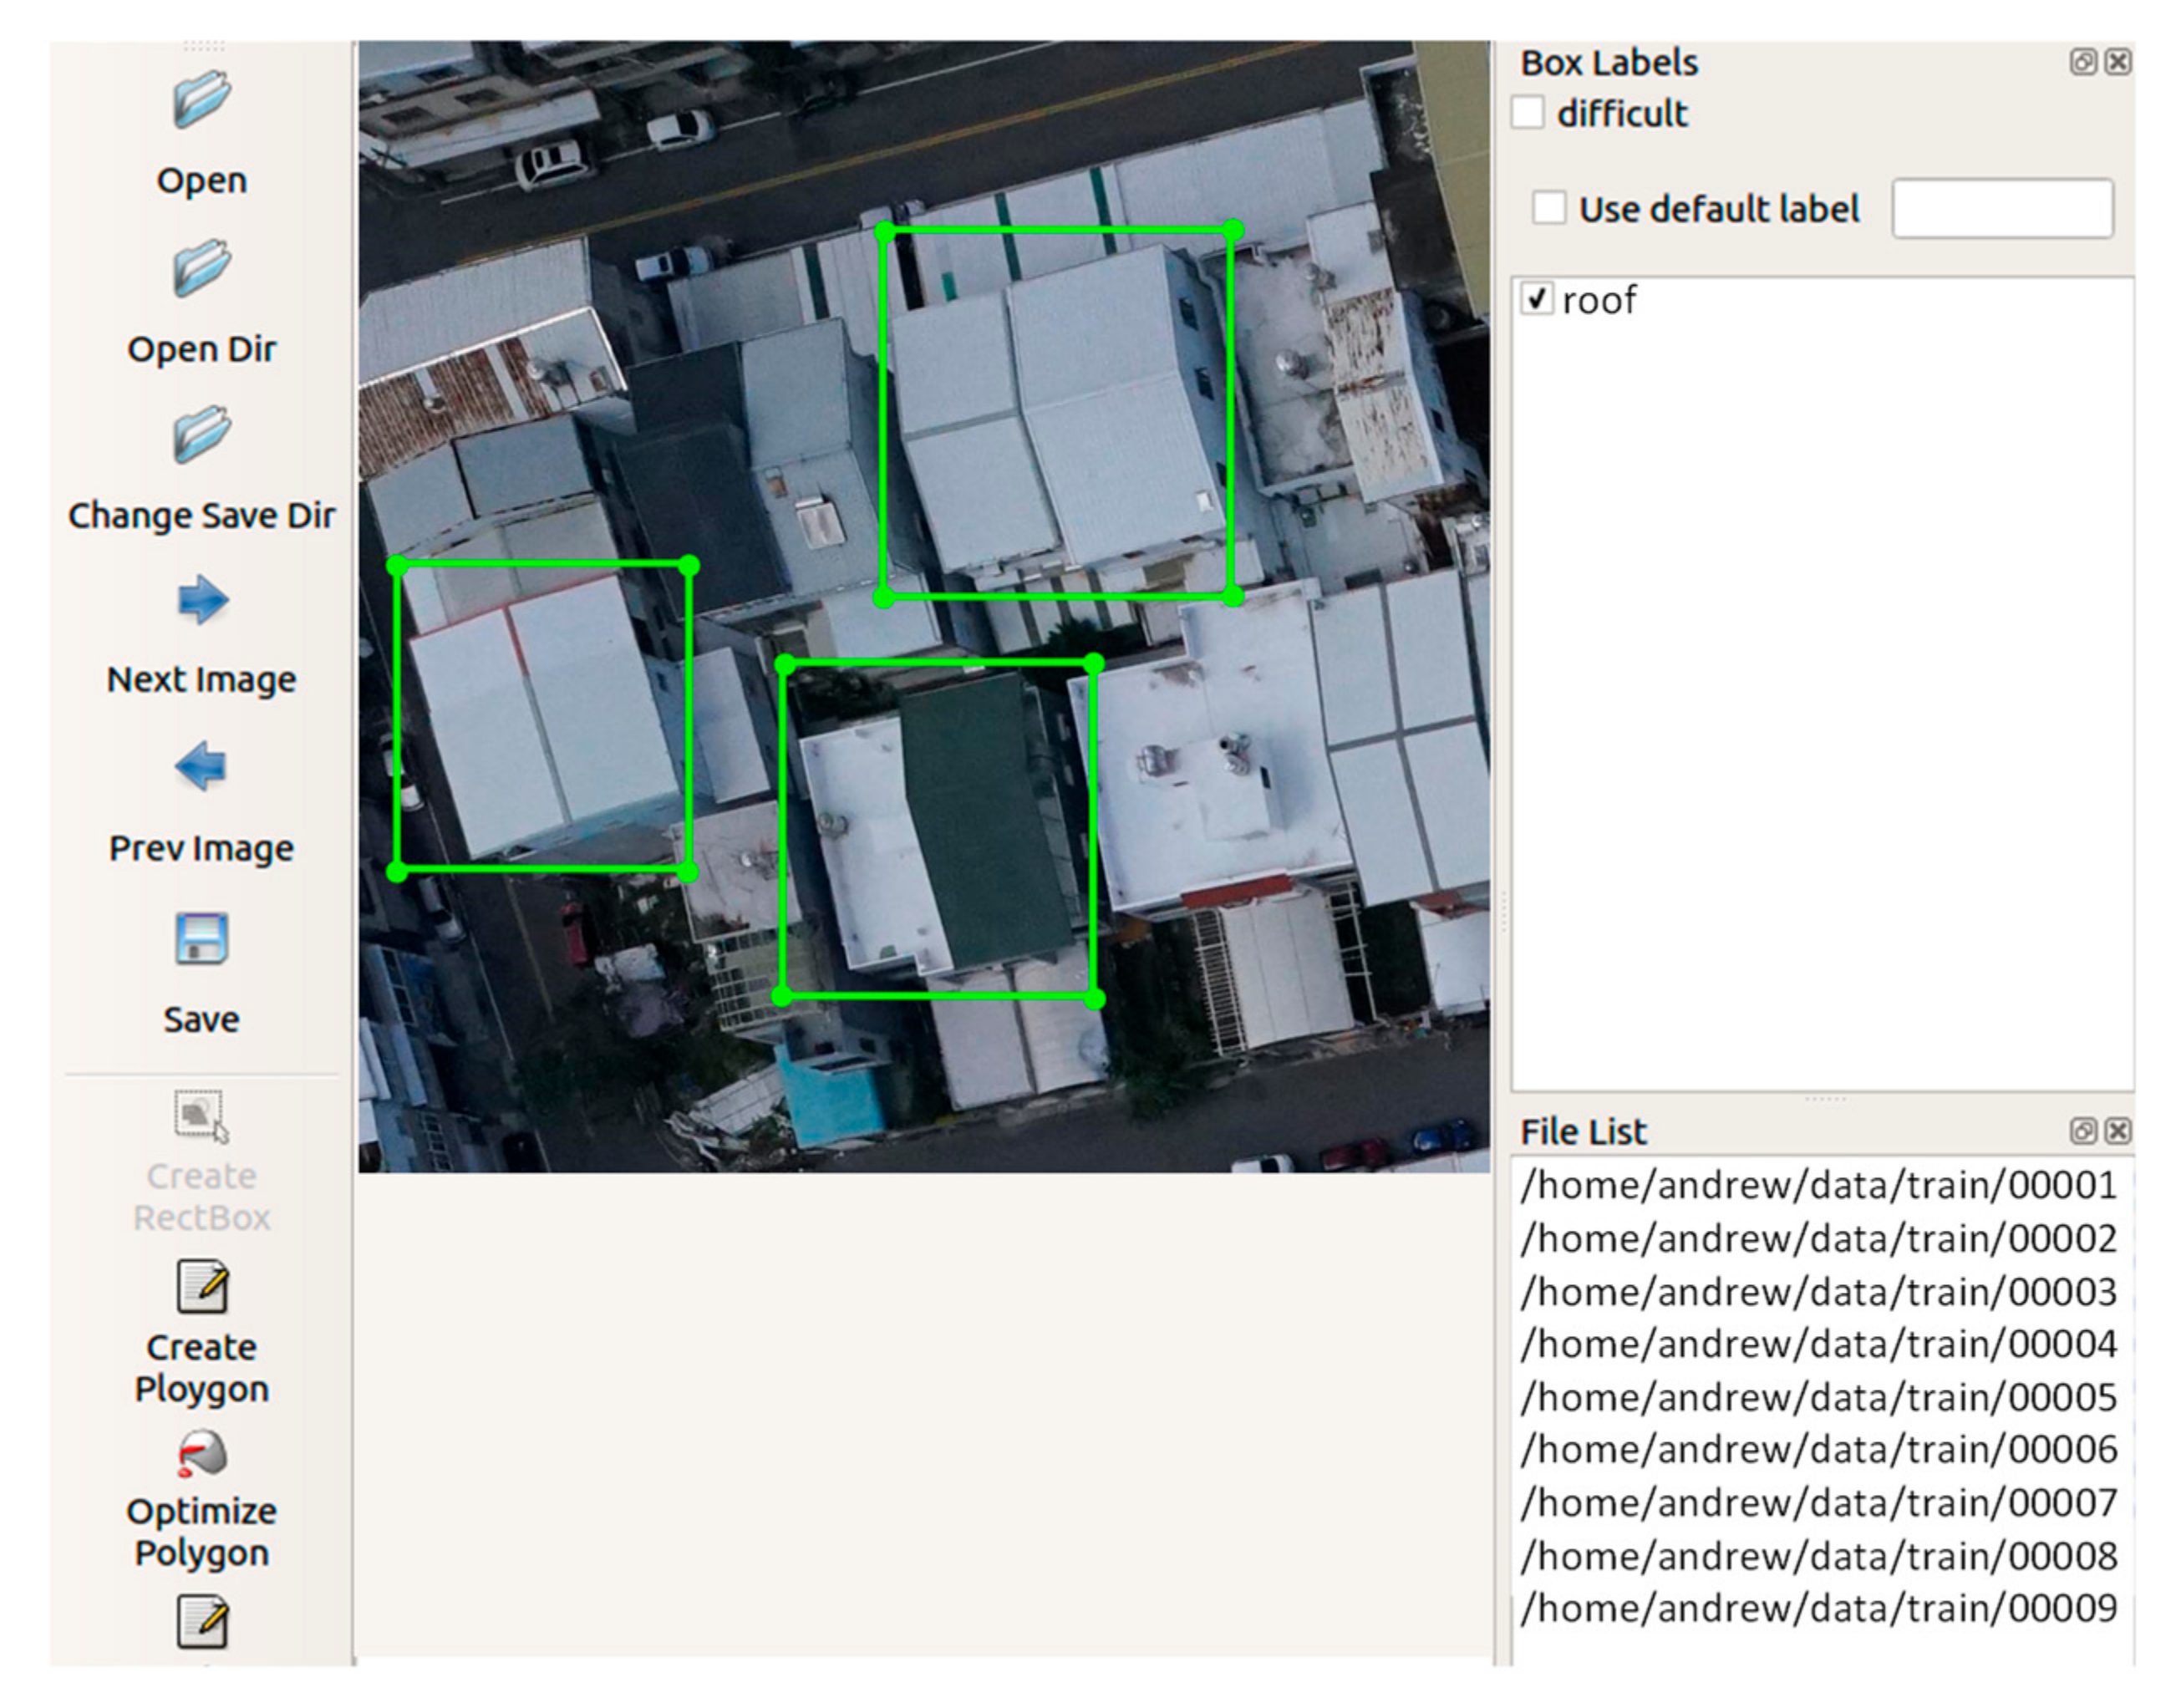
In order to train the network to output the location of the object, all the ground truth objects in the images need to be labeled first. We used the LabelImg open source project on GitHub (tzutalin.github) [
29], which is currently the most widely used annotation tool. An open-source software application “LabelImg” [
29] was adopted to create the ground truth bounding boxes for the object detection task.
Figure 5 shows a screenshot of the process of creating the ground truth bounding boxes using the labelImg software. As the drone images mostly covered the residential areas, only a single class of object “roof” was labeled. The annotations of training images in the XML format were used directly in the YOLOv3 end-to-end training network.
3.2. Evaluation Methods
The precision is the ratio of true positives (true predictions) to the total number of predicted positives
TP denotes the number of true positives.
FP denotes the number of false positives and
FN is the number of false negatives. The recall is the ratio of true positives to the total of ground truth positives.
The average precision (AP) is the area under the precision–recall curve, and
denotes the precision value at
.
The loss function is a function that maps an event or value of one or more variables onto a real number intuitively representing some ‘cost’ associated with the event. Therefore, the performance of the training model can be measured by calculating the loss function.
YOLOv3 uses multiple logistic classifiers instead of Softmax to classify each box, since Softmax is not suitable for multi-label classification, and increasing the number of independent multiple logistic classifiers does not decrease the classification accuracy. Therefore, the optimization loss function can be expressed as shown in Equation (12).
In Equation (12), the loss function term1 () calculates the loss related to the predicted bounding box position (x, y). term2 () calculates the loss related to the predicted box width and height (w, h). Terms term3 () and term4 ( ) compute each bounding box predictor and the loss associated with the confidence score.
is the confidence score, and
is the intersection over union of the predicted box with the ground true.
is expressed in Equation (13). The final term () is the classification loss.
In this study, the dataset comprises 99 drone images. We have used 50 drone images which totally consist of 2200 house roofs divided into 2000 training samples and 200 testing samples. The length of the training time is 4 h. The training time of the deep learning algorithm is excluded from the T computation.
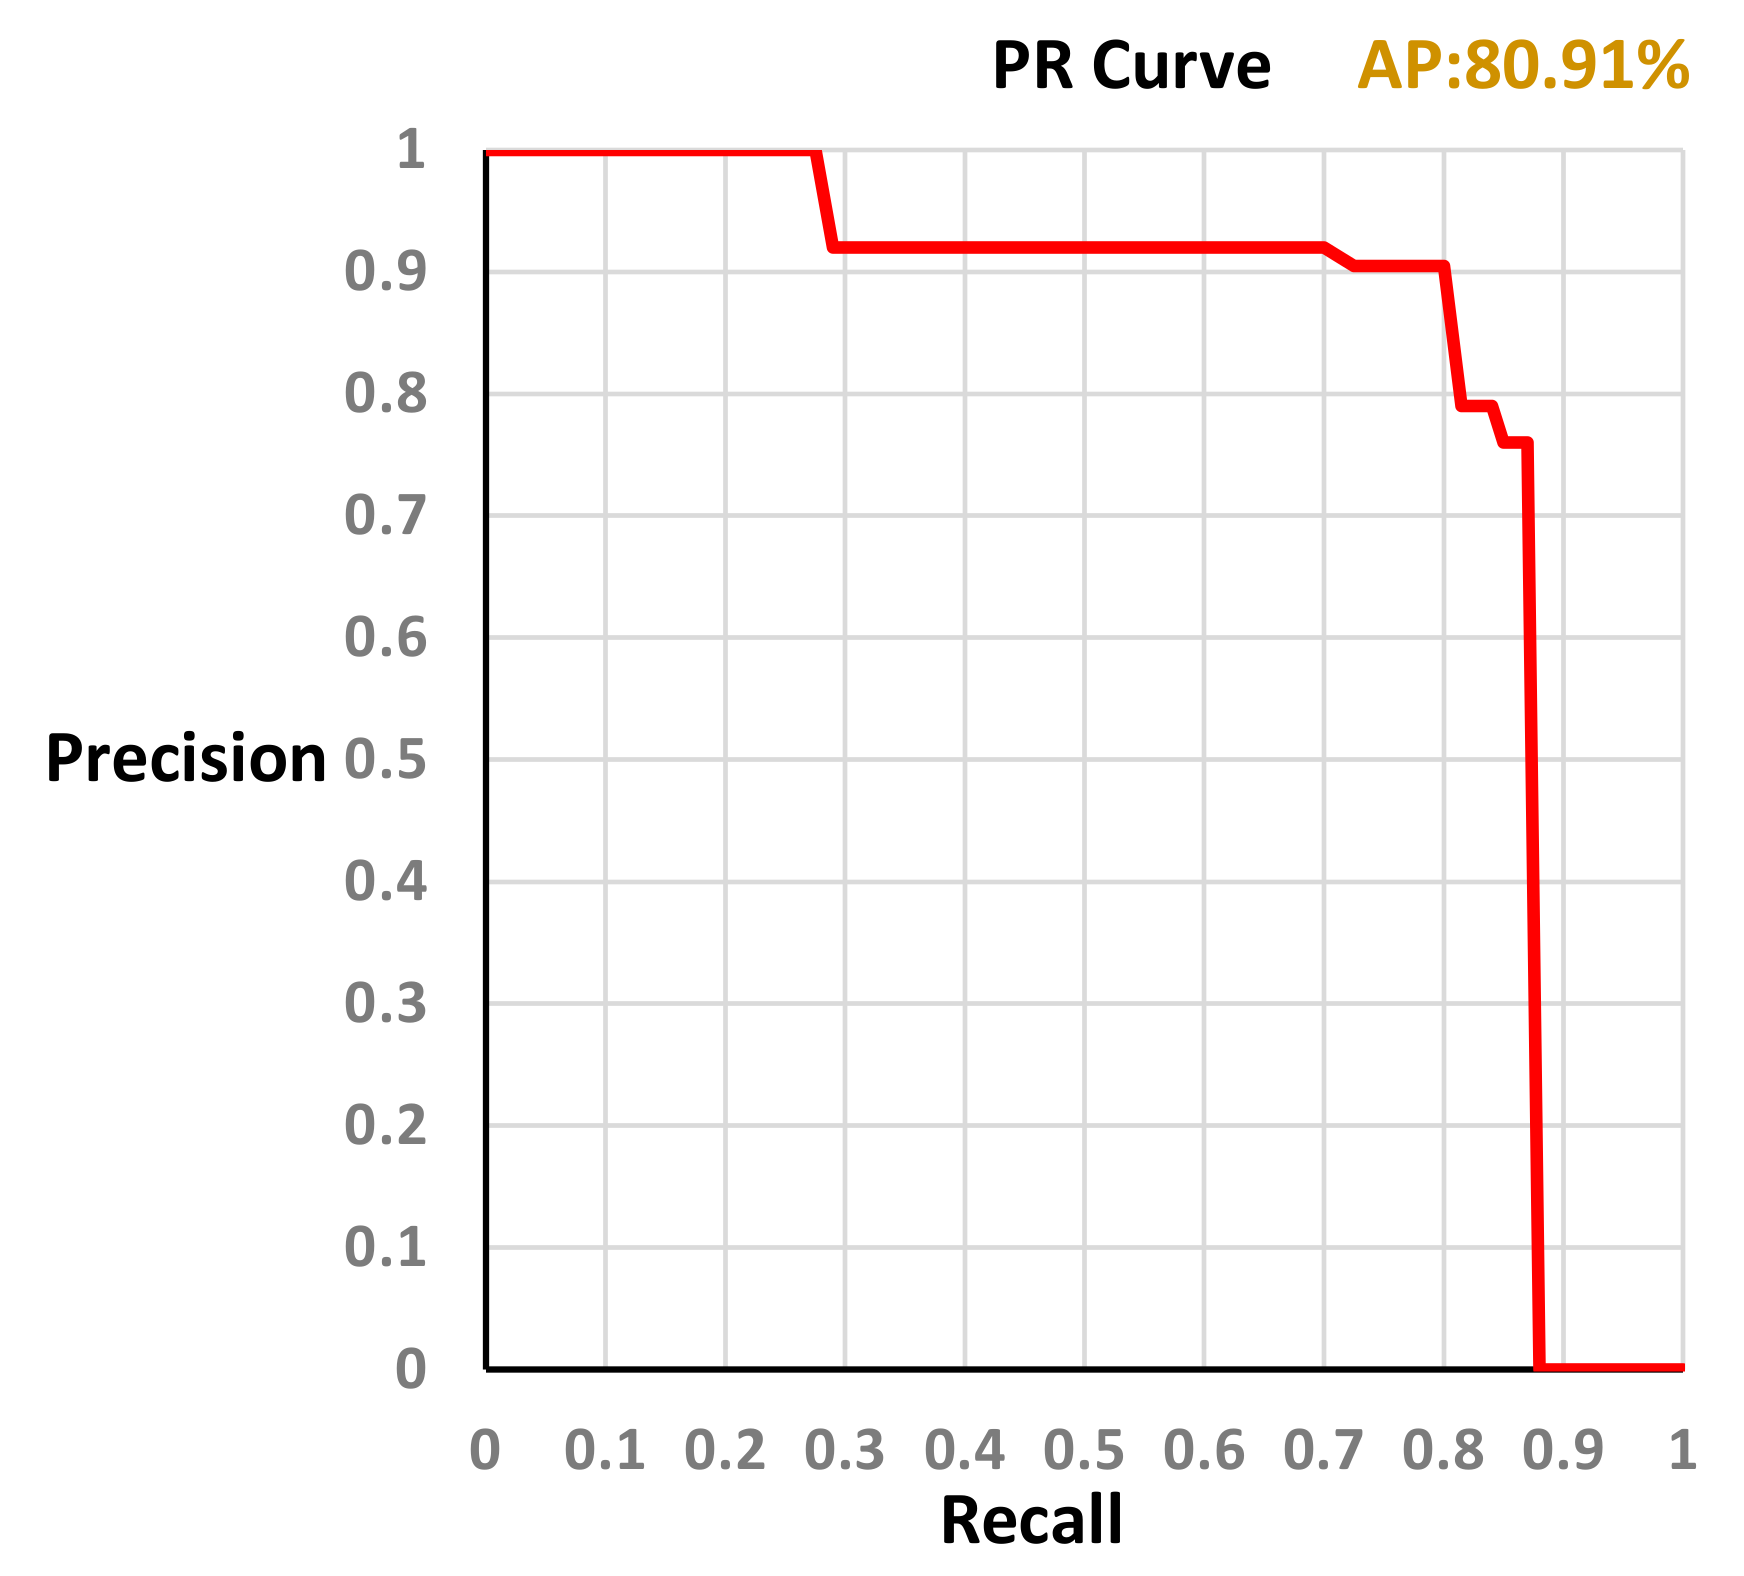
Figure 6 shows the precision-recall curve generated by the model trained with our dataset (training sample = 2000, testing sample = 200). The average precision obtained is AP = 80.91%.
We trained the YOLOv3 [
17] roof detection model on the datasets.
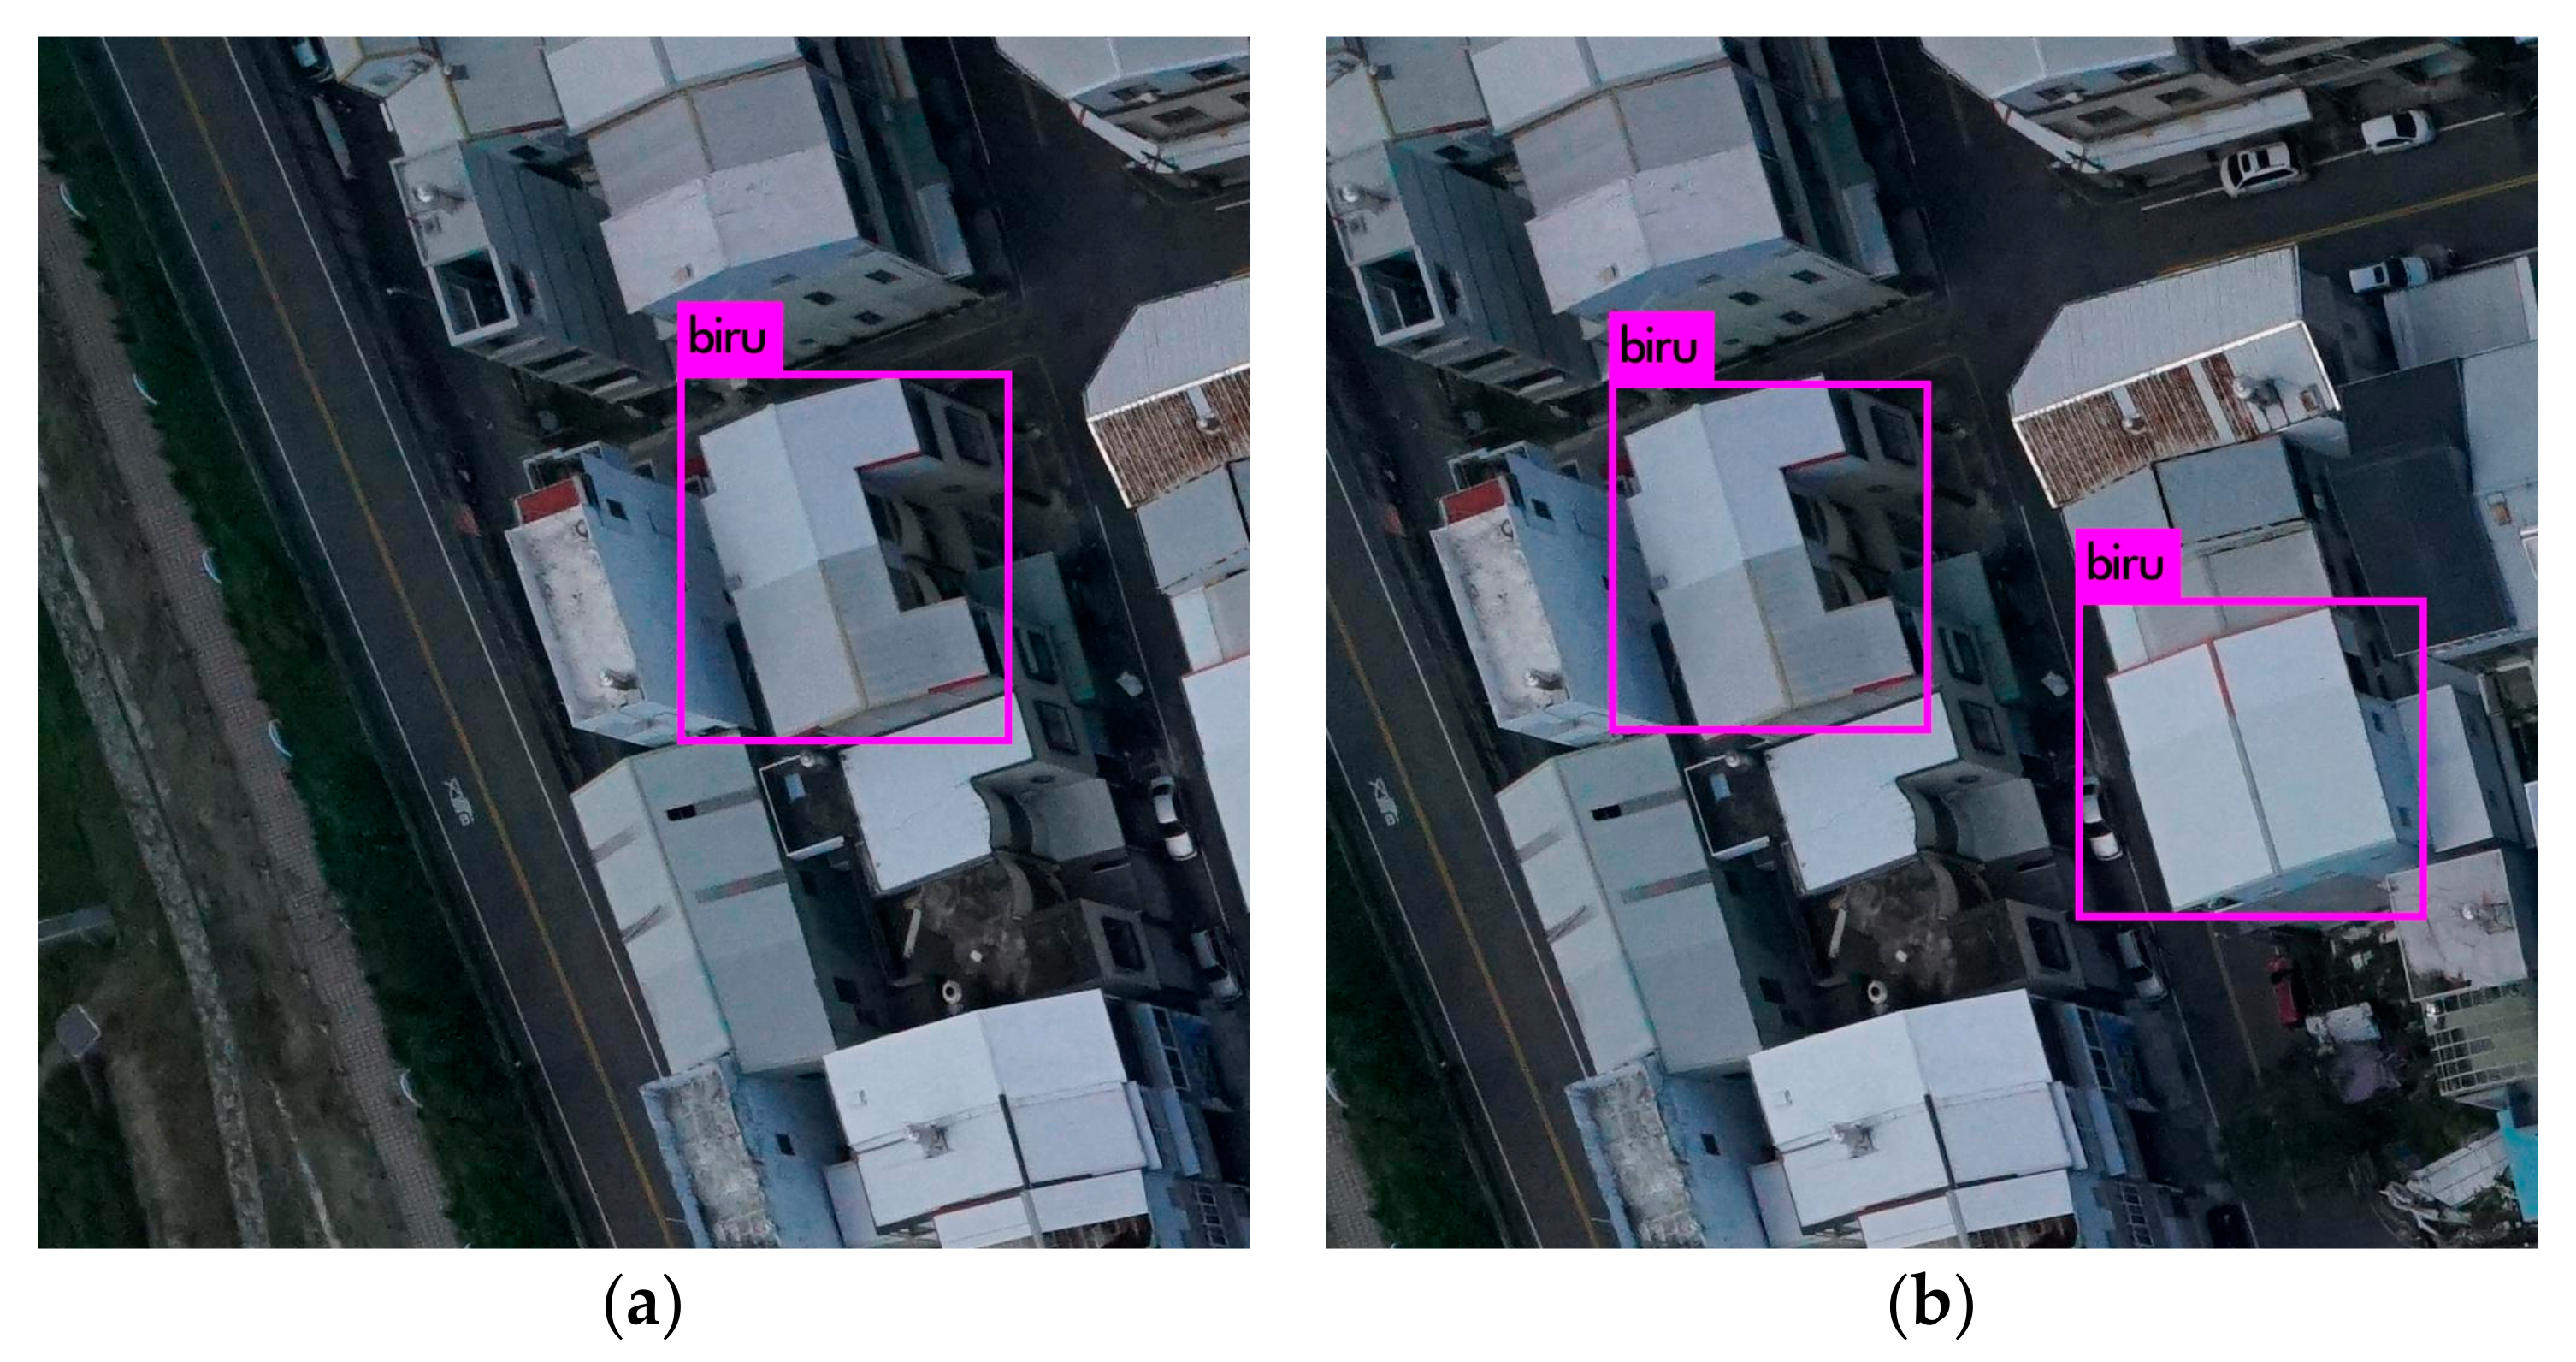
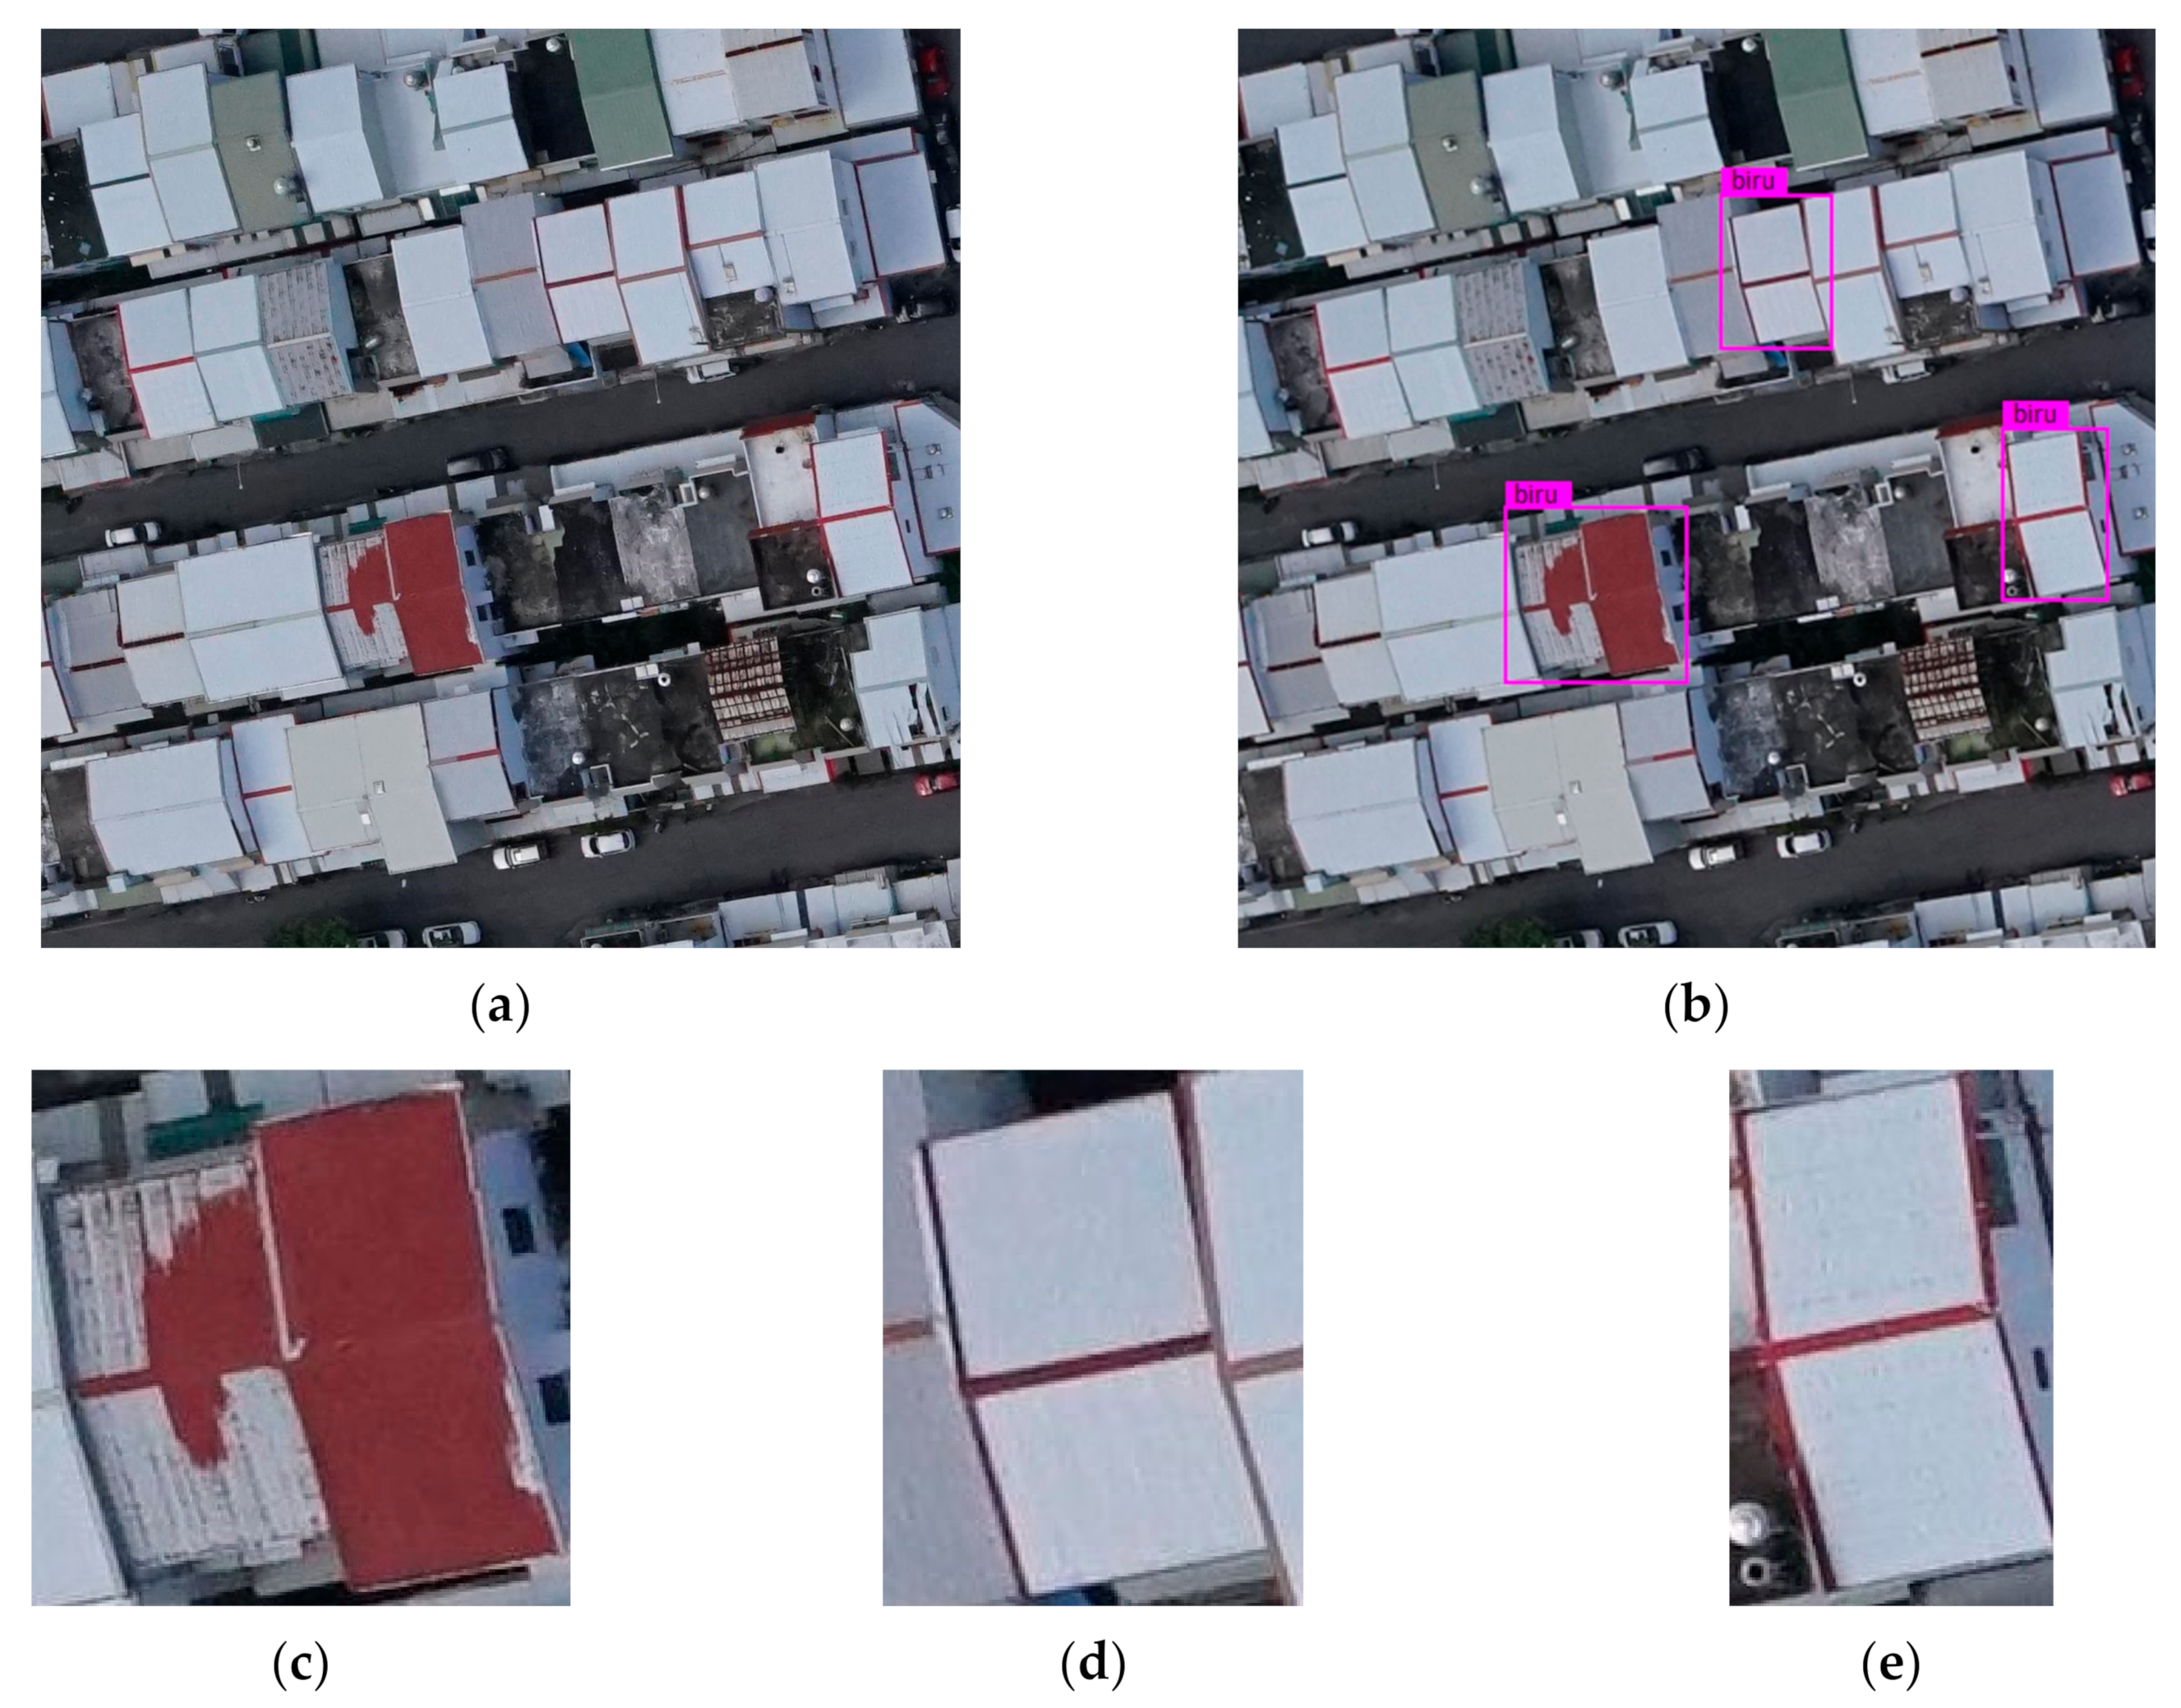
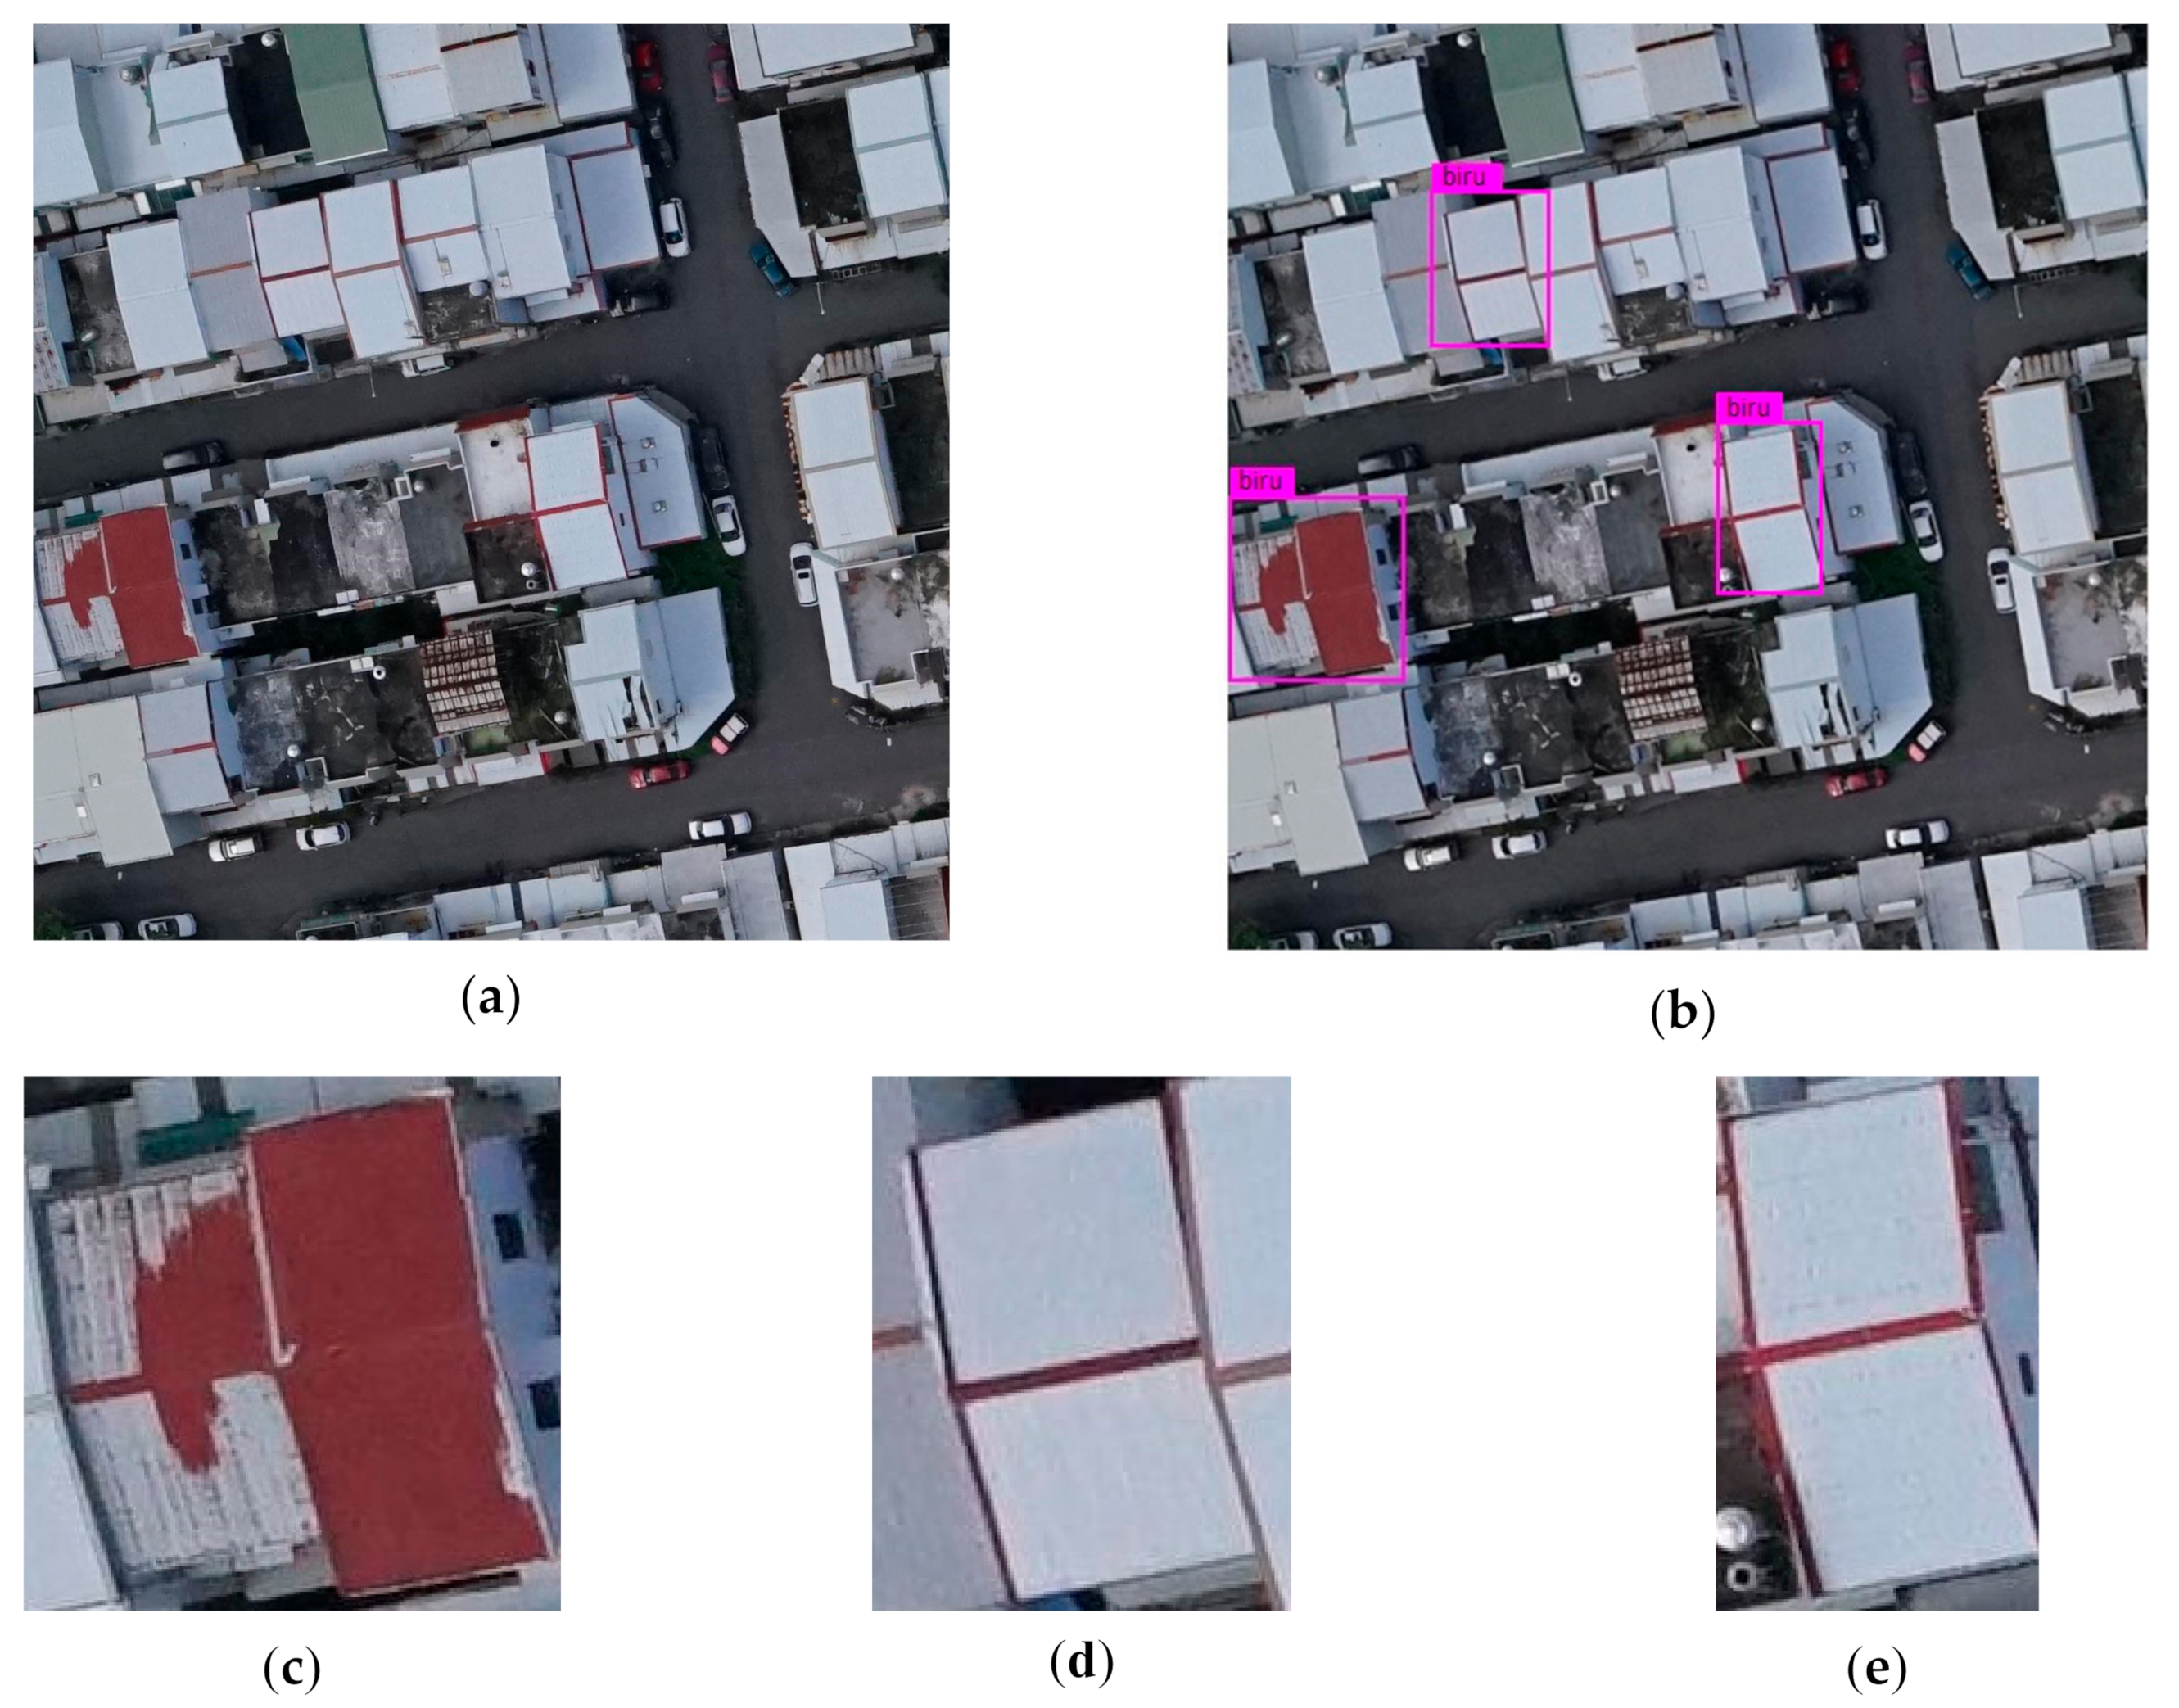
Figure 7 depicts the roof detection results on the dataset.
3.3. Evaluation and Testing Process
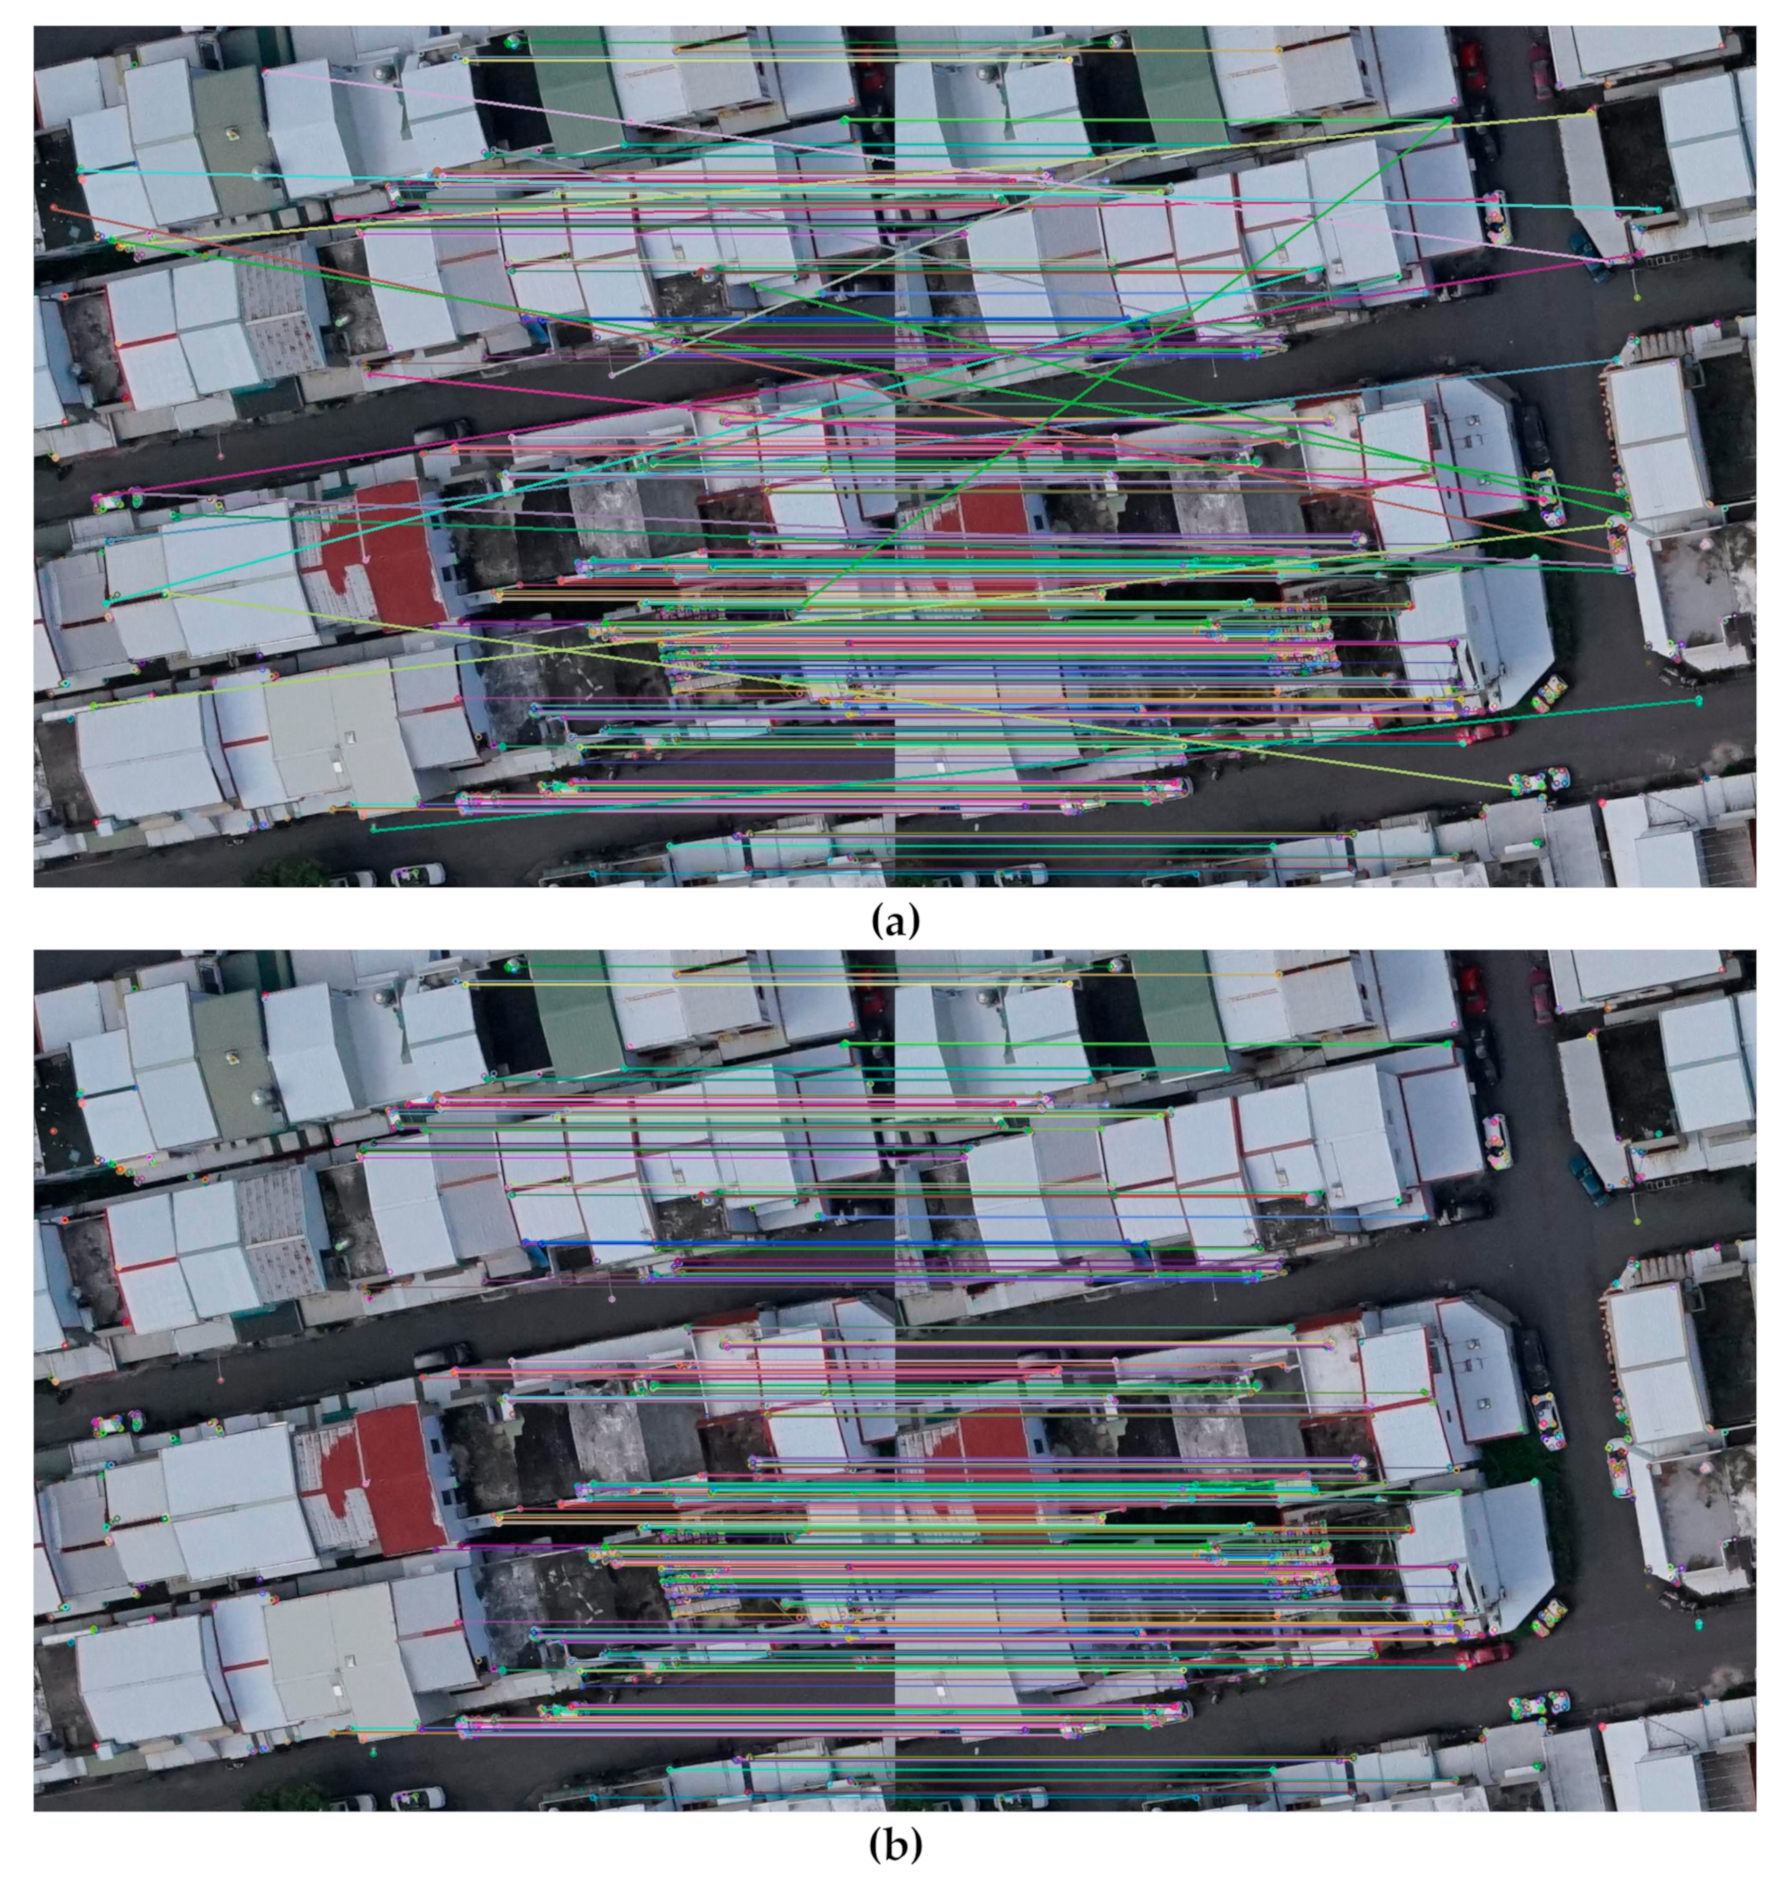
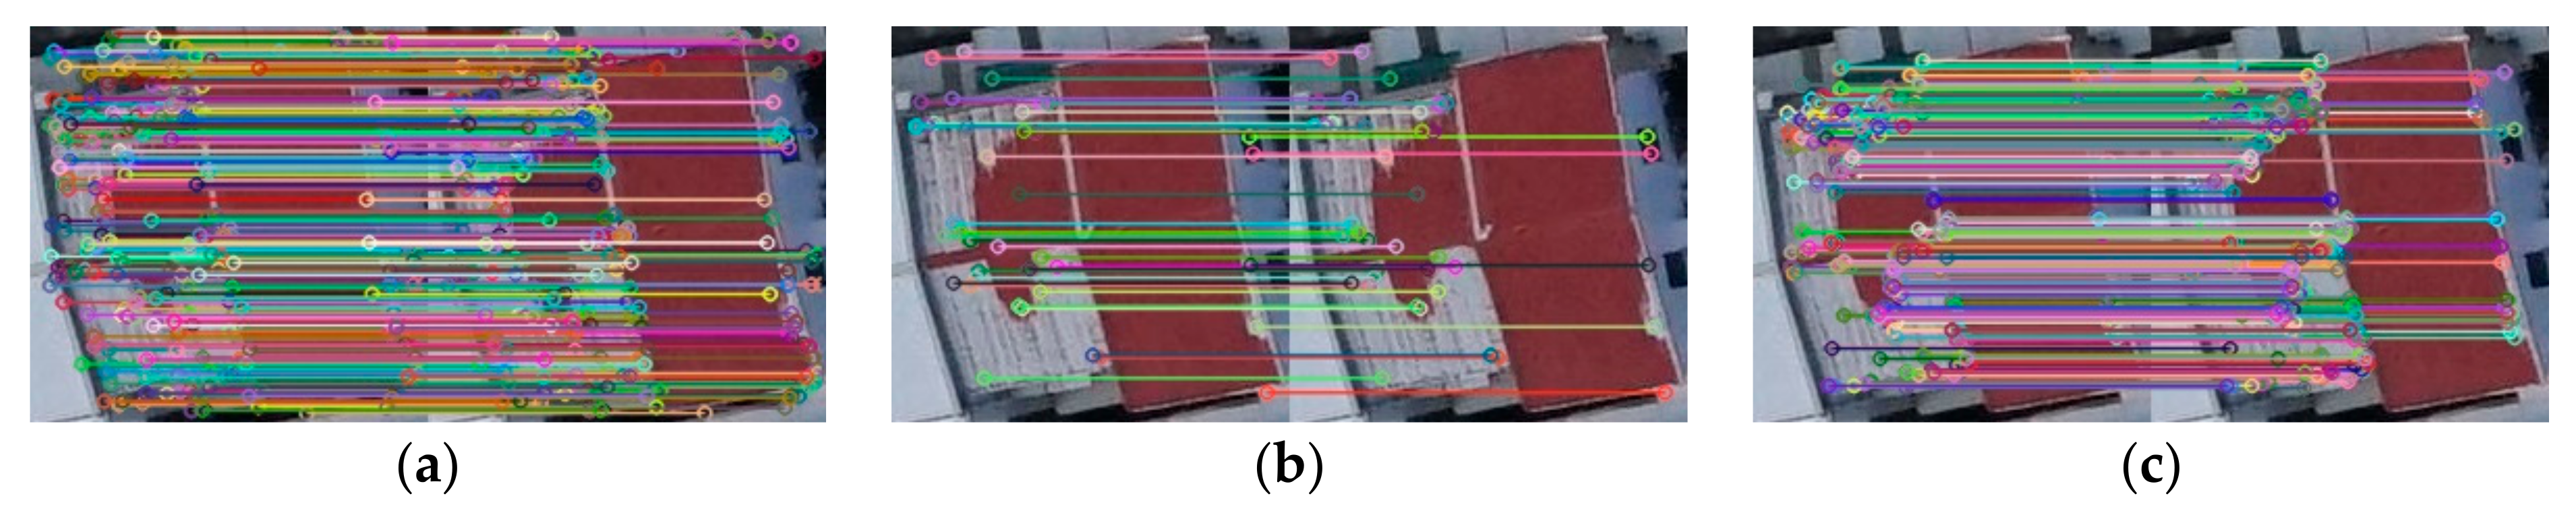
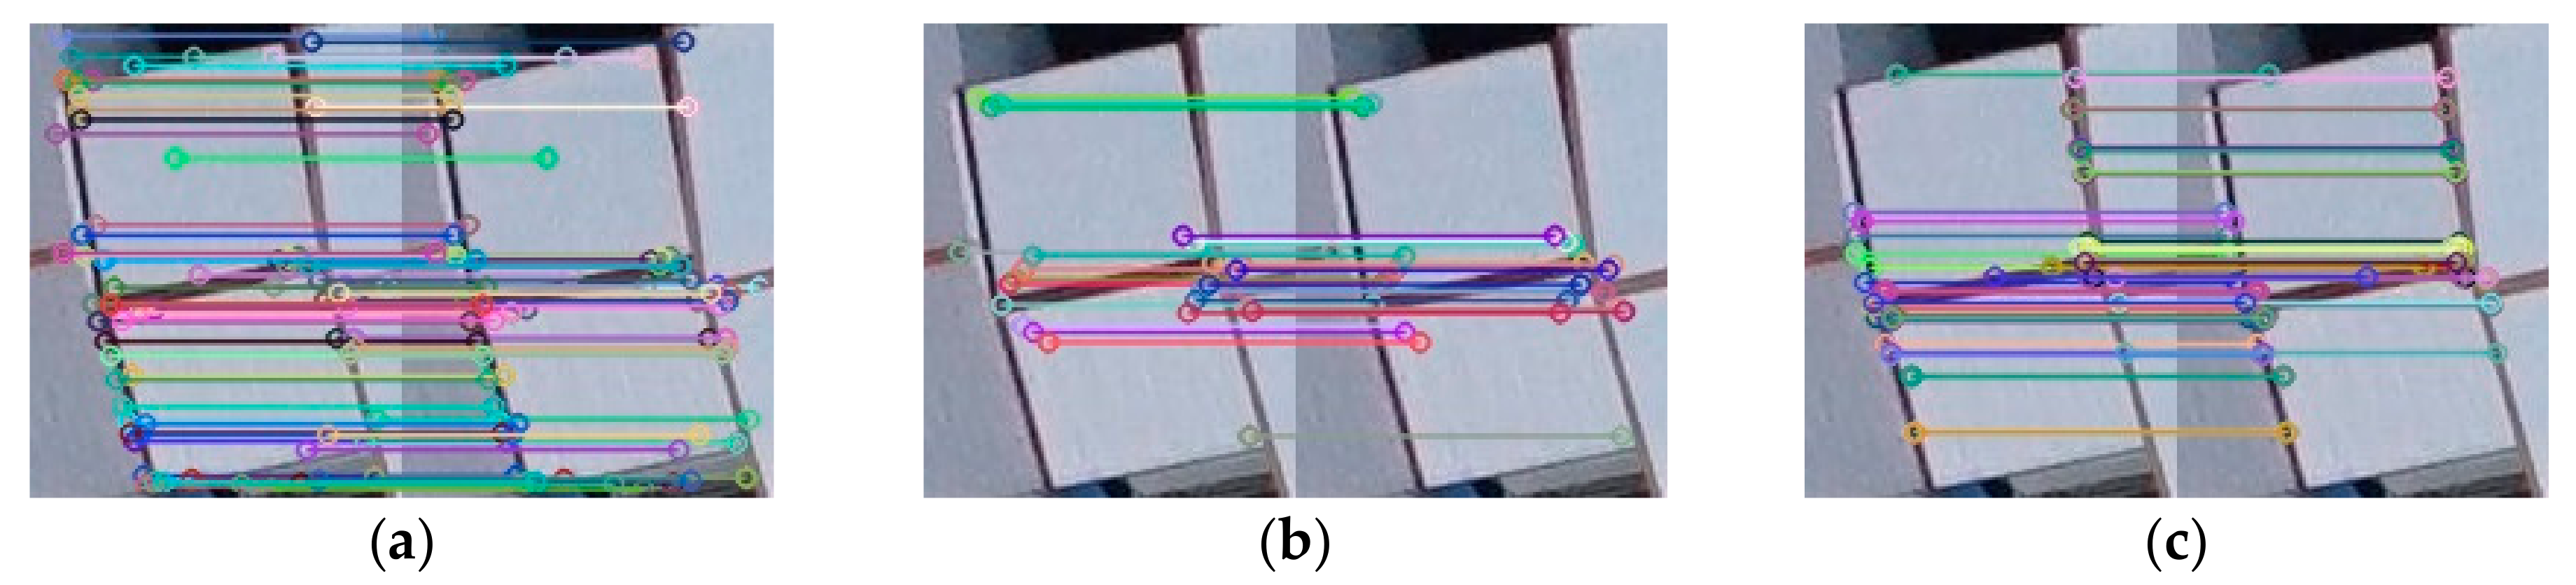
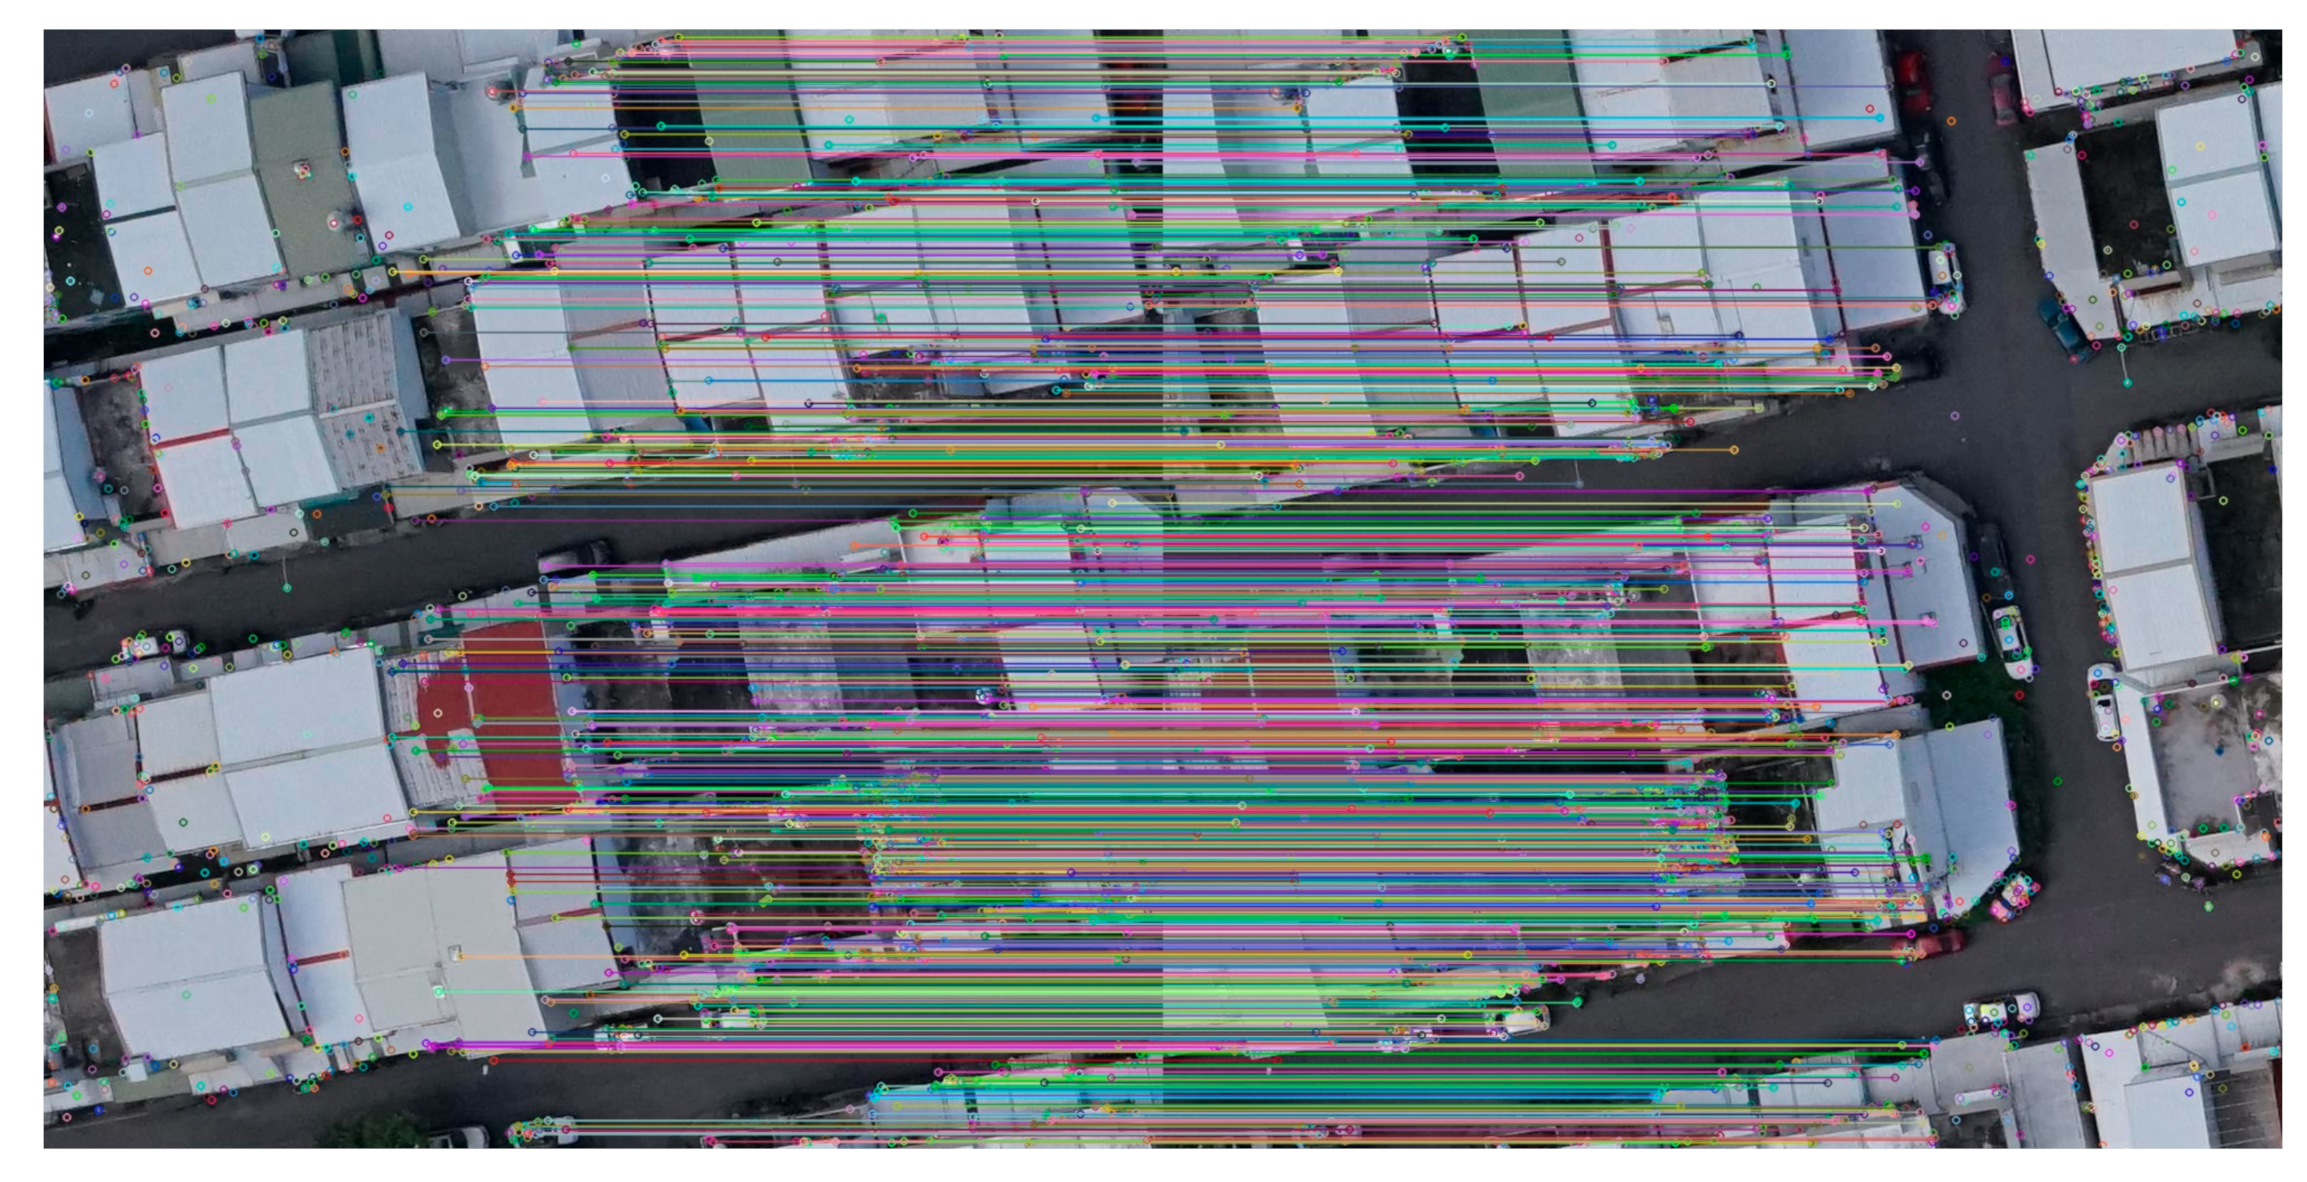
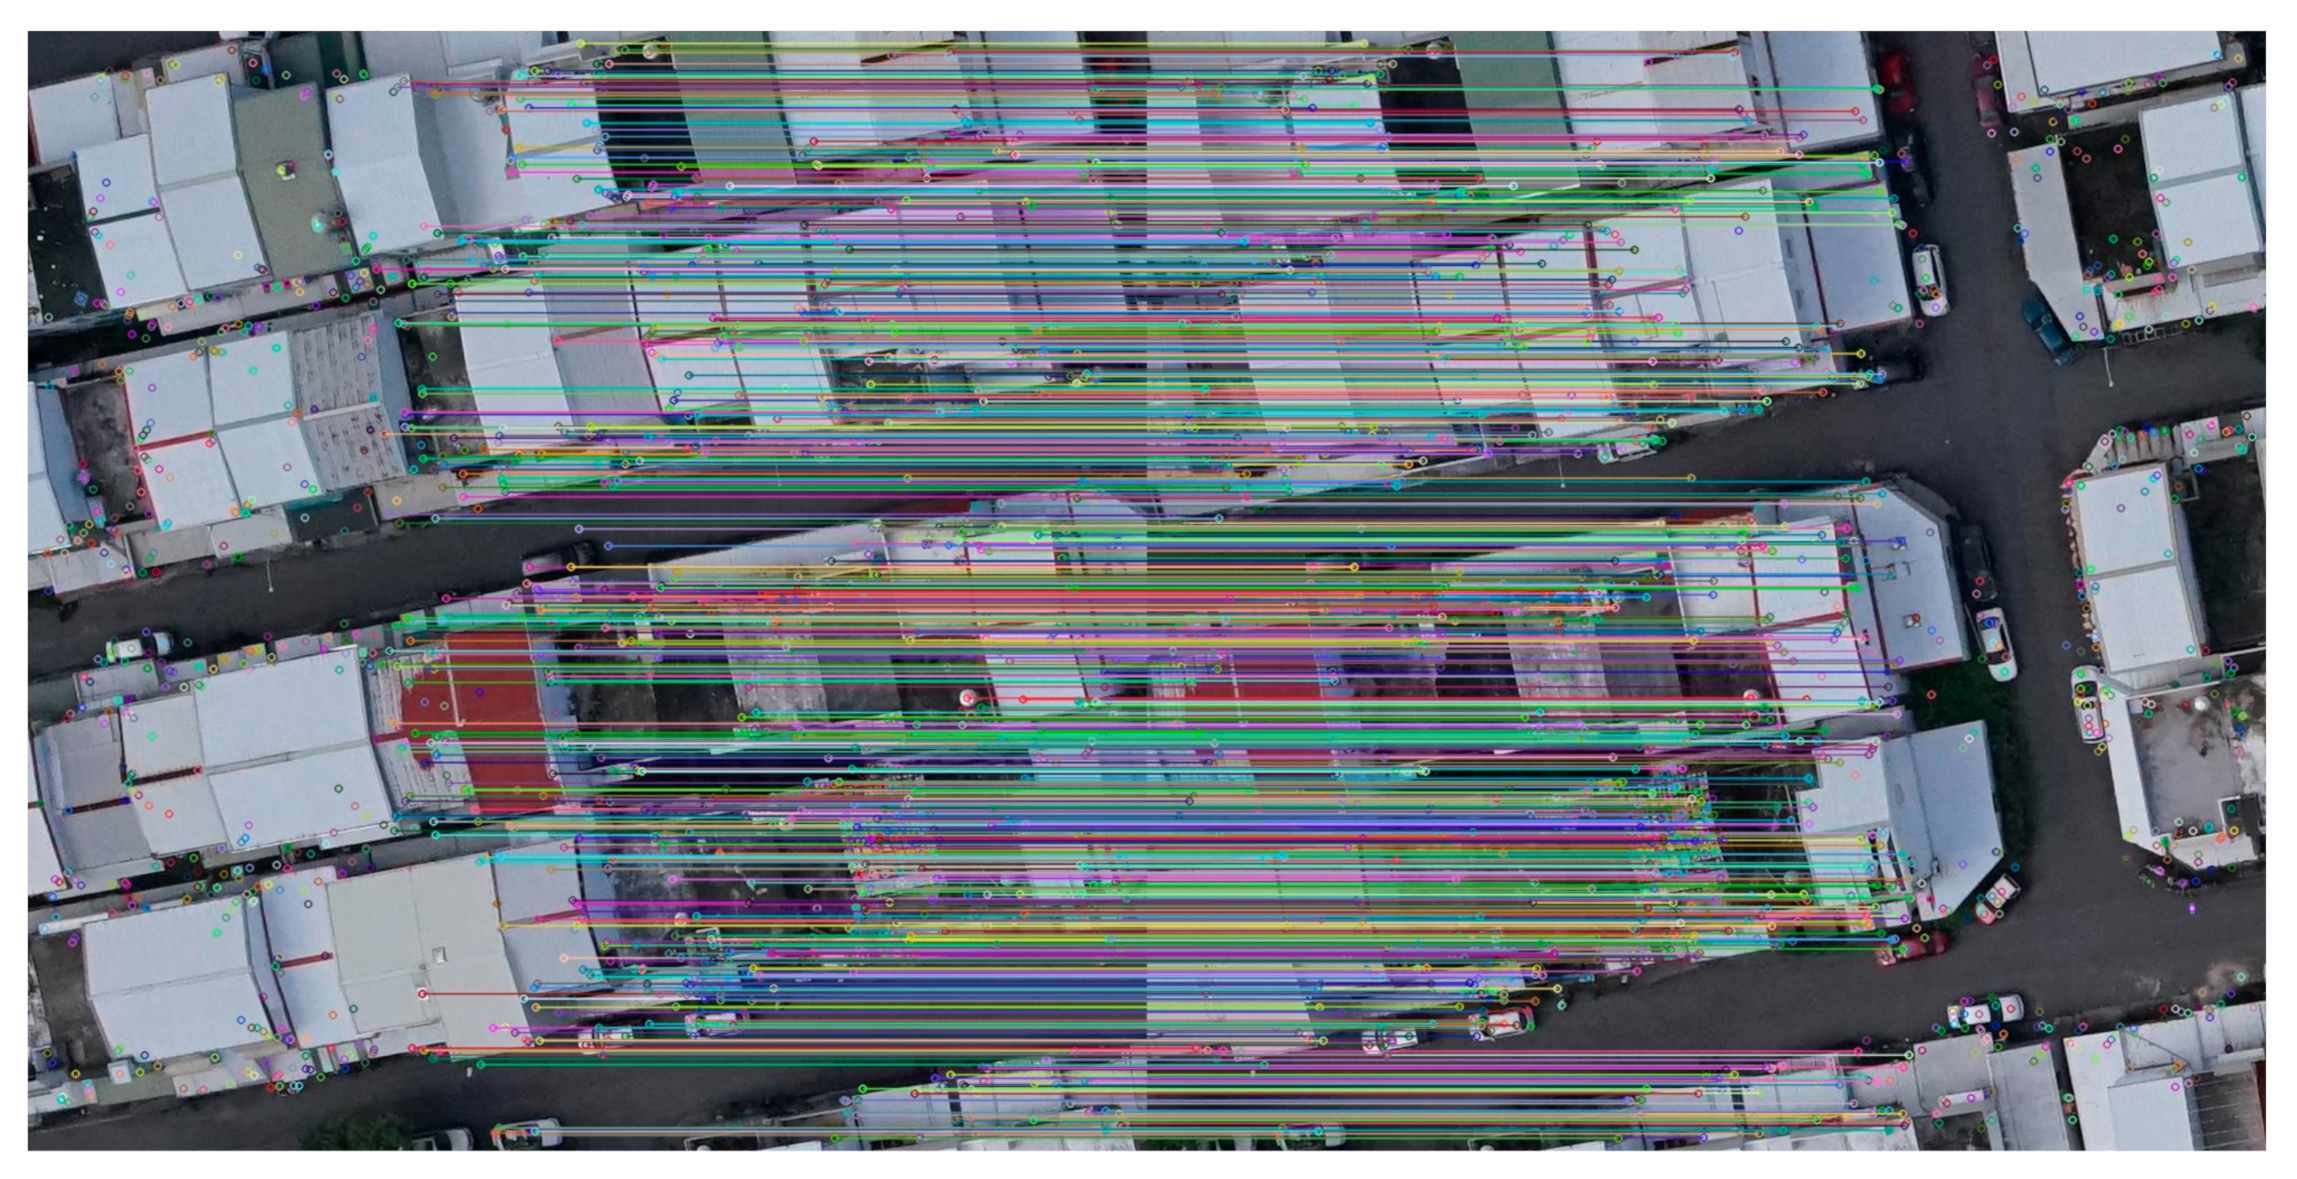
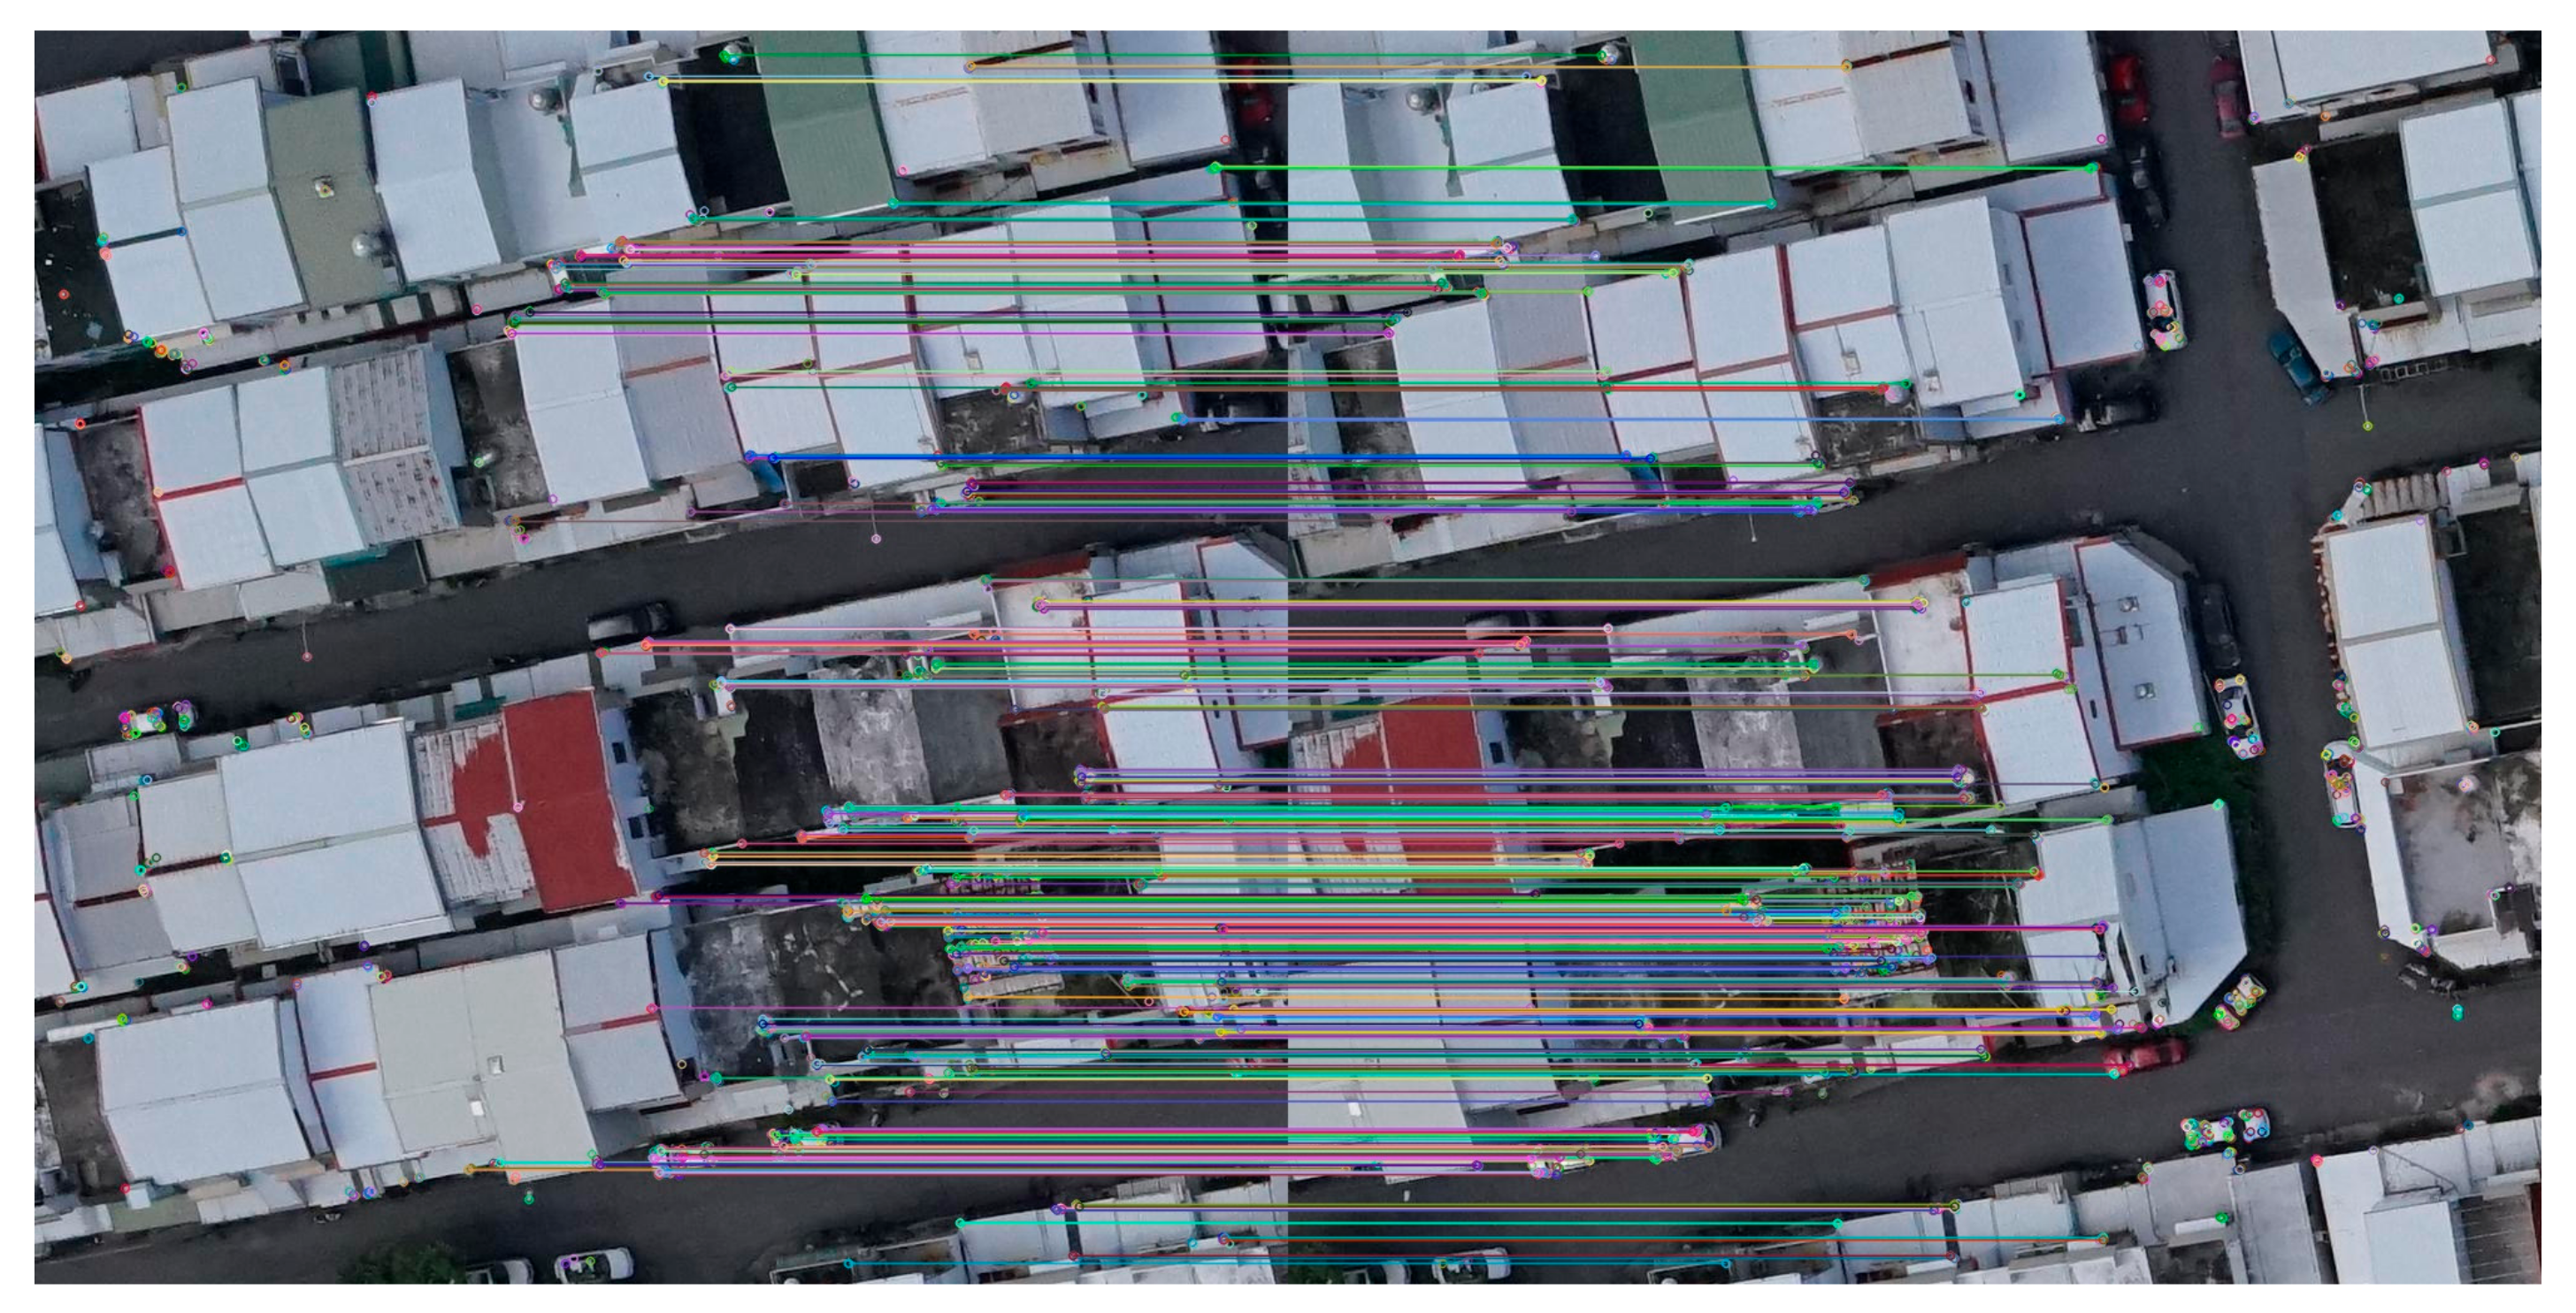
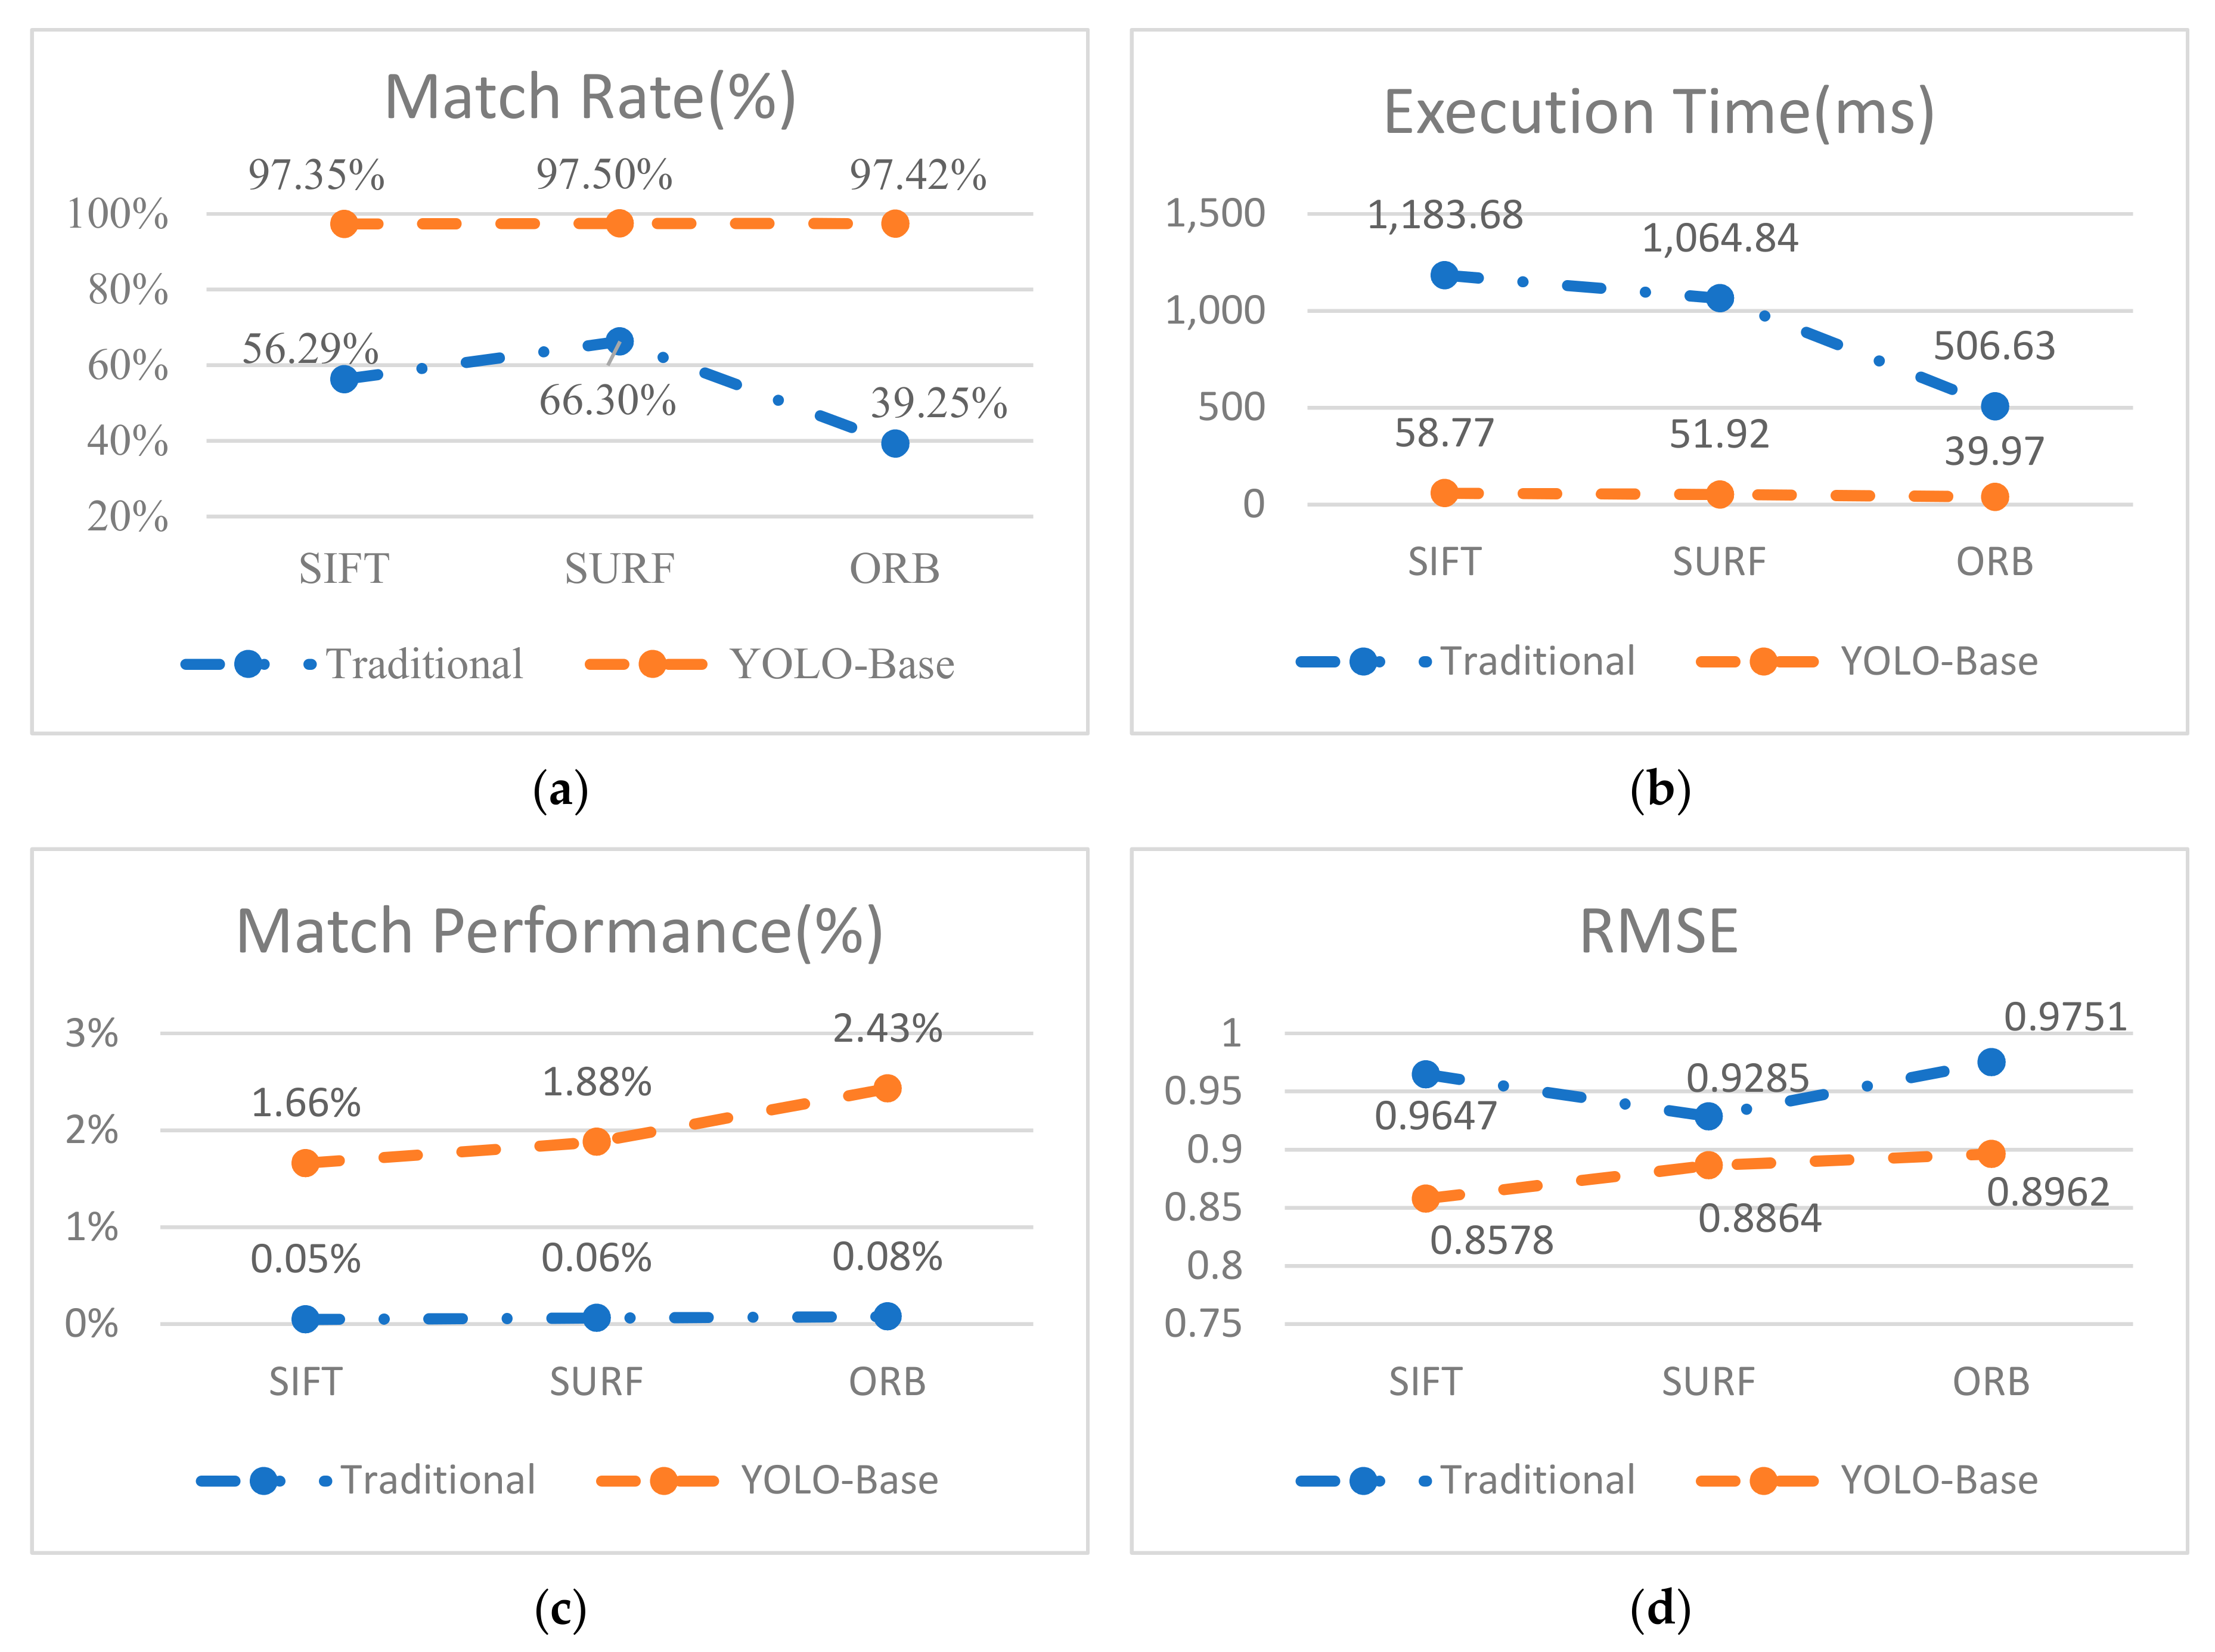
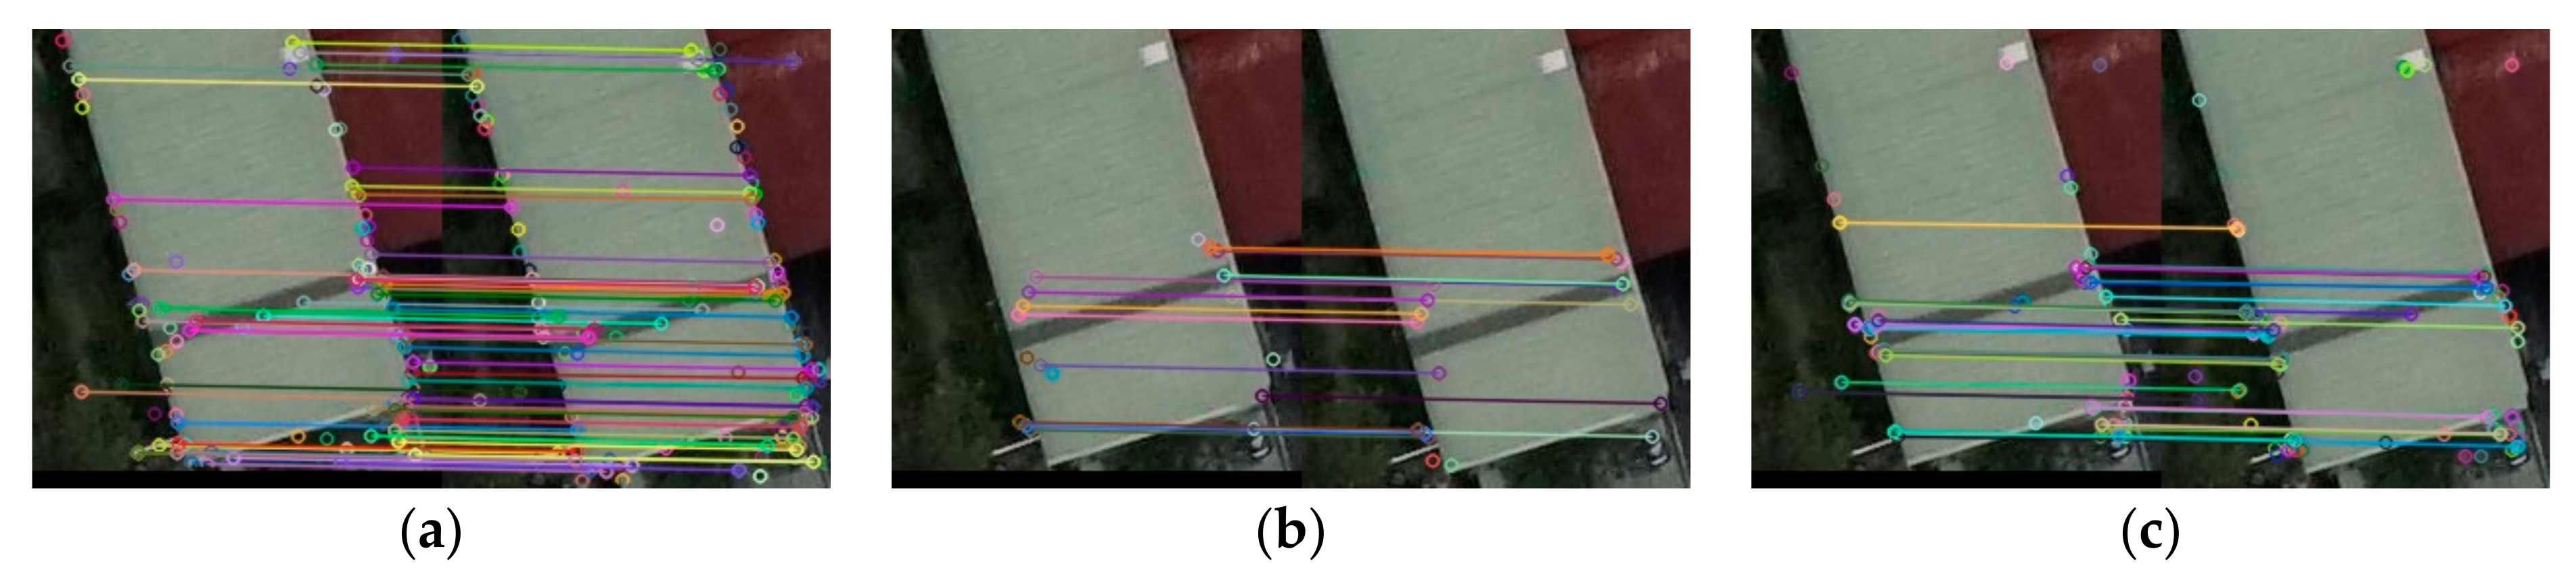
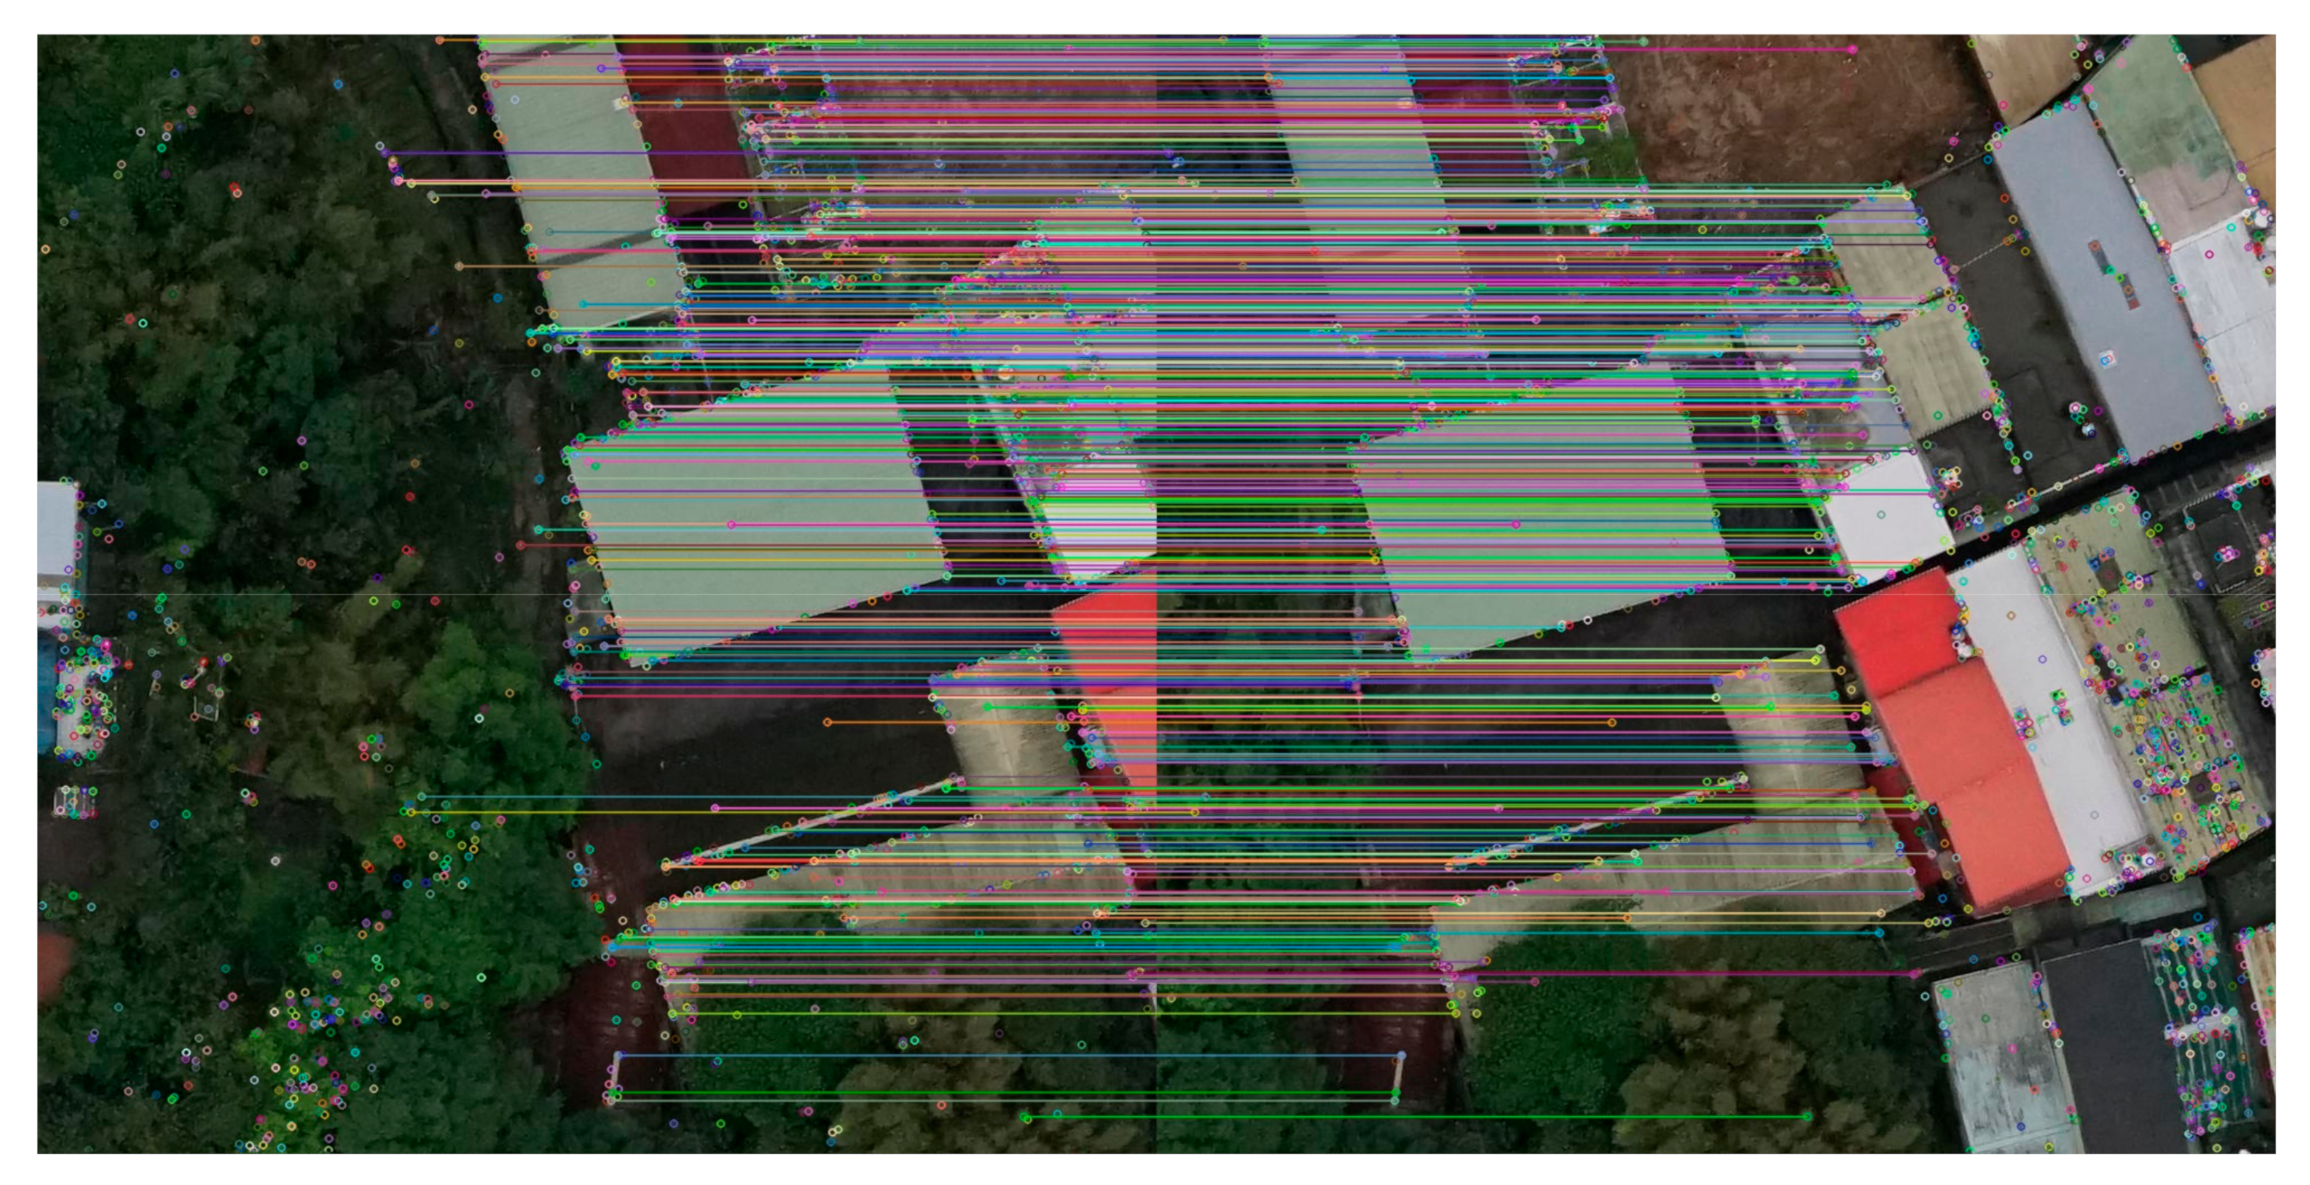
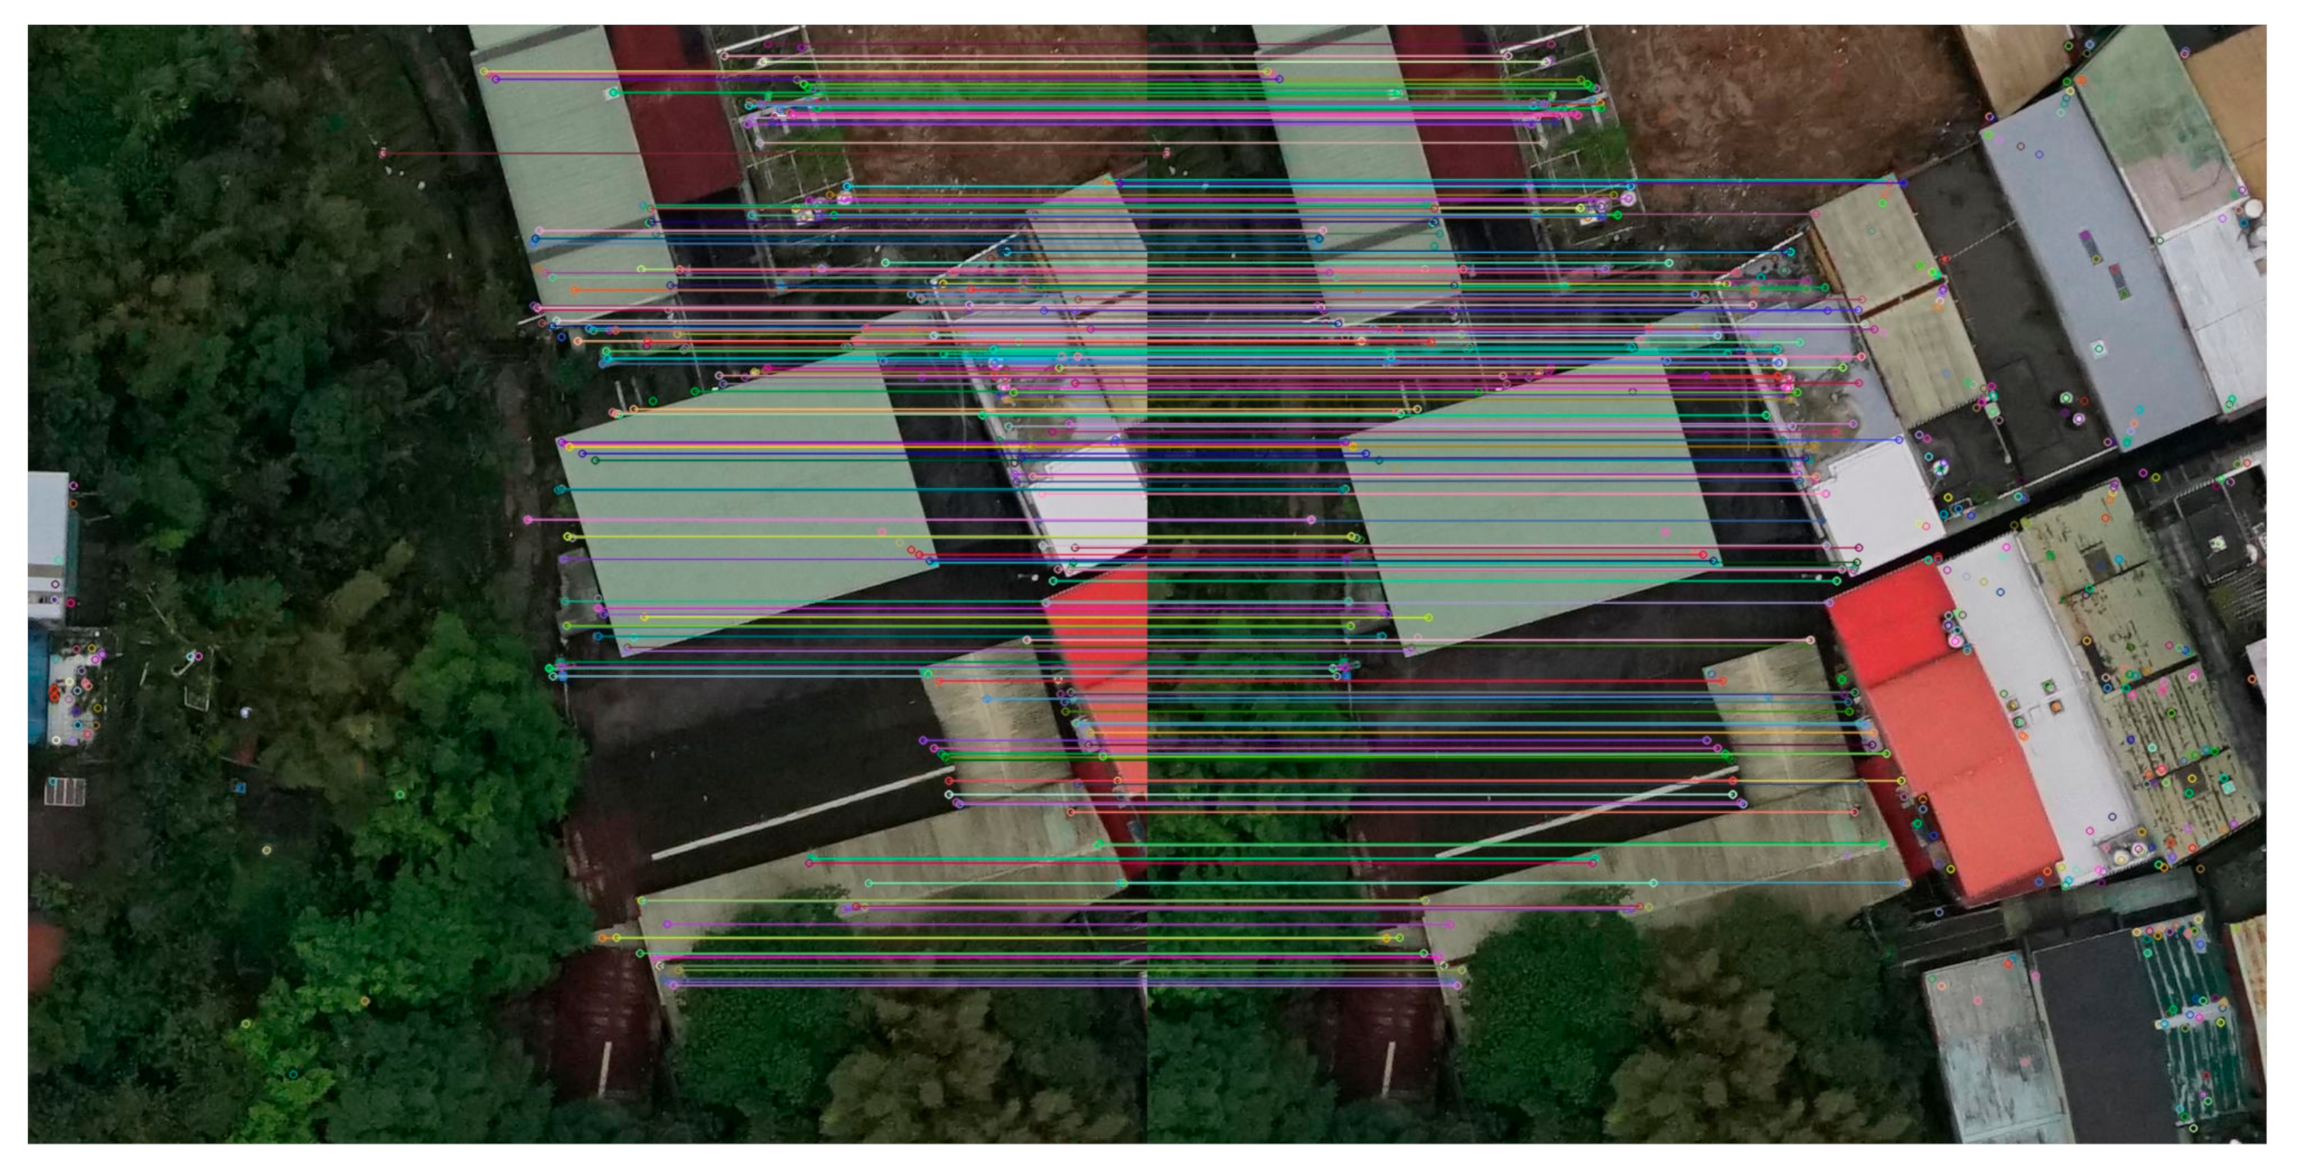
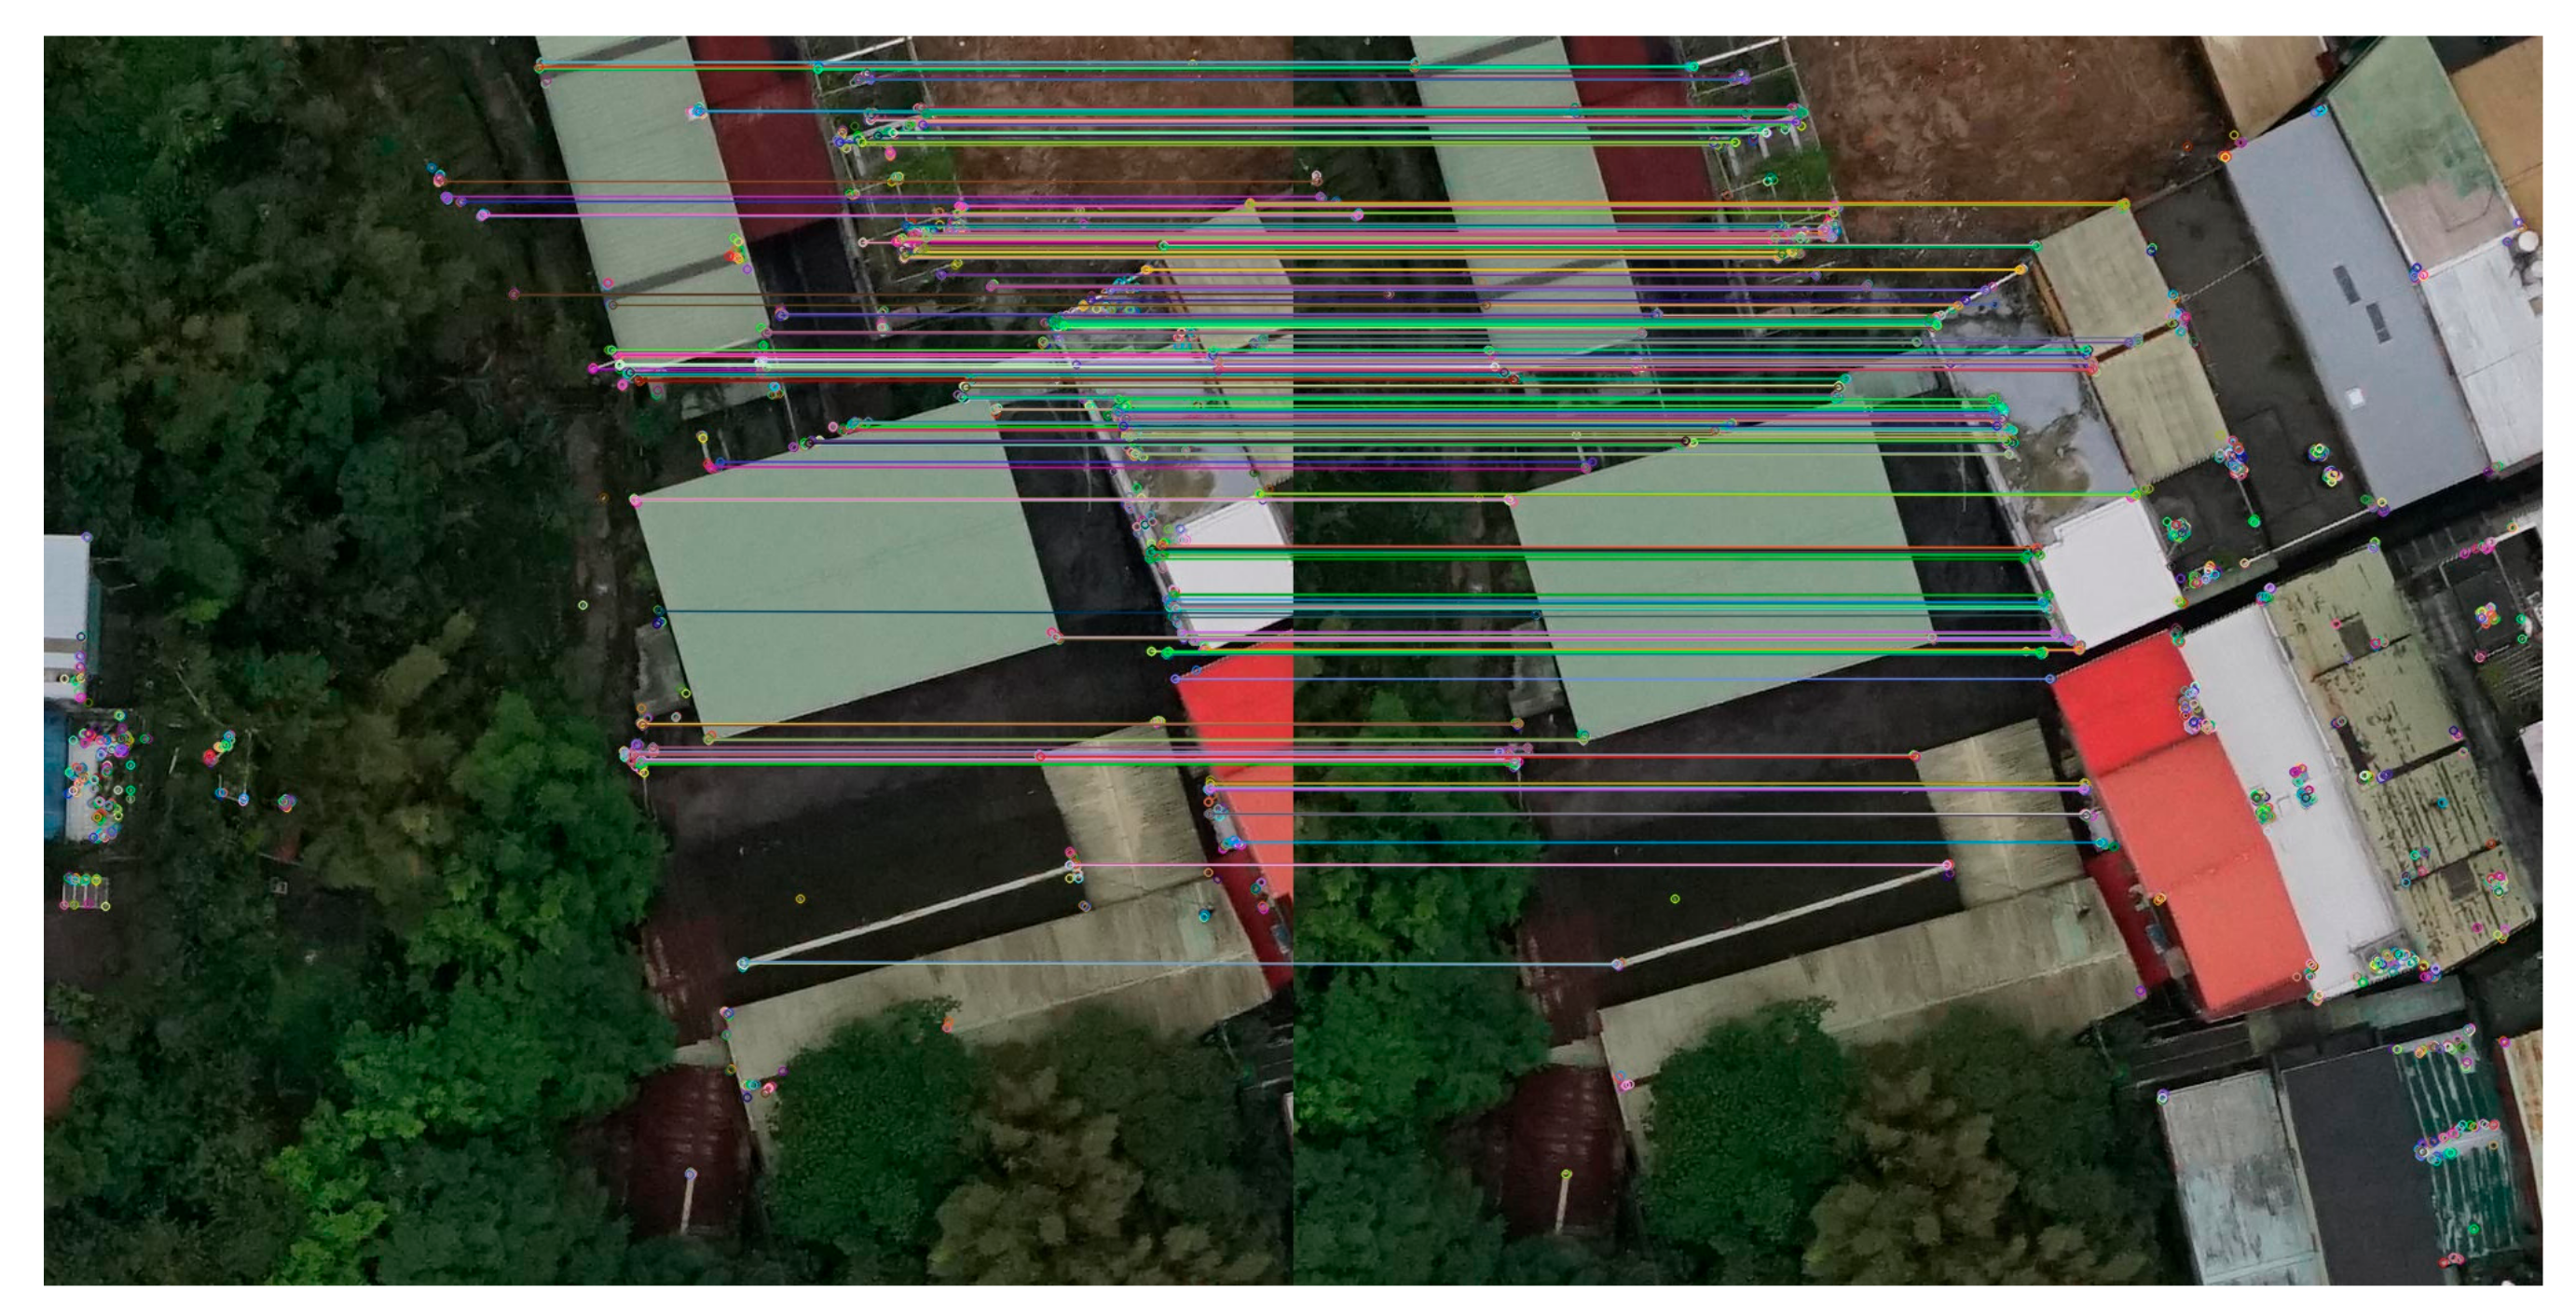
Structural similarity (SSIM) [
30] has been used to find the corresponding candidate regions between images in each image pair. Three traditional feature extraction and matching algorithms, SIFT [
2], SURF [
4], and ORB [
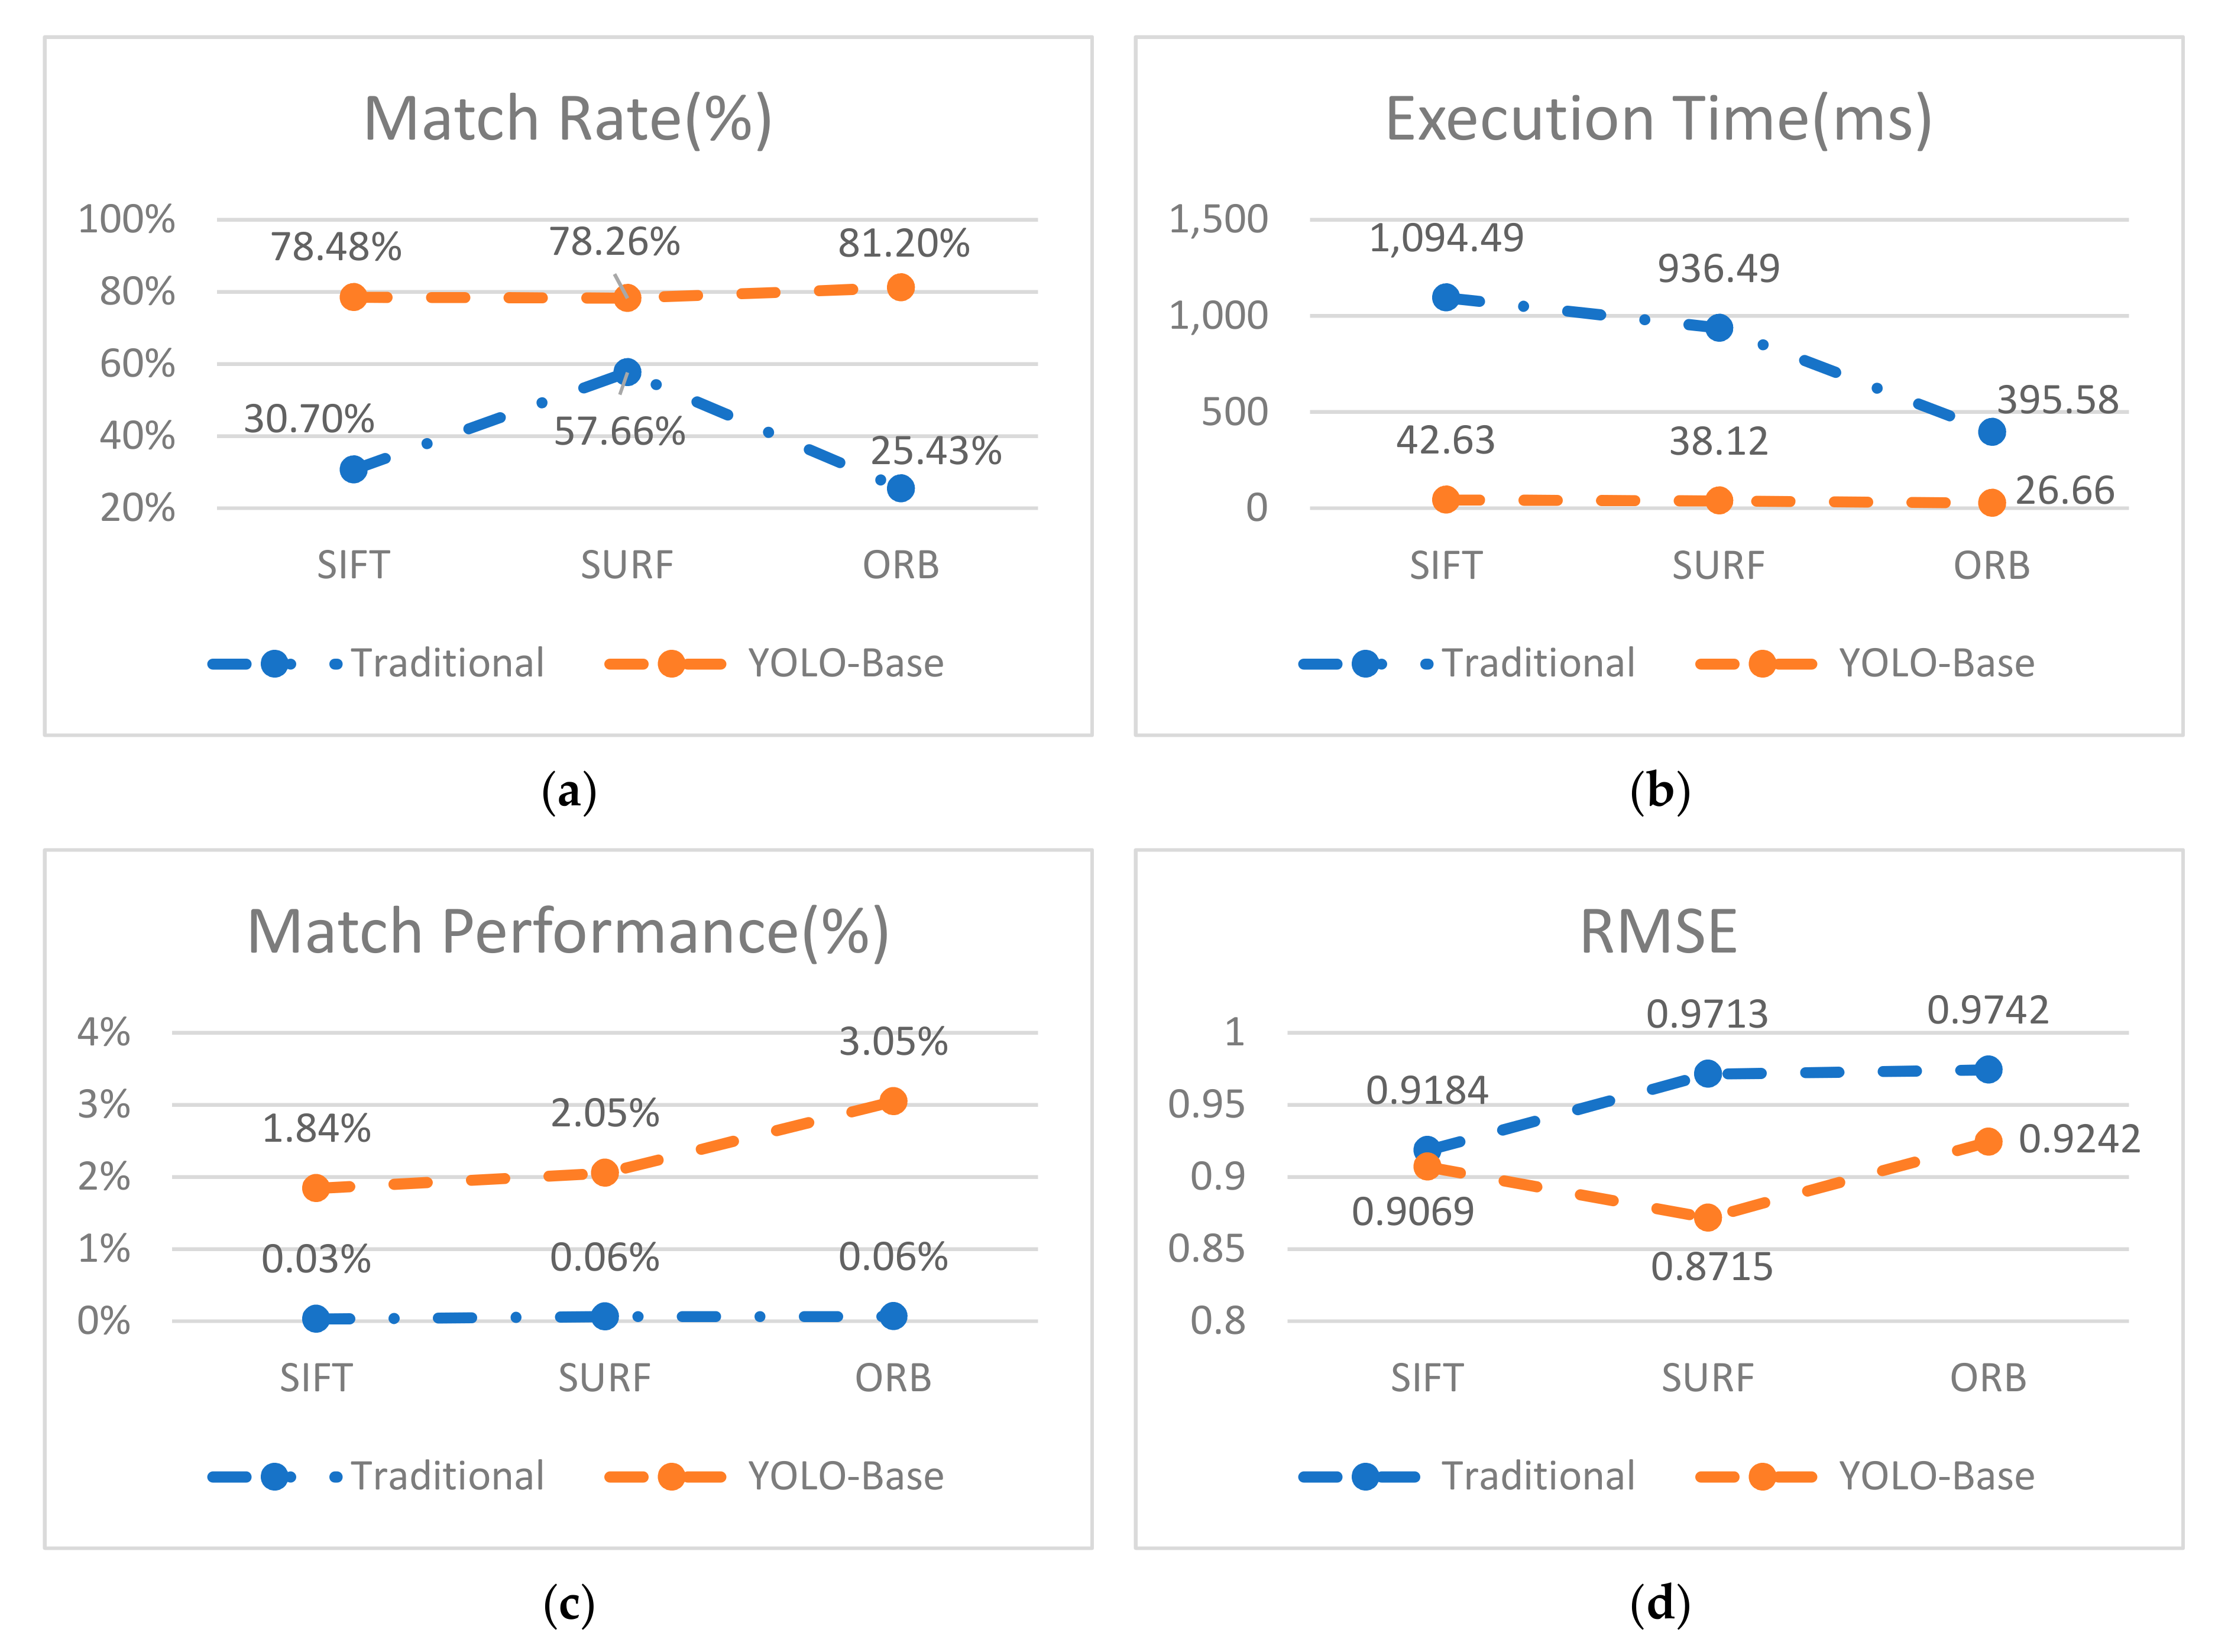
6] were then run for image matching within the corresponding candidate regions. The quality of the candidate region pair was evaluated by four evaluation methods, namely, execution time (T) [
31,
32], match rate (MR) [
31,
32,
33], match performance (MP) [
34], and root mean squared error (RMSE) [
35,
36,
37,
38]. The execution time (T) measures the algorithms efficiency.
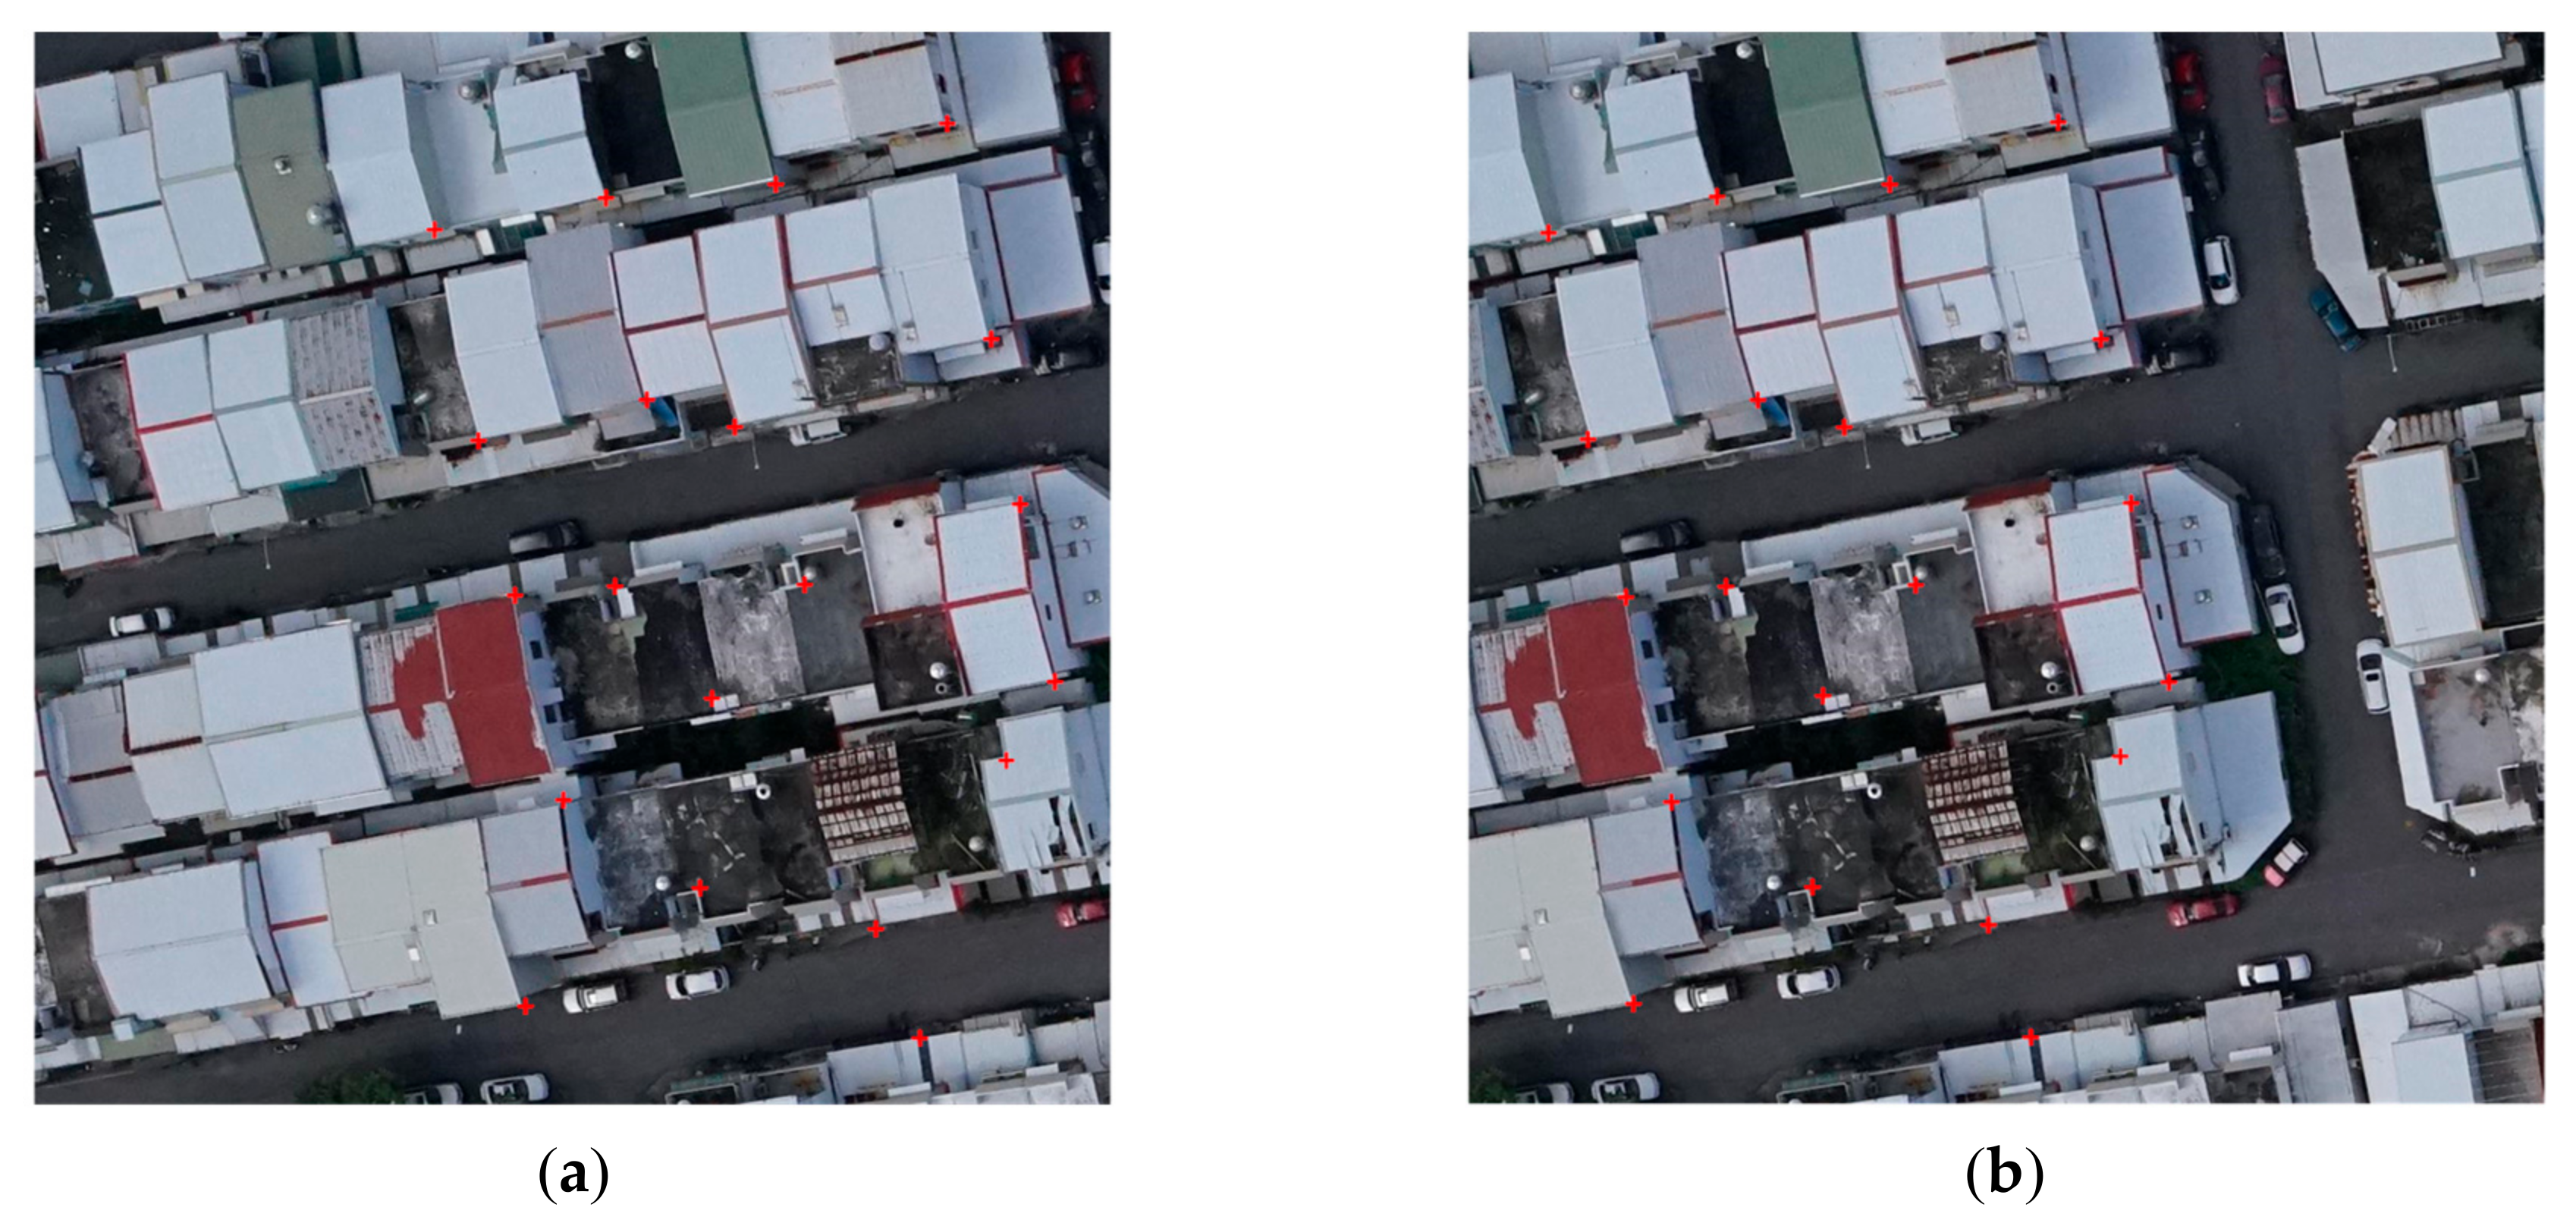
Matching rate (MR) is the ratio between the number of correct matching feature points and the total number of matching feature points detected by the algorithm. In Equation (14), refers to the numbers of keypoints detected in the first and second images respectively, and is the number of matches between these two series of interest points. In Equation (15), we using match performance (MP) to understand the matching status per unit time. In Equation (16), k is the filtered match pair number, where , , and and
are the spatial coordinates of the corresponding matching points on the registration image and the reference image, respectively. A smaller RMSE means a higher registration accuracy, and RMSE < 1 means that the registration accuracy the sub-pixel level.

 ,
, 


