
Understanding the Linkage between Urban Growth and Land Surface Temperature—A Case Study of Bangalore City, India

 ,
,  ,
,  ,
,  ,
, 
 ,
,  ,
, 
Abstract
:
1. Introduction
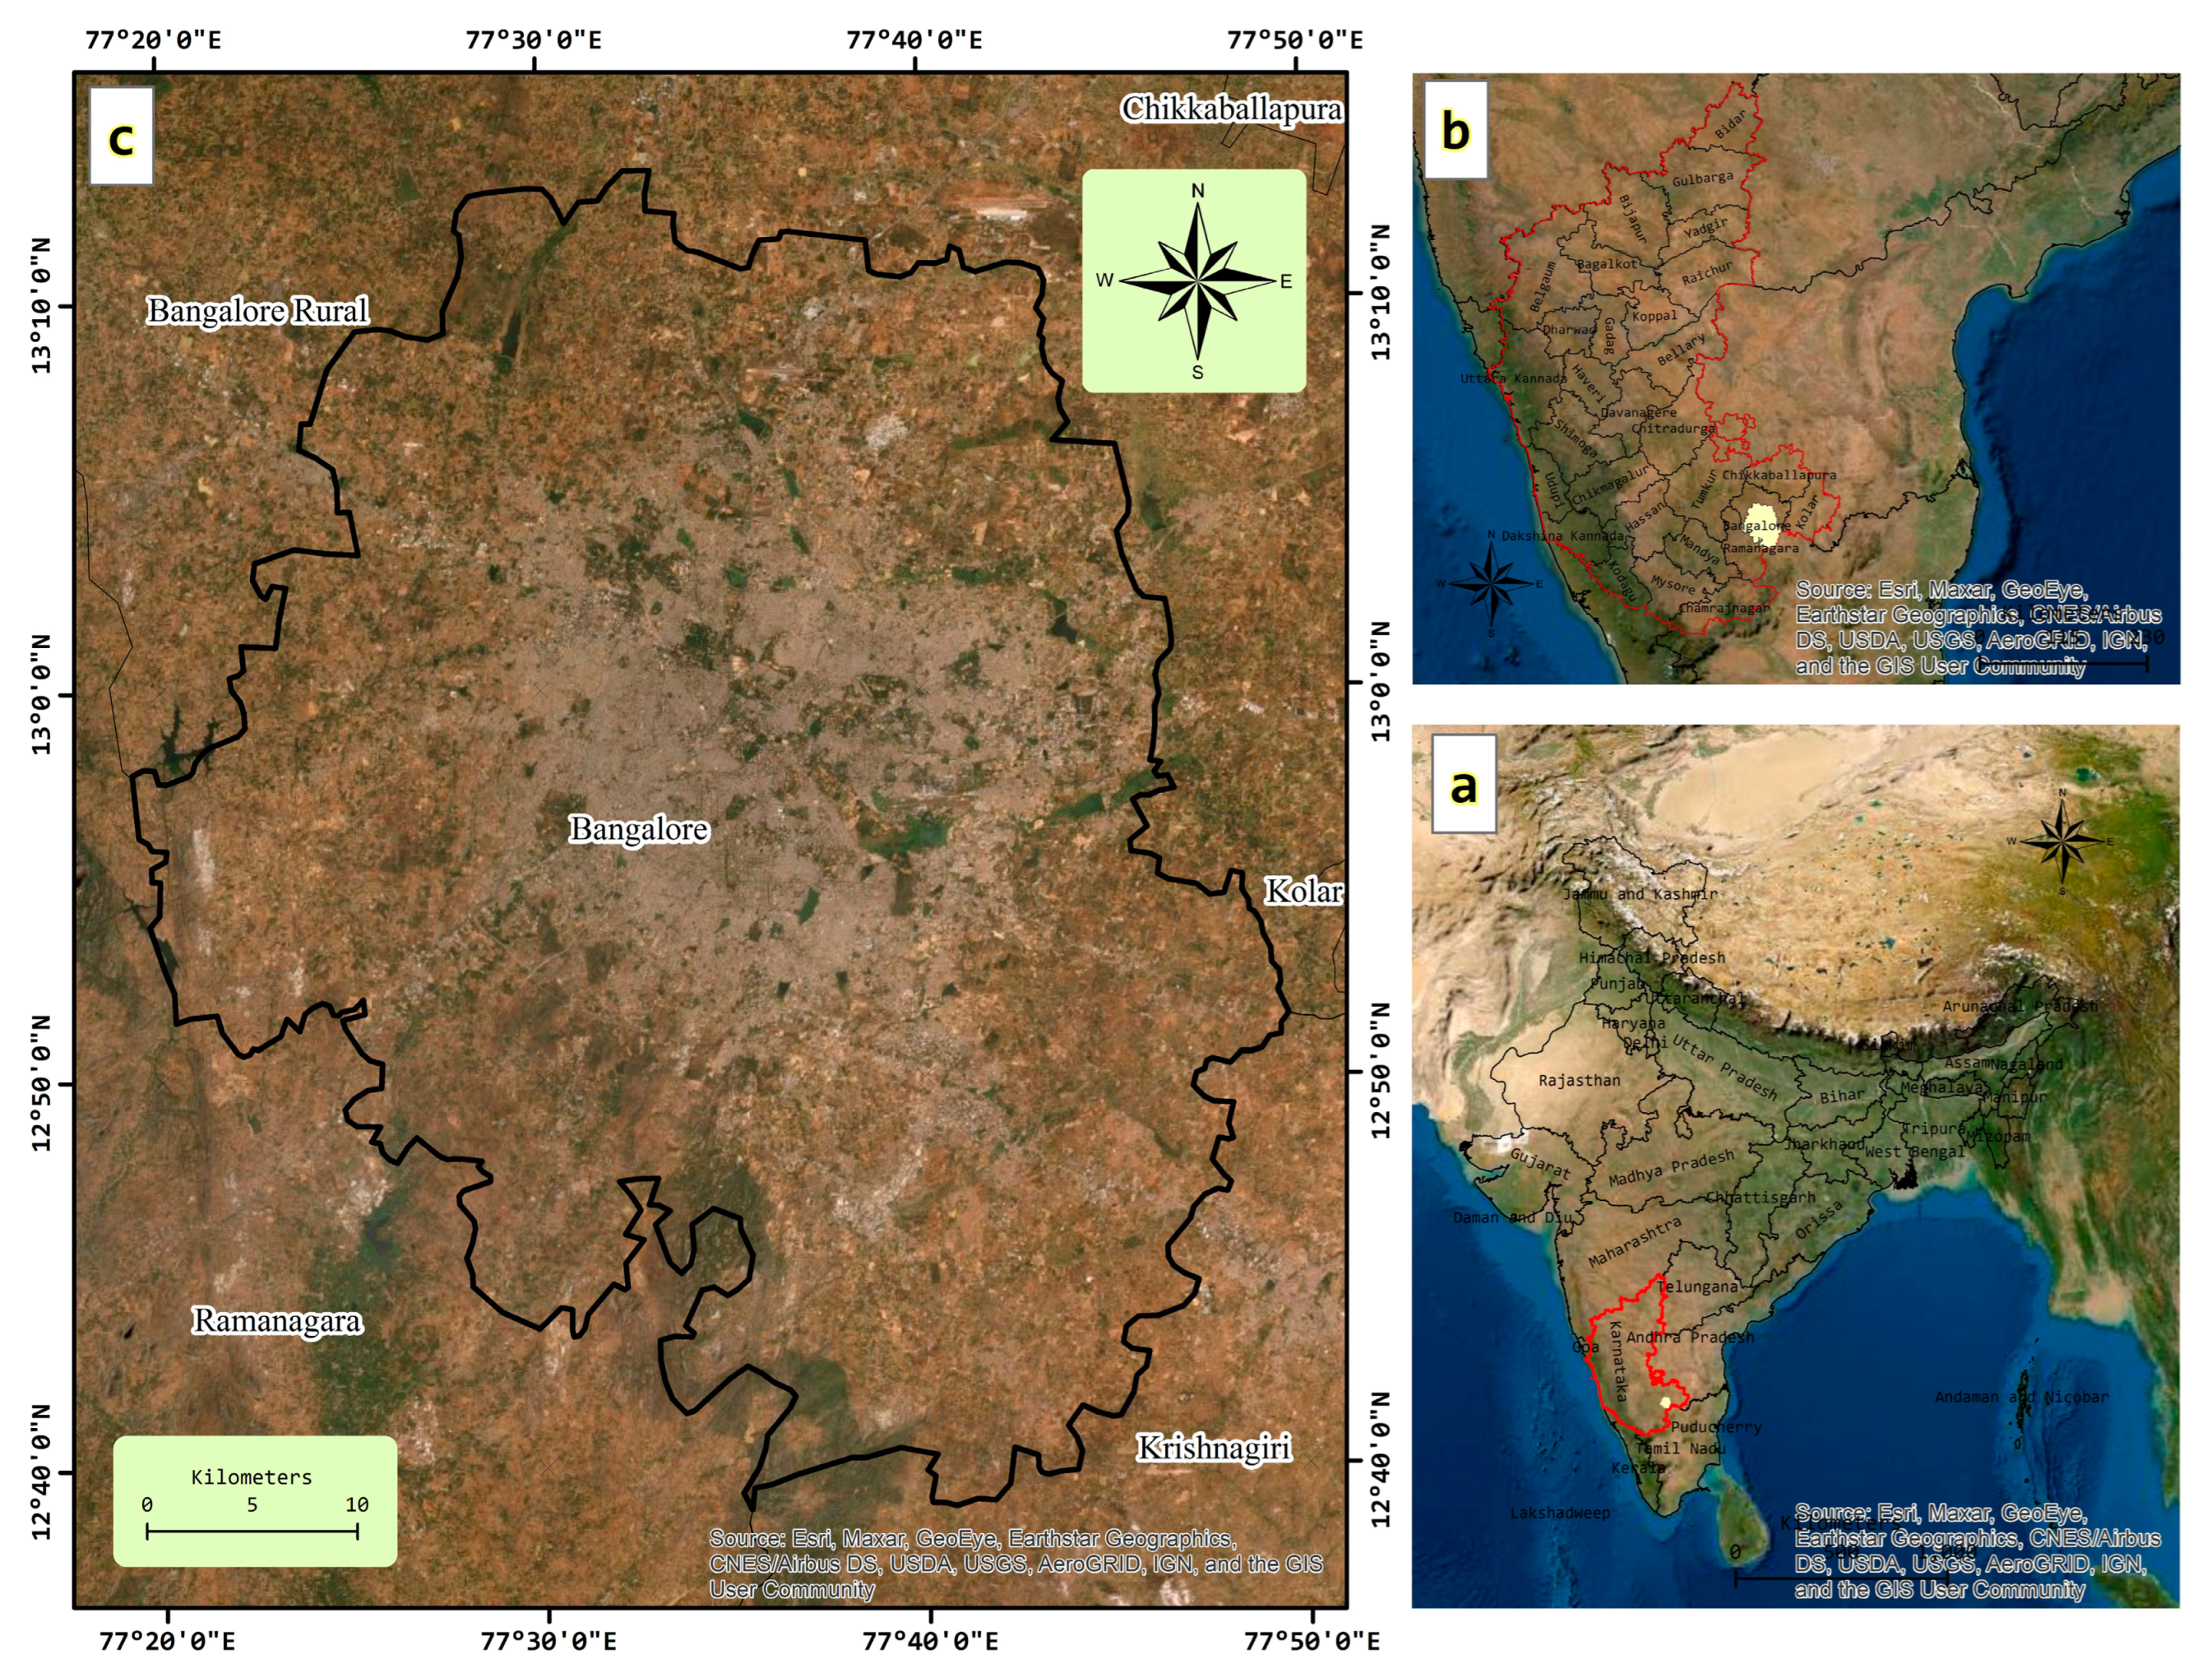
2. Study Area
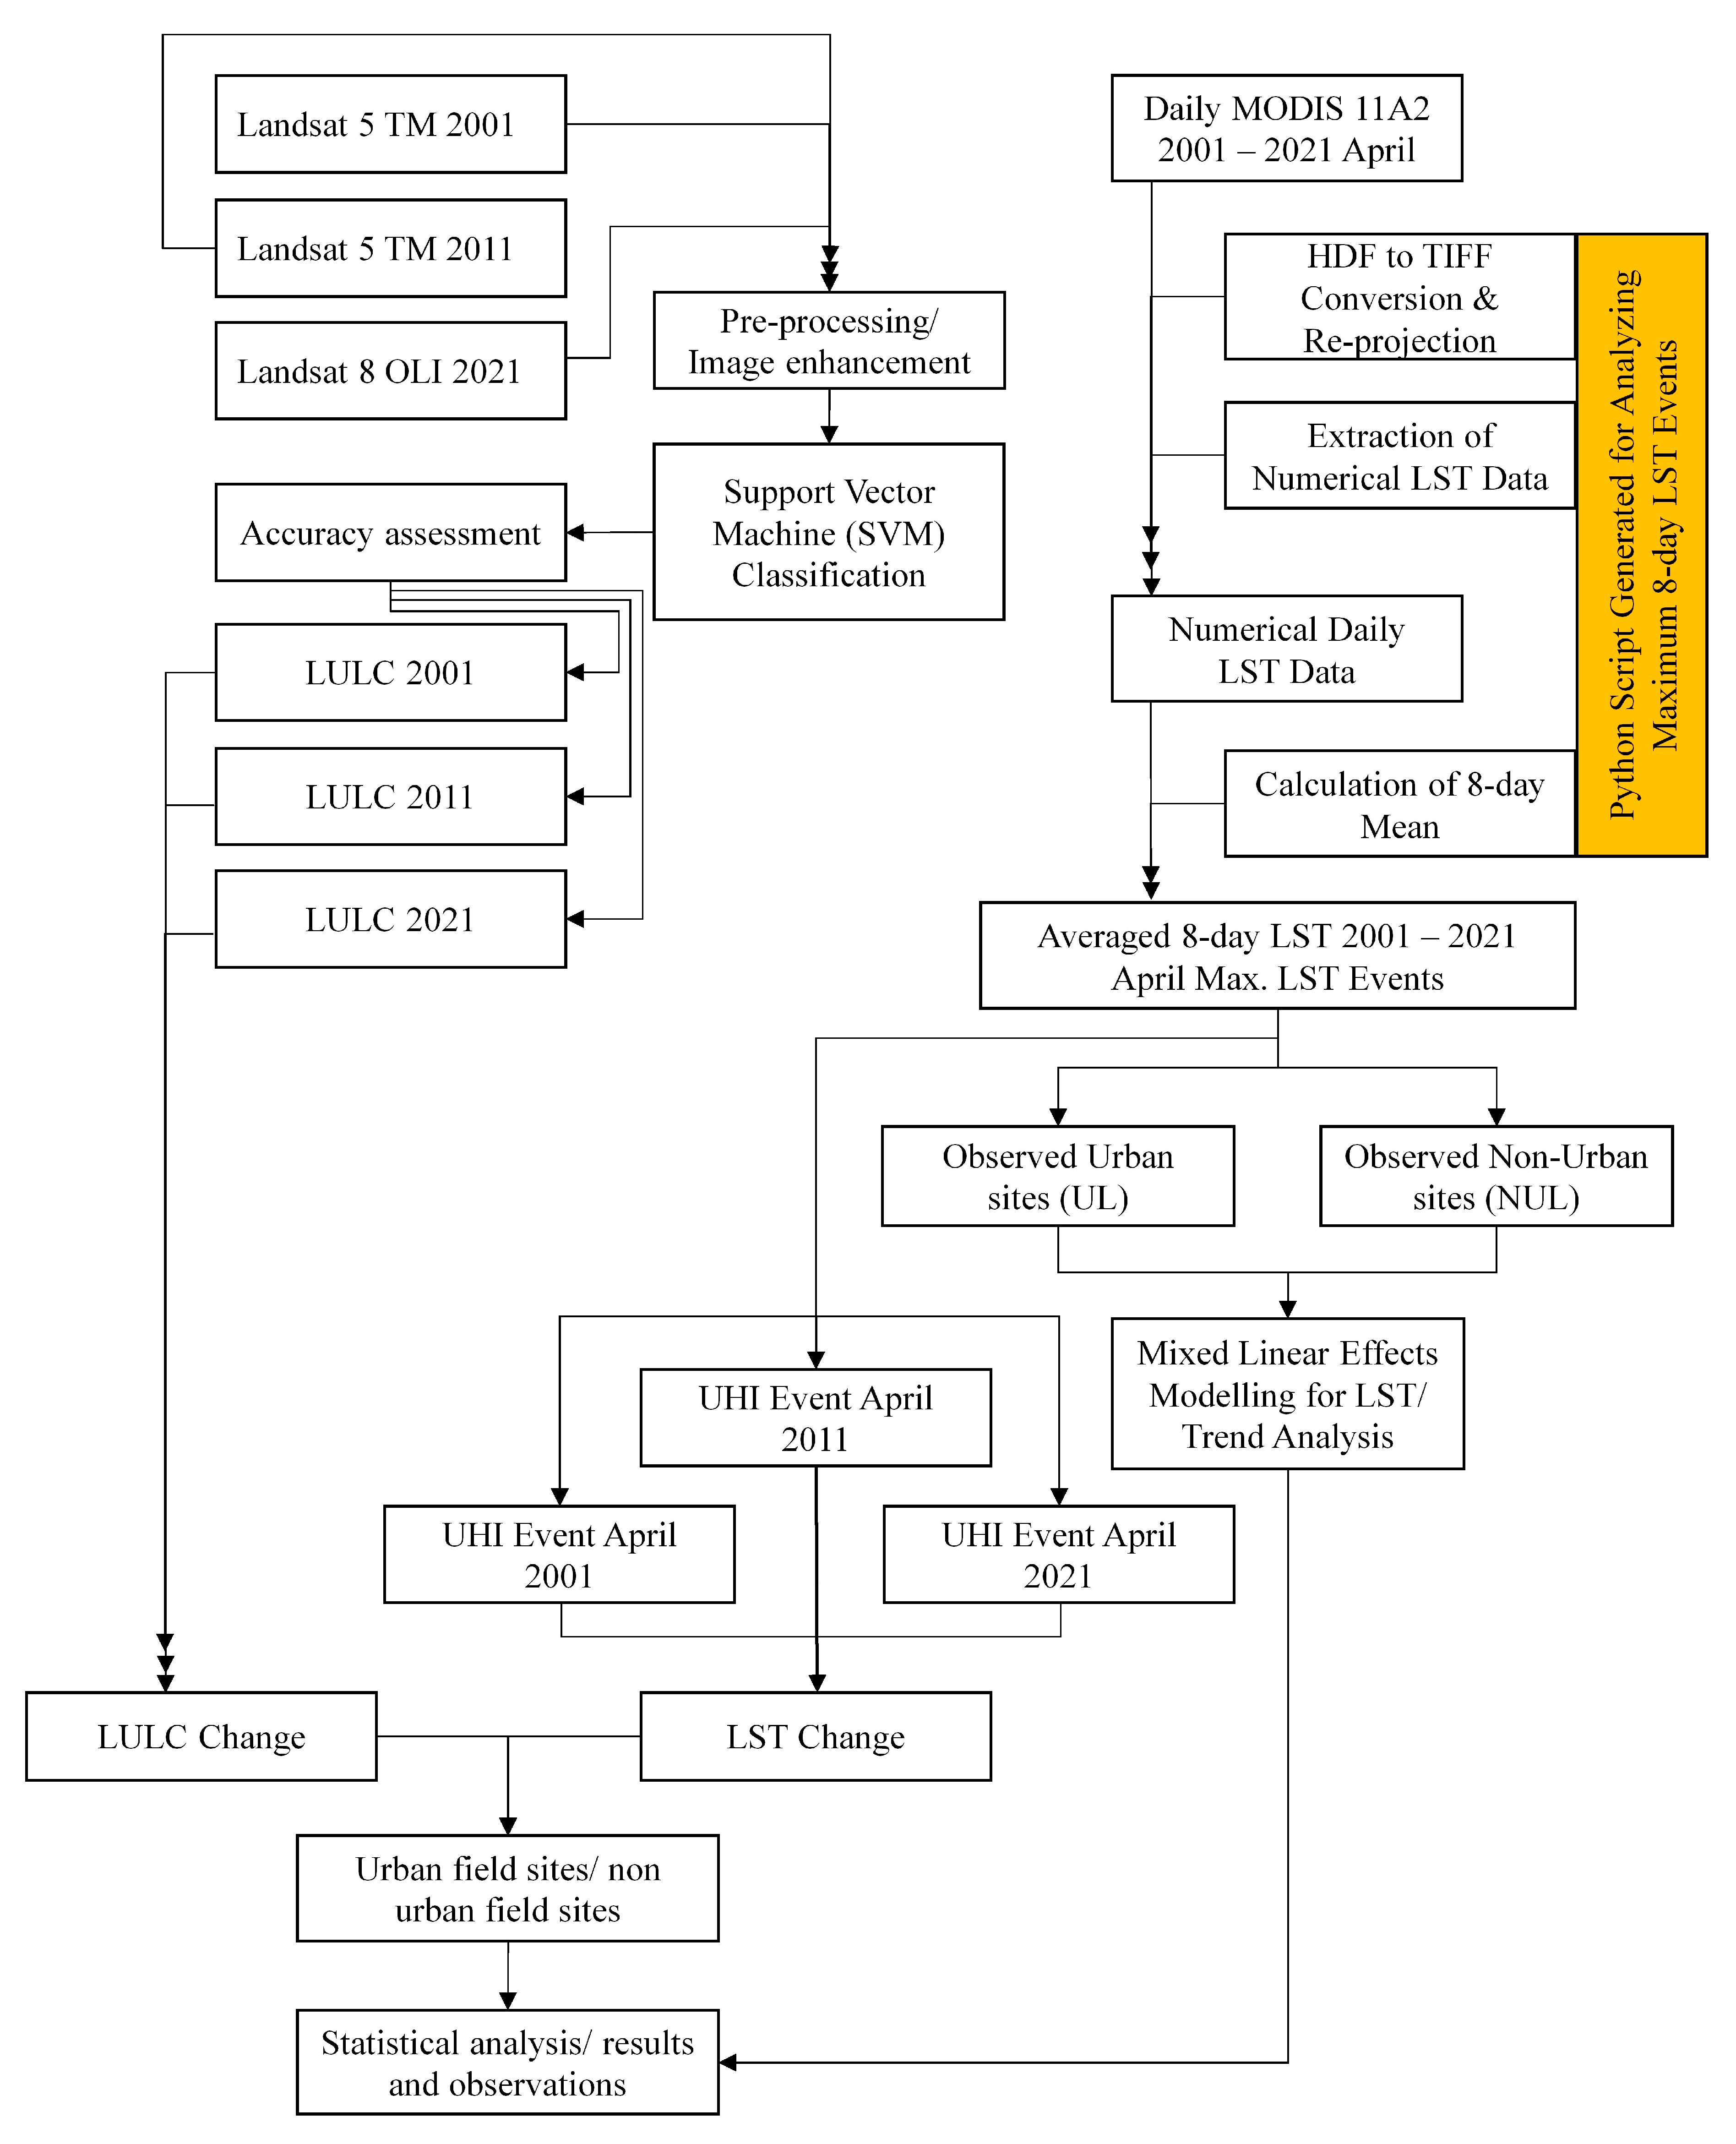
3. Methodology
3.1. Land Use and Land Cover Classification
3.2. Land Surface Temperature (MODIS) and LULC
4. Results and Discussion
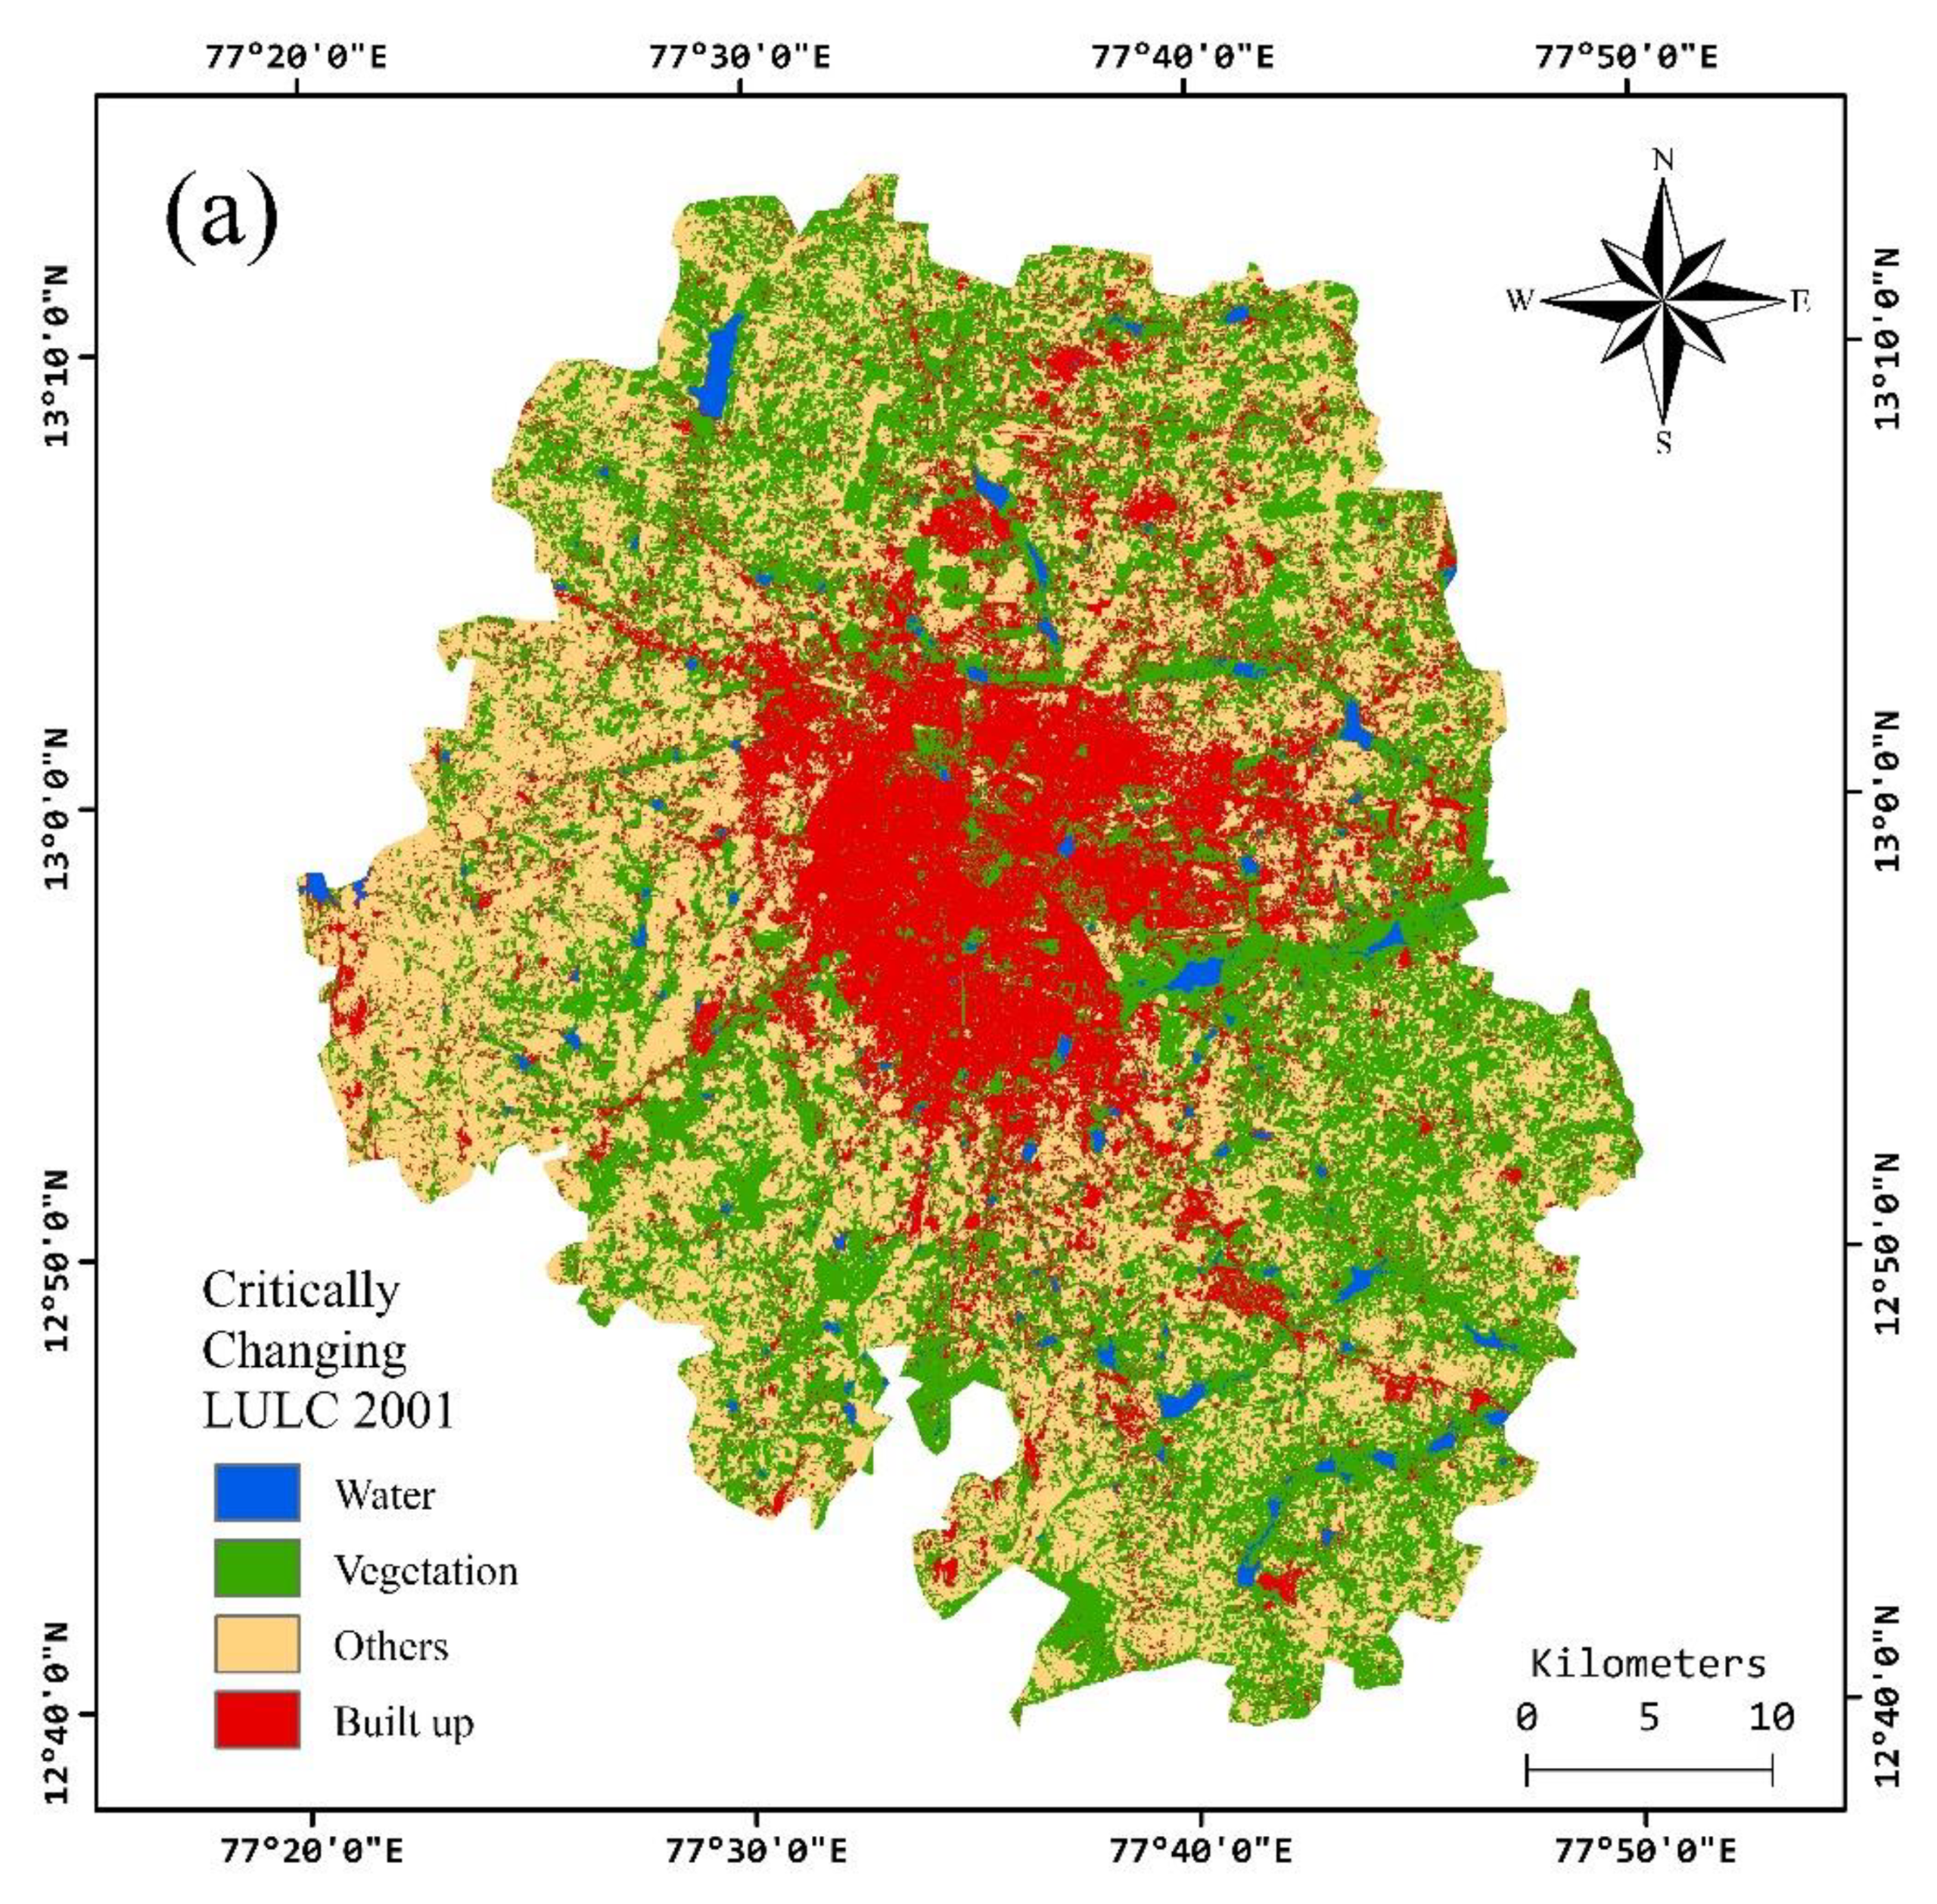
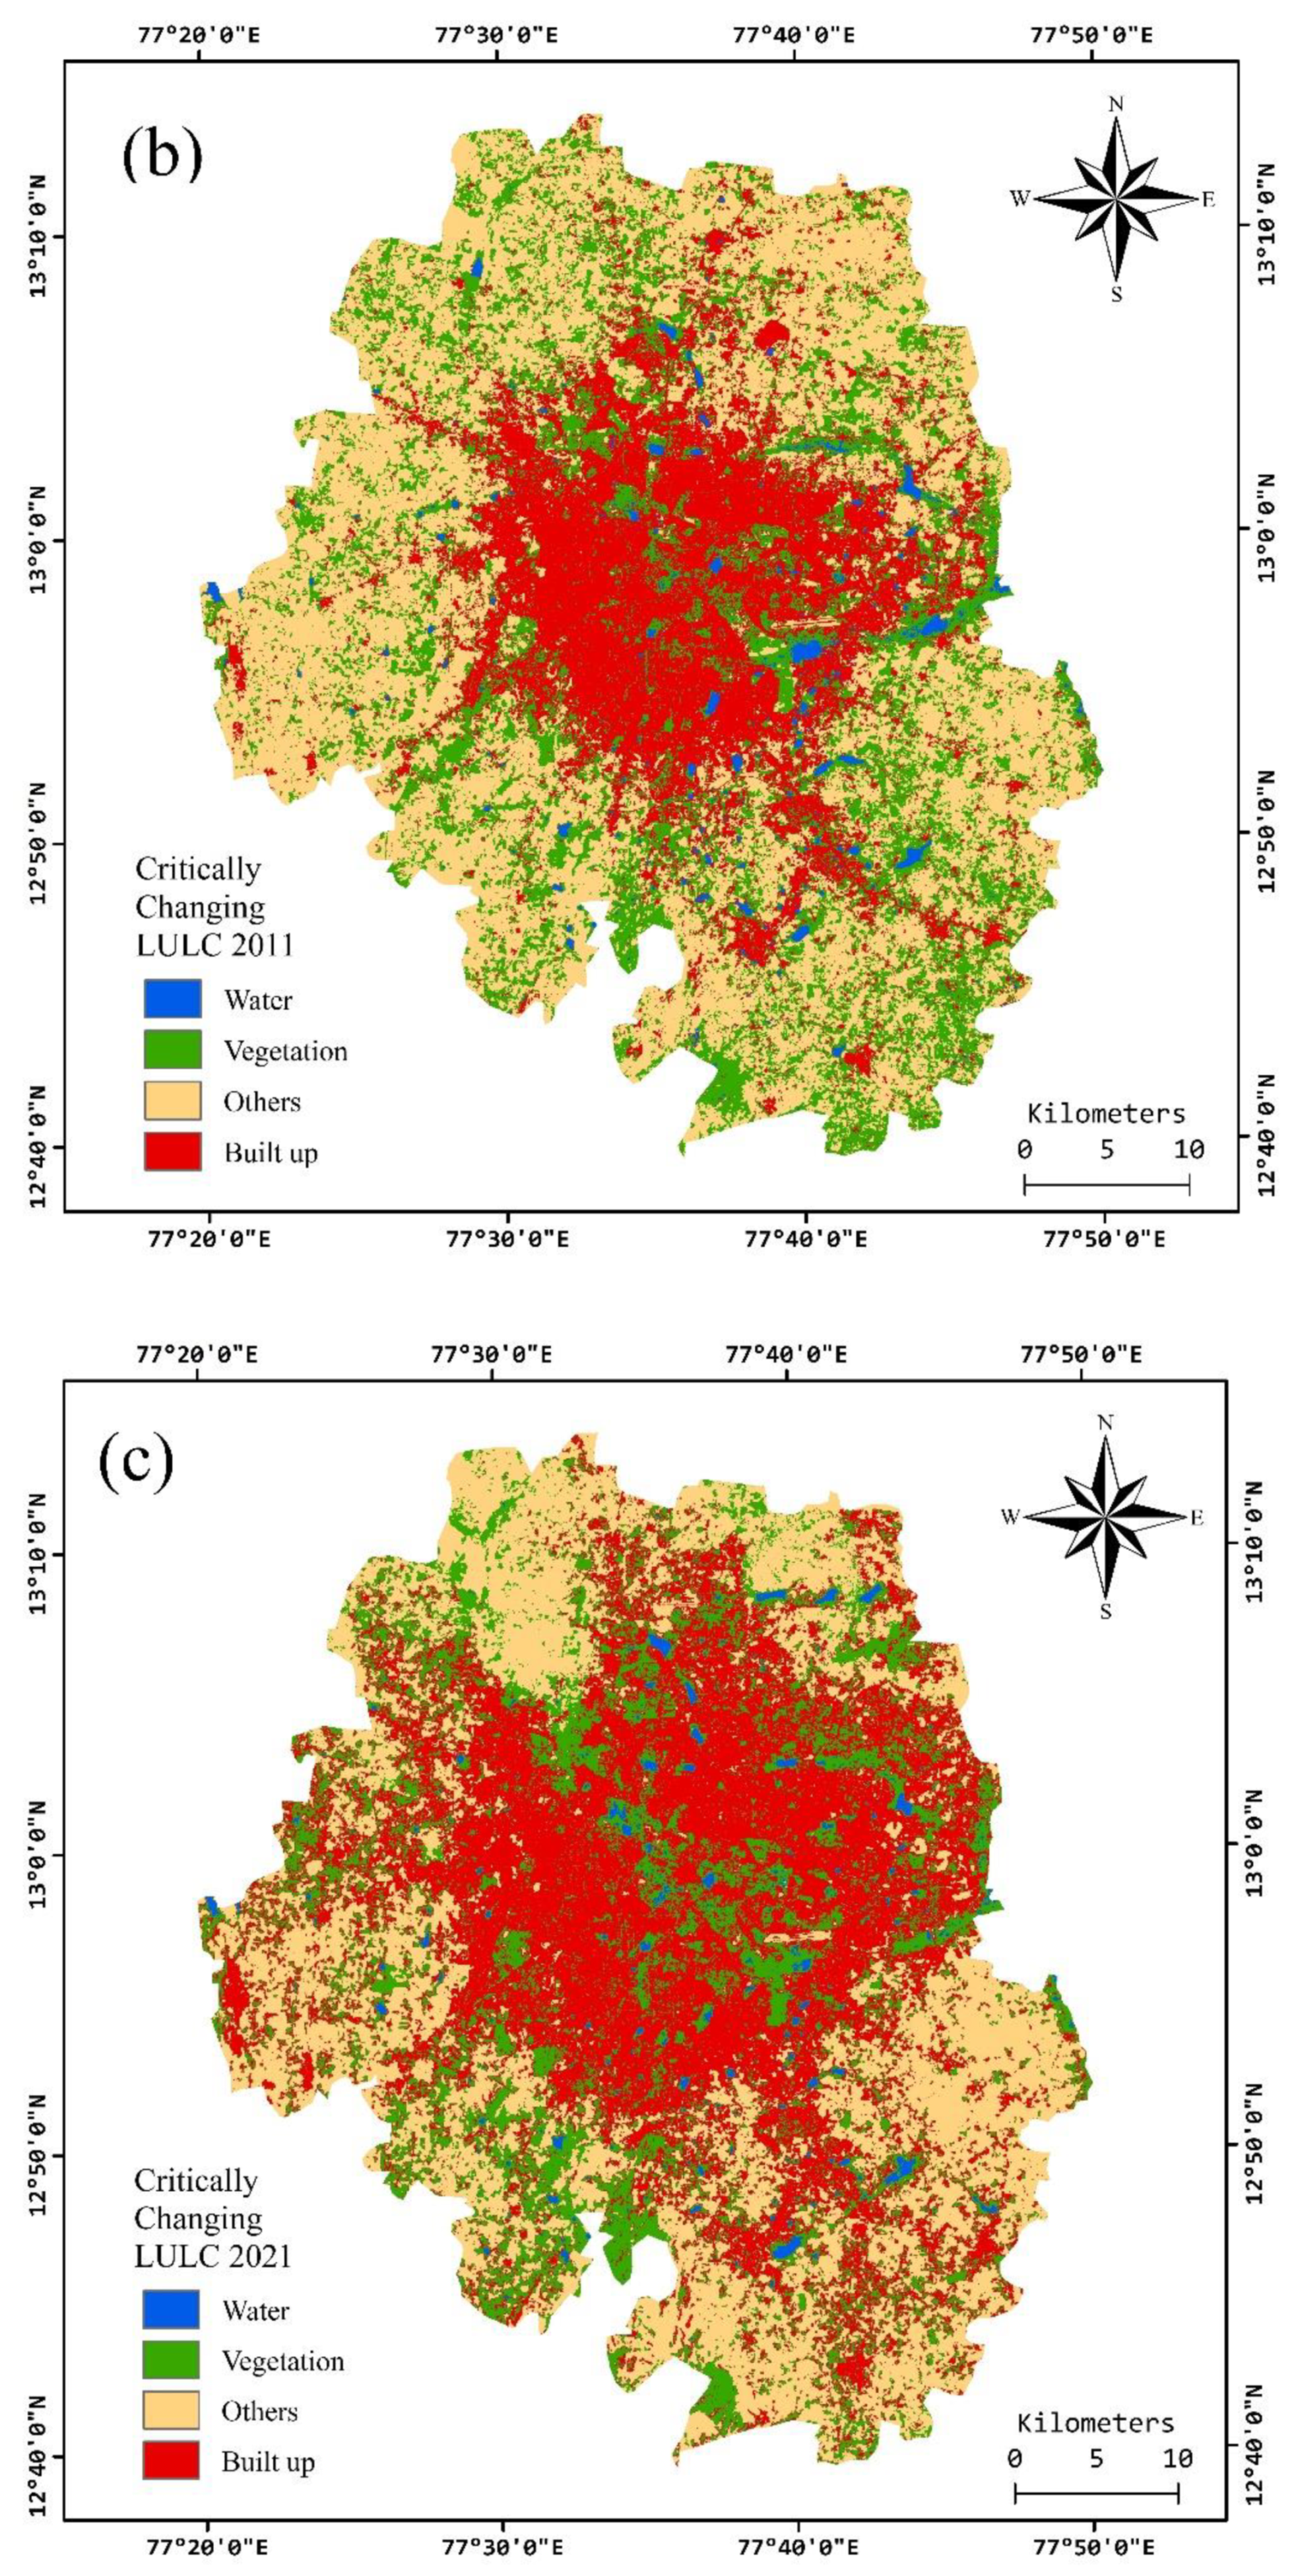
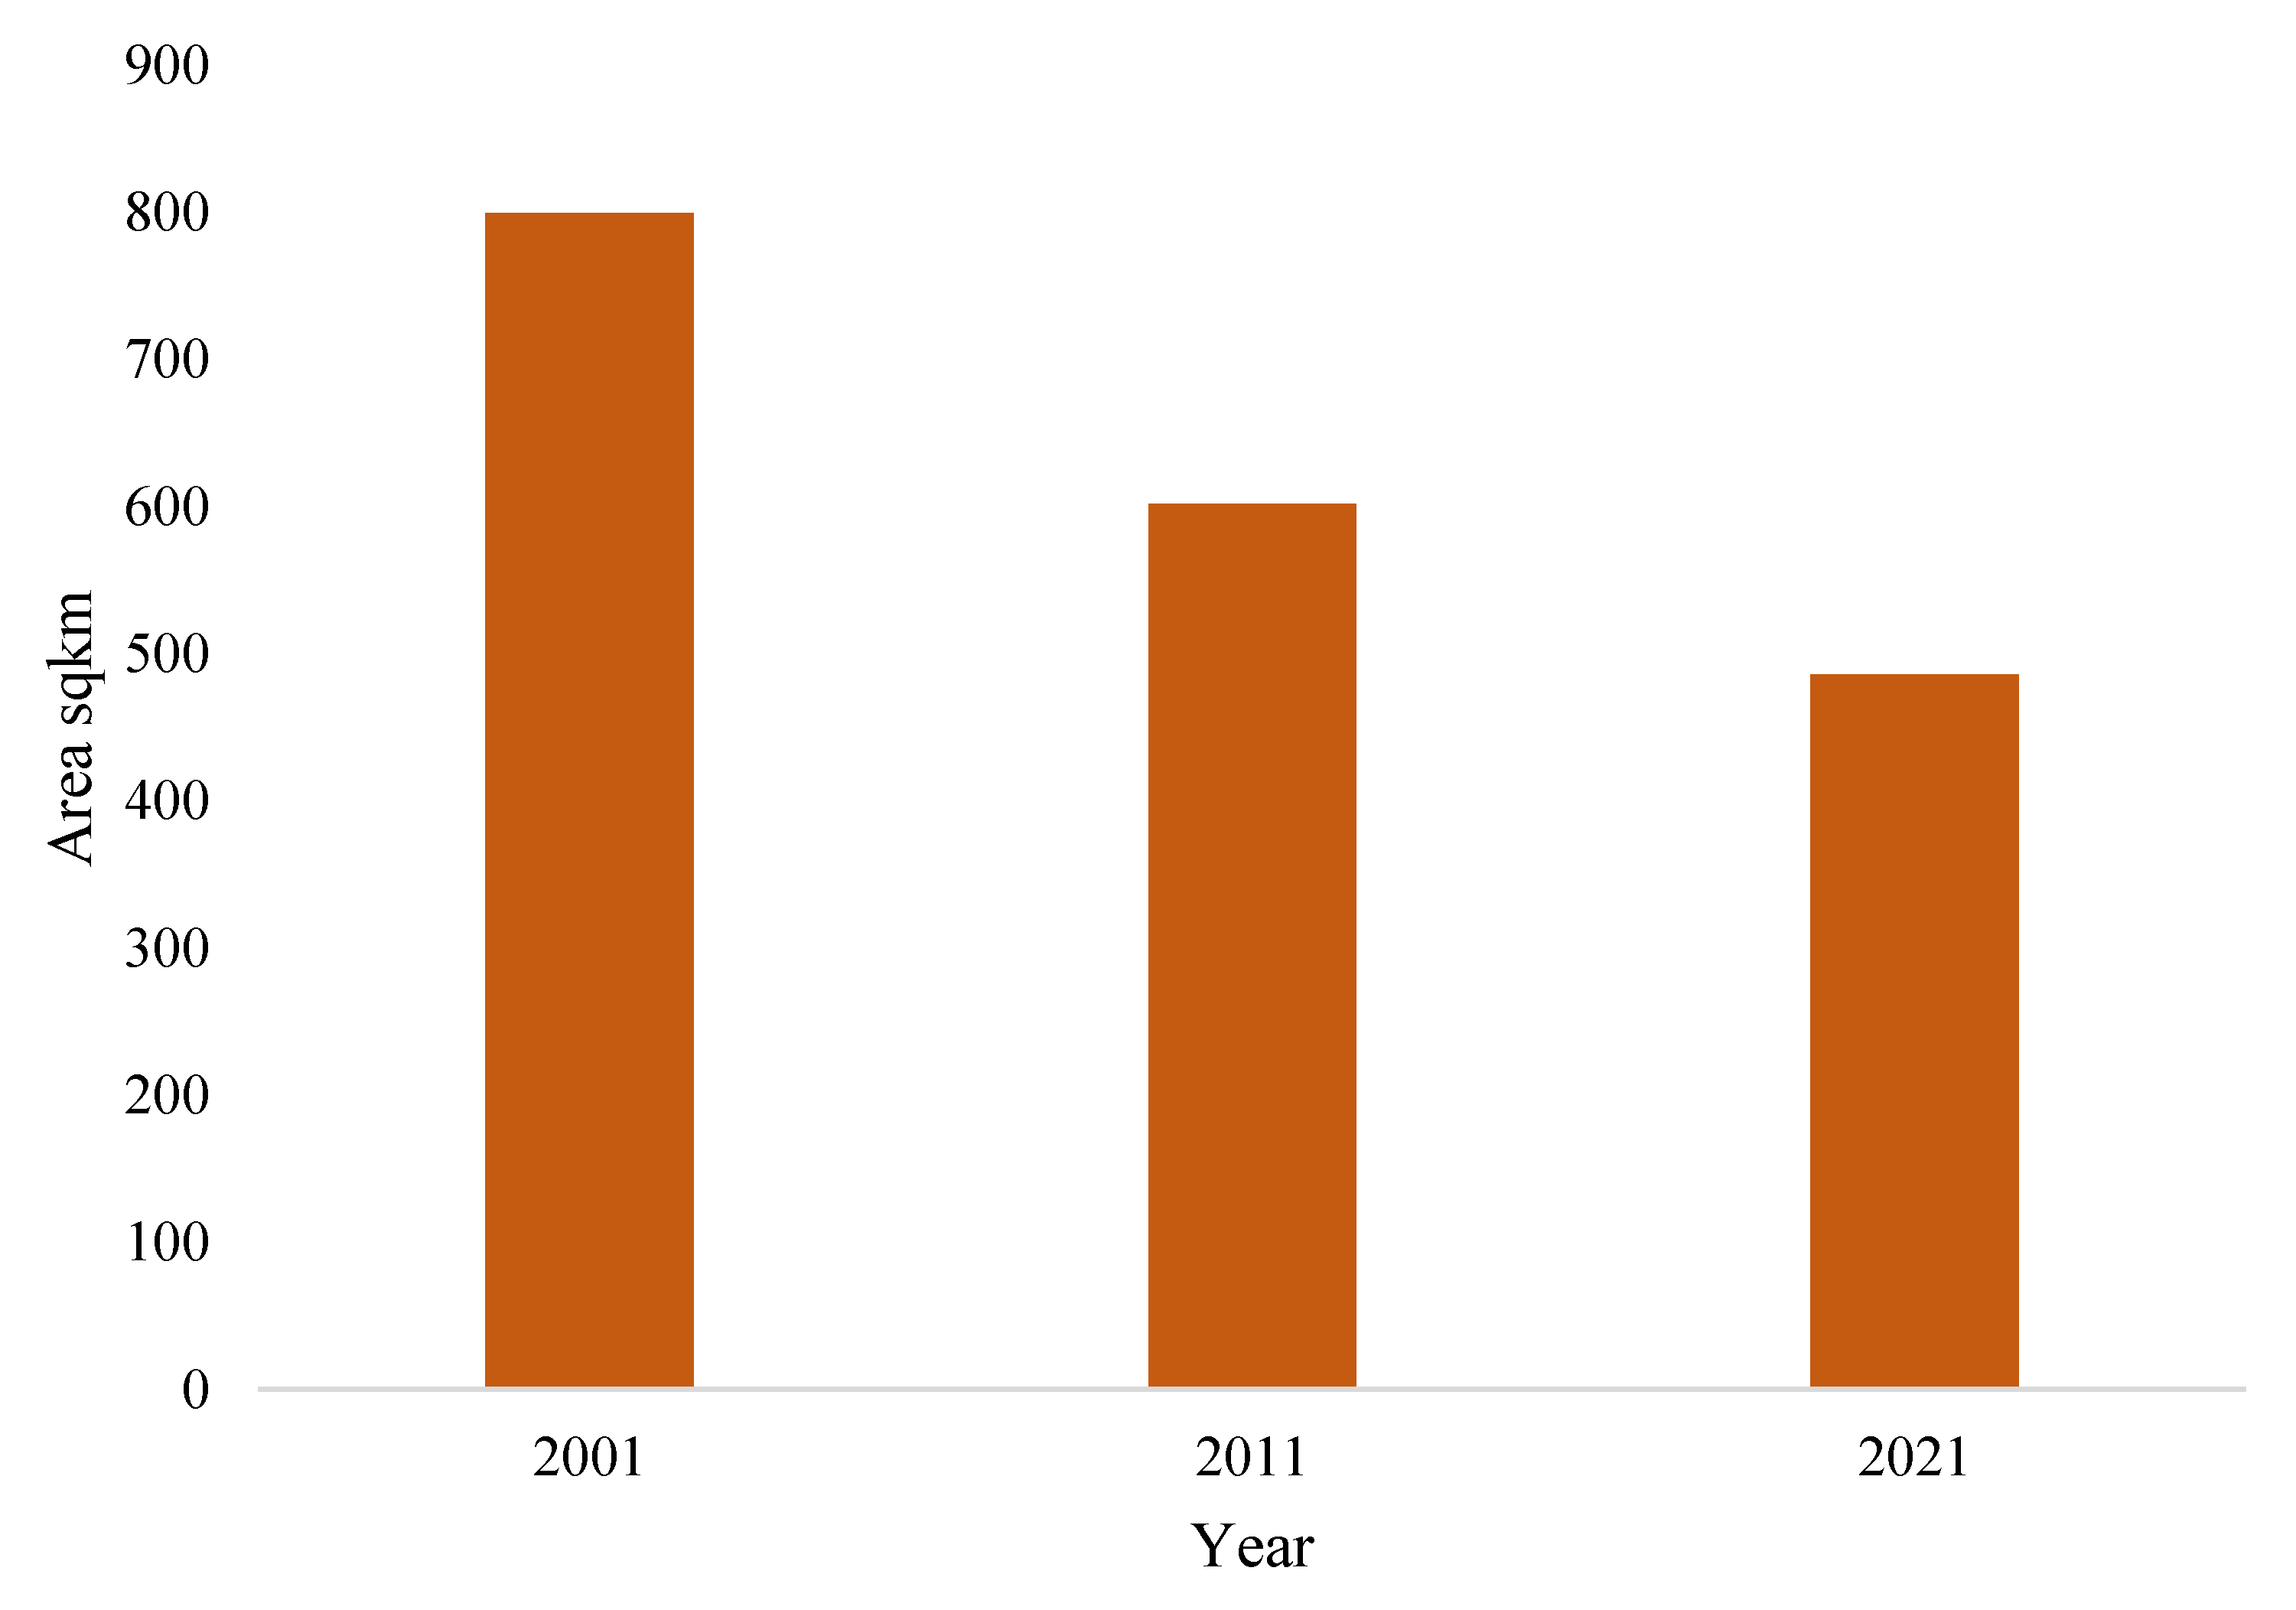
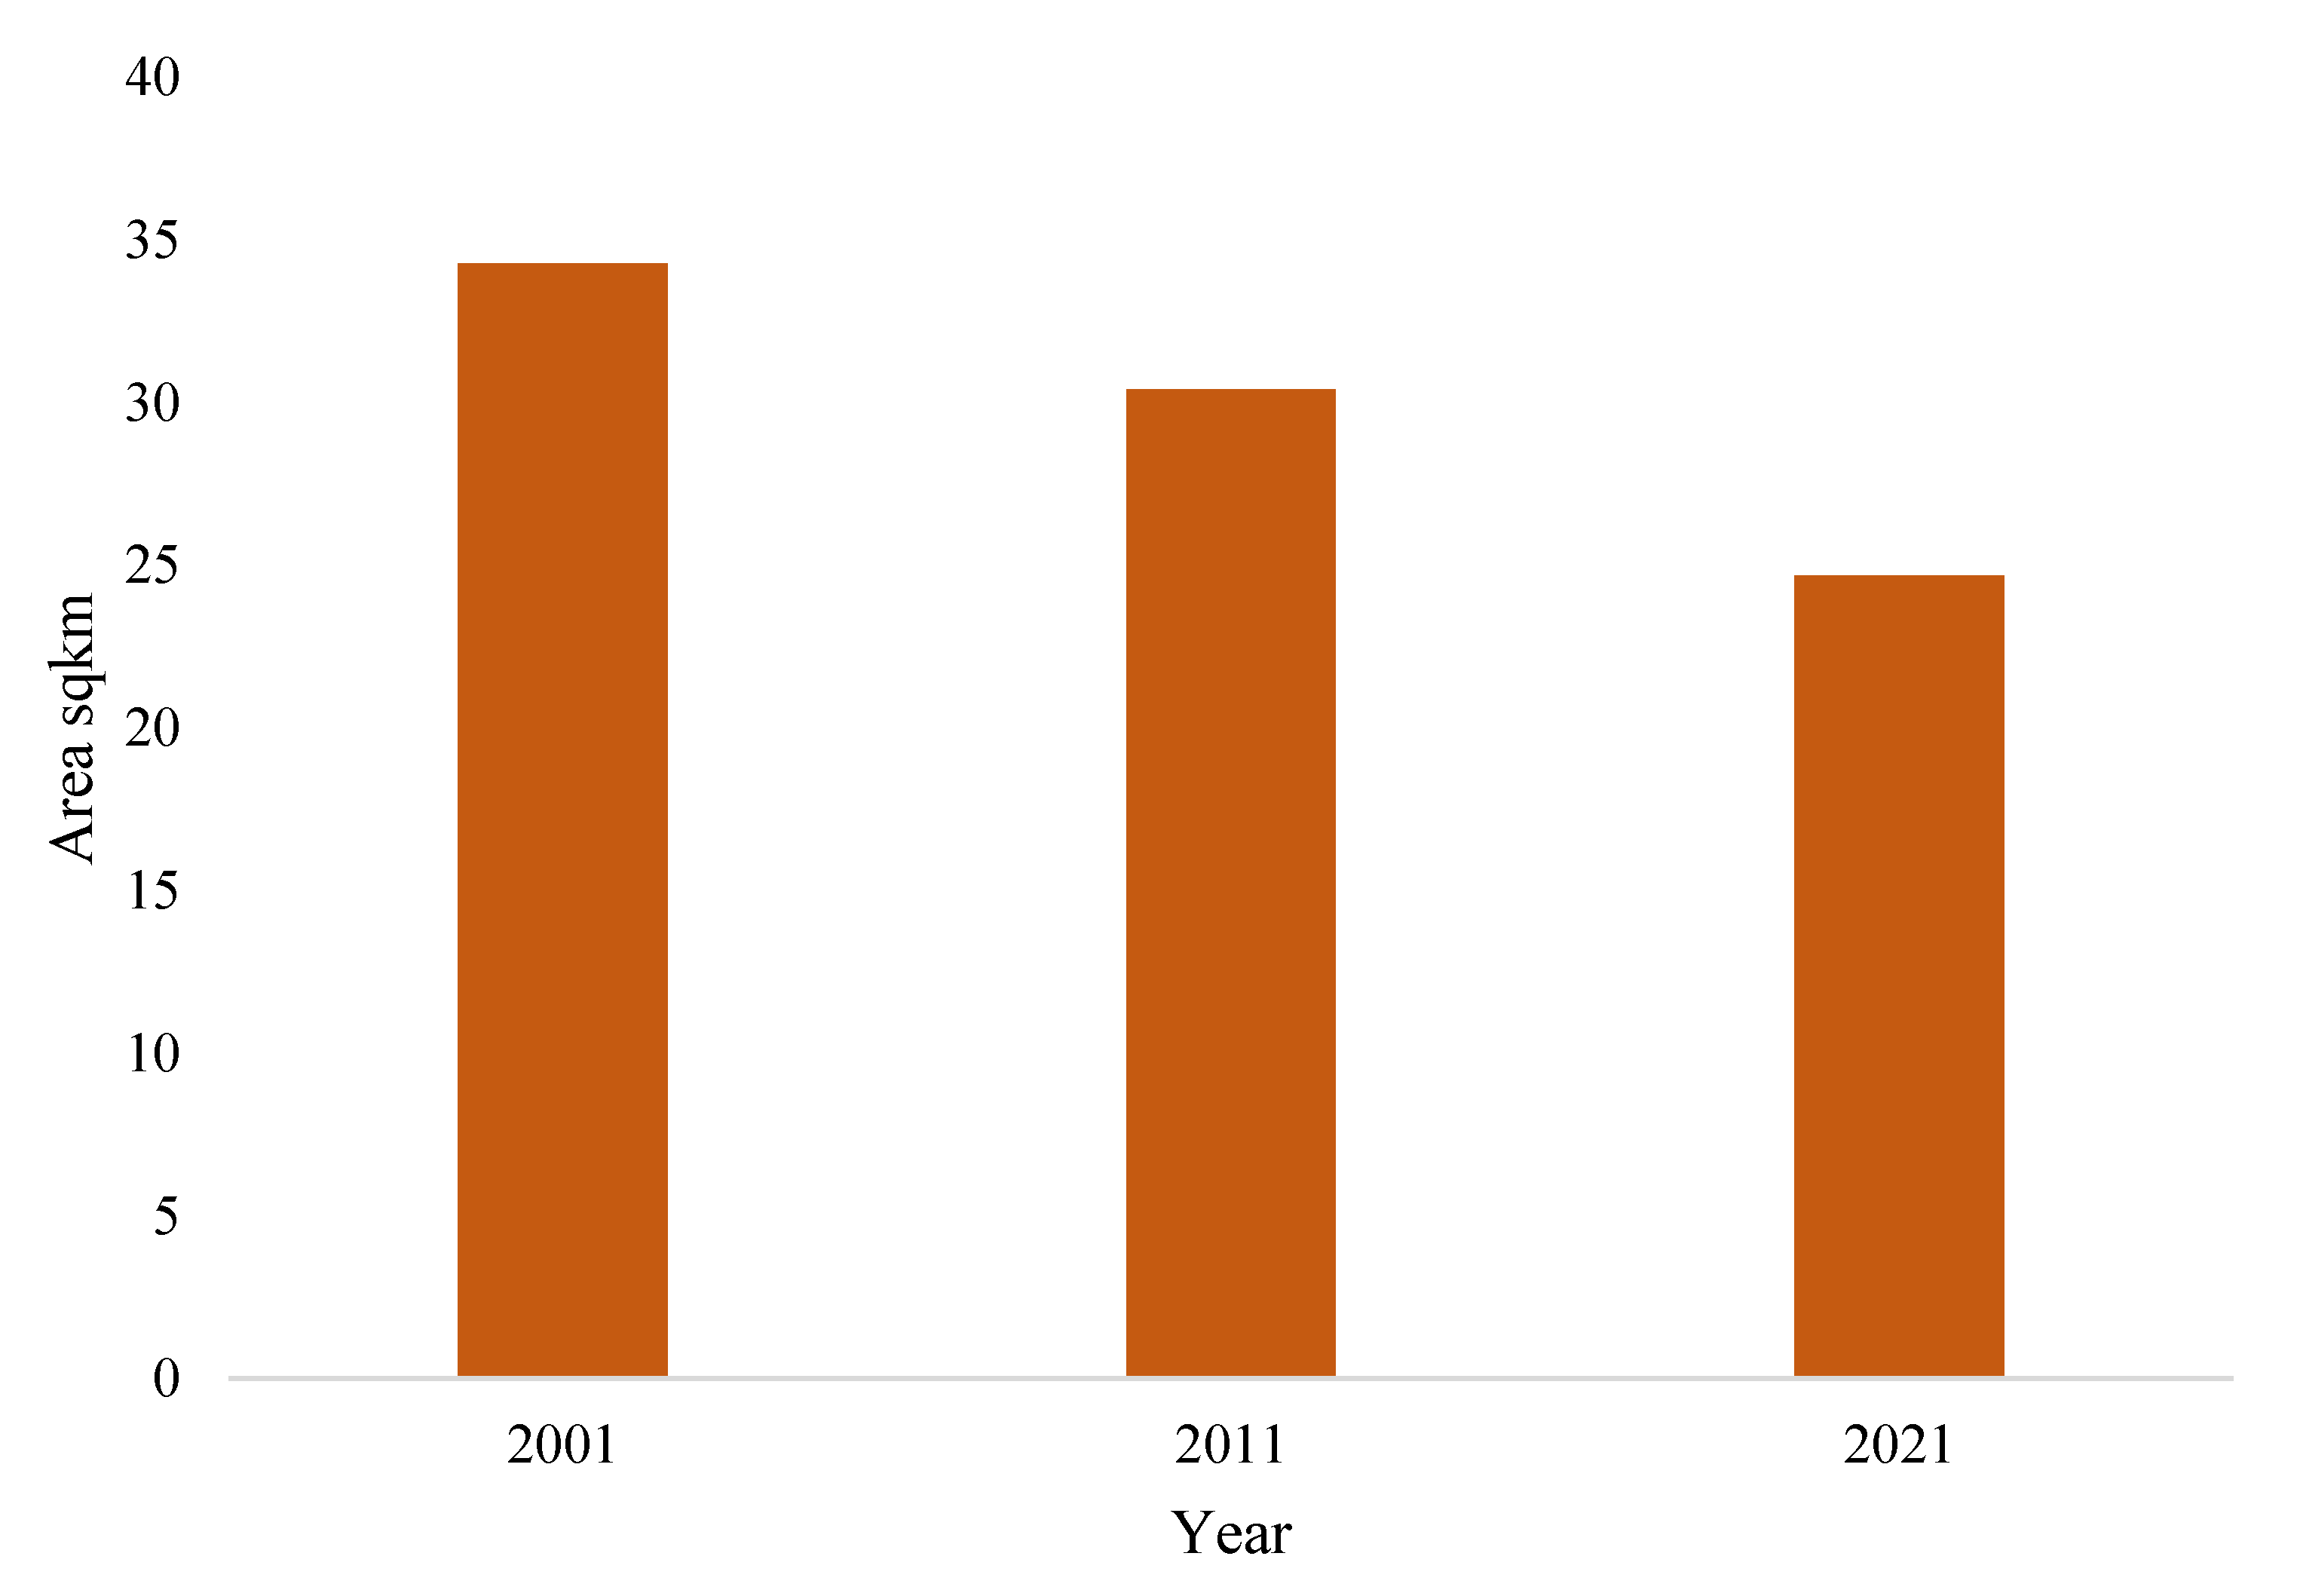
4.1. Land Use and Land Cover Change Analysis
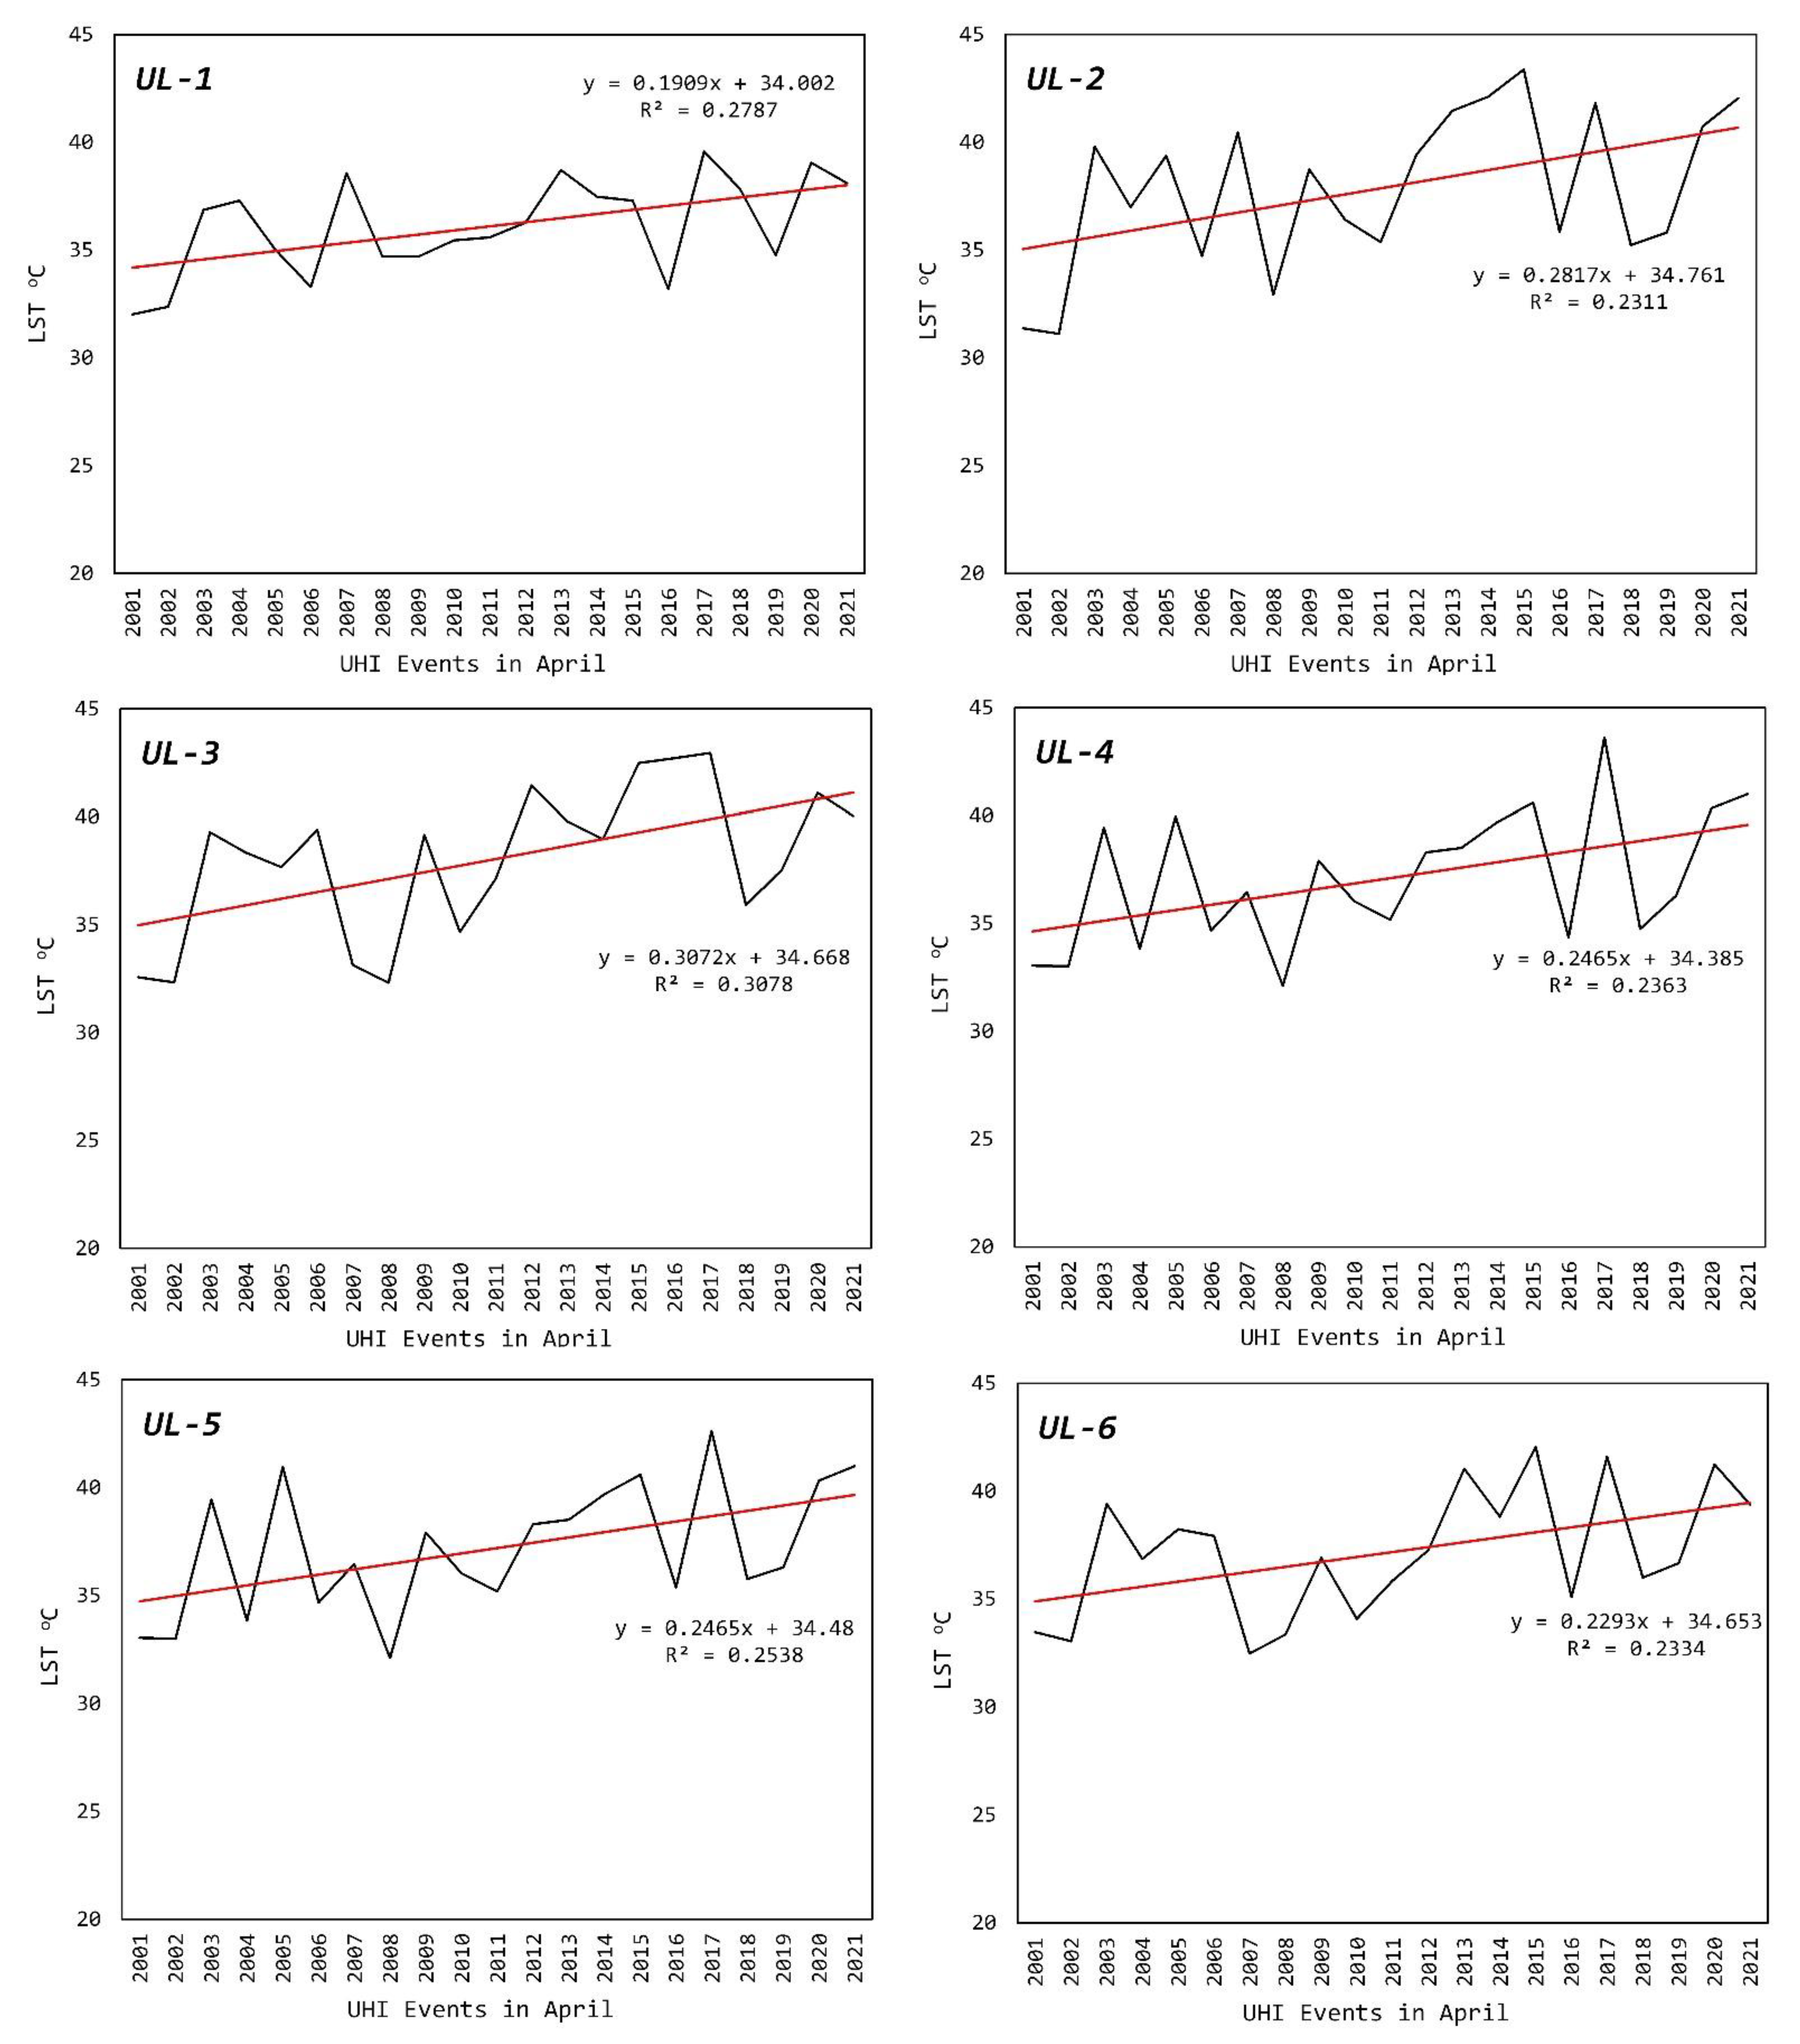
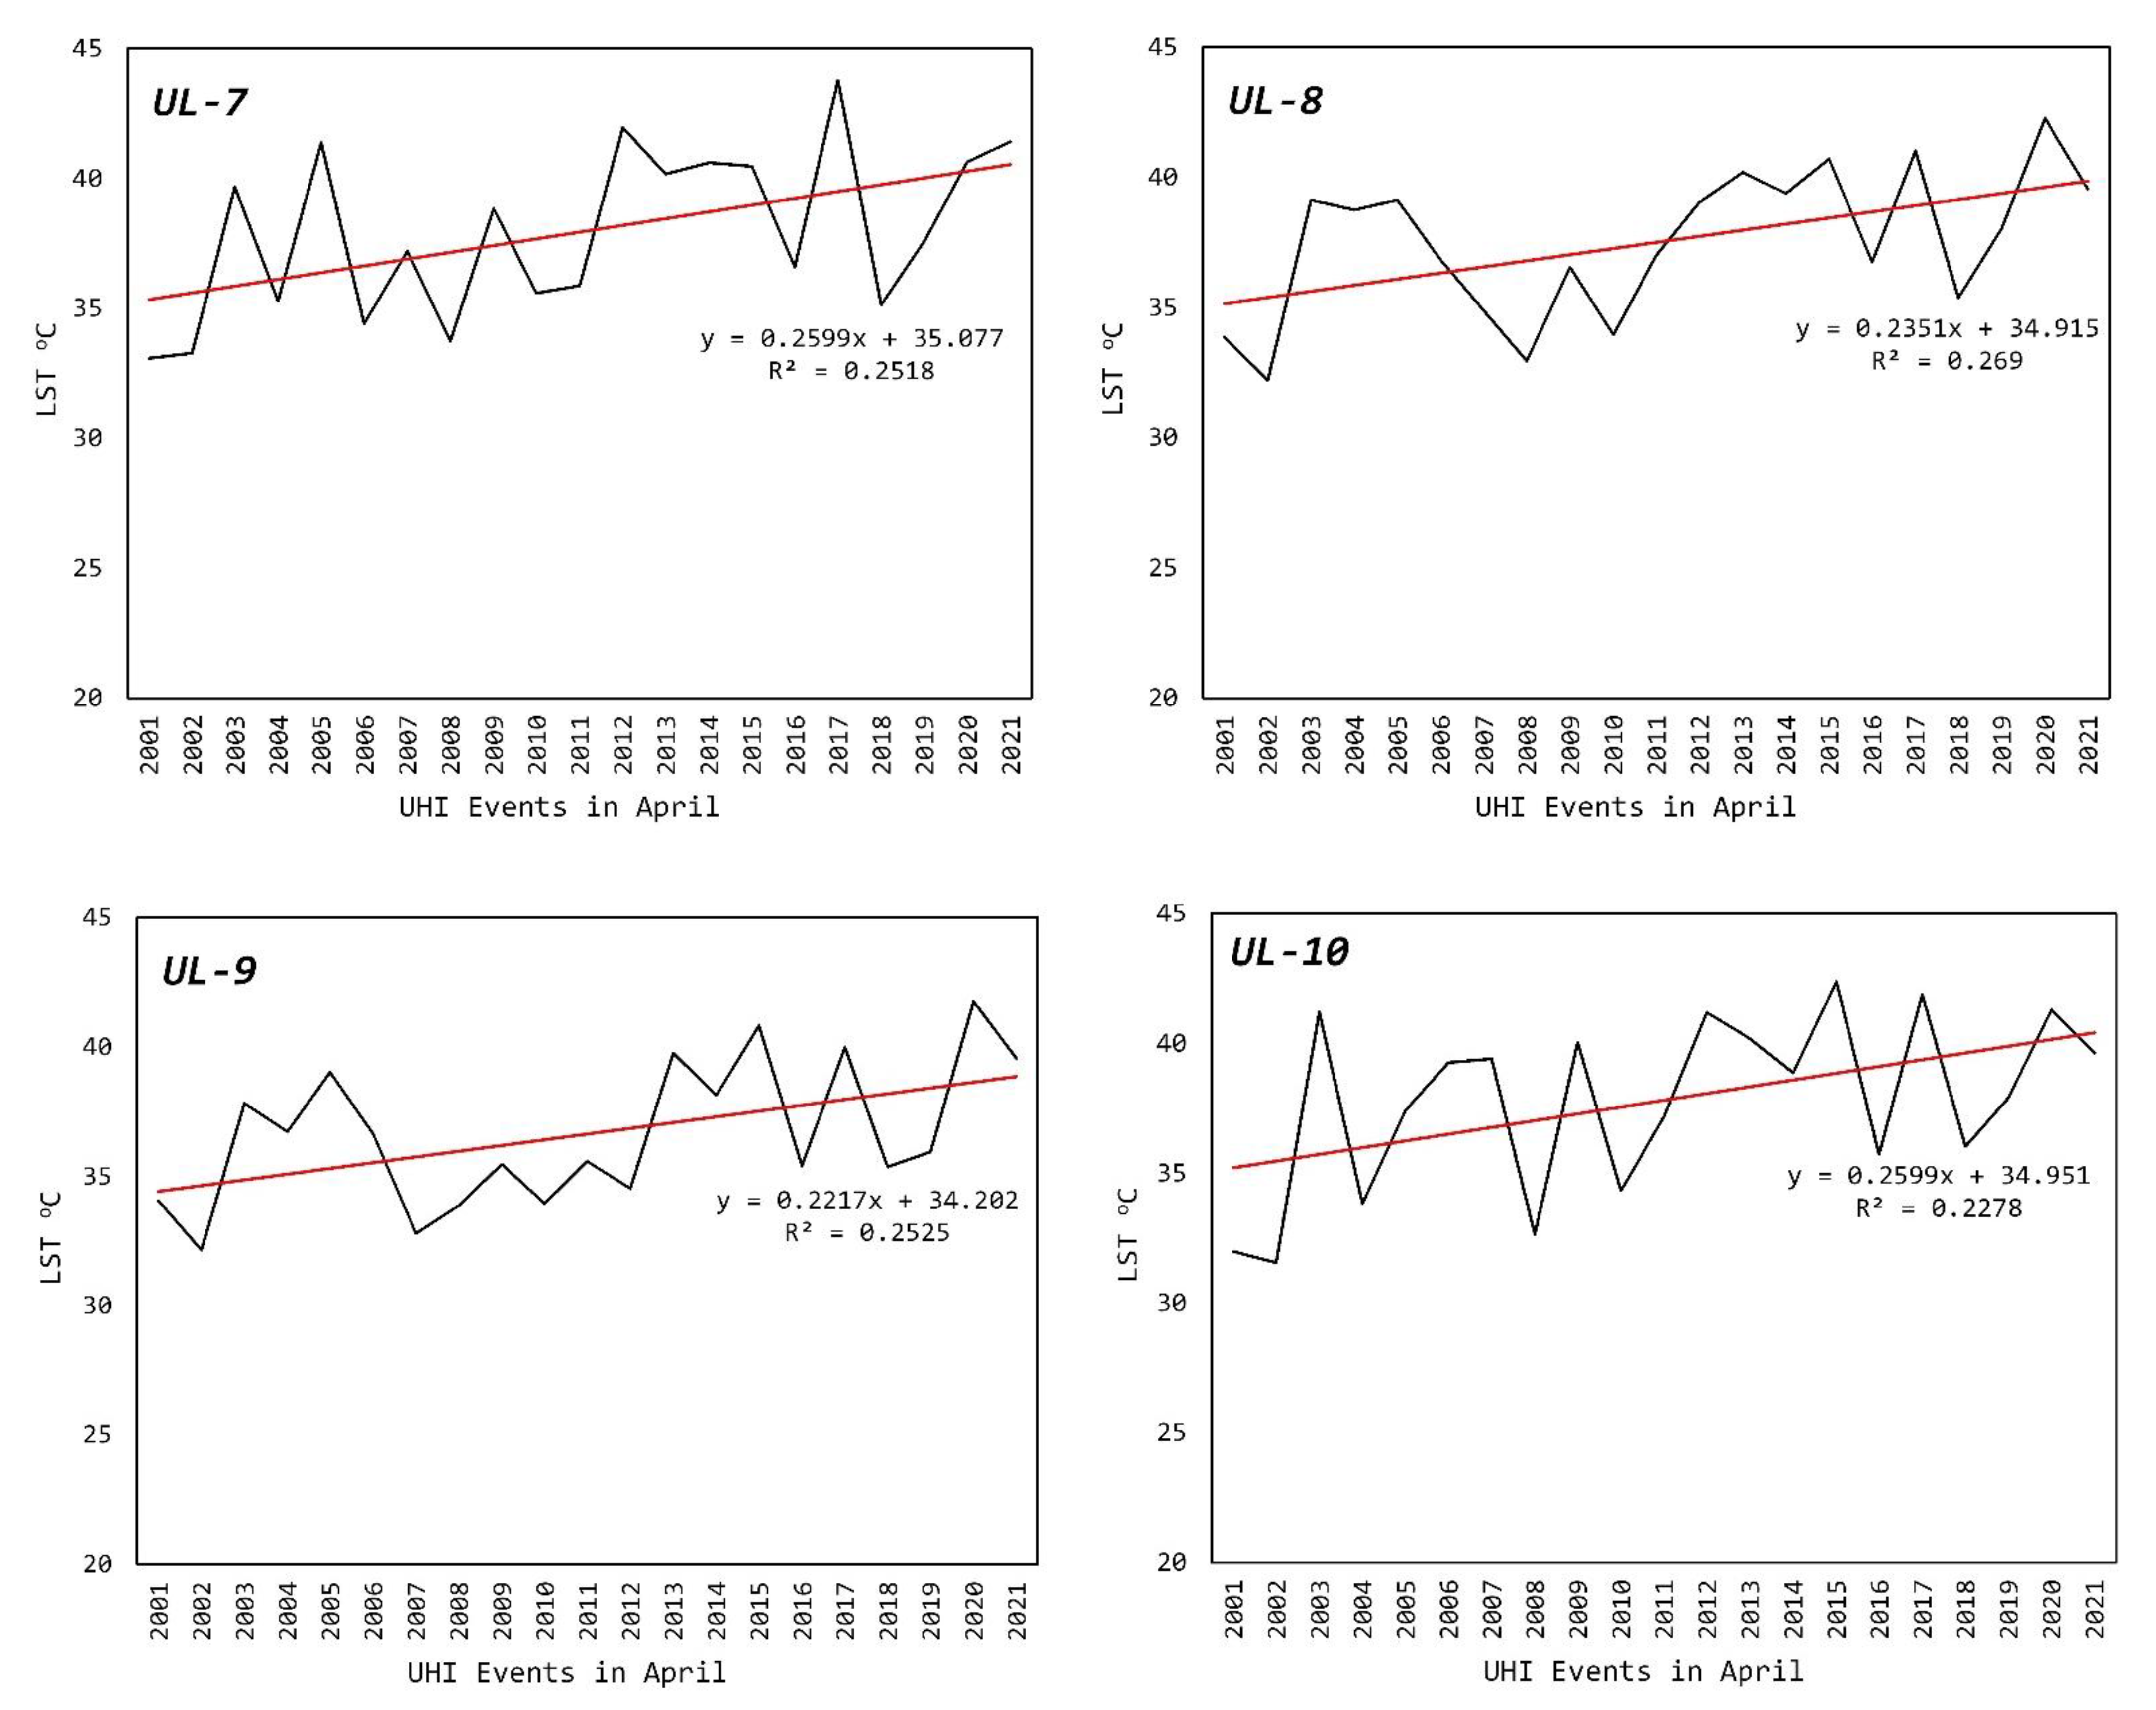
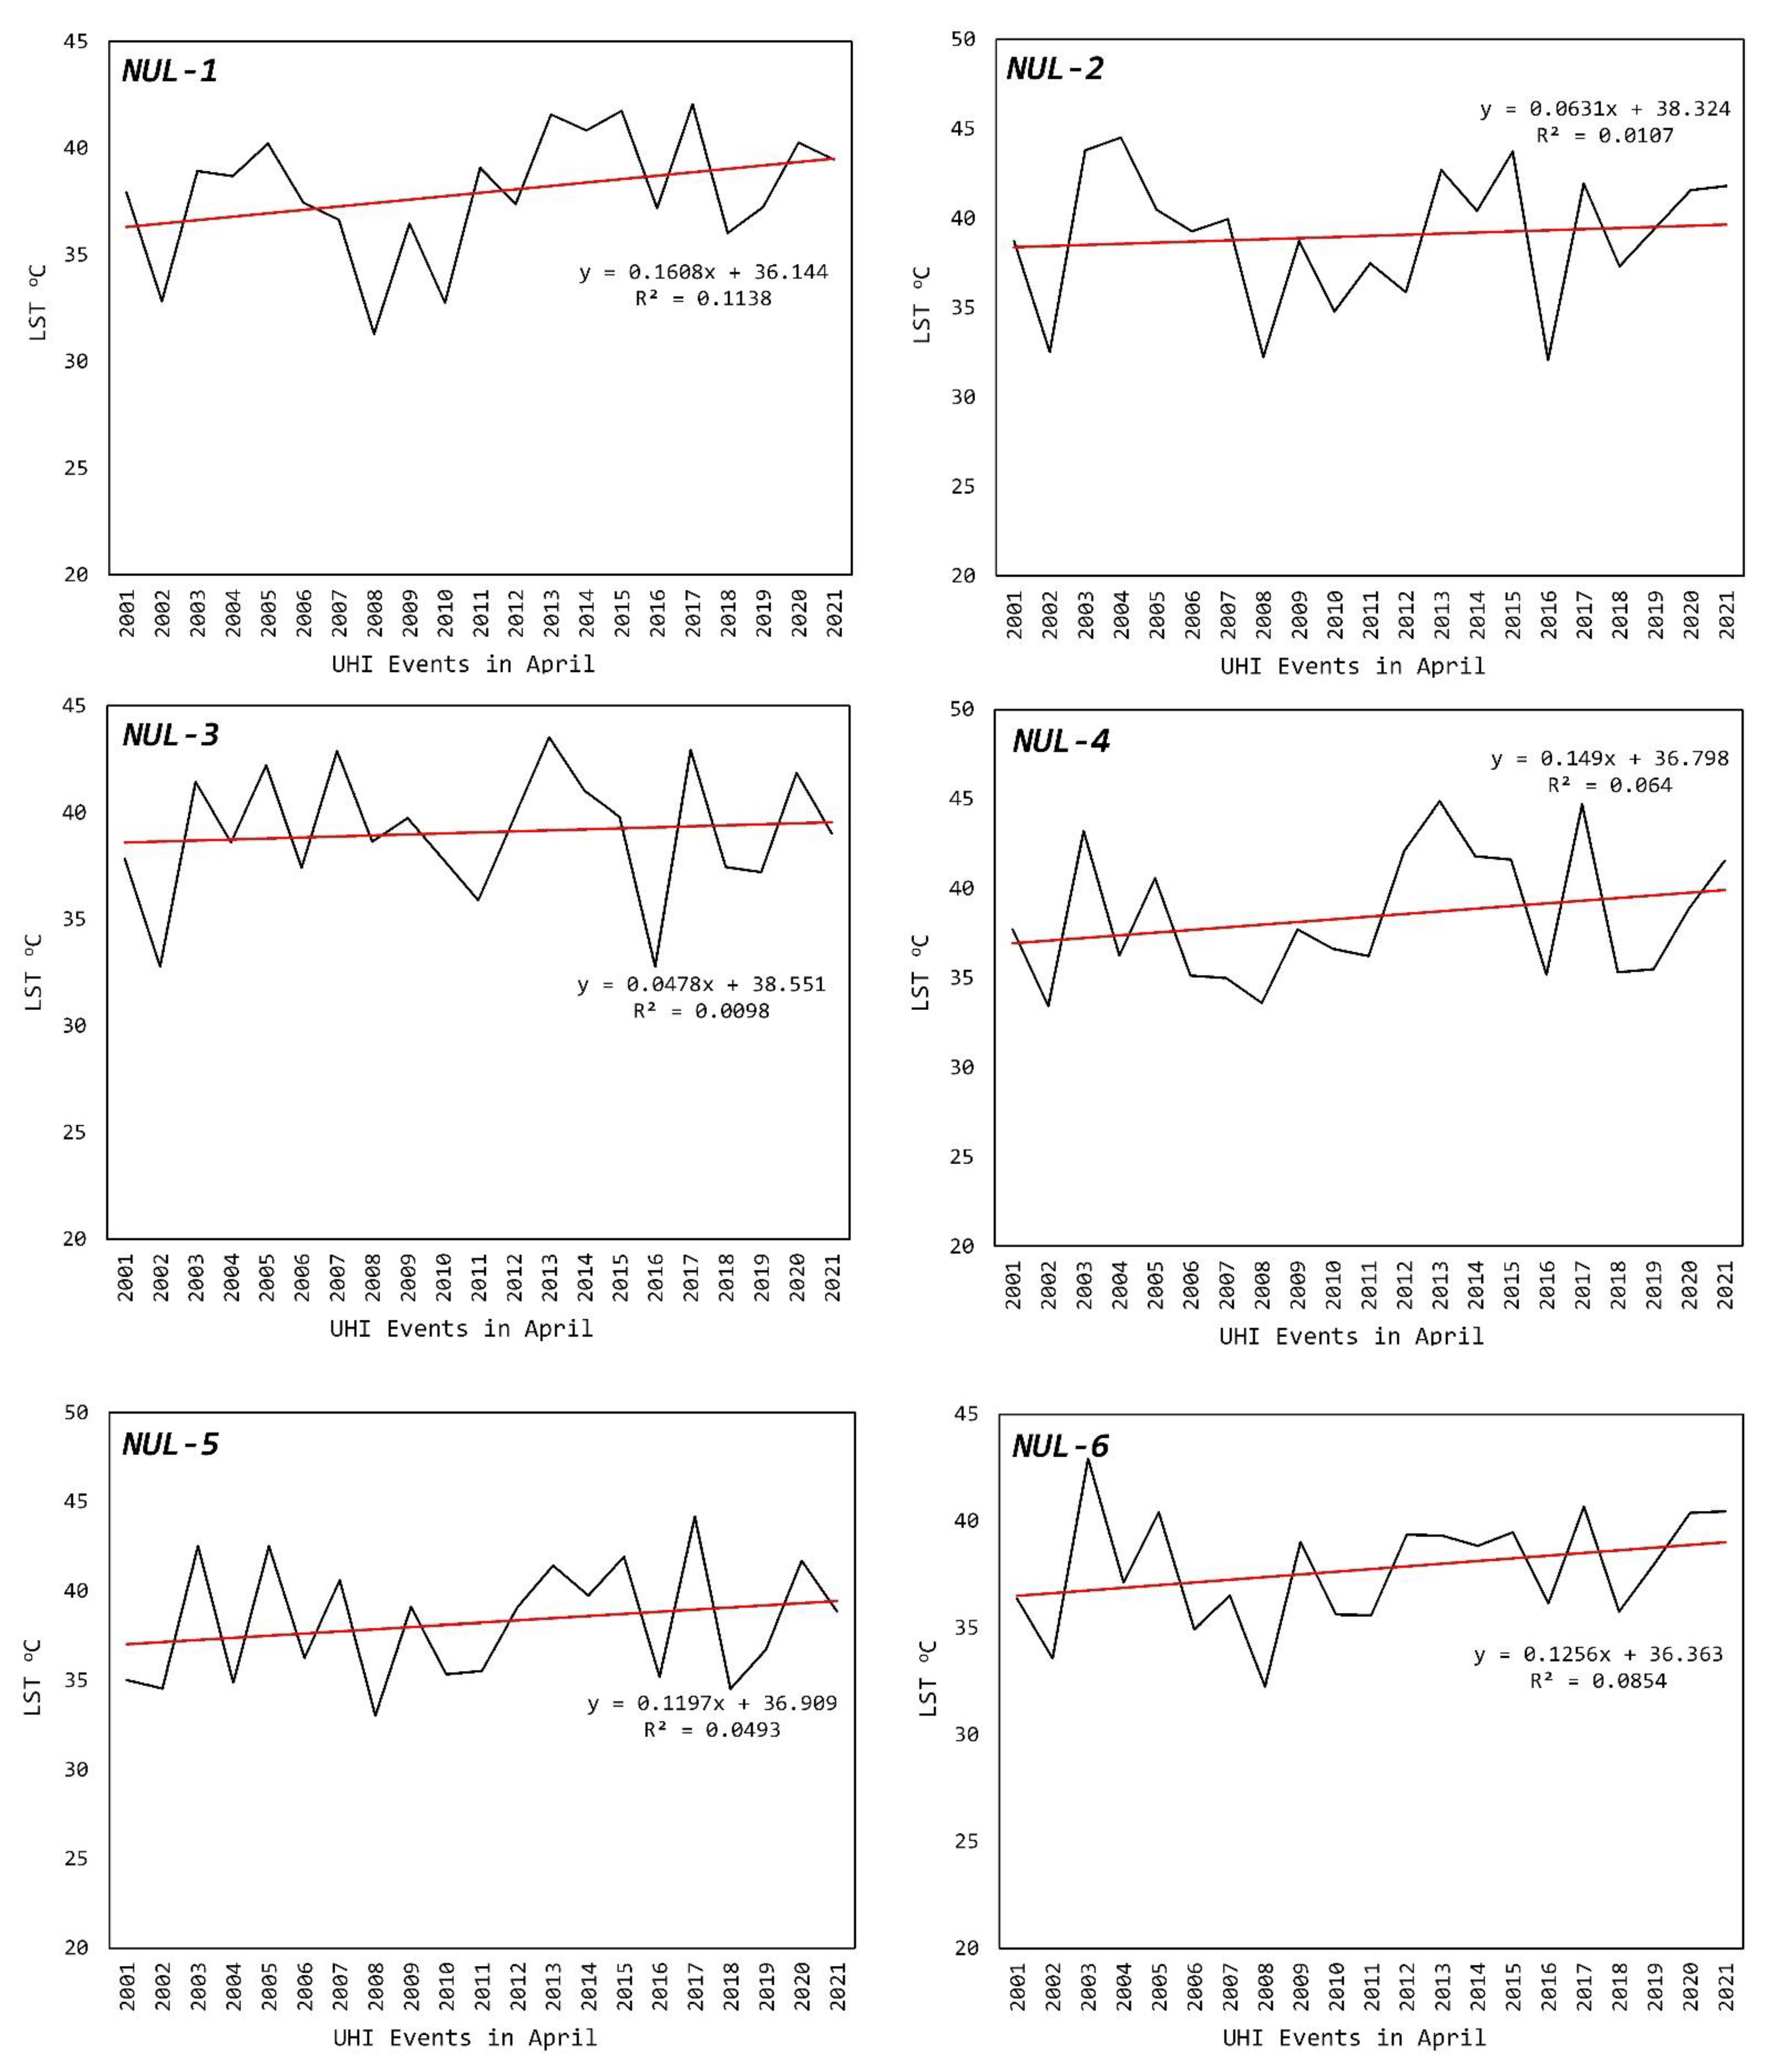
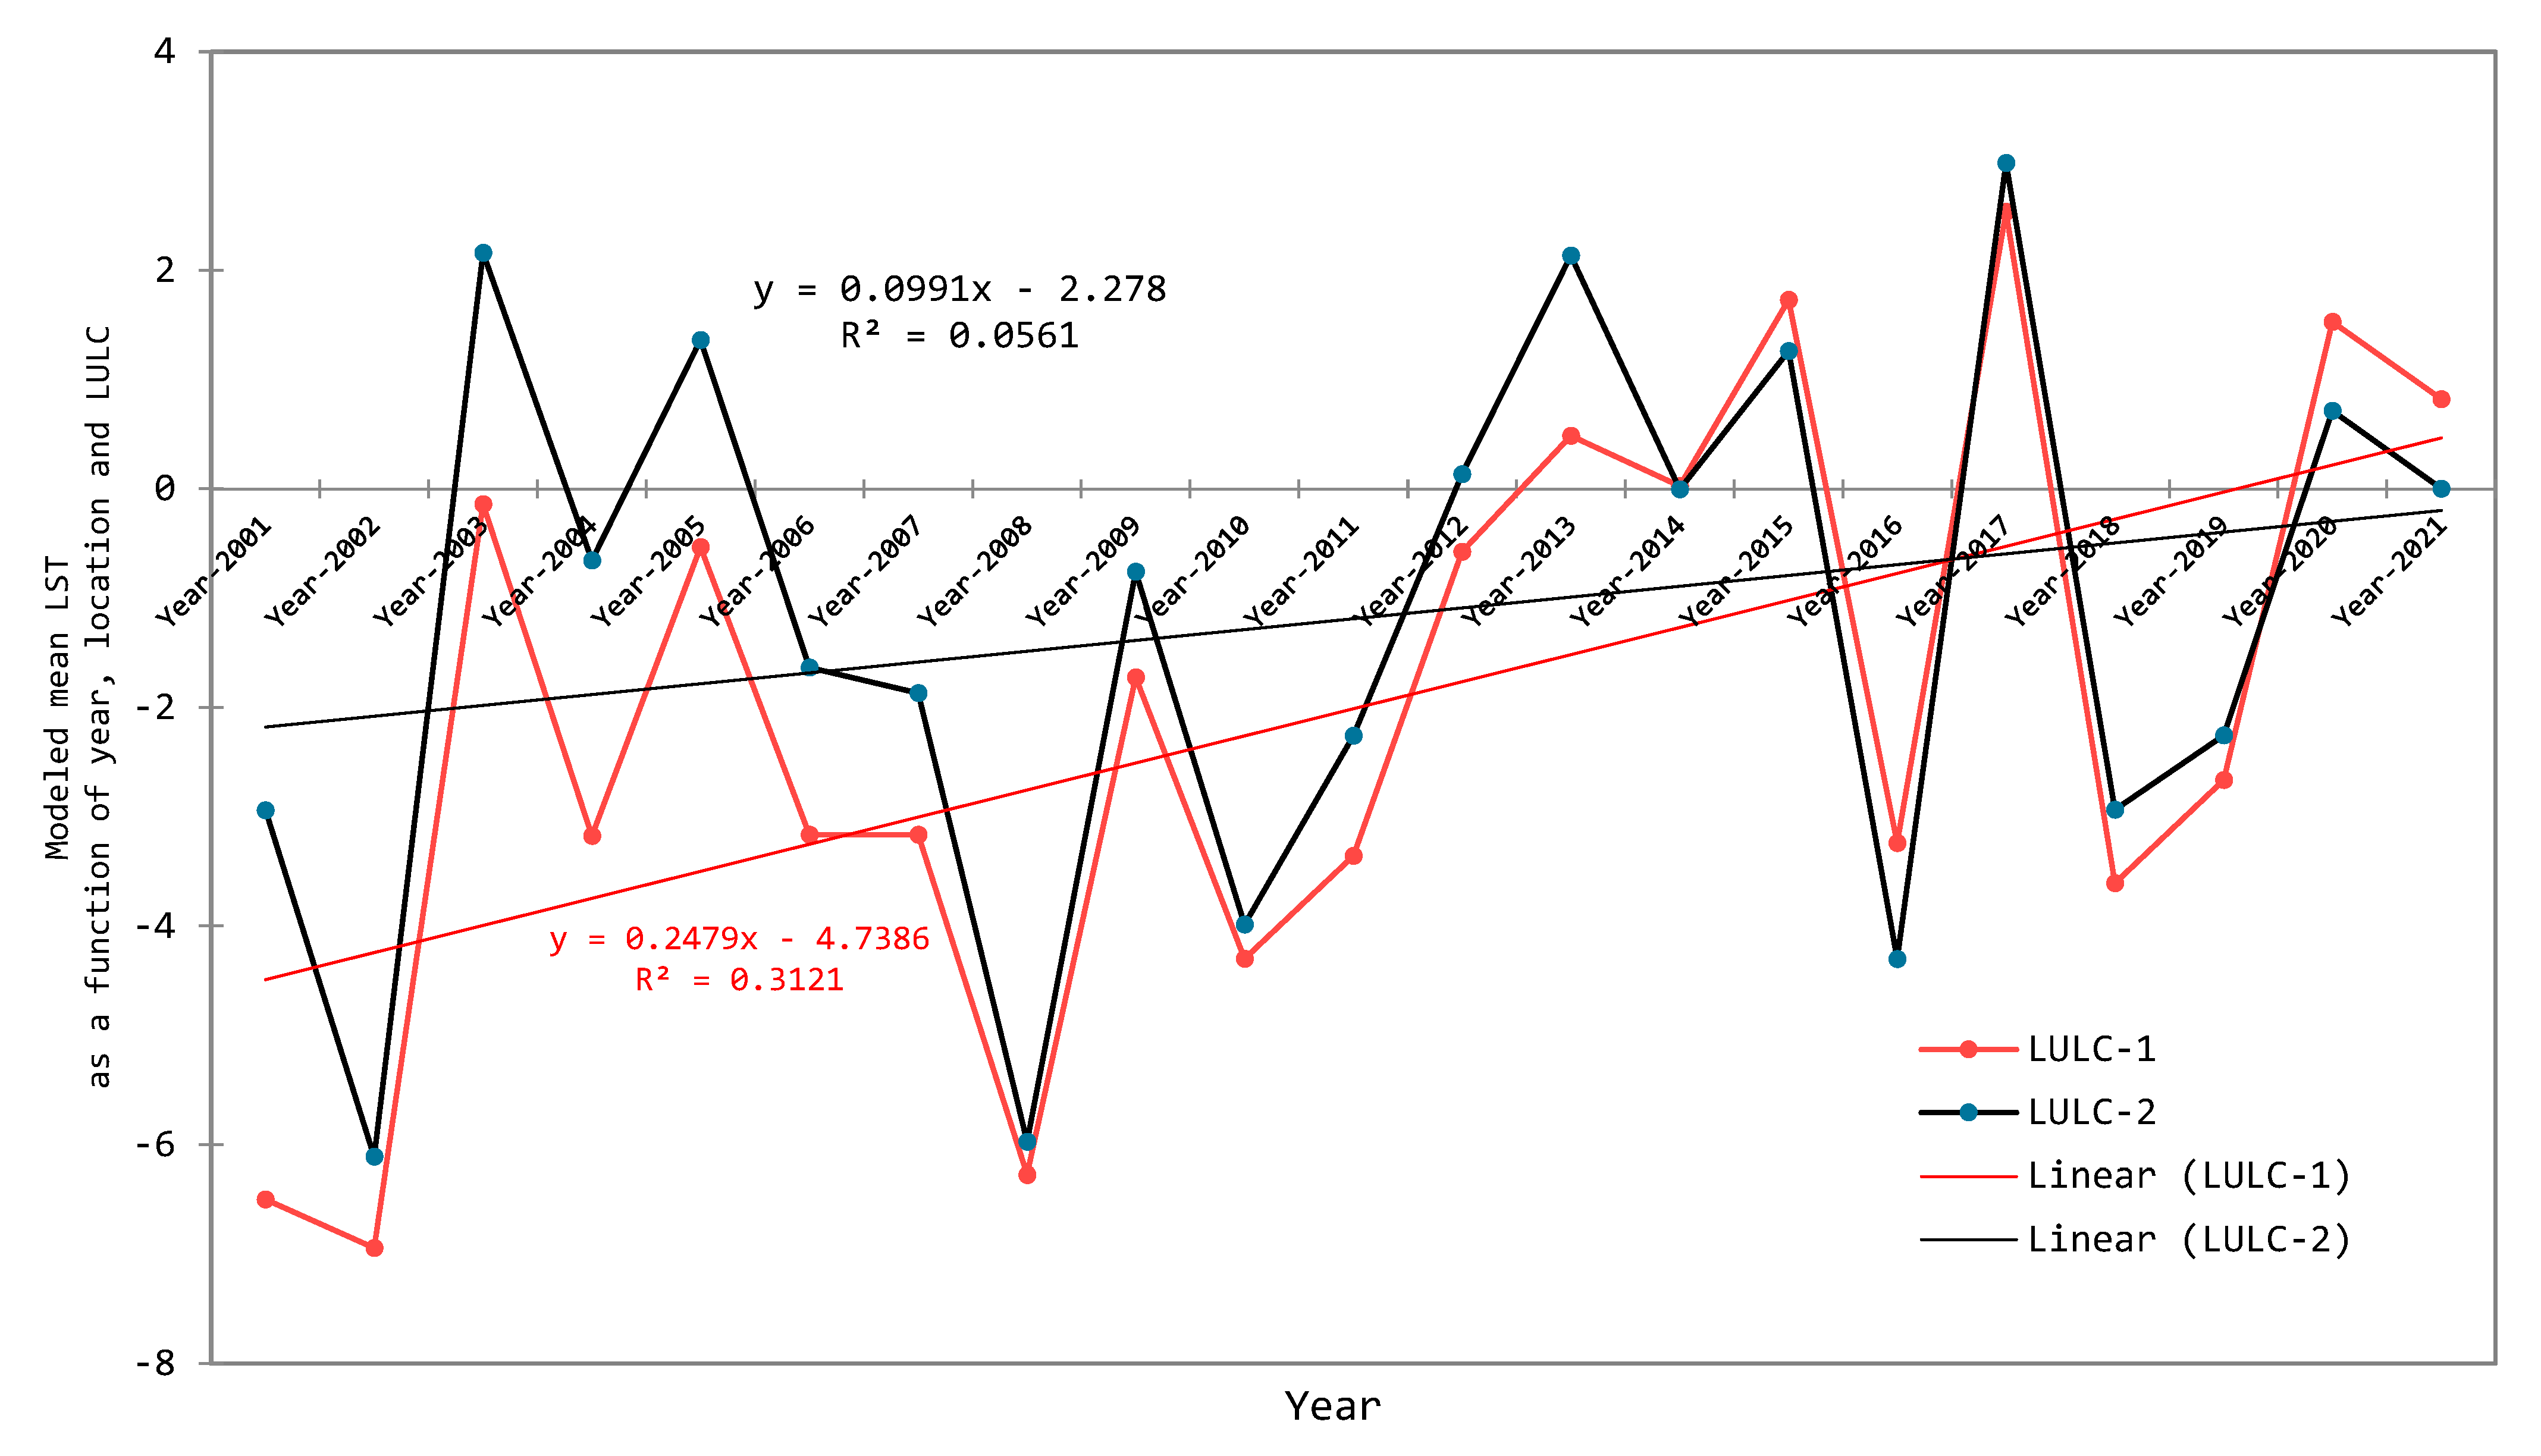
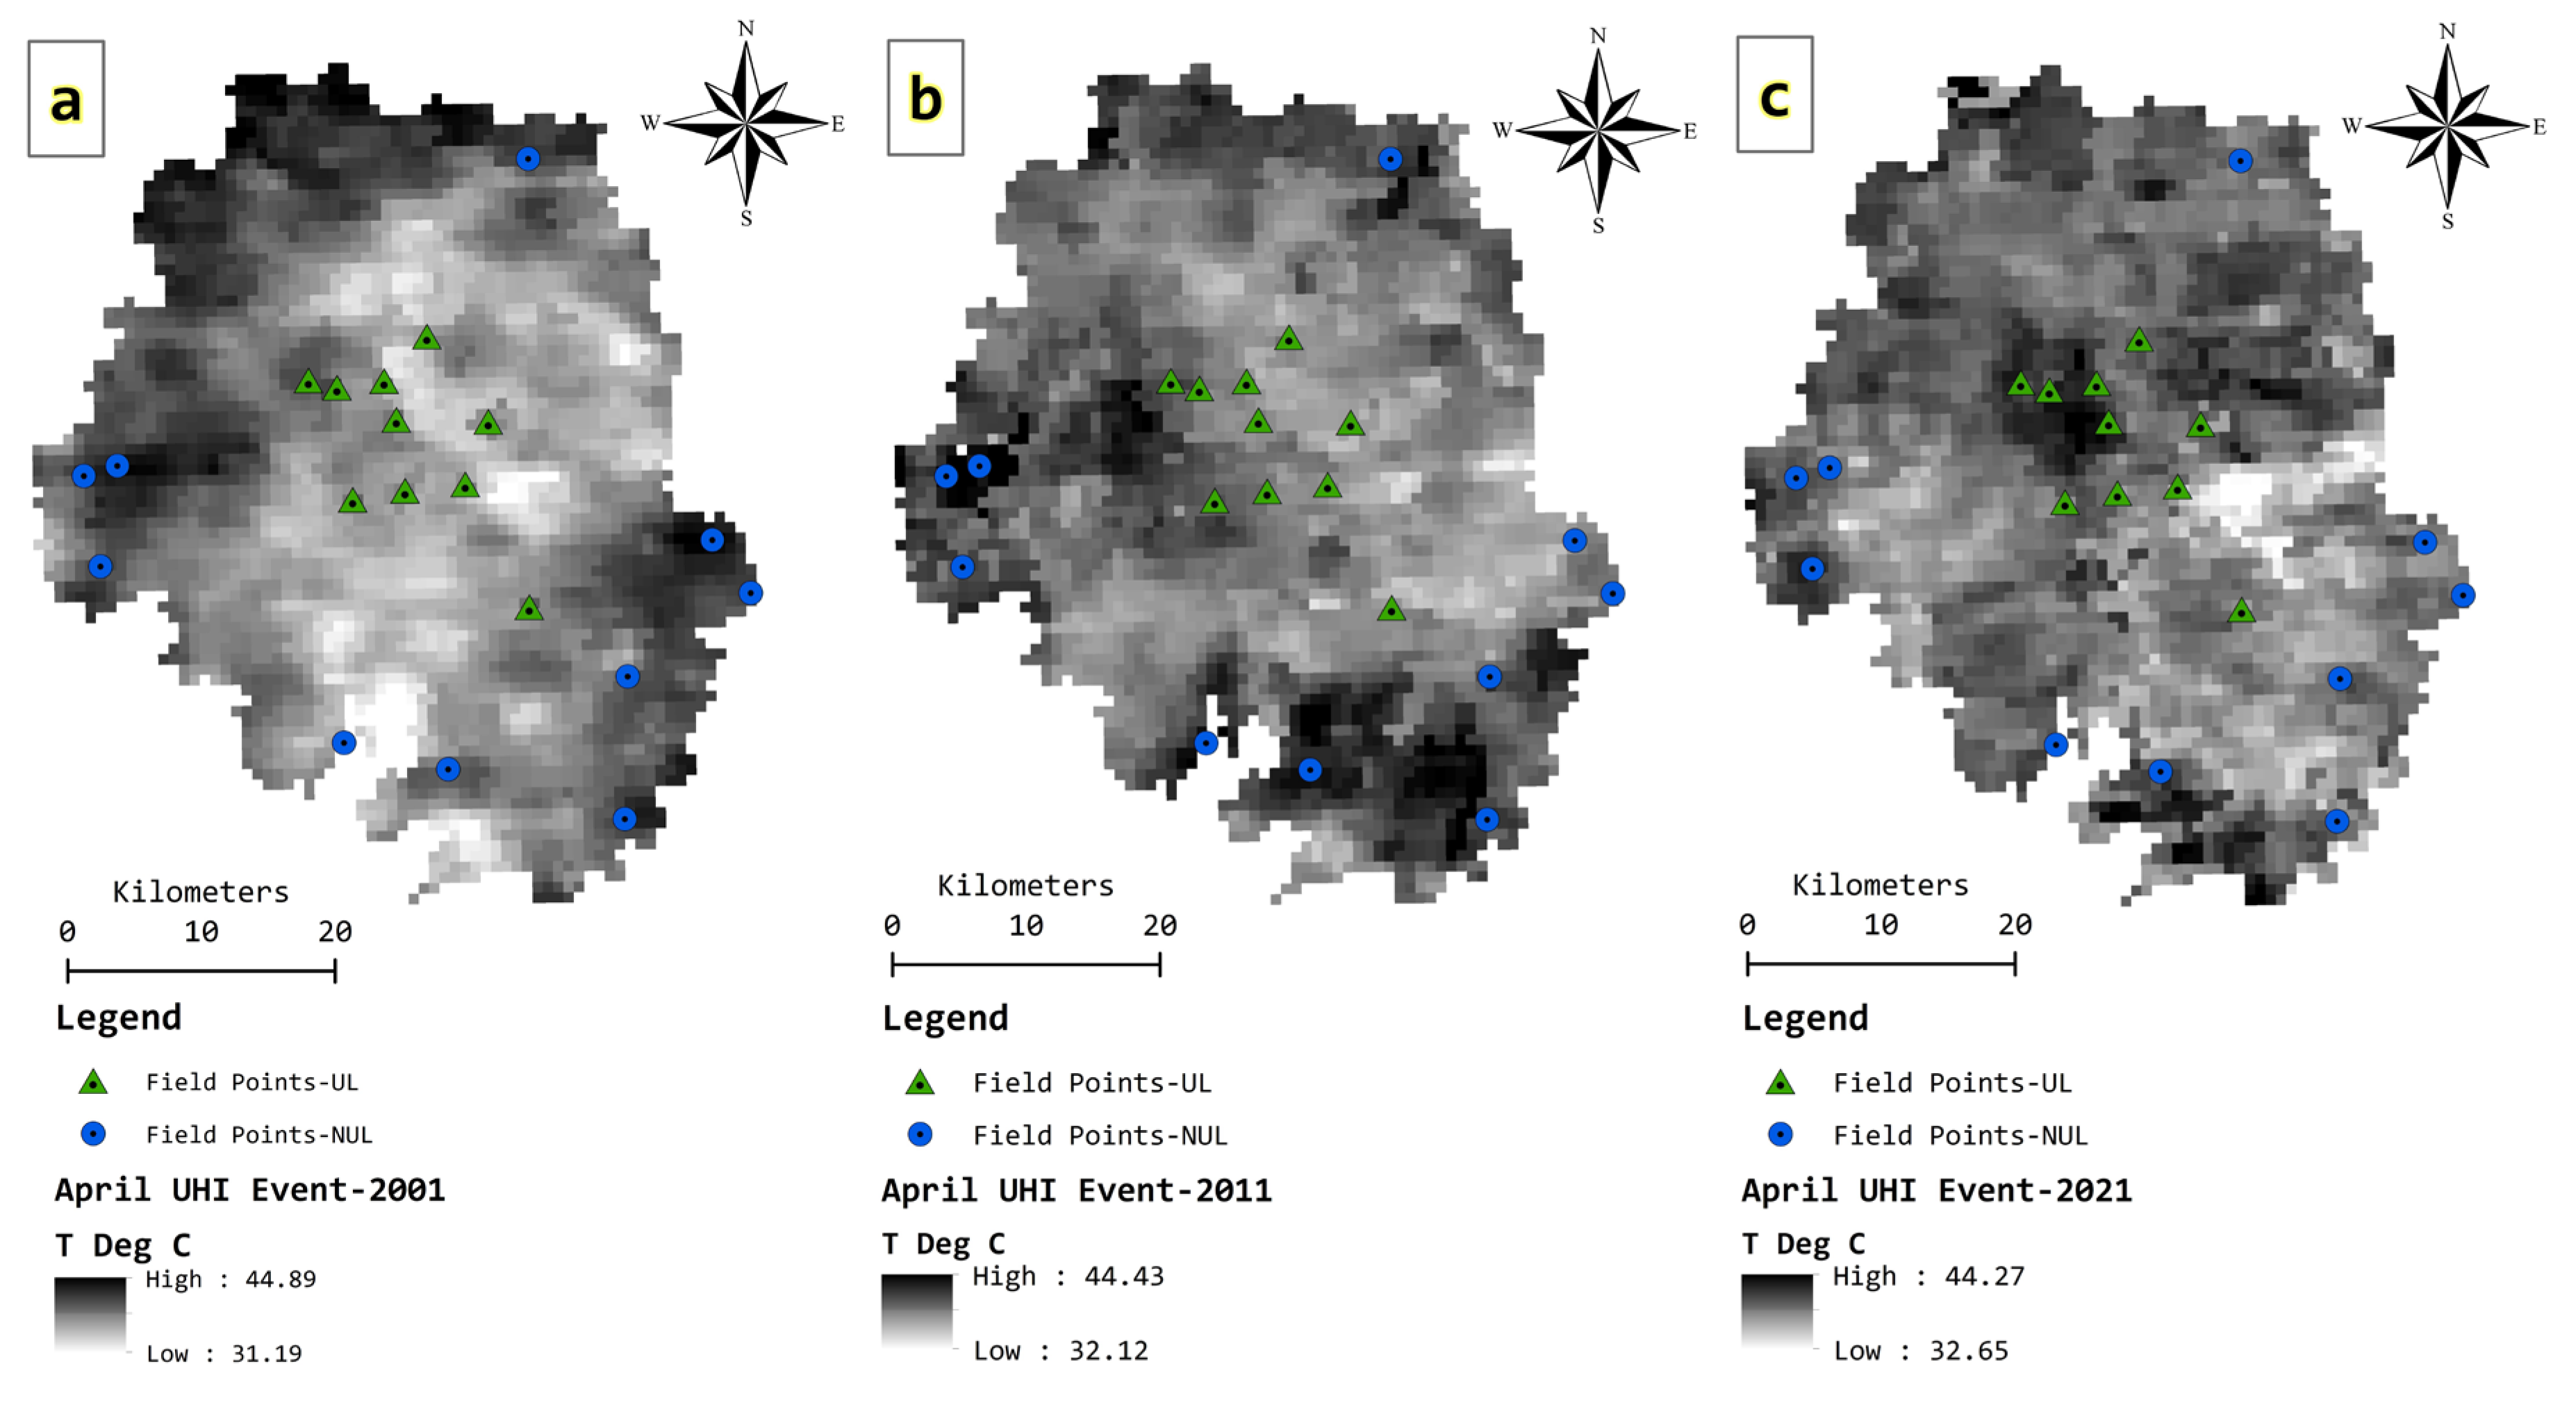
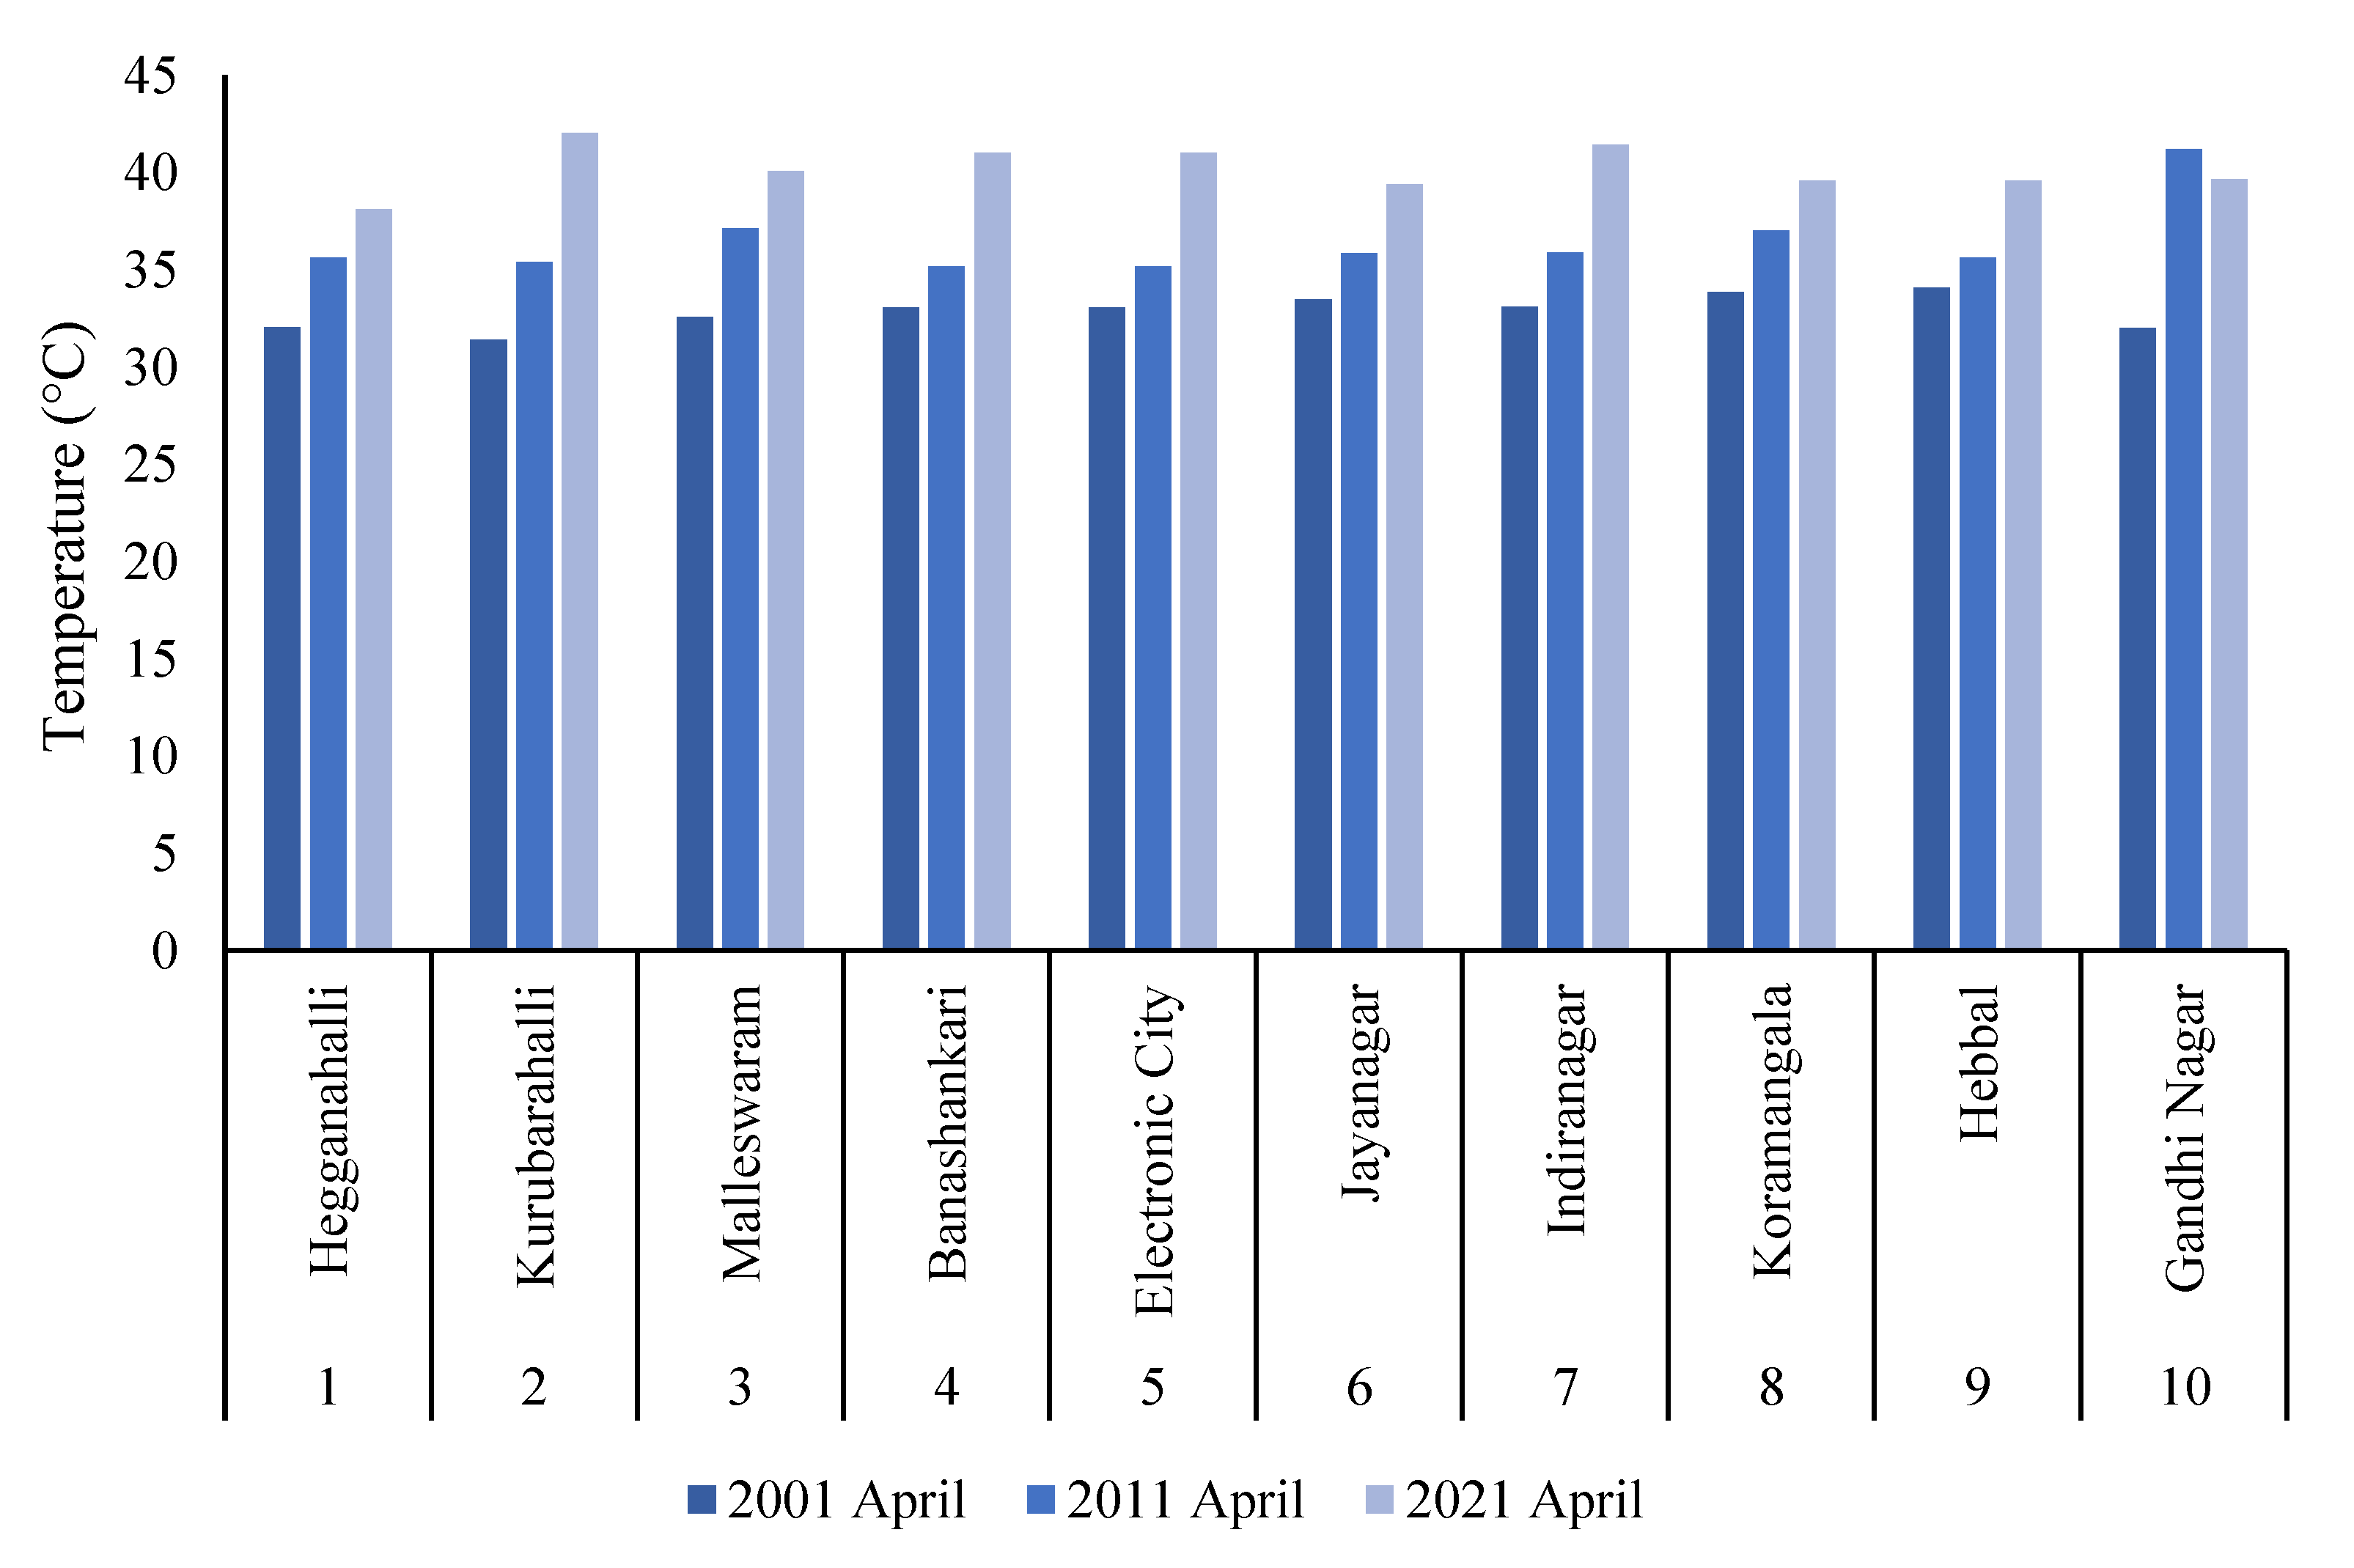
4.2. Land Surface Temperature Assessment
5. Conclusions
Author Contributions
Funding
Data Availability Statement
Acknowledgments
Conflicts of Interest
References
- Huang, K.; Li, X.; Liu, X.; Seto, K.C. Projecting global urban land expansion and heat island intensification through 2050. Environ. Res. Lett. 2019, 14, 114037. [Google Scholar] [CrossRef]
- Matsa, M.; Mupepi, O.; Musasa, T. Spatio-temporal analysis of urban area expansion in zimbabwe between 1990 and 2020: The Case of Gweru City. Environ. Chall. 2021, 4, 100141. [Google Scholar] [CrossRef]
- Bhattacharya, C. Urbanisation in Developing Countries. Econ. Political Wkly. 2002, 37, 4219–4228. [Google Scholar]
- Shaban, A.; Kourtit, K. Nijkamp, India’s Urban System: Sustainability and Imbalanced Growth of Cities. Sustainability 2020, 12, 2941. [Google Scholar] [CrossRef]
- Hareesha, K.S.; Gangashetty, S.V.; Ramaswamy, V. Support vector machines for face recognition. In Proceedings of the 2nd Indian International Conference on Artificial Intelligence, Pune, India, 20–22 December 2005; pp. 570–575. [Google Scholar]
- Meraj, G. Ecosystem service provisioning–underlying principles and techniques. SGVU J. Clim. Chang. Water 2020, 7, 56–64. [Google Scholar]
- Glaeser, E.; Henderson, J.V. Urban economics for the developing World: An introduction. J. Urban Econ. 2017, 98, 1–5. [Google Scholar] [CrossRef]
- Giles-Corti, B.; Vernez-Moudon, A.; Reis, R.; Turrell, G.; Dannenberg, A.L.; Badland, H.; Foster, S.; Lowe, M.; Sallis, J.F.; Stevenson, M.; et al. City planning and population health: A global challenge. Lancet 2016, 388, 2912–2924. [Google Scholar] [CrossRef]
- Ismagilova, E.; Hughes, L.; Dwivedi, Y.K.; Raman, K.R. Smart cities: Advances in research—An information systems perspective. Int. J. Inf. Manag. 2019, 47, 88–100. [Google Scholar] [CrossRef]
- Surya, B.; Syafri, S.; Sahban, H.; Sakti, H.H. Natural resource conservation based on community economic empowerment: Perspectives on watershed management and slum settlements in Makassar City, South Sulawesi, Indonesia. Land 2020, 9, 104. [Google Scholar] [CrossRef]
- Corbett, J.; Mellouli, S. Winning the SDG battle in cities: How an integrated information ecosystem can contribute to the achievement of the 2030 sustainable development goals. Inf. Syst. J. 2017, 27, 427–461. [Google Scholar] [CrossRef]
- Bedi, P. Smart Global Megacities Spatial Strategies for Kolkata Metropolitan Region. In Smart Global Megacities; Springer: Singapore, 2022; pp. 383–407. [Google Scholar]
- Gubic, I.; Baloi, O. Implementing the new urban agenda in Rwanda: Nation-wide public space initiatives. Urban Plan. 2019, 4, 223–236. [Google Scholar] [CrossRef]
- Valencia, S.C.; Simon, D.; Croese, S.; Nordqvist, J.; Oloko, M.; Sharma, T.; Taylor Buck, N.; Versace, I. Adapting the Sustainable Development Goals and the New Urban Agenda to the city level: Initial reflections from a comparative research project. Int. J. Urban Sustain. Dev. 2019, 11, 4–23. [Google Scholar] [CrossRef] [Green Version]
- Dijoo, Z.K. Urban Heat Island Effect Concept and Its Assessment Using Satellite-Based Remote Sensing Data. In Geographic Information Science for Land Resource Management; Wiley: New York, NY, USA, 2021; pp. 81–98. [Google Scholar]
- Alves, C.A.; Gonçalves, F.L.T.; Duarte, D.H.S. The recent residential apartment buildings’ thermal performance under the combined effect of the global and the local warming. Energy Build. 2021, 238, 110828. [Google Scholar] [CrossRef]
- Tran, H.; Uchihama, D.; Ochi, S.; Yasuoka, Y. Assessment with satellite data of the urban heat island effects in Asian mega cities. Int. J. Appl. Earth Obs. Geoinf. 2006, 8, 34–48. [Google Scholar] [CrossRef]
- Haashemi, S.; Weng, Q.; Darvishi, A.; Alavipanah, S.K. Seasonal variations of the surface urban heat island in a semi-arid city. Remote Sens. 2016, 8, 352. [Google Scholar] [CrossRef]
- Borbora, J.; Das, A.K. Summertime urban heat island study for Guwahati city, India. Sustain. Cities Soc. 2014, 11, 61–66. [Google Scholar] [CrossRef]
- Govind, N.R.; Ramesh, H. The impact of spatiotemporal patterns of land use land cover and land surface temperature on an urban cool island: A case study of Bengaluru. Environ. Monit. Assess. 2019, 191, 1–20. [Google Scholar] [CrossRef]
- Chand, K.; Kuniyal, J.C.; Kanga, S.; Guleria, R.; Meraj, G.; Kumar, P.; Farooq, M.; Singh, S.K.; Nathawat, M.S.; Sahu, N.; et al. Aerosol Characteristics and Their Impact on the Himalayan Energy Budget. Sustainability 2021, 14, 179. [Google Scholar] [CrossRef]
- Kumar, P.; Geneletti, D.; Nagendra, H. Spatial assessment of climate change vulnerability at city scale: A study in Bangalore, India. Land Use Policy 2016, 58, 514–532. [Google Scholar] [CrossRef]
- Du, P.; Bai, X.; Tan, K.; Xue, Z.; Samat, A.; Xia, J.; Li, E.; Su, H.; Liu, W. Advances of four machine learning methods for spatial data handling: A review. J. Geovisualization Spat. Anal. 2020, 4, 1–25. [Google Scholar] [CrossRef]
- Zendehboudi, A.; Baseer, M.A.; Saidur, R. Application of support vector machine models for forecasting solar and wind energy resources: A review. J. Clean. Prod. 2018, 199, 272–285. [Google Scholar] [CrossRef]
- Kanga, S.; Meraj, G.; Farooq, M.; Nathawat, M.S.; Singh, S.K. Analyzing the risk to COVID-19 infection using remote sensing and GIS. Risk Anal. 2021, 41, 801–813. [Google Scholar] [CrossRef] [PubMed]
- Meraj, G.; Farooq, M.; Singh, S.K.; Islam, M.; Kanga, S. Modeling the sediment retention and ecosystem provisioning services in the Kashmir valley, India, Western Himalayas. Modeling Earth Syst. Environ. 2021, 8, 1–26. [Google Scholar] [CrossRef]
- Tomar, P.; Singh, S.K.; Kanga, S.; Meraj, G.; Kranjčić, N.; Đurin, B.; Pattanaik, A. GIS-Based Urban Flood Risk Assessment and Management—A Case Study of Delhi National Capital Territory (NCT), India. Sustainability 2021, 13, 12850. [Google Scholar] [CrossRef]
- Rather, M.A.; Meraj, G.; Farooq, M.; Shiekh, B.A.; Kumar, P.; Kanga, S.; Singh, S.K.; Sahu, N.; Tiwari, S. Identifying the Potential Dam Sites to Avert the Risk of Catastrophic Floods in the Jhelum Basin, Kashmir, NW Himalaya, India. Remote Sens. 2022, 14, 1538. [Google Scholar] [CrossRef]
- Ghoggali, N.; Melgani, F.; Bazi, Y. A multi objective genetic SVM approach for classification problems with limited training samples. IEEE Trans. Geosci. Remote Sens. 2009, 47, 1707–1718. [Google Scholar] [CrossRef]
- Argialas, D.; Harlow, C. Computational Image Interpretation Models: An Overview and a Perspective. Photogramm. Eng. Remote Sens. 1990, 56, 871–886. [Google Scholar]
- Peng, J.; Ma, J.; Liu, Q.; Liu, Y.; Li, Y.; Yue, Y. Spatial-temporal change of land surface temperature across 285 cities in China: An urban-rural contrast perspective. Sci. Total Environ. 2018, 635, 487–497. [Google Scholar] [CrossRef]
- Acero, J.A.; González-Asensio, B. Influence of vegetation on the morning land surface temperature in a tropical humid urban area. Urban Clim. 2018, 26, 231–243. [Google Scholar] [CrossRef]
- Heck, E.; de Beurs, K.M.; Owsley, B.C.; Henebry, G.M. Evaluation of the MODIS collections 5 and 6 for change analysis of vegetation and land surface temperature dynamics in North and South America. ISPRS J. Photogramm. Remote Sens. 2019, 156, 121–134. [Google Scholar] [CrossRef]
- Wan, Z.; Dozier, J. A generalized split-window algorithm for retrieving land-surface temperature from space. IEEE Trans. Geosci. Remote Sens. 1996, 34, 892–905. [Google Scholar]
- Ramachandra, T.V.; Kumar, U. Land surface temperature with land cover dynamics: Multi-resolution, spatio-temporal data analysis of Greater Bangalore. Int. J. Geoinform. 2009, 5, 45–53. [Google Scholar]
- Siddiqui, A.; Kushwaha, G.; Raoof, A.; Verma, A.; Kant, Y. Bangalore: Urban heating or urban cooling? Egypt. J. Remote Sens. Space Sci. 2021, 24, 265–272. [Google Scholar] [CrossRef]
- Guchhait, S.K.; Sengupta, S. Determinants and Decomposition of Poverty of Rural India: Glimpses from the Purulia District of West Bengal. J. Asian Afr. Stud. 2021, 56, 1251–1270. [Google Scholar] [CrossRef]
- Mathur, O. Urban Poverty in Asia; Asian Development Bank: Metro Manila, Philippines, 2013; pp. 1–122. [Google Scholar]
- Meraj, G.; Singh, S.K.; Kanga, S.; Islam, M. Modeling on comparison of ecosystem services concepts, tools, methods and their ecological-economic implications: A review. Modeling Earth Syst. Environ. 2021, 8, 15–34. [Google Scholar] [CrossRef]
- Bera, A.; Taloor, A.K.; Meraj, G.; Kanga, S.; Singh, S.K.; Đurin, B.; Anand, S. Climate vulnerability and economic determinants: Linkages and risk reduction in Sagar Island, India; A geospatial approach. Quat. Sci. Adv. 2021, 4, 100038. [Google Scholar] [CrossRef]
- Farooq, M.; Rashid, H.; Meraj, G.; Kanga, S.; Singh, S.K. Assessing the Microclimatic Environmental Indicators of Climate Change of a Temperate Valley in the Western Himalayan Region. In Climate Change, Disaster and Adaptations; Springer: Cham, Switzerland, 2022; pp. 47–61. [Google Scholar]
- Taloor, A.K.; Manhas, D.S.; Kothyari, G.C. Retrieval of land surface temperature, normalized difference moisture index, normalized difference water index of the Ravi basin using Landsat data. Appl. Comput. Geosci. 2021, 9, 100051. [Google Scholar] [CrossRef]
- Jamali, A.A.; Kalkhajeh, R.G.; Randhir, T.O.; He, S. Modeling relationship between land surface temperature anomaly and environmental factors using GEE and Giovanni. J. Environ. Manag. 2022, 302, 113970. [Google Scholar] [CrossRef]
- Wang, Y.; Yi, G.; Zhou, X.; Zhang, T.; Bie, X.; Li, J.; Ji, B. Spatial distribution and influencing factors on urban land surface temperature of twelve megacities in China from 2000 to 2017. Ecol. Indic. 2021, 125, 107533. [Google Scholar] [CrossRef]
- Ye, B.; Jiang, J.; Liu, J.; Zheng, Y.; Zhou, N. Research on quantitative assessment of climate change risk at an urban scale: Review of recent progress and outlook of future direction. Renew. Sustain. Energy Rev. 2021, 135, 110415. [Google Scholar] [CrossRef]
- World Bank. Poverty and Shared Prosperity 2018: Piecing Together the Poverty Puzzle; International Bank for Reconstruction and Development/The World Bank, Street NW: Washington, DC, USA, 2018. [Google Scholar]
- Seager, J.; Bechtel, J.; Bock, S.; Dankelman, I.E.M. Global Gender and Environment Outlook; United Nations Environment Programme (UNEP): Nairobi, Kenya, 2016. [Google Scholar]
- Bhukta, A. No Poverty: How Much, How Far. In Sustainable Development Goals 2020; Springer: Cham, Switzerland, 2020; pp. 1–11. [Google Scholar]
- Querol, S.E.; Gill, P.; Iqbal, R.; Kletter, M.; Ozdemir, N.; Al-Khudairy, L. Adolescent undernutrition in South Asia: A scoping review. Nutr. Res. Rev. 2021, 35, 1–29. [Google Scholar]
- Farooq, M.; Meraj, G.; Kanga, S.; Nathawat, R.; Singh, S.K.; Ranga, V. Slum Categorization for Efficient Development Plan—A Case Study of Udhampur City, Jammu and Kashmir Using Remote Sensing and GIS. In Geospatial Technology for Landscape and Environmental Management; Springer: Singapore, 2022; pp. 283–299. [Google Scholar]
- Kala, S. Global governance and India’s food governance and security. In Food Governance in India; Routledge: London, UK, 2022; pp. 102–117. [Google Scholar]
- Alkire, S.; Oldiges, C.; Kanagaratnam, U. Examining multidimensional poverty reduction in India 2005/6–2015/16: Insights and oversights of the headcount ratio. World Dev. 2021, 142, 105454. [Google Scholar] [CrossRef]
- Meraj, G.; Kanga, S.; Kranjčić, N.; Đurin, B.; Singh, S.K. Role of natural capital economics for sustainable management of earth resources. Earth 2021, 2, 622–634. [Google Scholar] [CrossRef]
- Kanga, S.; Singh, S.K.; Meraj, G.; Kumar, A.; Parveen, R.; Kranjčić, N.; Đurin, B. Assessment of the Impact of Urbanization on Geoenvironmental Settings Using Geospatial Techniques: A Study of Panchkula District, Haryana. Geographies 2022, 2, 1–10. [Google Scholar] [CrossRef]
- Thakur, V.; Parida, D.J.; Raj, V. Sustainable municipal solid waste management (MSWM) in the smart cities in Indian context. Int. J. Product. Perform. Manag. 2022. Available online: https://www.emerald.com/insight/content/doi/10.1108/IJPPM-10-2021-0588/full/html (accessed on 17 July 2022). [CrossRef]
- Rajan, S.I. (Ed.) India Migration Report 2013: Social Costs of Migration; Taylor & Francis: Abingdon, UK, 2022. [Google Scholar]
- Khan, Z.A. Poverty alleviation and plight of migrant workers: Socio-legal issues in the pandemic phase. Int. J. Hum. Rights Const. Stud. 2022, 9, 39–50. [Google Scholar] [CrossRef]
- Mahajan, V.; Singh, J. Lives, Livelihoods and Environment: The Challenge of Sustainable Development Goals in India. In Financial Crises, Poverty and Environmental Sustainability: Challenges in the Context of the SDGs and Covid-19 Recovery; Springer: Cham, Switzerland, 2022; pp. 93–105. [Google Scholar]
- Antoniades, A.; Antonarakis, A.S.; Gilman, J.; Kempf, I. The Crises-Poverty-Sustainability Nexus in the Context of the Sustainable Development Goals and Covid-19. In Financial Crises, Poverty and Environmental Sustainability: Challenges in the Context of the SDGs and Covid-19 Recovery; Springer: Cham, Switzerland, 2022; pp. 1–15. [Google Scholar]
- Ahmadi, H.; Tawheed, Q.; Rafiqee, N.; Qaderi, K.B.; Sharifi, M.S.; Sharifi, H. The cause of Kabul’s environmental problems is its impact on economic and human health. Int. J. Adv. Eng. Res. Sci. 2022, 9, 2. [Google Scholar] [CrossRef]
- Antonarakis, A.S.; Pacca, L.; Antoniades, A. The effect of financial crises on deforestation: A global and regional panel data analysis. Sustain. Sci. 2022, 17, 1037–1057. [Google Scholar] [CrossRef]
- Zgheib, W. (Ed.) Impacts of Political Instability on Economics in the MENA Region; IGI Global: Hershey, PA, USA, 2019. [Google Scholar]
- El Kayaly, D.; Hazem, N.; Fahim, I. Impact of COVID 19 on Small and Medium-Sized Enterprises: Evidence from Egyptian Plastic Packaging Industry. In Proceedings of the 2021 Third International Sustainability and Resilience Conference: Climate Change, Sakheer, Bahrain, 15–16 November 2021. [Google Scholar]


| S. No. | Path | Row | Date of Acquisition/ Temporal Resolution | Satellite | Spatial Resolution |
|---|---|---|---|---|---|
| 1 | 144 | 51 | 3 April 2021 | Landsat-5 (TM) (Bands 1–5, and 7) | 30 m |
| 2 | 144 | 51 | 7 March 2011 | Landsat-5 (TM) (Bands 1–5, and 7) | 30 m |
| 3 | 144 | 51 | 27 March 2001 | Landsat-8 (OLI) (Bands 1–8) | 30 m |
| 4 | - | - | 8-day avg. april 2001 till 2021 (UHI events, max T) | MODIS (11 A2) | 1000 m |
| Error Matrix of LULC from LANDSAT OLI 2021 Using Ground Truthing | |||||||
|---|---|---|---|---|---|---|---|
| Manually Classified LULC Categories | Grand Total | Manual classification accuracy | |||||
| SVM Classified LULC Categories | BU | W | V | Ot | |||
| BU | 33 | 33 | 100.00% | ||||
| W | 31 | 4 | 35 | 88.57% | |||
| V | 1 | 29 | 30 | 96.67% | |||
| Ot | 38 | 38 | 100.00% | ||||
| Grand Total | 34 | 31 | 33 | 38 | 136 | ||
| SVM classification accuracy | 97% | 100% | 88% | 100% | |||
| Total Correct 131; Total Samples 136; Overall Accuracy 96.32; Kappa Statistic 0.91 | |||||||
| Error Matrix of LULC from LANDSAT TM 5 (C2-L1) 2011 using Google Historical Imagery | |||||||
| Manually Classified LULC Categories | Grand Total | Manual classification accuracy | |||||
| SVM Classified LULC Categories | BU | W | V | Ot | |||
| BU | 31 | 2 | 33 | 93.94% | |||
| W | 31 | 4 | 35 | 88.57% | |||
| V | 2 | 28 | 30 | 93.33% | |||
| Ot | 38 | 38 | 100.00% | ||||
| Grand Total | 31 | 33 | 32 | 40 | 136 | ||
| SVM classification accuracy | 100% | 94% | 88% | 95% | |||
| Total Correct 128; Total Samples 136; Overall Accuracy 94.12; Kappa Statistic 0.9 | |||||||
| Error Matrix of LULC from LANDSAT TM 2001 (C2-L1) using Google Historical Imagery | |||||||
| Manually Classified LULC Categories | Grand Total | Manual classification accuracy | |||||
| SVM Classified LULC Categories | BU | W | V | Ot | |||
| BU | 30 | 1 | 1 | 1 | 33 | 90.91% | |
| W | 1 | 30 | 4 | 35 | 85.71% | ||
| V | 2 | 28 | 30 | 93.33% | |||
| Ot | 38 | 38 | 100.00% | ||||
| Grand Total | 31 | 33 | 33 | 39 | 136 | ||
| SVM classification accuracy | 97% | 91% | 85% | 97% | |||
| Total Correct 126; Total Samples 136; Overall Accuracy 93.65; Kappa Statistic 0.88 | |||||||
| BU Built-up, W Water, V Vegetation, O Others | |||||||
Publisher’s Note: MDPI stays neutral with regard to jurisdictional claims in published maps and institutional affiliations. |
© 2022 by the authors. Licensee MDPI, Basel, Switzerland. This article is an open access article distributed under the terms and conditions of the Creative Commons Attribution (CC BY) license (https://creativecommons.org/licenses/by/4.0/).
Share and Cite
Kanga, S.; Meraj, G.; Johnson, B.A.; Singh, S.K.; PV, M.N.; Farooq, M.; Kumar, P.; Marazi, A.; Sahu, N. Understanding the Linkage between Urban Growth and Land Surface Temperature—A Case Study of Bangalore City, India. Remote Sens. 2022, 14, 4241. https://doi.org/10.3390/rs14174241
Kanga S, Meraj G, Johnson BA, Singh SK, PV MN, Farooq M, Kumar P, Marazi A, Sahu N. Understanding the Linkage between Urban Growth and Land Surface Temperature—A Case Study of Bangalore City, India. Remote Sensing. 2022; 14(17):4241. https://doi.org/10.3390/rs14174241
Chicago/Turabian StyleKanga, Shruti, Gowhar Meraj, Brian Alan Johnson, Suraj Kumar Singh, Muhammed Naseef PV, Majid Farooq, Pankaj Kumar, Asif Marazi, and Netrananda Sahu. 2022. "Understanding the Linkage between Urban Growth and Land Surface Temperature—A Case Study of Bangalore City, India" Remote Sensing 14, no. 17: 4241. https://doi.org/10.3390/rs14174241