4.1. Determination of W0 Based on the Altimetry Data
In order to effectively eliminate the influence of tidal model error on the altimetry satellite data, this study calculated the global mean sea surface height by combining 24 years of multi-satellite altimetry data from 1997 to 2020. The process of transmitting compressed pulses from the satellite altimeter to the Earth’s surface is affected by various objective factors, which leads to the distance from the satellite to the sea surface calculated directly from the observation being time biased. According to the data-editing standards provided in the L2p user manual [
22], this study corrected the geophysical and environmental errors of the satellite altimetry data. These corrections included the ionospheric correction, tropospheric correction, solid tide correction, polar tide correction, sea tide correction, sea state deviation correction and dynamic atmospheric pressure correction. In order to eliminate invalid or inaccurate observations, data editing and quality control of the altimetry satellite data were also required.
The preprocessed altimetry satellite data still contained certain errors, such as geophysically corrected residuals and environment-corrected residuals, satellite orbit determination errors and sea-level time-varying signals. Different satellite altimetry data have certain differences in data coverage, spatiotemporal resolution, accuracy level and other aspects. Therefore, the preprocessed sea surface height data required further data fusion processing and adjustment to obtain the relative steady-state average sea surface height data.
In order to weaken the long-wave signal of sea surface changes in the altimetry satellite data, the altimetry satellite data was first adjusted using a collinear adjustment approach. The Jason series of satellites is the successor to the T/P satellite. The Jason-1, Jason-2 and Jason-3 satellites have the same ground trajectory as the T/P satellite. Therefore, the altimetry data of the three altimetry satellites under the Jason series were selected to supplement the sea surface height data missing from the T/P satellite in the period after the operation stopped. Globally, the mean sea surface of the T/P satellites is about 15 cm lower than that of Jason-1 [
38]; the average sea surface of the Jason-1 satellite is about 8 cm lower than that of the Jason-2 satellite [
19]; and the average sea surface height of the Jason-2 satellite is about 3 cm lower than that of the Jason-3 satellite [
20]. The systematic differences between sea surface height data should be eliminated before the fusion of the T/P, Jason-1, Jason-2 and Jason-3 satellite altimetry data. T/P and Jason-1, Jason-1 and Jason-2, and Jason-2 and Jason-3 have the same period of repeated observation data of the same orbit, which is called the observation data accompanying the flight phase. Using the data from this stage, the T/P altimetry satellite data was used as the basis to systematically correct the differences in the data of the Jason-1, Jason-2 and Jason-3 satellites. To do this, the data of the T/P satellites and Jason series altimetry satellites were set up as a group for common collinear processing. Other altimetry satellite data were individually adjusted via collinear processing. This resulted in six sets of altimetry satellite data. The reference trajectories of six sets of altimetry satellite data were determined, all periodic sea surface height data were interpolated into the reference trajectory according to the collinear processing method, and then the average sea surface height data were obtained.
Table 2 shows the results of the crossover difference between the six groups of altimetry satellite data before and after collinear processing. The crossover difference is the difference between the sea surface heights of two altimetry arcs interpolated at the intersection. The mean and standard deviation of the crossover difference of the sea surface height data of different satellites decreased significantly after the collinear processing, which showed that collinear processing was feasible and effective at weakening the time-varying error and random characteristics of sea surface height data. After the collinear processing of the data of T/P satellites and Jason series satellites, the standard deviation of the crossover difference decreased by about 9 cm, and the standard deviation was 1.73 cm; the absolute value of the mean of the crossover difference decreased by about 0.04 cm.
After the collinear processing of the six sets of altimetry data, the long-wave signal of the sea level change in the altimetry data was effectively eliminated, but there was still some residual error in the average sea surface height data. These residuals were mainly radial orbit errors, short-wave signals of sea-level changes, and residuals corrected for various geophysical and environmental errors. Therefore, the crossover adjustment approach was required to further improve the accuracy of the altimetry data. In this study, the new crossover adjustment method was used to further adjust the altimetry data of six groups. The results of altimetry satellite data after the crossover adjustment are shown in
Table 3. The mean value and standard deviation of the crossover differences of SSH of all satellite altimetry data were decreased by at least one order of magnitude, among which the satellite altimetry data as a combined T/P and Jason series had the highest accuracy, and the standard deviation of the crossover differences of the SSH values had decreased to 0.0002 m. The crossover adjustment method could effectively weaken various residuals in the altimetry satellite data and further improve the systematic bias between multi-source satellite altimetry data.
After various forms of data processing, the altimetry data still contained a residual error, radial orbit error, altimeter instrument deviation and inconsistency of different satellite reference frames. In order to integrate all altimetry satellite data, the T/P series mean sea surface data with the highest accuracy was taken as the benchmark, the data quality of other satellite data was controlled, the systematic deviation and various residual errors in the data were eliminated, and the global mean sea surface data were obtained. See
Table 4 for the parameter results of different satellites converted to T/P satellites. The deviations of all satellite data in the x, y and z directions were small, which was at the millimeter or sub-millimeter level. The overall deviation of satellite data was at the decimeter level, and the systematic deviation of ERS-2 data was the largest. This was because the observation time of ERS-2 was quite different from that of the T/P satellite, which introduced the influence of the overall time change of the mean sea surface.
Altimetry satellite data were highly accurate after the collinear processing, cross-adjustment processing and unification of the reference frames.
Figure 3 shows the distribution of the average sea surface height data in the oceanic region after the adjustment approach.
The CLS15, DTU18 and SDUST2020 mean sea level models were used to evaluate the accuracy of the mean sea surface height data. The statistical results of the difference are shown in
Table 5. The standard deviation of the difference between the mean sea surface height data obtained in this study and the mean sea level model was in the order of centimeters. This result showed that the mean sea surface height data in this study were reliable and could be used to calculate the geoid constant. The mean value of the difference between the average sea surface height data obtained in this study and MSS models was in decimeters. This was because the continuous observation time of the data used in this study was 24 years and the global mean sea surface rose by about 3.7 mm every year. Based on the continuously observed T/P and Jason satellite altimetry data, an overall difference between the average sea surface height data and other models was caused. This difference was reasonable and acceptable.
In this study, the geoid constant was calculated using grid-averaged sea surface height data with a resolution of 1 degree in the global ocean area. The Shepard grid method was used to grid the average sea surface height data of the oceanic region with latitudes ranging from 80° S to 80° N. The result of calculating the geopotential value W
0 of the geoid by combining GMSS data and EIGEN-6C4 model was 62,636,856.8200 m
2s
−2.
Table 6 summarizes the findings of some studies that aimed to estimate the geopotential value W
0. As can be seen, the choice of input data had an impact on the estimation of W
0.
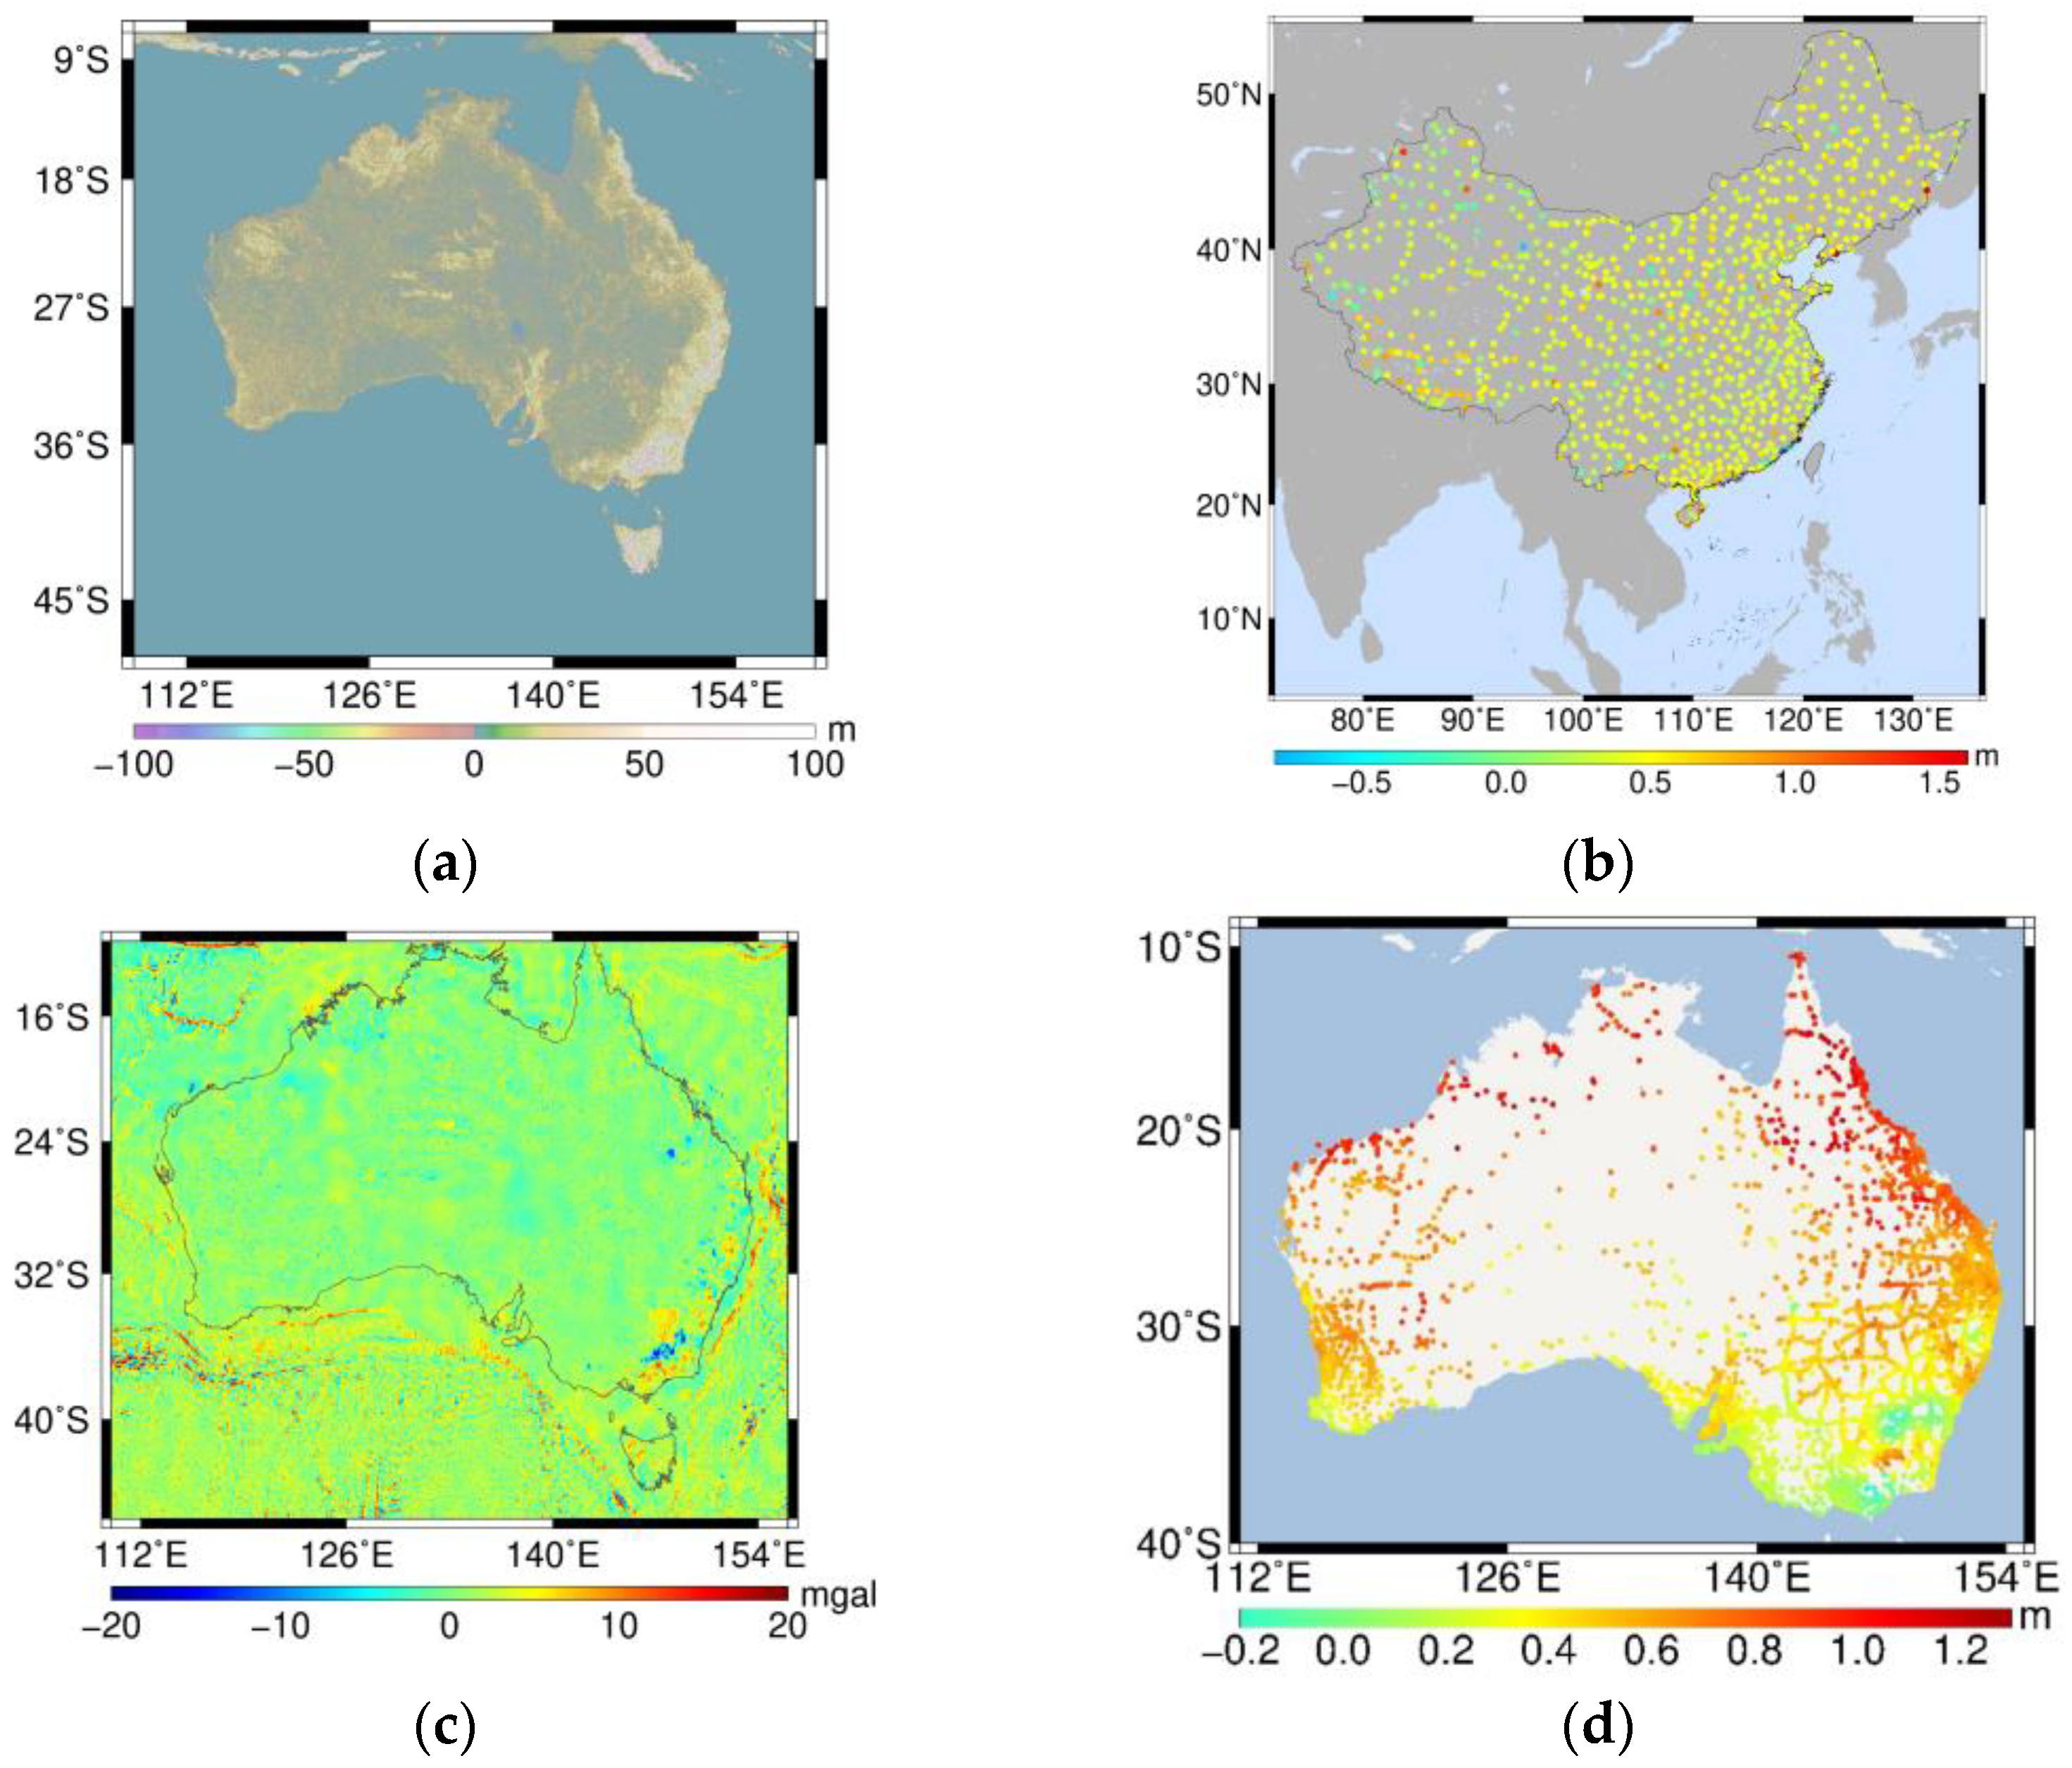
4.3. Determination of the Australian Height Datum Parameters Based on the Geodetic Boundary Value Problem Approach
The combined GNSS/leveling data, gravity anomaly data and GBVP approach could calculate the AHD parameters. The vertical offset is related to the deviation between the geometric geoid and the gravimetric geoid. The gravimetric geoid can be determined based on the RCR technique. In this technique, EIGEN-6C4 and the RTM provide the long and short wavelength parts of the gravity field spectrum, and the residual gravity field spectrum is provided by the residual gravity anomaly. We used
Shuttle Radar Topographic Mission (SRTM) data and the topographic reference model to build the RTM. The topographic reference model adopts DTM2006 [
36]. The distribution of residual terrain model elevations in Australia is shown in
Figure 4b.
The RTM and forward-modeling gravitational potential formulas for prisms were used to calculate the RTM geoid height and the RTM gravity anomaly, and the radius of integration was 2 degrees [
33,
36]. Combining the RTM gravity anomaly, GGM gravity anomaly and free-air gravity anomaly data allowed for determining the residual gravity anomaly. The distribution of the residual gravity anomaly in Australia is shown in
Figure 4c.
Stokes integration with the residual gravity anomalies can determine the residual geoid height. We used EIGEN-6C4 to calculate the GGM geoid height and used GNSS/leveling data to calculate the geometric geoid height. Combining the GGM geoid height, geometric geoid height, residual geoid height and RTM geoid height allowed for determining the vertical offset of the Australian height datum relative to the global vertical datum
.
Figure 4d shows the vertical offsets of the AHD calculated using GNSS/leveling data.
The vertical offsets of the AHD include an obvious inclination phenomenon in the north–south direction. Systematic errors in the result were absorbed using a parametric model, and the parameter results of the parametric model are shown in
Table 7. The vertical offset of the AHD relative to the global vertical datum W
0 was 0.4885 m, and the geopotential value of the Australian Height Datum was 62,636,851.935 m
2s
−2.


