Article

Stepwise Construction and Integration of Ecological Network in Resource-Based Regions: A Case Study on Liaoning Province, China

1
College of Geoscience and Surveying Engineering, China University of Mining & Technology (Beijing), D11 Xueyuan Road, Haidian District, Beijing 100083, China
2
Academy of Eco-Civilization Development for Jing-Jin-Ji Megalopolis, Tianjin Normal University, Tianjin 300387, China
3
School of Mining and Geomatics Engineering, Hebei University of Engineering, 19 Taiji Road, Handan 056038, China
*
Author to whom correspondence should be addressed.
Remote Sens. 2024, 16(17), 3228; https://doi.org/10.3390/rs16173228 (registering DOI)
Submission received: 3 July 2024 / Revised: 20 August 2024 / Accepted: 29 August 2024 / Published: 31 August 2024

Abstract

:
Ecological networks are an effective strategy to maintain regional ecological security. However, current research on ecological network construction in areas with large-scale resource extraction is limited. Moreover, classic ecological network construction methods do not perform satisfactorily when implemented in heavily damaged mining landscapes. Taking the example of Liaoning Province, China, a framework for stepwise renewal of ecological networks was proposed, which integrates basic ecological sources and other sources that include mining areas. The framework was based on multi-source ecological environment monitoring data, and all potential ecological sources were extracted and screened using an MSPA model and the area threshold method. Further, ecological sources were classified into two types and three levels based on the influence of abandoned mines and the characteristics of ecosystem services in the ecological sources. Ecological corridors were extracted using the MCR model. An ecological corridor optimization process based on combining the gravity model with addition and removal rules of corridors was proposed. The results indicated that the basic ecological network in Liaoning Province included 101 ecological sources and 162 ecological corridors, and the supplementary ecological network included 28 ecological sources and 67 ecological corridors. The ecological sources were divided into two types, and corridors were divided into three types. The basic ecological network exhibited a spatial distribution of discrete connections in the west and close connections in the east. Changes in ecological network topological indicators indicated that a supplementary ecological network strengthened the structural performance of the regional ecological network, expanding spatial coverage, filling hollow areas, and enriching local details of the regional ecological network. Regulation strategies were proposed for ecological sources with different connection modes. The number of ecological sources implementing restrictive development, pattern optimization, and protective development were 101, 12, and 16, respectively. This paper provides a constructing framework of ecological networks adapted for resource-based regions. This method can support decisions for the environmental governance of mines, thus contributing to a balance between resource exploitation and ecological protection in regions.

1. Introduction

While rapid industrialization promotes social progress and drives economic development, it also has a negative effect on the ecological environment, such as soil erosion, land desertification, etc. [1,2,3]. Mining areas are a special type of artificial landscape; long-term, large-scale mining activities change the structure of land cover, leading to environmental issues such as vegetation degradation, heavy metal pollution, and geological disasters [4,5,6]. In the context of ecological civilization construction, the solutions for coordinating conflicts between environmental protection and social progress in mining areas need to be further studied. The hazards of mining activities in resource-based regions are mainly a consequence of the drastic changes in the surface landscape caused by urbanization, alongside the physical and chemical pollution caused by excessive resource utilization [7]. The development of the mining industry has led to the rapid renewal of urban infrastructure, which has an impact on local ecological and agricultural land [8]. Wastewater containing heavy metals is discharged during mining activities, which pollutes the surrounding soil and water bodies. On the other hand, mining wasteland is extensive, which affects the recovery of the local ecological environment and further aggravates the decline of regional ecological functions [9]. Therefore, if vegetation is not restored and protected in areas where extensive mining activities occur, severe consequences will take place, including the degradation and loss of natural ecosystems. Many environmental remediation projects for mining areas have been carried out by the local government to achieve the goal of constructing “green mines” in recent years. However, mines are often located in ecologically sensitive and vulnerable areas, where the ecological environment quality is low. Further, engineering in some mining areas with high ecological sensitivity and ecological importance is difficult, resulting in the lower priority of ecological restoration in the area. Often, vegetation planting is the main restoration measure in mining areas, which has a smaller focus on the characteristics of regional ecosystem services [10,11]. This is because most of these projects are carried out from a small-scale perspective. Therefore, it is crucial to explore how to reasonably plan ecological restoration in mining areas at a regional scale.
Constructing ecological security networks helps coordinate the restoration and management of key regional ecological elements. These ecological networks aim to restore and rebuild the habitats of key ecological elements, which achieves the goal of effectively regulating specific ecological processes and ensuring the full utilization of ecosystem services [12]. Thus far, existing studies have primarily focused on cities [13,14,15], arid and semi-arid areas [16,17], agro-pastoral areas [18], mountainous regions, and urban fringe areas [19]. The ecosystems in these areas are diverse and are easily disturbed. Xu et al.’s study showed that identifying important ecological elements in large opencast coal mining areas and constructing ecological networks can optimize the local landscape pattern and protect the flow of ecological functions [9]. At present, the ecological network of mining areas has been mainly concentrated on the micro-scale; few studies have been conducted at the macro-scale. Researchers have tried to build an ecological network in Shuozhou City, a typical resource-based city, to guide the planning of each ecological regulation zone [20]. Qiu et al. explored how to enhance ecological functions by building ecological networks in mining cities and used Xuzhou as an example [21]. These studies have begun to build macro-scale ecological networks in mining cities, but few have quantified the contribution of mining areas to the construction of ecological networks. The basic method of “source-corridors-stepping stone” has been formed by past ecological network studies [22]. The recent progress of remote sensing technology has provided an effective tool for constructing macro-scale ecological networks. The combination of multi-source remote-sensing data and geographic information analysis technology can effectively identify elements of ecological networks. High-precision monitoring data of the ecosystem quality and morphological spatial pattern analysis (MSPA) technology were used to extract ecological sources. Ecological sources are ecological patches that are significant in maintaining the integrity of ecosystems. These ecological patches are extracted based on the landscape type, area, ecological importance, and landscape connectivity [23,24,25,26]. Mining areas and surrounding areas are often not selected as ecological sources due to the poor environment [9,27]. Hence, this classic method needs to be adapted to resource-based regions. A spatial classification system based on the influence of mines and ecosystem services was proposed in this research to further divide potential ecological sources. The MCR model can be simulated by using the cost–distance tool in the GIS platform. The minimum cumulative resistance model (MCR) simulates the shortest connection by integrating ecological sources and resistance surfaces [28,29]. Land cover is usually employed to construct the resistance surface. For most studies, the assignment of resistance values of land cover is usually based on corresponding landscape types [30,31,32], but this method fails to reflect the influence of artificial disturbances on the resistance values of land cover. Ecological risk represents the potential harmful effects of human activities on the structure and function of ecosystems [33], which is an important indicator to evaluate human activities. Therefore, the ecological risk index (ERI), which accounts for the impact of mining activities and geological disasters, was used to correct the resistance value of land use types in the study. The gravity model is applied to quantitatively analyze the spatial connection strength between ecological sources by regarding ecological sources as particles. Therefore, the gravity model is a classic approach for assessing the importance of ecological corridors and has often been used to remove redundant corridors [34,35,36]. However, this model may not be applicable to ecological sources in mining areas because of the unstable ecological quality and higher cumulative resistance of the related corridors [9]. To address this issue, we optimized the ecological network based on the gravity model and specific corridor removal rules.
A certain amount of mining wasteland in resource-based regions has great potential for transformation to ensure ecosystem functions and sustainable development [22]. Restoring the ecological environment and enhancing the ecological value of resource-based regions are essential measures for the Chinese government to achieve the goal of “ecological civilization construction” [20]. This study can provide a reference for regions with important ecological functions experiencing environmental damage caused by mining activities. In this paper, a new framework to stepwise update the ecological network is proposed, which aims to explore the effect of mining areas participating in ecological network construction through the construction and optimization of ecological networks in a typical mining province. The framework establishes the potential connections between basic ecologically important areas and abandoned mines. The detailed objectives of this study are as follows: (1) to extract and classify the elements of ecological networks according to the morphological spatial pattern and degree of damage; (2) to use the framework of stepwise construction and renewal to achieve the optimization of ecological networks; and (3) to evaluate the integration effect of different levels of supplementary ecological networks based on the structural characteristics of the ecological network.

2. Materials and Methods

2.1. Study Area and Data Source
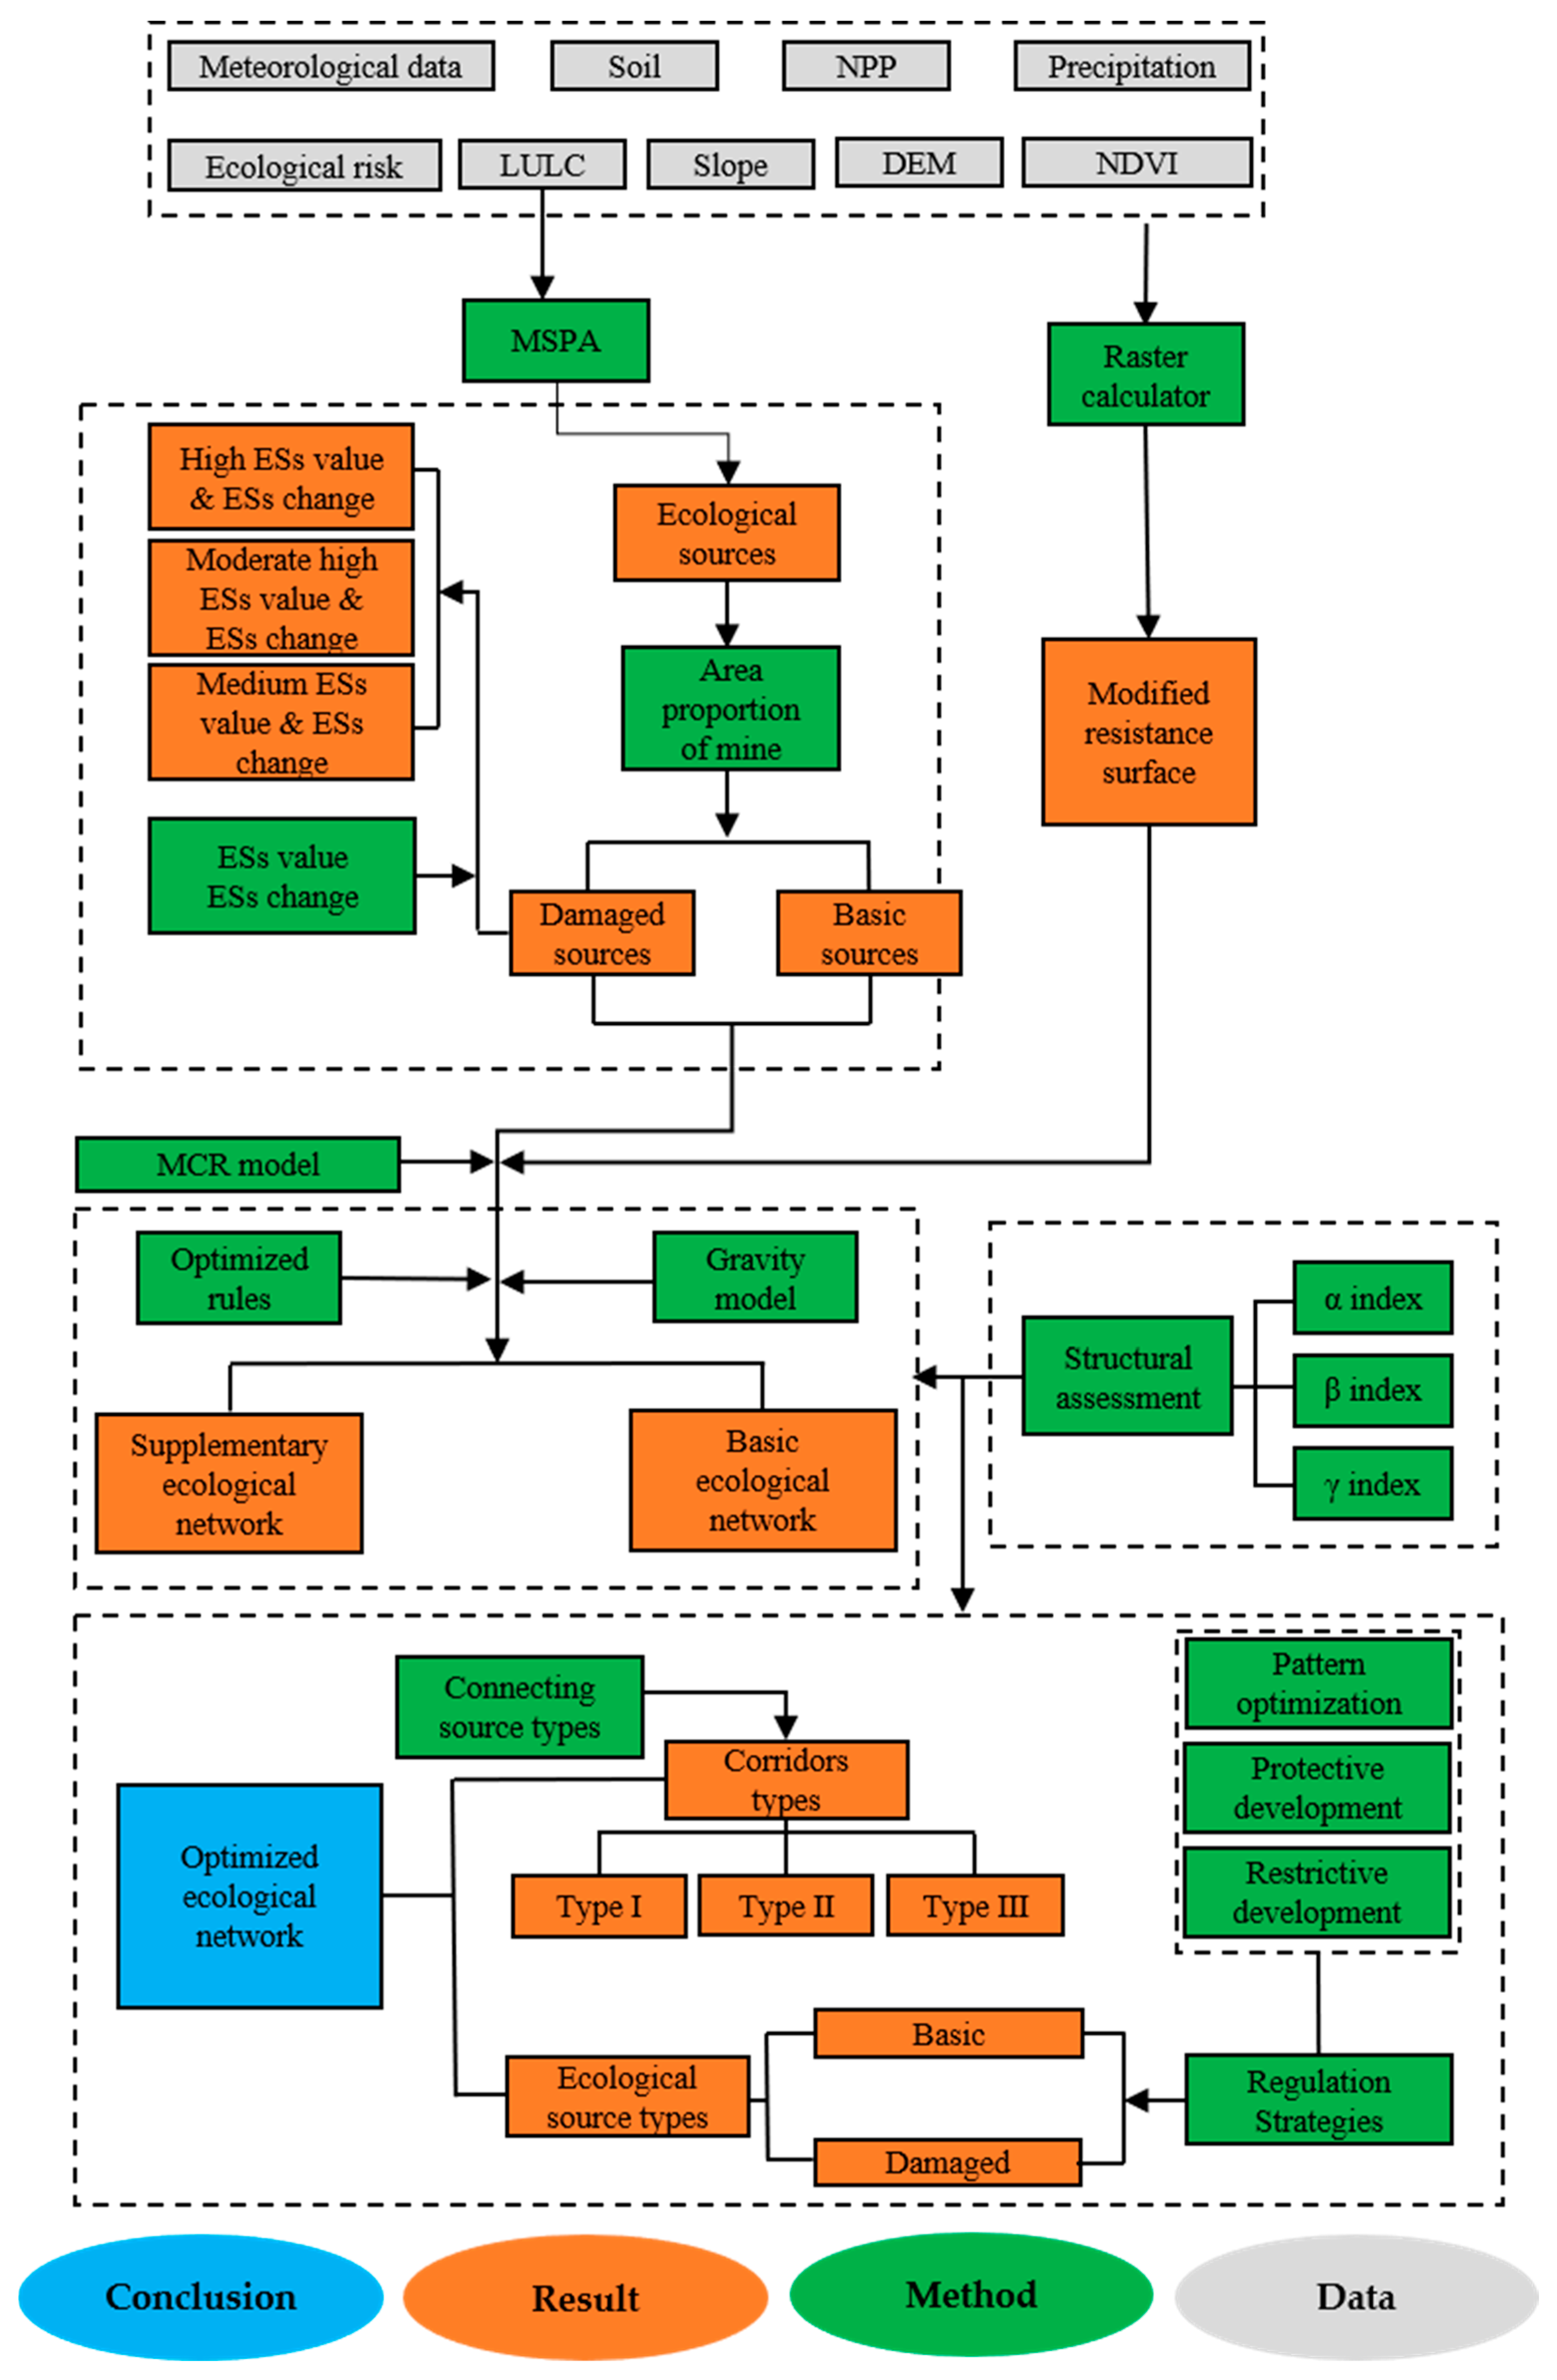
Liaoning is located in northeast China (38°43′–43°26′N, 118°53′–125°46′E) (Figure 1). The province covers an area of 148,000 km2, with a population of 42.59 million and a gross domestic product (GDP) of 2897.51 billion yuan in 2022, and consists of 14 municipal administrative divisions. Liaoning Province has a monsoon climate typical of medium latitudes with sufficient light throughout the year, receiving 2100–2600 h of sunshine per year. According to the description from the website of the government of Liaoning Province, the terrain is high in the eastern and western areas and low in the northern and southern areas, with eight main types of land cover: forests, grasslands, shrubland, wetlands, waterbodies, towns, cultivated land, and oceans. Typical ecosystem services in Liaoning Province include carbon storage, water yield, habitat quality, and sand fixation [37,38,39], making it an important ecological function area in China. Liaoning Province is an energy base with a long history in China, containing more than 110 kinds of mineral resources, including coal, magnesite, and iron. It also has the highest reserves of minerals such as boron, iron, and magnesite in the country. Mining activities and related human disturbance have observably affected ecosystem processes in local areas, resulting in soil erosion, soil wind erosion, and mining-related geological disasters. Until 2021, there were 2983.3 square kilometers of historical abandoned mines in Liaoning Province. There are serious ground subsidence problems in the coalfield mining areas of Fuxin City, Fushun City, Benxi City, Shenyang City, and Liaoyang City. This land can be restored into cultivated land, forest, or construction land through land reclamation and ecological restoration.
Data used in this mainly included the following: (1) Land use type data (30 m) from 2000, 2010, and 2020 were provided by the GlobeLand30 website (https://www.geodata.cn, accessed on 10 March 2023). (2) Administrative division vector data, mining area vector data, and basin vector data were supplied by the Department of Natural Resources of Liaoning Province. (3) The 2000, 2010, and 2020 NDVI data (250 m) were downloaded from MODIS (https://search.earthdata.nasa.gov/, accessed on 5 April 2023). (4) The digital elevation model (DEM) data were downloaded from the NASADEM dataset (https://search.earthdata.nasa.gov/search, accessed on 2 March 2023) (30 m), which is a reprocessing of the SRTMDEM data (90 m). Its accuracy was improved by merging the auxiliary data (ASTER GDEM, ICESat GLAS, and PRISM datasets). (5) The slope data were obtained by using the ee.Terrain.slope method of the GEE platform based on the DEM data. (5) Precipitation data (2000, 2010, and 2020) were downloaded from the National Earth System Science Data Center (http://www.geodata.cn/, accessed on 7 May 2023). (6) Soil data (1 km) were obtained from the Harmonized World Soil Database (HWSD). (7) NPP data were downloaded from MODIS (https://search.earthdata.nasa.gov/, accessed on 12 March 2023). The project of original data was switched using the MRT tool, and the maximum value composite method (MVC) was used to reduce the influence of clouds to obtain the final result. (8) The temperature, wind speed, and humidity were downloaded from the China Meteorological Data Service Center (https://data.cma.cn, accessed on 15 May 2023). (9) ETO data were obtained from the InVEST (version 3.10.2) website (https://naturalcapitalproject.stanford.edu/software/invest/, accessed on 21 April 2023).

2.2. Study Design

The ecological network of the study area consists of the following elements (a detailed description can be found in Figure S1): The ecological sources were divided into two types—basic ecological sources and damaged ecological sources, which meet the general selection criteria for source patches. The difference between basic ecological sources and damaged ecological sources is the degree of impact of mining activities. The habitat quality of basic ecological sources is better, and these sources are the basis for maintaining regional ecological security. Furthermore, as the intensity of mining activities within the ecological sources is low, it is a little difficult to restore and protect ecological sources. Damaged ecological sources refer to patches that have been greatly affected by mining activities. These patches can provide basic ecosystem services for local areas, but it is difficult to implement ecological protection and restoration projects. Ecological corridors within ecological networks were classified based on the ecological sources connected at both ends. Specifically, ecological corridors were classified into three types: type I (basic source to basic source); type II (basic source to damaged source); and type III (damaged source to damaged source). Basic ecological sources are more worthy of protection and restoration than ecological sources with artificial surfaces, based on the general view. Thus, the priority of corridor construction is type I > type II > type III.
The methodological framework is shown in Figure 2. This study emphasized ecological networks using ecological sources and connecting corridors to quantify the effects of damaged ecological sources participating in ecological networks and optimize the regional ecological landscape pattern. Further, regulation strategies were proposed for ecological sources. The methodological framework of our analysis can be divided into three parts. The first stage was to extract and divide ecological sources. The ecological sources were identified using the MSPA method and classified into basic sources and damaged sources based on the proportion of mining areas and buffer zones in the ecological sources; damaged ecological sources were classified in terms of the importance and change in ecological services. Secondly, a system of factors of resistance surfaces was constructed, and the resistance value of land cover was revised using the ecological risk index. Using basic ecological sources, the basic ecological network was determined through the MCR model, and damaged sources of different levels were employed to construct supplementary ecological networks. Thirdly, based on the gravity model and specific rules, different-level supplementary ecological networks were integrated into the basic ecological network. The changes in structural characteristics (α, β, γ) were used to evaluate the effect of stepwise ecological network construction. Finally, specific regulation strategies were adopted for ecological sources with different connection modes.

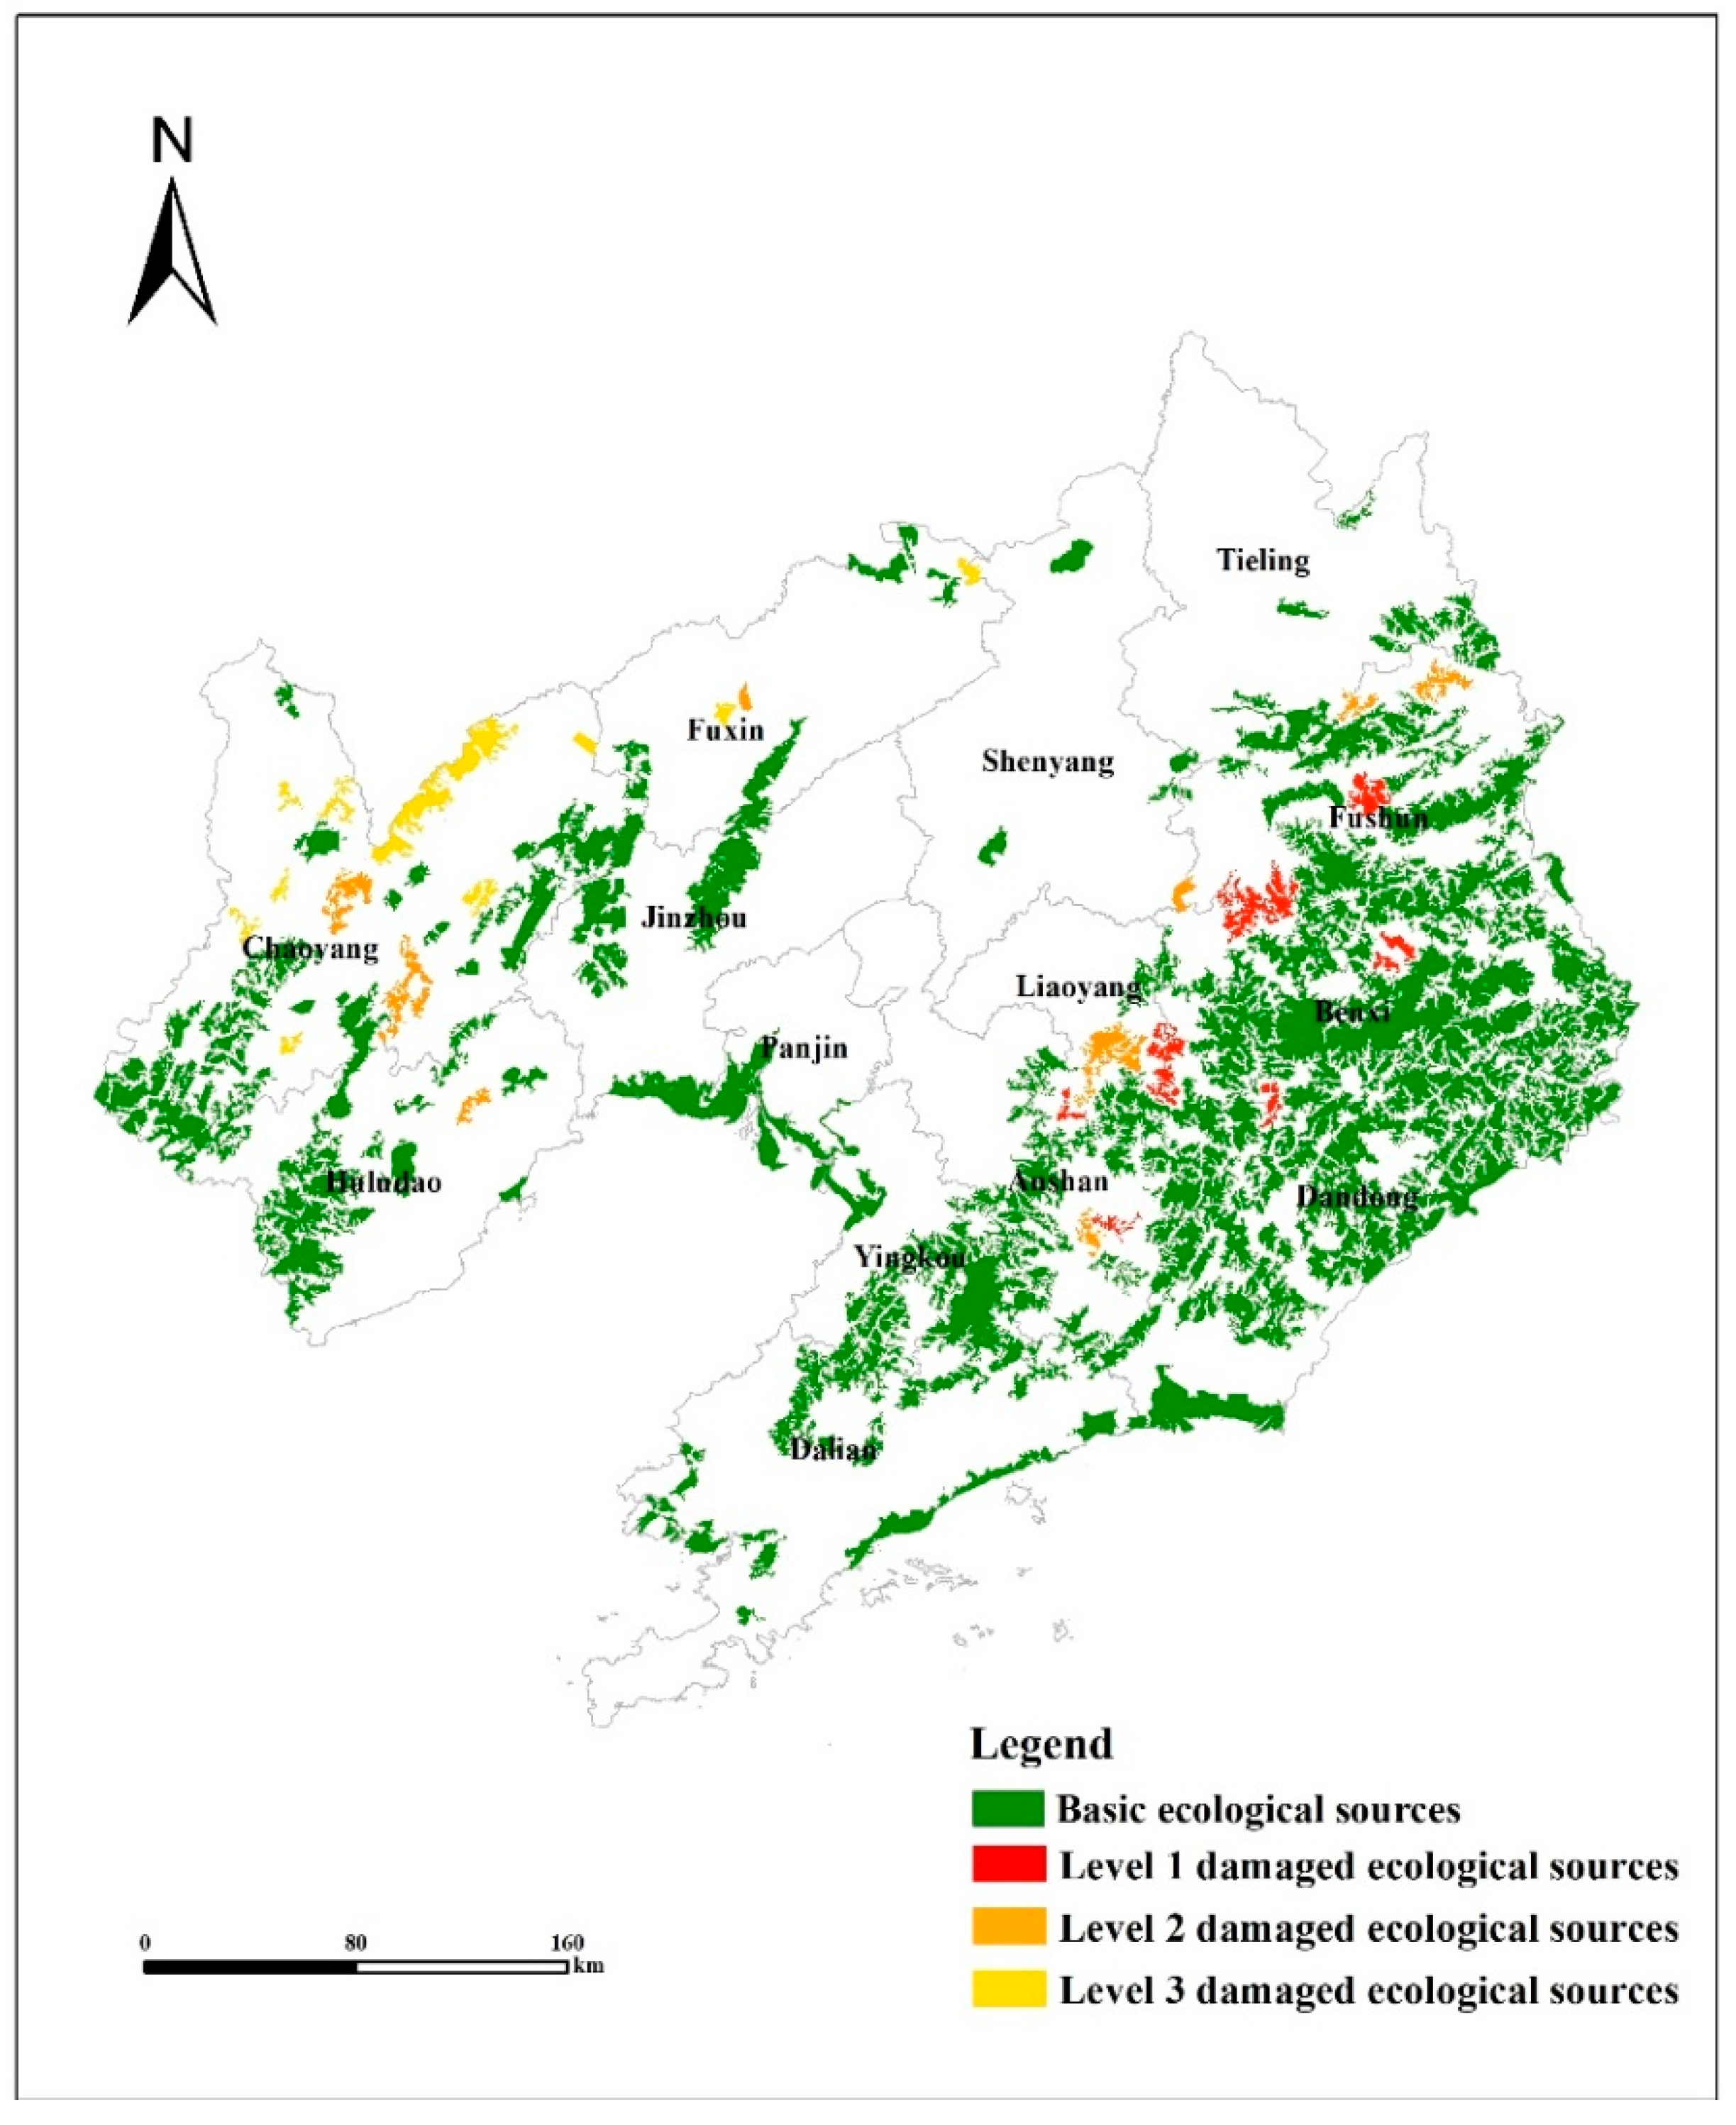
2.3. Extraction and Classification of Ecological Sources

Because the MSPA model effectively identifies different landscape-type patches that have an ecologically significant structure, it is applied to extract ecological sources [40,41]. The land use type data was reclassified into foreground and background, where each foreground pixel is allocated to one of the landscape classes defined in the MSPA model, which are the core, islet, perforation, edge, bridge, loop, and branch [17]. The foreground includes forestland, grassland, shrubland, wetland, and water bodies, and the background includes cultivated land, artificial surfaces, and bare land. The core areas were extracted as a candidate landscape patch. According to the relationship between the number and area of extracted patches [20], we found that the number of patches was suitable when the minimum area threshold for patches was 30 km2; thus, patches with an area greater than 30 km2 were selected as potential ecological sources.
Potential ecological sources were classified as basic sources and damaged sources. According to the mineral type information of the mining vector data, the mines within the study area were classified into three types: metal mines, coal mines, and coal-excluding non-metallic mines. Vegetation is an important indicator in measuring ecological and environmental effects caused by human activities [42,43]. Using ArcGIS 10.4, a multiple-ring buffer zone with an interval of 100 m was created for each core patch, and the changes in the year average vegetation coverage in the buffer zone were calculated to determine the scope of influence of mines with different mineral types [6,44]. The scope of influence of coal-excluding non-metallic mines, coal mines, and metal mines were 500 m, 800 m, and 1200 m, respectively (Figure S2). To calculate the area proportion of the mine and its buffer zone within the ecological sources, source areas with an area ratio of ≥10% were chosen as the mine ecological source areas [45].
Patches with high ecosystem service value have better habitat quality [46,47]. Further, the change in this ecosystem service value is equally important. In some areas where the ecological environment is gradually improving, changes in ecosystem services are positive [48]. The four typical ecosystem services were integrated to obtain a measure of the comprehensive ecosystem service [49]. The results that include the comprehensive importance in 2000, 2010, and 2020 were calculated. Taking the average value of the comprehensive ecosystem service importance and change in the scope of the study area as a reference, values greater than the mean value were considered to be of high importance or potential, while values less than the mean but greater than 0 were considered to be of moderate importance or potential. Values less than 0 were considered to be of low importance or potential [20,39]. One of the purposes of this study is to test the impact of adding damaged ecological sources on ecological network construction so the number of sources added each time remains as consistent as possible. The importance of the ecosystem service and the change of ecosystem services of damaged ecological sources were summed with equal weights, and the damaged sources were divided into three levels according to their values.

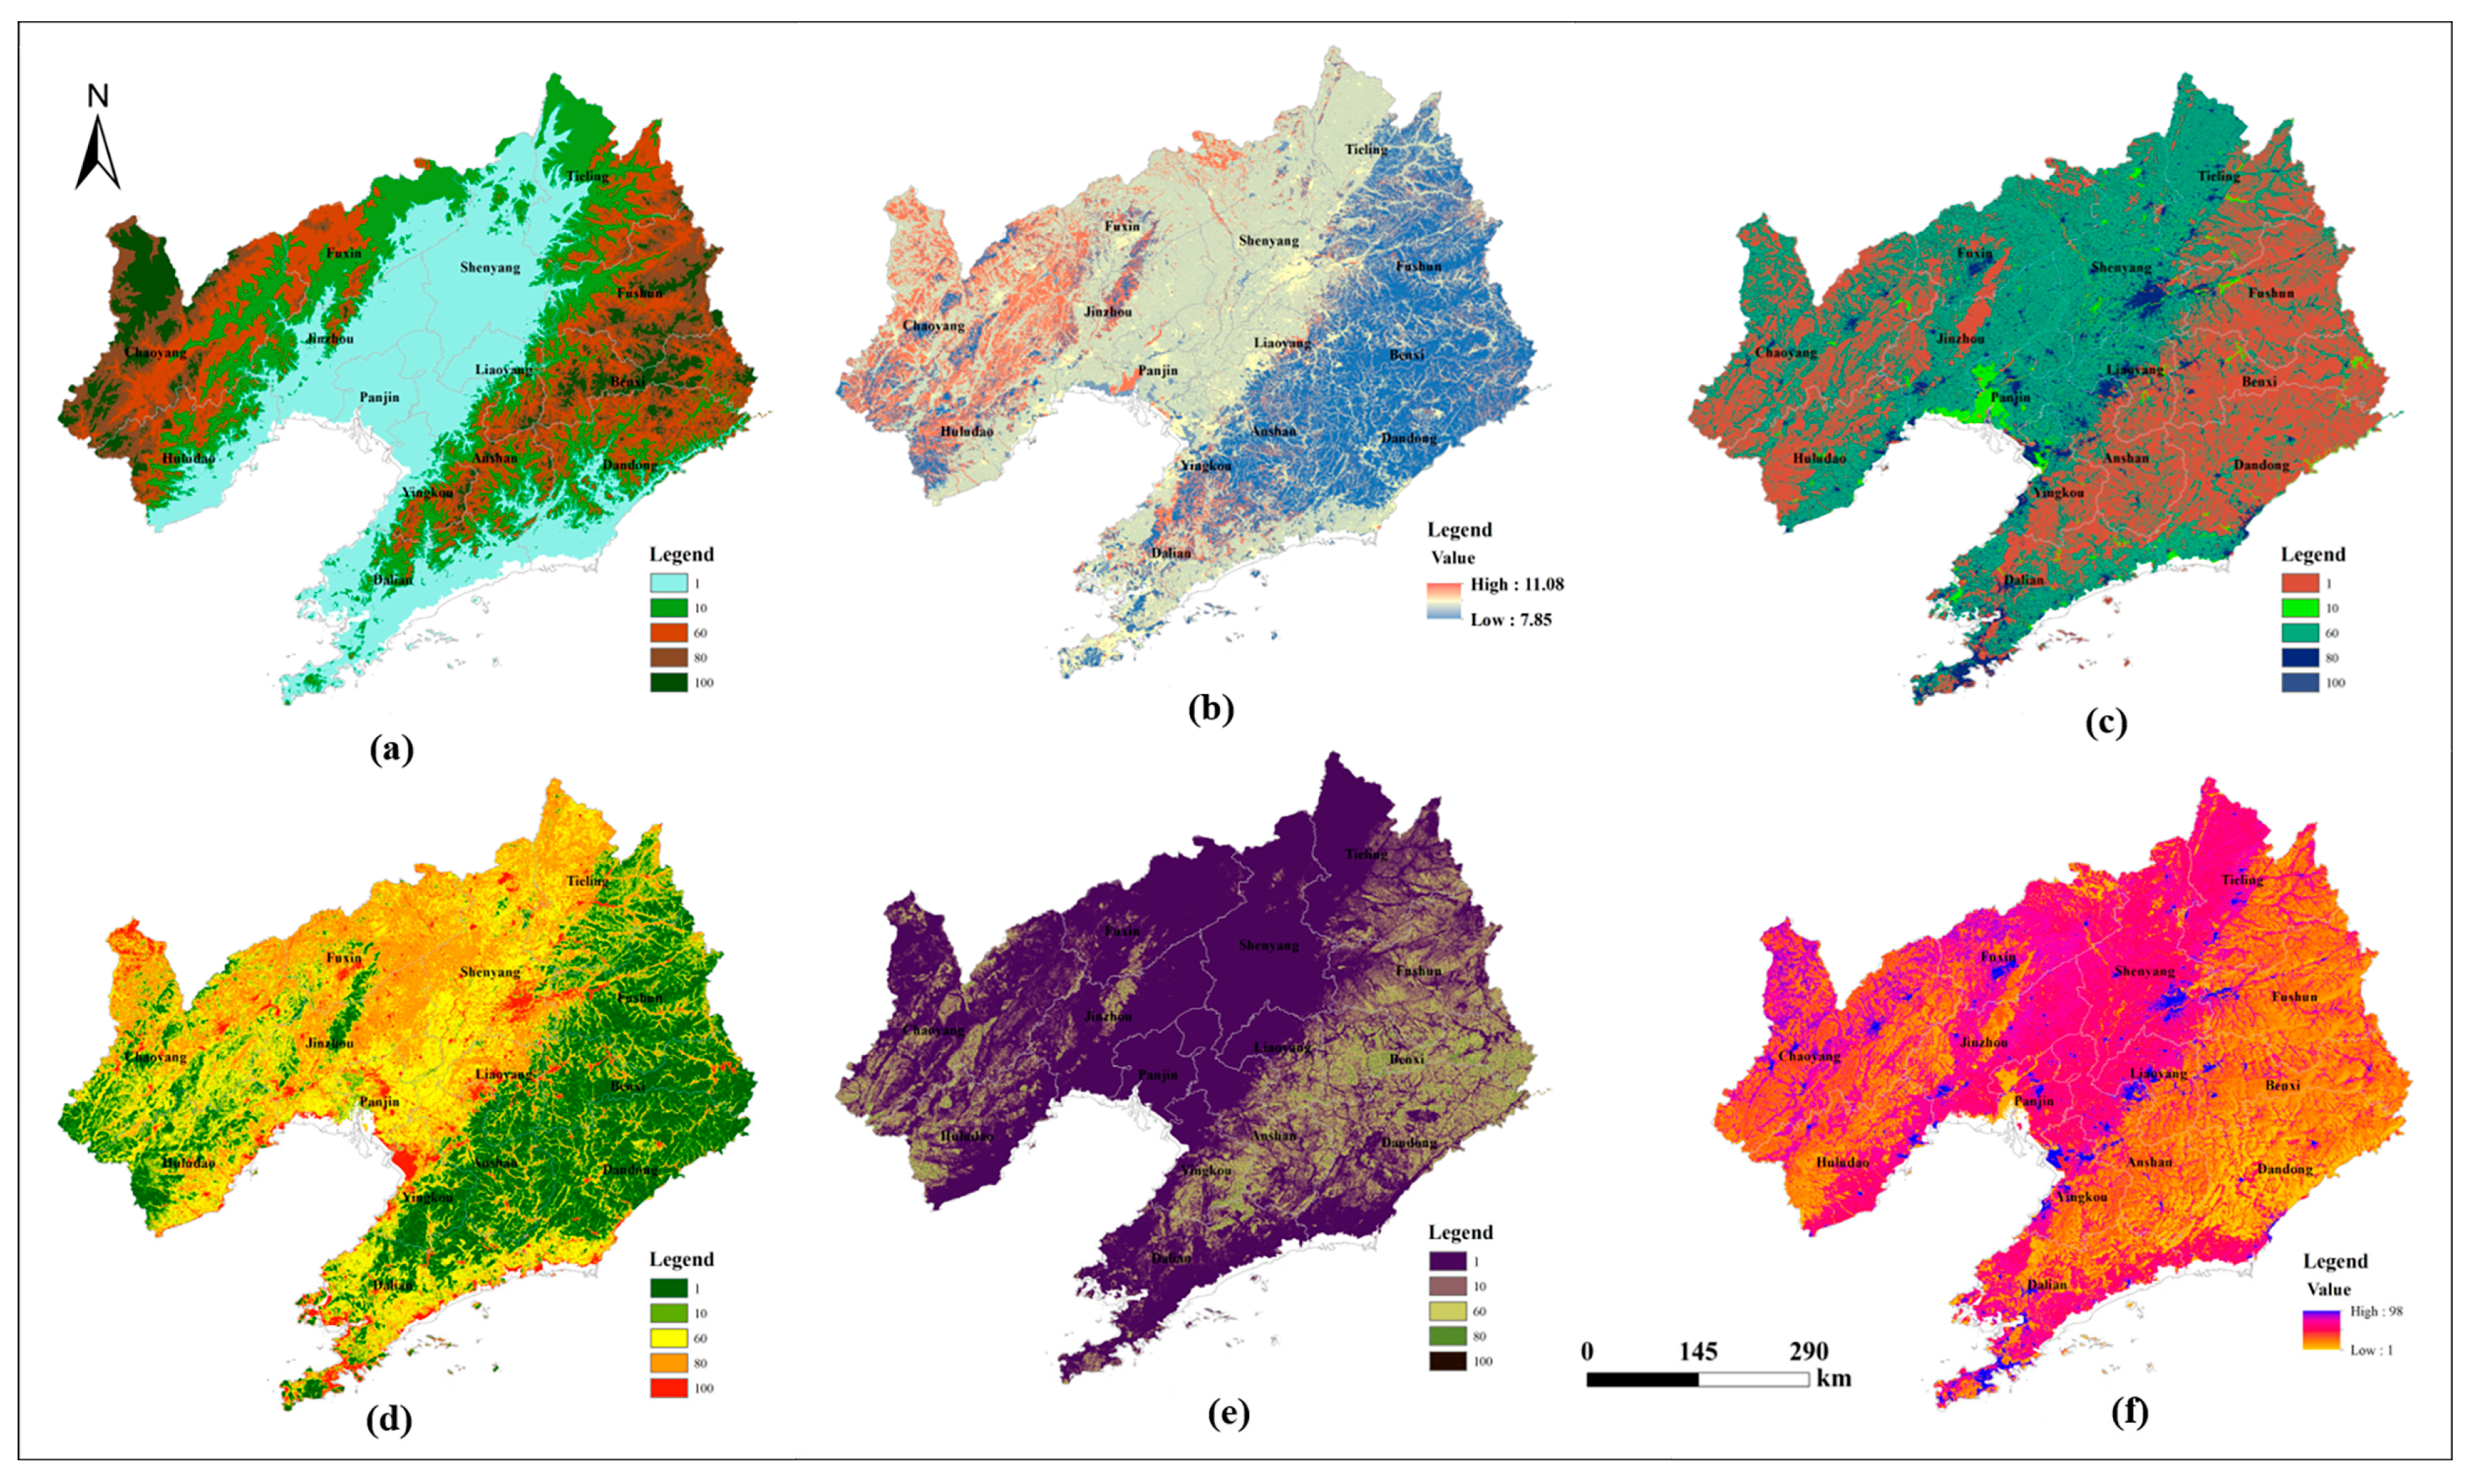
2.4. Construction and Modification of Resistance Surfaces

A necessary step in extracting ecological corridors and building ecological networks is to set up resistance surfaces. Assigning various resistance values based on the land cover type, terrain, and vegetation conditions is a common strategy [50]. This is because the spatial differences in indicators that characterize human development and construction intensities [51,52] (i.e., population density and GDP in Liaoning Province, Figure S3) are not obvious. Thus, the landscape ecological risk evaluation was employed to quantify the differences in intensity of human activities between land cover in this study. Landscape ecological risk results and the responses of land cover types to ecological risks were considered to propose a landscape ecological risk coefficient based on the responses of land cover. A basic resistance index system was constructed from four parts: the land cover type, slope, altitude, and vegetation coverage (Table 1), and the resistance values of land cover types were modified using the landscape ecological risk coefficient to obtain the modified ecological resistance surface. Since there are fewer indicators, the four indicators were given the same weight. The formulas of the landscape loss degree, ecological risk index, and modified land cover resistance value and resistance surface are shown in (1)–(4).
ERI k   = i   = 1 n A ki A k   ×   R i
R i = E i   ×   F i
R * = f ERV LULC ,   ERV slope ,   ERV DEM ,   ERV VC
ERV LULC = ERV LULC × ERI LULC
where ERIk is the result of the ecological risk of the kth risk unit; Aki is the total area of the ith landscape type in the kth risk unit; Ak is the total area of the kth risk unit; and Ri is the result of the landscape loss index. Ei is the landscape disturbance index of the ith type landscape; Fi is the vulnerability index of the ith type landscape; R* is the modified resistance surface; ERV′LULC is the modified resistance raster of land cover; ERVLULC is the original resistance raster of land cover; ERVslope is the resistance raster of slope; ERVDEM is the resistance raster of DEM; ERVVC is the resistance raster of vegetation cover; and ERILULC is the ecological risk value of different types of land cover.
The landscape disturbance index indicates the level of external stress on different landscapes [53]. The landscape vulnerability index indicates the capability of landscapes to resist external interference. The fragility degree of the landscape was divided into six levels, with artificial surfaces being estimated to be the most stable and bare land the weakest [54]. Referring to previous research, the values of the fragility degree for each landscape type were as follows: artificial surface 1, forest 2, grassland and shrubland 3, cultivated land 4, waterbodies and wetland 5, and bare land 6 [55]. After normalization, the results for the vulnerability index for each landscape were obtained. The ordinary Kriging interpolation model was employed to map the spatial expression results of ERI.

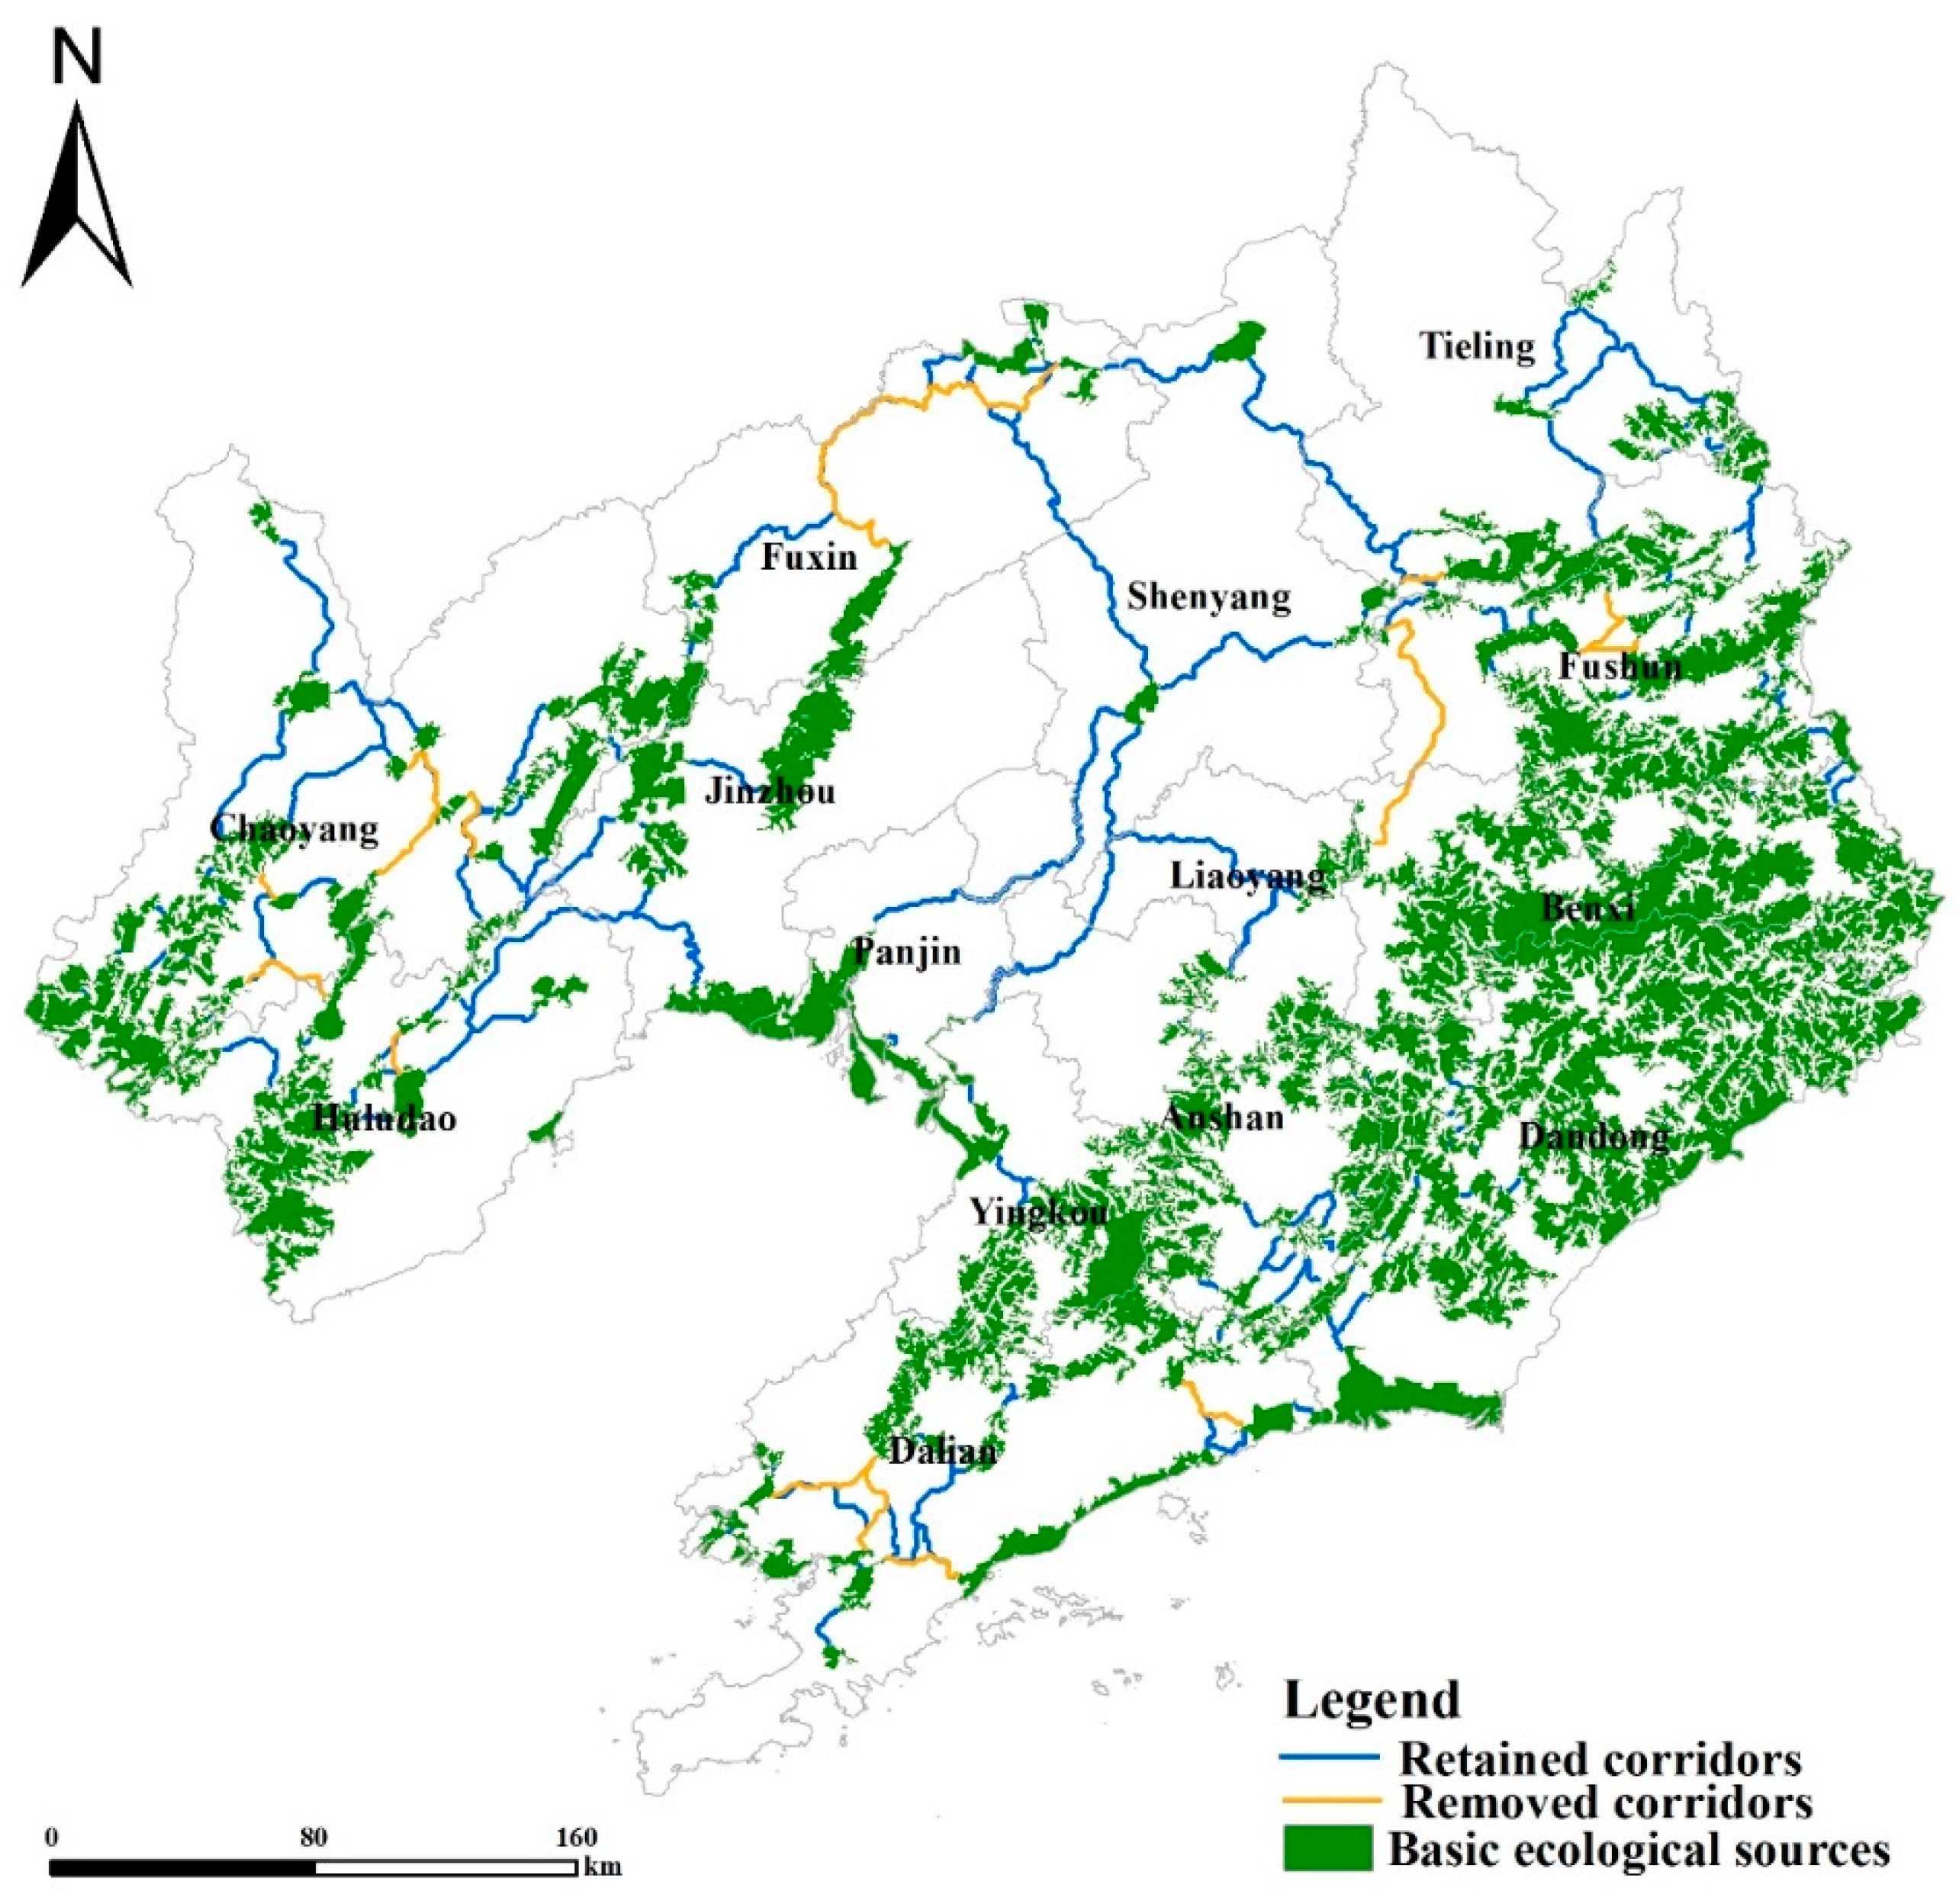
2.5. Construction and Optimization of the Ecological Network

2.5.1. Construction of Ecological Networks Based on the MCR Model

The least-cost path (LCP) was used to identify potential ecological corridors by using the ecological sources and modified resistance surface [56,57]. The spatial simulation model is as follows:
MCR = f min j = n i = m D ij × R i
where Dij represents the spatial distance from ecological source j to ecological source i; Ri represents the ecological resistance of the movement process of source i; and fmin represents the least minimum value of cumulative resistance of the source.

2.5.2. Stepwise Construction and Integration of Ecological Network

The regional ecological network was constructed by using basic sources and damaged sources, and the effect of different levels of damaged sources participating in the ecological network was quantified. Therefore, a stepwise ecological network construction framework is proposed (Figure 3). In the process of network construction, newly identified corridors conflicted with existing corridors in space. Moreover, redundant corridors were produced during the construction process of the ecological network. Thus, it is necessary that these corridors are removed to reduce the complexity of the network. The gravity model has been often employed to eliminate redundant corridors. However, due to the significant distinction between corridors and the lack of consideration of the spatial distribution of corridors, the removed corridors may have an irreversible influence on the stability of the ecological network. The distance was too close between some “directly connected corridors” and “indirectly connected corridors”, which redundancy in space, and an ecological network with multiple connections has a better stability. The description and differences between the two types of corridors can be seen in Figures S4 and S5.
Therefore, some rules were formulated for removing corridors based on previous studies [45]: (1) Repeated corridors should be removed. (2) “Directly connected corridors” should be removed, with preference for ‘indirectly connected corridors’ and multiple connection corridors being retained. (3) The preserved corridors can form closed routes. (4) The corridors with low gravity values are removed in priority. Ecological network integration is conducted as follows: first, basic sources and modified resistance surfaces were selected for the construction of the basic network. Redundant corridors with low gravity values were removed based on the rules. Secondly, different-level supplementary networks were added to the basic network, and repeated corridors were replaced by using rules. Simultaneously, redundant corridors with low gravity values were removed based on the rules. The formula of the gravity model is shown in Formula (6), as follows:
G ab = N a × N b D ab 2 = L max 2 ln S a × S b L ab 2 × P a × P b
where Gab indicates the gravity effect between source a and source b; Na and Nb indicate weight values of source a and source b, respectively; Dab denotes a standardized cumulative resistance value of the potential corridor connected to source a and source b; Lab denotes the cumulative resistance value of a potential corridor connected to source a and source b; Lmax denotes the maximum cumulative resistance value of all potential corridors; Sa and Sb denote the areas of source a and source b, respectively, and Pa and Pb represent the resistance values of source a and source b, respectively.

2.6. Structural Evaluation of the Ecological Network

Using the complex network indicators of graph theory, the performance in complexity and connectivity of an ecological network can be assessed [48,58,59]. The α, β, and γ indexes were employed to characterize the network closure and connectedness. Among them, the α index represents the recyclable level of the complex network. The β index quantifies the average number of connections to each node. The γ index describes the connection degree of all nodes in the complex network. The larger the values of the three indices, the more efficient the ecological circulation of the network.
α = l v + 1 2 × v 5
β = l v
γ = l 3 × ( v 2 )
where l is the number of corridors; v is the number of nodes.

3. Results

3.1. Ecological Sources

The result identified by the MSPA model is shown in Figure S6. Based on the rules of sources identified and screened, core patches with an area greater than 30 km2 were extracted as potential ecological sources, and 129 ecological sources were finally obtained, with an area of 32,086.81 km2, accounting for 21.67% of the total region. 101 basic sources were included, with an area of 29,452.71 km2, alongside 28 damaged sources, with an area of 2634.10 km2 (Figure 4). The details for the proportion of mines and their buffer zone within ecological sources, along with the importance and changes of comprehensive ecosystem services of the damaged ecological sources are shown in Tables S1 and S2. Ecological sources were concentrated in the eastern regions, while the spatial distribution of ecological sources in the western region was relatively discrete. Because the central areas contain significant cultivated land and artificial surfaces with fewer ecological sources, they are not conducive to the ecological interflow between the east and west.
By overlapping the basic and damaged ecological sources and the land cover data (Table 2), it was found that basic sources were primarily composed of forests, grassland, waterbodies, wetlands, and shrubland, accounting for 76.48%, 19.14%, 3.37%, 0.68%, and 0.33% of the entire area of basic sources, respectively. Damaged sources mainly comprised forests, grassland, cultivated land, waterbodies, wetlands, and shrubland, accounting for 67.45%, 29.61%, 1.45%, 1.36%, and 0.13% of the entire area of damaged sources, respectively. The average vegetation coverage of basic sources and damaged sources was 0.75 and 0.67, respectively. The average vegetation coverage of land cover in Liaoning Province was 0.57 based on the collected vegetation data. Thus, the average vegetation coverages of both basic ecological sources and damaged ecological sources were greater than the average value in the region, which indicates that the habitat quality of the two types of sources was good. Furthermore, damaged ecological sources were deployed in the western regions, which strengthens the connection between ecological sources in a small scope. Therefore, damaged ecological sources should also be protected and restored.

3.2. Construction of Modified Resistance Surface

The ecological risk coefficient based on land cover was employed to modify the resistance surface land cover (Figure 5). The values of resistance were lower in the western and eastern regions and higher in the south and north regions, with a maximum value of 98. The correction coefficient has a better effect on distinguishing the differences in resistance values of the same type of land cover. The terrain in the western and eastern regions is steep, but the grasslands and shrublands in the western area were more likely to be disturbed by regional potential ecological risks [39]. Therefore, the resistance value in these regions was higher than that in the eastern region, with forests.

3.3. Spatial Distribution of the Ecological Network

3.3.1. Basic Ecological Network

The basic ecological network was constructed by using basic ecological sources and modified resistance surfaces. The repeated corridors with low gravity values were preferentially removed, and 162 corridors were retained (Figure 6). Repeated corridors highly overlapped with nearby corridors in space, resulting in the duplication of paths. In terms of the resistance values of single corridors, the directly connected corridors are greater than multiple connection corridors, which are detrimental to the transmission of ecological flows. The justifications for removal are listed in Table S3 and Figure S8.
Overall, abundant ecological sources and corridors were distributed in the eastern cities, such as Fushun city, Benxi city, Anshan city, Dandong city, and Yingkou city, in addition to Dalian city, which is coastal. The sources and corridors in these cities were closely connected, resulting in the formation of a stable spatial pattern. In comparison to eastern cities, the distance of ecological corridors in the northern area, such as Tieling city, and western areas—such as Chaoyang city, Fuxin city, Jinzhou city, and Huludao city—was large; ecological sources in these cities were fragmented in distribution, and ecological network blank areas also existed, which are not conducive to stable operation for ecological processes. The ecological elements in central areas, such as Shenyang city, and coastal areas, such as Panjin city, connected the eastern ecological network and western ecological network, but they were also very fragile.

3.3.2. Supplementary Ecological Network in Each Step

The removed corridors and their reasons for removal are given in Tables S4–S6, Figure S7, and S9–S11. 67 ecological corridors were supplemented. In the first iteration, 9 ecological sources and 17 ecological corridors were added in the eastern areas, such as Fushun city, Benxi city, Liaoyang city, Dandong city, and Anshan city (Figure 7a). The details of the local ecological networks were further enriched. In the second iteration, 9 ecological sources and 25 ecological corridors were supplemented (Figure 7b). In particular, 4 sources were filled in the ecological network of Chaoyang City, Huludao City, and Fuxin City. These patches were used as stepping stones in the local ecological network. In the third iteration, 10 ecological sources and 25 ecological corridors were supplied (Figure 7c). Among them, 8 sources were added to the ecological network in Chaoyang city, greatly enriching the local ecological network, and 2 sources were supplemented in the ecological network in Fuxin city to cut off overly long corridors.
Overall, the additional ecological elements filled the hollow areas of the local ecological network, and some ecological sources were used as stepping stones to reduce the cost-weighted distance for enhancing the efficiency of transmission of ecological flow between the ecological sources. The preserved ecological corridors formed the ecological network, which can connect all ecological sources in local areas, making the sum of cumulative resistance smaller; this enriched the transmission paths for the exchange of energy between ecological sources and enhanced the robustness of the ecological network.

3.3.3. Integration of Ecological Network

According to the final results (Figure 8), the ecological network has 101 basic ecological sources and 28 damaged ecological sources, with a total area of 32,086.81 km2. This reflects an increase of 8.9% in comparison to the area of the basic ecological network. Ecological corridors were classified into three types based on the source types connected by the corridors: (1) basic source to basic source, (2) basic source to damaged source, and (3) damaged source to damaged source. Therefore, there were 162 type I ecological corridors, 55 type II ecological corridors, and 12 type III ecological corridors, with a total length of 3921.80 km, which is a decrease of 4.4% in comparison to the length of the basic ecological network. Supplementing the ecological network alleviated the issue of the insufficient coverage of ecological corridors in Chaoyang City and Fuxin City, and the details of the local ecological networks in Fushun City, Benxi City, Liaoyang City, Dandong City, and Anshan City were enriched.

3.3.4. Structural Performance Characteristics of Ecological Network

The two types of ecological sources were integrated into the ecological network by using a stepwise ecological network construction framework. According to the changes in the three indicators (Table S7), every step’s α index values were 0.3451, 0.3674, 0.3819, and 0.3992, respectively. This reflects the fact that more closed routes were formed in the ecological network, and more ecological connections were added between the basic sources and damaged sources. The β values were 1.6633, 1.7090, 1.7394, and 1.7751, and the β values of the four networks were all higher than 1.00, reaching the standard of a complex network. The γ values were 0.5656, 0.5802, 0.5897, and 0.6010, which represented that the connection between sources was strengthened and the ecological efficiency was improved.
Because supplementary ecological elements were distributed in the eastern and western areas, the local ecological networks were extracted to calculate the structural indexes (Table S8). We found that the added sources and corridors in each step enhanced the connectivity of the ecological network in eastern regions. The three indicators of the ecological network in the east and west were found to be the highest after the third supplement. However, the supplementary elements were added to the local ecological network in the second iteration, and the values of the three indicators of the ecological network in the western areas decreased. This is primarily because the supplemented ecological sources were used as stepping stones for cutting off the longer ecological corridors.

4. Discussion

4.1. Regulation Strategies

According to the integrated ecological network and its elements, this study proposed three regulation strategies: pattern optimization, protective development, and restrictive development for ecological sources with three connection types (Figure 9).
A strategy of restrictive development is adopted for whole basic ecological sources, which included 101 ecological sources. The basic source is the foundation of the regional ecological network. Therefore, natural ecological elements within the basic ecological source should be protected, and production and construction activities should be prohibited in these areas.
A strategy of pattern optimization is implemented for damaged ecological sources connected to the basic ecological source at both ends, which includes 12 ecological sources. After these ecological sources are added to the ecological network, they help to supplement the hollow areas in the ecological network. Therefore, several small natural ecological landscapes, such as forests, grasslands, wetlands, and water bodies, can be supplemented around the ecological source to improve the environmental quality. In addition, ecological restoration projects can be implemented to adjust the landscape structure for achieving “landscape type conversion”.
The strategy of protective development is implemented for the remaining damaged sources, which include 16 ecological sources. The few high-quality ecological landscapes in the region must be protected. Hence, it is necessary to set up vegetation filter belts and forest belts around areas with frequent human activities to reduce the disturbance caused by economic construction activities and protect ecological sources and their surrounding natural landscapes.

4.2. Importance of Supplementary Ecological Network

According to the description of the national territory spatial planning of Liaoning Province, soil erosion and soil wind erosion are the main ecological hazards in the western areas [39], especially Chaoyang City and Fuxin City, which are located in the critical construction regions of the North Sand Control Belt. However, there are currently few suitable ecological sources due to the destruction of the environment caused by mining activities, but some damaged ecological sources with better ecological value that improve the quality of regional ecological security patterns are found to be sparsely distributed. Hence, the protection and restoration of damaged ecological sources will help enhance the ecological quality of sources and strengthen the connections of ecological flow in local areas to improve the condition of soil conservation and sand fixation services.
Protecting the forests in eastern Liaoning Province can maintain important ecological services of water conservation. In Fushun City and Anshan City, the land use structure is unreasonable, and the proportion of urban green space is low. However, the proportion of industrial and residential land is high [38]. Supplementary ecological sources and corridors can enrich the local ecological network and improve ecological functions in urban areas. In general, supplementary ecological networks are an extension of basic ecological networks that can enhance the details of regional ecological networks and fill in hollow areas. Further, much-related research has been conducted on their effects on improving the resilience of regional ecosystems.

4.3. Optimization of the Ecological Network

One important role of ecological network construction is to guide the protection and restoration projects of destroyed ecosystems. Thus, it is crucial that the importance and priority of ecological network elements are identified.

4.3.1. Optimization of Ecological Sources Based on Topological Indicators

Some ecological sources might be deemed significant based on conventional methods, such as ecological importance, ecological sensitivity, and area [40,60,61]. By calculating the importance and changes in ecosystem services, we found that the mean value of ecological importance of basic sources and damaged sources was 8.19 and 7.82, respectively, which means that the basic ecological sources were more important than damaged ecological sources based on the practical conditions. However, from the perspective of changes in the ecosystem services, the mean value of changes in ecological importance of the basic sources and damaged sources were 0.014 and 0.019, respectively, which indicates that damaged ecological sources have better ecological potential.
The performances of the ecological network topology metrics of some ecological sources with better ecological quality were found to be average [9,62,63] (Figure S12). For example, for the weighted degree, closeness eccentricity, harmonic closeness centrality, betweenness centrality, and pagerank, the levels of nodes 45, 46, 84, 86, 90, 91, and 92 were low or medium. In contrast, although some damaged ecological sources have low levels of ecological importance (i.e., the ecological service importance scores are lower than the average), they have good performance in terms of topology metrics, which play a significant role in maintaining the ecological network quality. For instance, the aforementioned topological indicators of ecological sources 22, 29, 37, and 68 were better than those of the surrounding sources, such as 28, 32, 66, 71, and 109.
Ecological sources not only have better ecological quality but also have excellent performance in terms of topological characteristics, as showcased by a few potentials for improvement, such as in nodes 7 and 48. On the other hand, for some ecological sources, the ecological quality and performance of topological indicators were not ideal. However, the correlation between ecological services and topological characteristics is positive. Therefore, in the future, the optimizing regulation strategies of ecological networks are suggested for these weak nodes (13, 14, and 60) based on the topological properties, which can help improve the ecological functions.

4.3.2. Optimization of Ecological Corridors

Constructing ecological corridors is an effective method of connecting ecological sources. The intensity of interaction between the source patches is the main reference for the classification of ecological corridors. The higher the value, the more significant the corridor is. However, the cumulative resistance values of corridors have a significant impact on the gravity results. Some corridors with high cumulative resistance values always have low gravity results. Furthermore, this method does not consider the matrix conditions of the corridor. Continuity and homogeneity are widely known to be the essential attributes of ecological corridors [64]. For instance, corridors 108, 267, 365, and 366 were the longer corridors in the ecological network, with the highest cumulative resistance values of all corridors. However, according to the results of the corridor truncation (Table S9), the rates of corridor truncation were 2.07%, 0.07%, 0.25%, and 0.06%, respectively. The results were significantly lower than the 10% standard proposed by Liang et al. [45]. This is because there was a large quantity of ecological land in the corridors, which can ensure better connectivity. Although these corridors were long, few projects of ecological restoration were required in these corridors. The larger the area of ecological sources, the more significant the ecological corridors between ecological sources [56]. The method of intensity of the interaction ignores the types and topological characteristics of sources. Thus, the new approach can be proposed based on the gravity results between sources, characteristics of sources (i.e., connecting types of sources and topological indicators), and construction cost (i.e., truncation condition of corridors), which provides an important foundation for the construction of ecological security networks.

4.4. Limitations and Future Work

Restoring and recovering the ecosystem destroyed by mining activities and reorganizing the structural balance of regional ecosystems is crucial for achieving ecological security in resource-based regions. The methodological framework of ecological network construction was proposed in the study by using basic ecological sources and damaged ecological sources, which exhibit significant potential for ecological restoration of abandoned mines in the identification and protection of regional ecological connections. However, some technical questions related to the ecological network require further consideration. First, due to differences in the mineral types and mining methods, mines have different damage influences on the ecological environment. Thus, it is critical to clarify the scope of influence of different types of mines. The vegetation coverage was employed to identify the scope of impact of different types of mines due to data acquisition restrictions and the high sensitivity of vegetation conditions to human activities; the types of mines were only divided into three categories. Further studies are required to refine the types of mines and explore the application of other indicators in estimating the influence scope of mines. Second, although the ecological network elements were classified and graded, the contents of optimization of ecological network elements such as sources and corridors are lacking in this study. Thus, further explorations are needed for future research to analyze the correlations between ecosystem services and complex network topological indicators based on combining ecological network theory and complex network theory, which can optimize the weak nodes and corridors. Third, the width of ecological corridors is not determined in this study. The width has a direct impact on the ecosystem services of ecological corridors. Width values are generally given based on references, and models and algorithms that can be utilized to identify spatial scopes of ecological corridors are lacking. Fourth, due to the few indicators used, all influence factors have the same weight in constructing the resistance surface. In the future, more indicators should be considered to participate in the construction of the resistance surface and quantitative methods should be used to determine the weights. Fifth, we only constructed the one-period ecological network. We should explore the ecological networks under different scenarios by simulating land use in further research.

5. Conclusions

A framework for the stepwise renewal of ecological networks was proposed in this study, which integrated basic ecological sources and ecological sources including mining areas. First, based on the remote-sensing data for ecological environment monitoring, ecological sources were identified and classified by the MSPA method, the scope of influence of abandoned mines, and the importance and change rate of ecosystem services. Secondly, resistance values of land cover were modified using an ecological risk factor. The resistance surface was built by using land cover, terrain, and vegetation condition data. Potential ecological corridors were constructed using the MCR model. The ecological corridors generated at each step were retained or removed by using the gravity model and addition and removal rules of corridors. The indicators of a complex network were used to evaluate the results of the construction of ecological networks. Finally, specific ecological restoration strategies were proposed for the ecological sources in the integrated ecological network. The developed method can consider the best utilization of existing and potential ecological sources. Additionally, the effects of areas with mining areas participating in ecological network construction were demonstrated. Some conclusions could be drawn from the results: (1) The ecological network comprises basic and supplementary parts. The final ecological network has 129 ecological sources, with an overall area of 32,086.81 km2, which included 101 basic ecological sources, covering an area of 29,452.71 km2, and 28 damaged ecological sources, with an area of 2634.10 km2. There were 229 ecological corridors, with an overall length of 3921.80 km, of which there were 162 type I corridors, 55 type II corridors, and 12 type III corridors. (2) Basic ecological sources and corridors formed the backbone structure of the regional ecological network. Specifically, elements of the ecological network in eastern and coastal areas were closely connected, where the habitat quality was better. In the western and northern regions, ecological sources were fragmented and fewer in number. The lack of transitional ecological sources resulted in longer distances of ecological corridors. (3) The newly added ecological sources and corridors filled the hollow areas of the local basic ecological network and enriched the selection of transmission paths of ecological flows; the α, β, and γ indexes increased by 15.7%, 6.8%, and 6.4%, respectively. (4) Three ecological regulation strategies were proposed for ecological sources with different connection modes. In the context of the goal of “ecological civilization construction” in China, the construction of ecological networks and ecological restoration strategies in Liaoning Province can provide some reference for other resource-based regions with conflicts between environmental protection and rapid industrialization.

Supplementary Materials

The following supporting information can be downloaded at: https://www.mdpi.com/article/10.3390/rs16173228/s1.

Author Contributions

Methodology, S.W. and Y.Z.; Software, S.W.; Data curation, S.W.; Writing—original draft, S.W.; Conceptualization, Y.Z.; Writing—review & editing, H.R.; Investigation, S.Z.; Supervision, S.Z. All authors have read and agreed to the published version of the manuscript.

Funding

This study received financial support from the National Natural Science Foundation of China [Grant No. 420701250].

Data Availability Statement

Publicly available datasets were analyzed in this study. The data sources and access links are indicated in the text.

Acknowledgments

We are immensely grateful to the editor and anonymous reviewers for their comments on the manuscript.

Conflicts of Interest

The authors declare no conflicts of interest.

References

  1. Li, D.; Xu, E.; Zhang, H. Bidirectional Coupling between Land-Use Change and Desertification in Arid Areas: A Study Contrasting Intracoupling and Telecoupling. Land Degrad. Dev. 2022, 33, 221–234. [Google Scholar] [CrossRef]
  2. Li, S.; Xiao, W.; Zhao, Y.; Lv, X. Incorporating Ecological Risk Index in the Multi-Process MCRE Model to Optimize the Ecological Security Pattern in a Semi-Arid Area with Intensive Coal Mining: A Case Study in Northern China. J. Clean. Prod. 2020, 247, 119143. [Google Scholar] [CrossRef]
  3. Yan, R.; Zhang, X.; Yan, S.; Chen, H. Estimating Soil Erosion Response to Land Use/Cover Change in a Catchment of the Loess Plateau, China. Int. Soil Water Conserv. Res. 2018, 6, 13–22. [Google Scholar] [CrossRef]
  4. Long, Z.; Zhu, H.; Bing, H.; Tian, X.; Wang, X.; Ma, Z.; Yu, D.; Wu, Y. Predicting Soil Cadmium Uptake by Plants in a Tailings Reservoir during 48-Year Vegetation Restoration. Sci. Total Environ. 2022, 818, 151802. [Google Scholar] [CrossRef] [PubMed]
  5. Wang, Z.; Luo, K.; Zhao, Y.; Lechner, A.M.; Wu, J.; Zhu, Q.; Sha, W.; Wang, Y. Modelling Regional Ecological Security Pattern and Restoration Priorities after Long-Term Intensive Open-Pit Coal Mining. Sci. Total Environ. 2022, 835, 155491. [Google Scholar] [CrossRef]
  6. Wu, Z.; Lei, S.; Lu, Q.; Bian, Z. Impacts of Large-Scale Open-Pit Coal Base on the Landscape Ecological Health of Semi-Arid Grasslands. Remote Sens. 2019, 11, 1820. [Google Scholar] [CrossRef]
  7. Peng, J.; Zong, M.; Hu, Y.; Liu, Y.; Wu, J. Assessing Landscape Ecological Risk in a Mining City: A Case Study in Liaoyuan City, China. Sustainability 2015, 7, 8312–8334. [Google Scholar] [CrossRef]
  8. Wu, J.; Zhu, Q.; Qiao, N.; Wang, Z.; Sha, W.; Luo, K.; Wang, H.; Feng, Z. Ecological Risk Assessment of Coal Mine Area Based on “Source-Sink” Landscape Theory–A Case Study of Pingshuo Mining Area. J. Clean. Prod. 2021, 295, 126371. [Google Scholar] [CrossRef]
  9. Xu, W.; Wang, J.; Zhang, M.; Li, S. Construction of Landscape Ecological Network Based on Landscape Ecological Risk Assessment in a Large-Scale Opencast Coal Mine Area. J. Clean. Prod. 2021, 286, 125523. [Google Scholar] [CrossRef]
  10. Elliott, C.P.; Commander, L.E.; Merino-Martin, L.; Golos, P.J.; Stevens, J.; Miller, B.P. An Approach to Defining and Achieving Restoration Targets for a Threatened Plant Community. Ecol. Appl. 2022, 32, e2613. [Google Scholar] [CrossRef]
  11. Li, H.; Zhou, B.; Xu, F.; Wei, Z. Hyperspectral Characterization and Chlorophyll Content Inversion of Reclaimed Vegetation in Rare Earth Mines. Environ. Sci. Pollut. Res. 2022, 29, 36839–36853. [Google Scholar] [CrossRef]
  12. Kang, J.; Li, C.; Li, M.; Zhang, T.; Zhang, B. Identifying Priority Areas for Conservation in the Lower Yellow River Basin from an Ecological Network Perspective. Ecosyst. Health Sustain. 2022, 8, 2105751. [Google Scholar] [CrossRef]
  13. Huang, L.; Wang, J.; Fang, Y.; Zhai, T.; Cheng, H. An Integrated Approach towards Spatial Identification of Restored and Conserved Priority Areas of Ecological Network for Implementation Planning in Metropolitan Region. Sustain. Cities Soc. 2021, 69, 102865. [Google Scholar] [CrossRef]
  14. Li, L.; Huang, X.; Wu, D.; Wang, Z.; Yang, H. Optimization of Ecological Security Patterns Considering Both Natural and Social Disturbances in China’s Largest Urban Agglomeration. Ecol. Eng. 2022, 180, 106647. [Google Scholar] [CrossRef]
  15. Tao, Q.; Gao, G.; Xi, H.; Wang, F.; Cheng, X.; Ou, W.; Tao, Y. An Integrated Evaluation Framework for Multiscale Ecological Protection and Restoration Based on Multi-Scenario Trade-Offs of Ecosystem Services: Case Study of Nanjing City, China. Ecol. Indic. 2022, 140, 108962. [Google Scholar] [CrossRef]
  16. Segnon, A.C.; Totin, E.; Zougmore, R.B.; Lokossou, J.C.; Thompson-Hall, M.; Ofori, B.O.; Achigan-Dako, E.G.; Gordon, C. Differential Household Vulnerability to Climatic and Non-Climatic Stressors in Semi-Arid Areas of Mali, West Africa. Clim. Dev. 2021, 13, 697–712. [Google Scholar] [CrossRef]
  17. Wei, S.; Pan, J.; Liu, X. Landscape Ecological Safety Assessment and Landscape Pattern Optimization in Arid Inland River Basin: Take Ganzhou District as an Example. Hum. Ecol. Risk Assess. 2020, 26, 782–806. [Google Scholar] [CrossRef]
  18. Shi, F.; Liu, S.; Sun, Y.; An, Y.; Zhao, S.; Liu, Y.; Li, M. Ecological Network Construction of the Heterogeneous Agro-Pastoral Areas in the Upper Yellow River Basin. Agric. Ecosyst. Environ. 2020, 302, 107069. [Google Scholar] [CrossRef]
  19. Cui, L.; Wang, J.; Sun, L.; Lv, C. Construction and Optimization of Green Space Ecological Networks in Urban Fringe Areas: A Case Study with the Urban Fringe Area of Tongzhou District in Beijing. J. Clean. Prod. 2020, 276, 124266. [Google Scholar] [CrossRef]
  20. Li, S.; Zhao, Y.; Xiao, W.; Yue, W.; Wu, T. Optimizing Ecological Security Pattern in the Coal Resource-Based City: A Case Study in Shuozhou City, China. Ecol. Indic. 2021, 130, 108026. [Google Scholar] [CrossRef]
  21. Qiu, S.; Yu, Q.; Niu, T.; Fang, M.; Guo, H.; Liu, H.; Li, S.; Zhang, J. Restoration and Renewal of Ecological Spatial Network in Mining Cities for the Purpose of Enhancing Carbon Sinks: The Case of Xuzhou, China. Ecol. Indic. 2022, 143, 109313. [Google Scholar] [CrossRef]
  22. An, Y.; Liu, S.; Sun, Y.; Shi, F.; Beazley, R. Construction and Optimization of an Ecological Network Based on Morphological Spatial Pattern Analysis and Circuit Theory. Landsc. Ecol. 2021, 36, 2059–2076. [Google Scholar] [CrossRef]
  23. Li, H.; Zhang, T.; Cao, X.-S.; Zhang, Q.-Q. Establishing and Optimizing the Ecological Security Pattern in Shaanxi Province (China) for Ecological Restoration of Land Space. Forests 2022, 13, 766. [Google Scholar] [CrossRef]
  24. Li, Y.-Y.; Zhang, Y.-Z.; Jiang, Z.-Y.; Guo, C.-X.; Zhao, M.-Y.; Yang, Z.-G.; Guo, M.-Y.; Wu, B.-Y.; Chen, Q.-L. Integrating Morphological Spatial Pattern Analysis and the Minimal Cumulative Resistance Model to Optimize Urban Ecological Networks: A Case Study in Shenzhen City, China. Ecol. Process. 2021, 10, 63. [Google Scholar] [CrossRef]
  25. Liu, W.; Xu, H.; Zhang, X.; Jiang, W. Green Infrastructure Network Identification at a Regional Scale: The Case of Nanjing Metropolitan Area, China. Forests 2022, 13, 735. [Google Scholar] [CrossRef]
  26. Wang, S.; Wu, M.; Hu, M.; Xia, B. Integrating Ecosystem Services and Landscape Connectivity into the Optimization of Ecological Security Pattern: A Case Study of the Pearl River Delta, China. Environ. Sci. Pollut. Res. 2022, 29, 76051–76065. [Google Scholar] [CrossRef] [PubMed]
  27. Yang, K.; Wang, S.; Cao, Y.; Li, S.; Zhou, W.; Liu, S.; Bai, Z. Ecological Restoration of a Loess Open-Cast Mining Area in China: Perspective from an Ecological Security Pattern. Forests 2022, 13, 269. [Google Scholar] [CrossRef]
  28. Ma, Q.; Li, Y.; Xu, L. Identification of Green Infrastructure Networks Based on Ecosystem Services in a Rapidly Urbanizing Area. J. Clean. Prod. 2021, 300, 126945. [Google Scholar] [CrossRef]
  29. Nie, W.; Shi, Y.; Siaw, M.J.; Yang, F.; Wu, R.; Wu, X.; Zheng, X.; Bao, Z. Constructing and Optimizing Ecological Network at County and Town Scale: The Case of Anji County, China. Ecol. Indic. 2021, 132, 108294. [Google Scholar] [CrossRef]
  30. Huang, X.; Wang, H.; Shan, L.; Xiao, F. Constructing and Optimizing Urban Ecological Network in the Context of Rapid Urbanization for Improving Landscape Connectivity. Ecol. Indic. 2021, 132, 108319. [Google Scholar] [CrossRef]
  31. Tan, J.; Li, H.; Lin, W. Integrating Ecosystems and Socioeconomic Systems to Identify Ecological Security Pattern and Restoration Strategy in a Rapidly Urbanizing Landscape. Front. Environ. Sci. 2022, 10, 862310. [Google Scholar] [CrossRef]
  32. Zhang, J.; Zhu, H.; Zhang, P.; Song, Y.; Zhang, Y.; Li, Y.; Rong, T.; Liu, Z.; Yang, D.; Lou, Y. Construction of GI Network Based on MSPA and PLUS Model in the Main Urban Area of Zhengzhou: A Case Study. Front. Environ. Sci. 2022, 10, 878656. [Google Scholar] [CrossRef]
  33. Landis, W. Twenty Years before and Hence; Ecological Risk Assessment at Multiple Scales with Multiple Stressors and Multiple Endpoints. Hum. Ecol. Risk Assess. 2003, 9, 1317–1326. [Google Scholar] [CrossRef]
  34. Huang, L.; Wang, D.; He, C. Ecological Security Assessment and Ecological Pattern Optimization for Lhasa City (Tibet) Based on the Minimum Cumulative Resistance Model. Environ. Sci. Pollut. Res. 2022, 29, 83437–83451. [Google Scholar] [CrossRef]
  35. Li, Q.; Zhou, Y.; Yi, S. An Integrated Approach to Constructing Ecological Security Patterns and Identifying Ecological Restoration and Protection Areas: A Case Study of Jingmen, China. Ecol. Indic. 2022, 137, 108723. [Google Scholar] [CrossRef]
  36. Wang, F.; Yuan, X.; Zhou, L.; Zhang, M. Integrating Ecosystem Services and Landscape Connectivity to Construct and Optimize Ecological Security Patterns: A Case Study in the Central Urban Area Chongqing Municipality, China. Environ. Sci. Pollut. Res. 2022, 29, 43138–43154. [Google Scholar] [CrossRef] [PubMed]
  37. Han, Z.; Cui, S.; Yan, X.; Liu, C.; Li, X.; Zhong, J.; Wang, X. Guiding Sustainable Urban Development via a Multi-Level Ecological Framework Integrating Natural and Social Indicators. Ecol. Indic. 2022, 141, 109142. [Google Scholar] [CrossRef]
  38. Li, H.; Mao, D.; Li, X.; Wang, Z.; Jia, M.; Huang, X.; Xiao, Y.; Xiang, H. Understanding the Contrasting Effects of Policy-Driven Ecosystem Conservation Projects in Northeastern China. Ecol. Indic. 2022, 135, 108578. [Google Scholar] [CrossRef]
  39. Wang, S.; Zhao, Y.; Ren, H.; Zhu, S.; Yang, Y. Identification of Ecological Risk “Source-Sink” Landscape Functions of Resource-Based Region: A Case Study in Liaoning Province, China. Land 2023, 12, 1921. [Google Scholar] [CrossRef]
  40. Wang, S.; Wu, M.; Hu, M.; Fan, C.; Wang, T.; Xia, B. Promoting Landscape Connectivity of Highly Urbanized Area: An Ecological Network Approach. Ecol. Indic. 2021, 125, 107487. [Google Scholar] [CrossRef]
  41. Zhang, H.; Li, J.; Tian, P.; Pu, R.; Cao, L. Construction of Ecological Security Patterns and Ecological Restoration Zones in the City of Ningbo, China. J. Geogr. Sci. 2022, 32, 663–681. [Google Scholar] [CrossRef]
  42. Bai, H.; Li, Z.; Guo, H.; Chen, H.; Luo, P. Urban Green Space Planning Based on Remote Sensing and Geographic Information Systems. Remote Sens. 2022, 14, 4213. [Google Scholar] [CrossRef]
  43. Zhang, X.; Du, H.; Wang, Y.; Chen, Y.; Ma, L.; Dong, T. Watershed Landscape Ecological Risk Assessment and Landscape Pattern Optimization: Take Fujiang River Basin as an Example. Hum. Ecol. Risk Assess. Int. J. 2021, 27, 2254–2276. [Google Scholar] [CrossRef]
  44. Yang, Z.; Li, W.; Pei, Y.; Qiao, W.; Wu, Y. Classification of the Type of Eco-Geological Environment of a Coal Mine District: A Case Study of an Ecologically Fragile Region in Western China. J. Clean. Prod. 2018, 174, 1513–1526. [Google Scholar] [CrossRef]
  45. Liang, C.; Zeng, J.; Zhang, R.-C.; Wang, Q.-W. Connecting Urban Area with Rural Hinterland: A Stepwise Ecological Security Network Construction Approach in the Urban-Rural Fringe. Ecol. Indic. 2022, 138, 108794. [Google Scholar] [CrossRef]
  46. Gao, J.; Du, F.; Zuo, L.; Jiang, Y. Integrating Ecosystem Services and Rocky Desertification into Identification of Karst Ecological Security Pattern. Landsc. Ecol. 2021, 36, 2113–2133. [Google Scholar] [CrossRef]
  47. Huang, J.; Hu, Y.; Zheng, F. Research on Recognition and Protection of Ecological Security Patterns Based on Circuit Theory: A Case Study of Jinan City. Environ. Sci. Pollut. Res. 2020, 27, 12414–12427. [Google Scholar] [CrossRef]
  48. Zhou, D.; Lin, Z.; Ma, S.; Qi, J.; Yan, T. Assessing an Ecological Security Network for a Rapid Urbanization Region in Eastern China. Land. Degrad. Dev. 2021, 32, 2642–2660. [Google Scholar] [CrossRef]
  49. Yu, H.; Gu, X.; Liu, G.; Fan, X.; Zhao, Q.; Zhang, Q. Construction of Regional Ecological Security Patterns Based on Multi-Criteria Decision Making and Circuit Theory. Remote Sens. 2022, 14, 527. [Google Scholar] [CrossRef]
  50. Zhou, G.; Huan, Y.; Wang, L.; Lan, Y.; Liang, T.; Shi, B.; Zhang, Q. Linking Ecosystem Services and Circuit Theory to Identify Priority Conservation and Restoration Areas from an Ecological Network Perspective. Sci. Total Environ. 2023, 873, 162261. [Google Scholar] [CrossRef]
  51. Li, F.; Guo, S.; Li, D.; Li, X.; Li, J.; Xie, S. A Multi-Criteria Spatial Approach for Mapping Urban Ecosystem Services Demand. Ecol. Indic. 2020, 112, 106119. [Google Scholar] [CrossRef]
  52. Chen, L.; Zhang, H.; Zhang, X.; Liu, P.; Zhang, W.; Ma, X. Vegetation Changes in Coal Mining Areas: Naturally or Anthropogenically Driven? Catena 2022, 208, 105712. [Google Scholar] [CrossRef]
  53. Mo, W.; Wang, Y.; Zhang, Y.; Zhuang, D. Impacts of Road Network Expansion on Landscape Ecological Risk in a Megacity, China: A Case Study of Beijing. Sci. Total Environ. 2017, 574, 1000–1011. [Google Scholar] [CrossRef] [PubMed]
  54. Xue, L.; Zhu, B.; Wu, Y.; Wei, G.; Liao, S.; Yang, C.; Wang, J.; Zhang, H.; Ren, L.; Han, Q. Dynamic Projection of Ecological Risk in the Manas River Basin Based on Terrain Gradients. Sci. Total Environ. 2019, 653, 283–293. [Google Scholar] [CrossRef] [PubMed]
  55. Li, W.; Wang, Y.; Xie, S.; Sun, R.; Cheng, X. Impacts of Landscape Multifunctionality Change on Landscape Ecological Risk in a Megacity, China: A Case Study of Beijing. Ecol. Indic. 2020, 117, 106681. [Google Scholar] [CrossRef]
  56. Dai, L.; Liu, Y.; Luo, X. Integrating the MCR and DOI Models to Construct an Ecological Security Network for the Urban Agglomeration around Poyang Lake, China. Sci. Total Environ. 2021, 754, 141868. [Google Scholar] [CrossRef]
  57. Yang, J.; Zeng, C.; Cheng, Y. Spatial Influence of Ecological Networks on Land Use Intensity. Sci. Total Environ. 2020, 717, 137151. [Google Scholar] [CrossRef]
  58. Kong, F.; Yin, H.; Nakagoshi, N.; Zong, Y. Urban Green Space Network Development for Biodiversity Conservation: Identification Based on Graph Theory and Gravity Modeling. Landsc. Urban Plan. 2010, 95, 16–27. [Google Scholar] [CrossRef]
  59. Miao, Z.; Pan, L.; Wang, Q.; Chen, P.; Yan, C.; Liu, L. Research on Urban Ecological Network Under the Threat of Road Networks-A Case Study of Wuhan. ISPRS Int. J. Geo-Inf. 2019, 8, 342. [Google Scholar] [CrossRef]
  60. Huang, L.; Wang, J.; Cheng, H. Spatiotemporal Changes in Ecological Network Resilience in the Shandong Peninsula Urban Agglomeration. J. Clean. Prod. 2022, 339, 130681. [Google Scholar] [CrossRef]
  61. Zhang, Y.-Z.; Jiang, Z.-Y.; Li, Y.-Y.; Yang, Z.-G.; Wang, X.-H.; Li, X.-B. Construction and Optimization of an Urban Ecological Security Pattern Based on Habitat Quality Assessment and the Minimum Cumulative Resistance Model in Shenzhen City, China. Forests 2021, 12, 847. [Google Scholar] [CrossRef]
  62. Liu, H.; Niu, T.; Yu, Q.; Yang, L.; Ma, J.; Qiu, S.; Wang, R.; Liu, W.; Li, J. Spatial and Temporal Variations in the Relationship between the Topological Structure of Eco-Spatial Network and Biodiversity Maintenance Function in China. Ecol. Indic. 2022, 139, 108919. [Google Scholar] [CrossRef]
  63. Lu, Y.; Liu, Y.; Huang, D.; Liu, Y. Evolution Analysis of Ecological Networks Based on Spatial Distribution Data of Land Use Types Monitored by Remote Sensing in Wuhan Urban Agglomeration, China, from 2000 to 2020. Remote Sens. 2022, 14, 2618. [Google Scholar] [CrossRef]
  64. Luo, Y.; Wu, J.; Wang, X.; Wang, Z.; Zhao, Y. Can Policy Maintain Habitat Connectivity under Landscape Fragmentation? A Case Study of Shenzhen, China. Sci. Total Environ. 2020, 715, 136829. [Google Scholar] [CrossRef] [PubMed]
Figure 1. Geographical location and land cover in Liaoning Province.
Remotesensing 16 03228 g001
Figure 2. Methodological framework used to construct and integrate ecological network.
Remotesensing 16 03228 g002
Figure 3. Stepwise integration model of ecological network of basic ecological network and supplementary ecological network.
Remotesensing 16 03228 g003
Figure 4. Distribution and classification of ecological sources.
Remotesensing 16 03228 g004
Figure 5. Resistance surface of every factor and modified comprehensive resistance surface. (a) represents the resistance surface of DEM; (b) represents the ecological risk index based on the land cover; (c) represents the resistance surface of land cover; (d) represents the resistance surface of vegetation coverage; (e) represents the resistance surface of the slope; and (f) represents the modified resistance surface.
Remotesensing 16 03228 g005
Figure 6. Spatial patterns of optimization of a basic ecological network.
Remotesensing 16 03228 g006
Figure 7. Spatial patterns of integration of two types of ecological network. (a) represents the integration of the basic ecological network and level 1 supplementary ecological network; (b) represents the integration of the basic ecological network and level 2 supplementary ecological network; (c) represents the integration of the basic ecological network and level 2 supplementary ecological network.
Remotesensing 16 03228 g007
Figure 8. Spatial patterns of integration of all ecological networks.
Remotesensing 16 03228 g008
Figure 9. Regulation strategies with ecological sources.
Remotesensing 16 03228 g009
Table 1. Assessment index system of ecological resistance.
FactorGradeResistance ValueWeight
Land cover and land use typeCultivated land600.25
Forest, Grassland, Shrubland1
Wetland, Waterbody10
Artificial land100
Bare land80
Slope<8°10.25
8~15°10
15~25°60
25~35°80
>35°100
DEM−274~10810.25
109~25110
252~41760
418~61580
616~1330100
Vegetation coverage≤0.21000.25
0.2~0.480
0.4~0.660
0.6~0.810
>0.81
Table 2. Constitution of the matrix of ecological sources.
Matrix TypeBasic SourceDamaged Source
Area (km2)Percentage
(%)
Area (km2)Percentage
(%)
Forest22,528.807976.48177767.45
Grassland562219.1478029.61
Shrubland111.20.333.120.13
Wetland198.10.6835.781.36
Waterbody992.63.3738.201.45
Disclaimer/Publisher’s Note: The statements, opinions and data contained in all publications are solely those of the individual author(s) and contributor(s) and not of MDPI and/or the editor(s). MDPI and/or the editor(s) disclaim responsibility for any injury to people or property resulting from any ideas, methods, instructions or products referred to in the content.

