
Mapping the Spatial and Seasonal Details of Heat Health Risks in Different Local Climate Zones: A Case Study of Shanghai, China


Abstract
:1. Introduction
2. Materials
2.1. Study Area
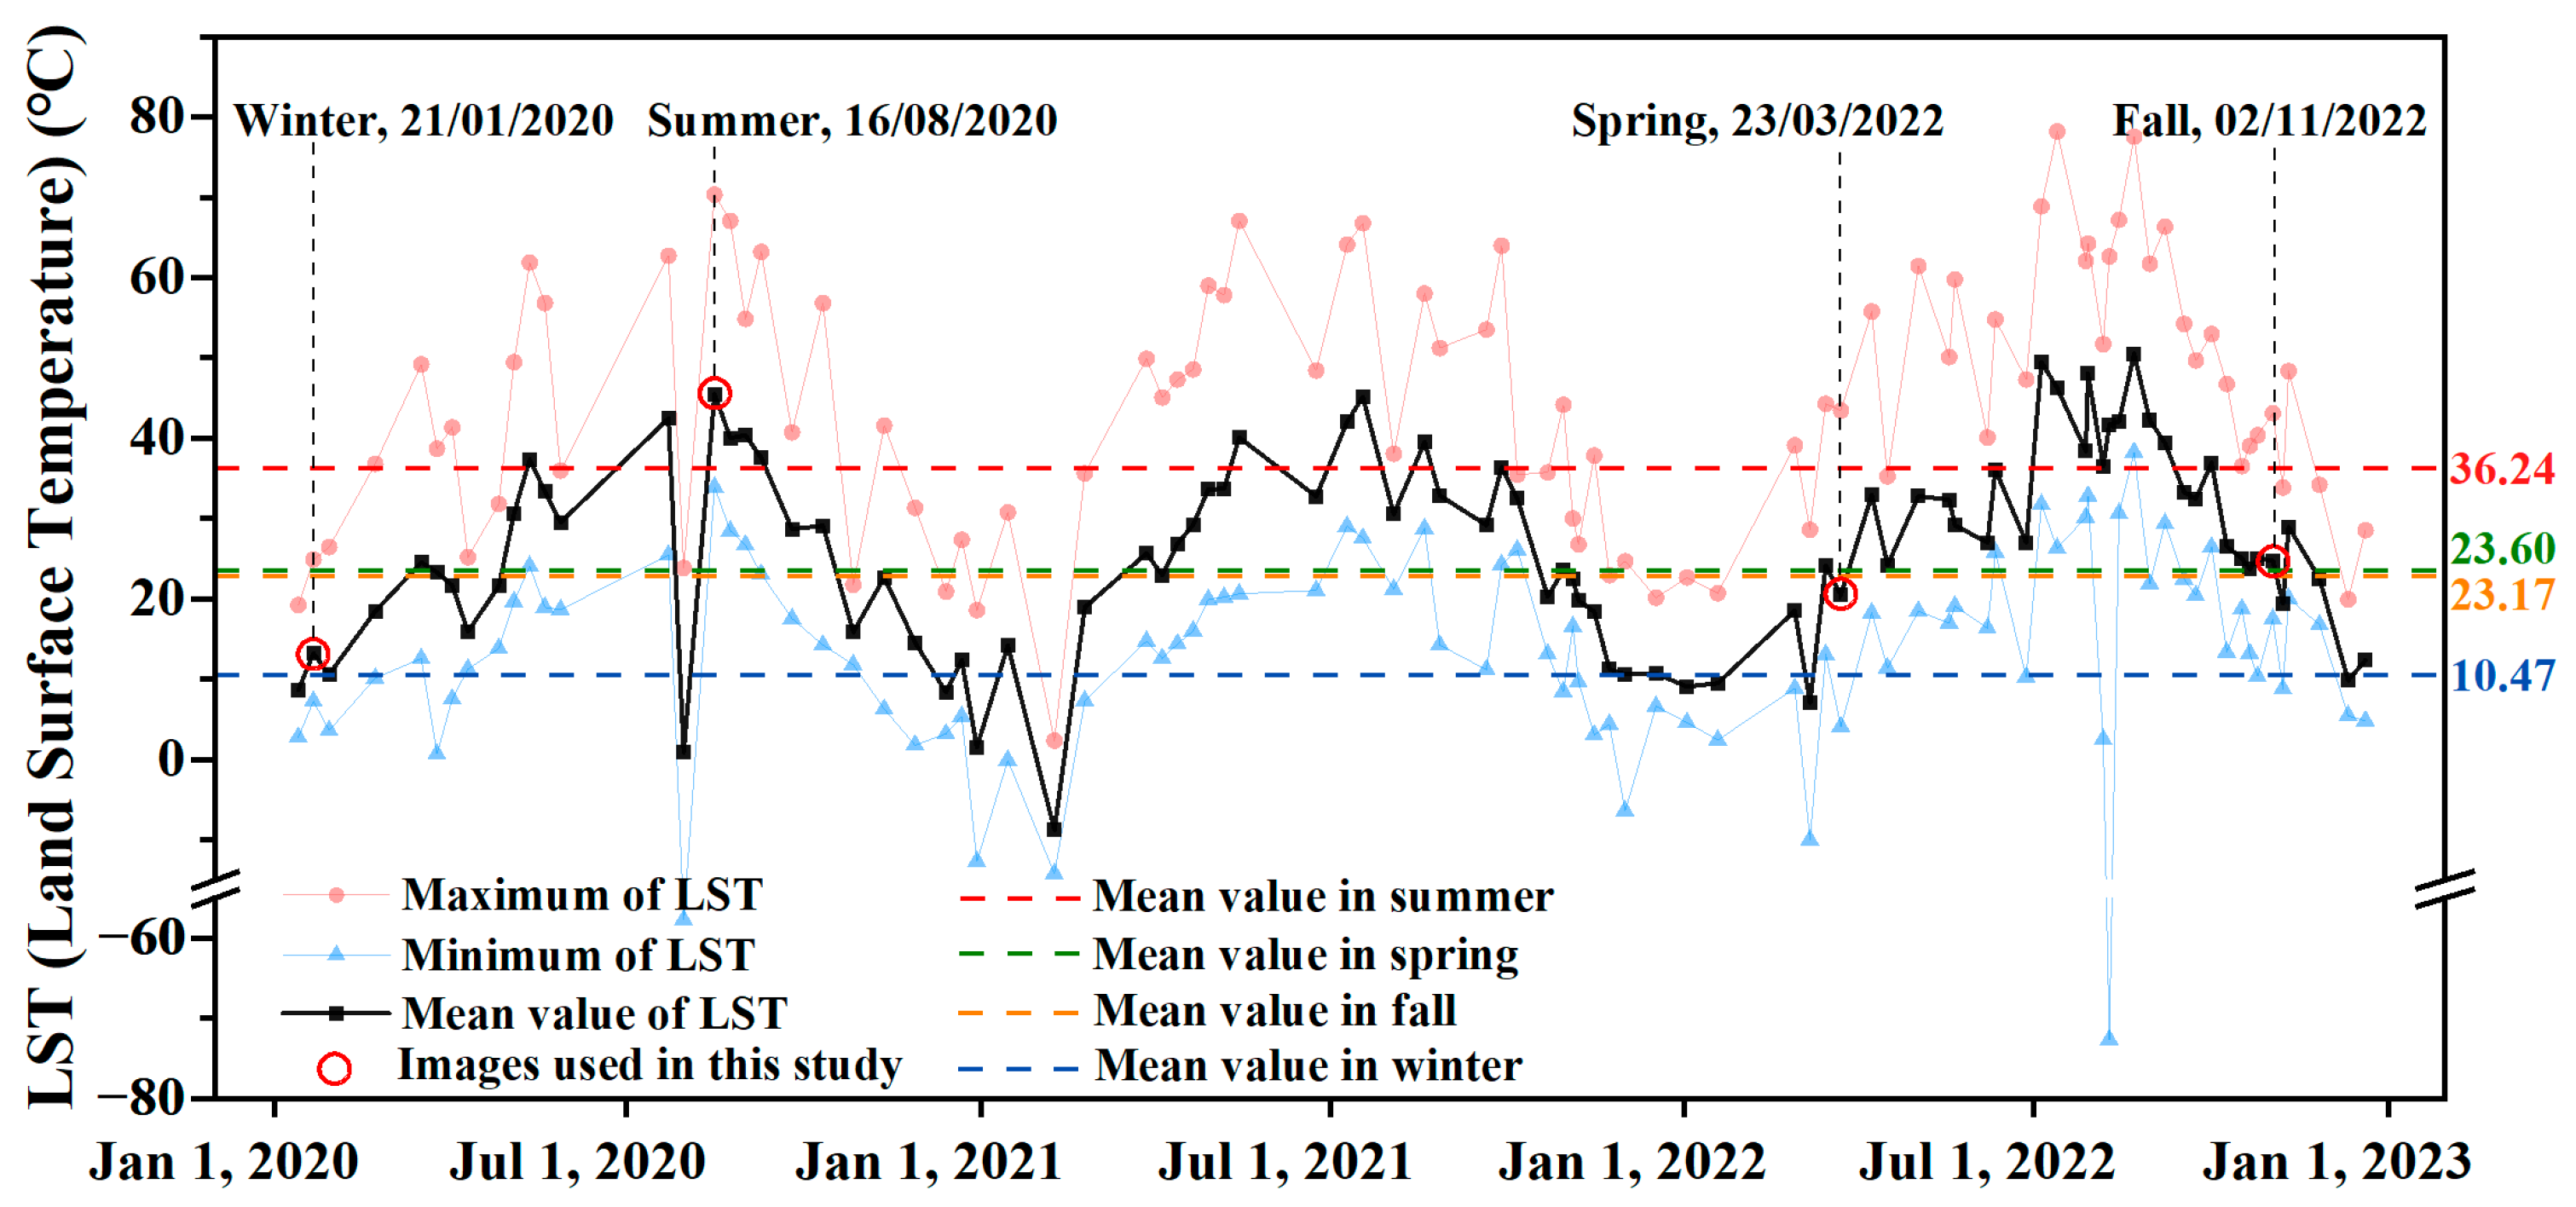
2.2. Data Sources
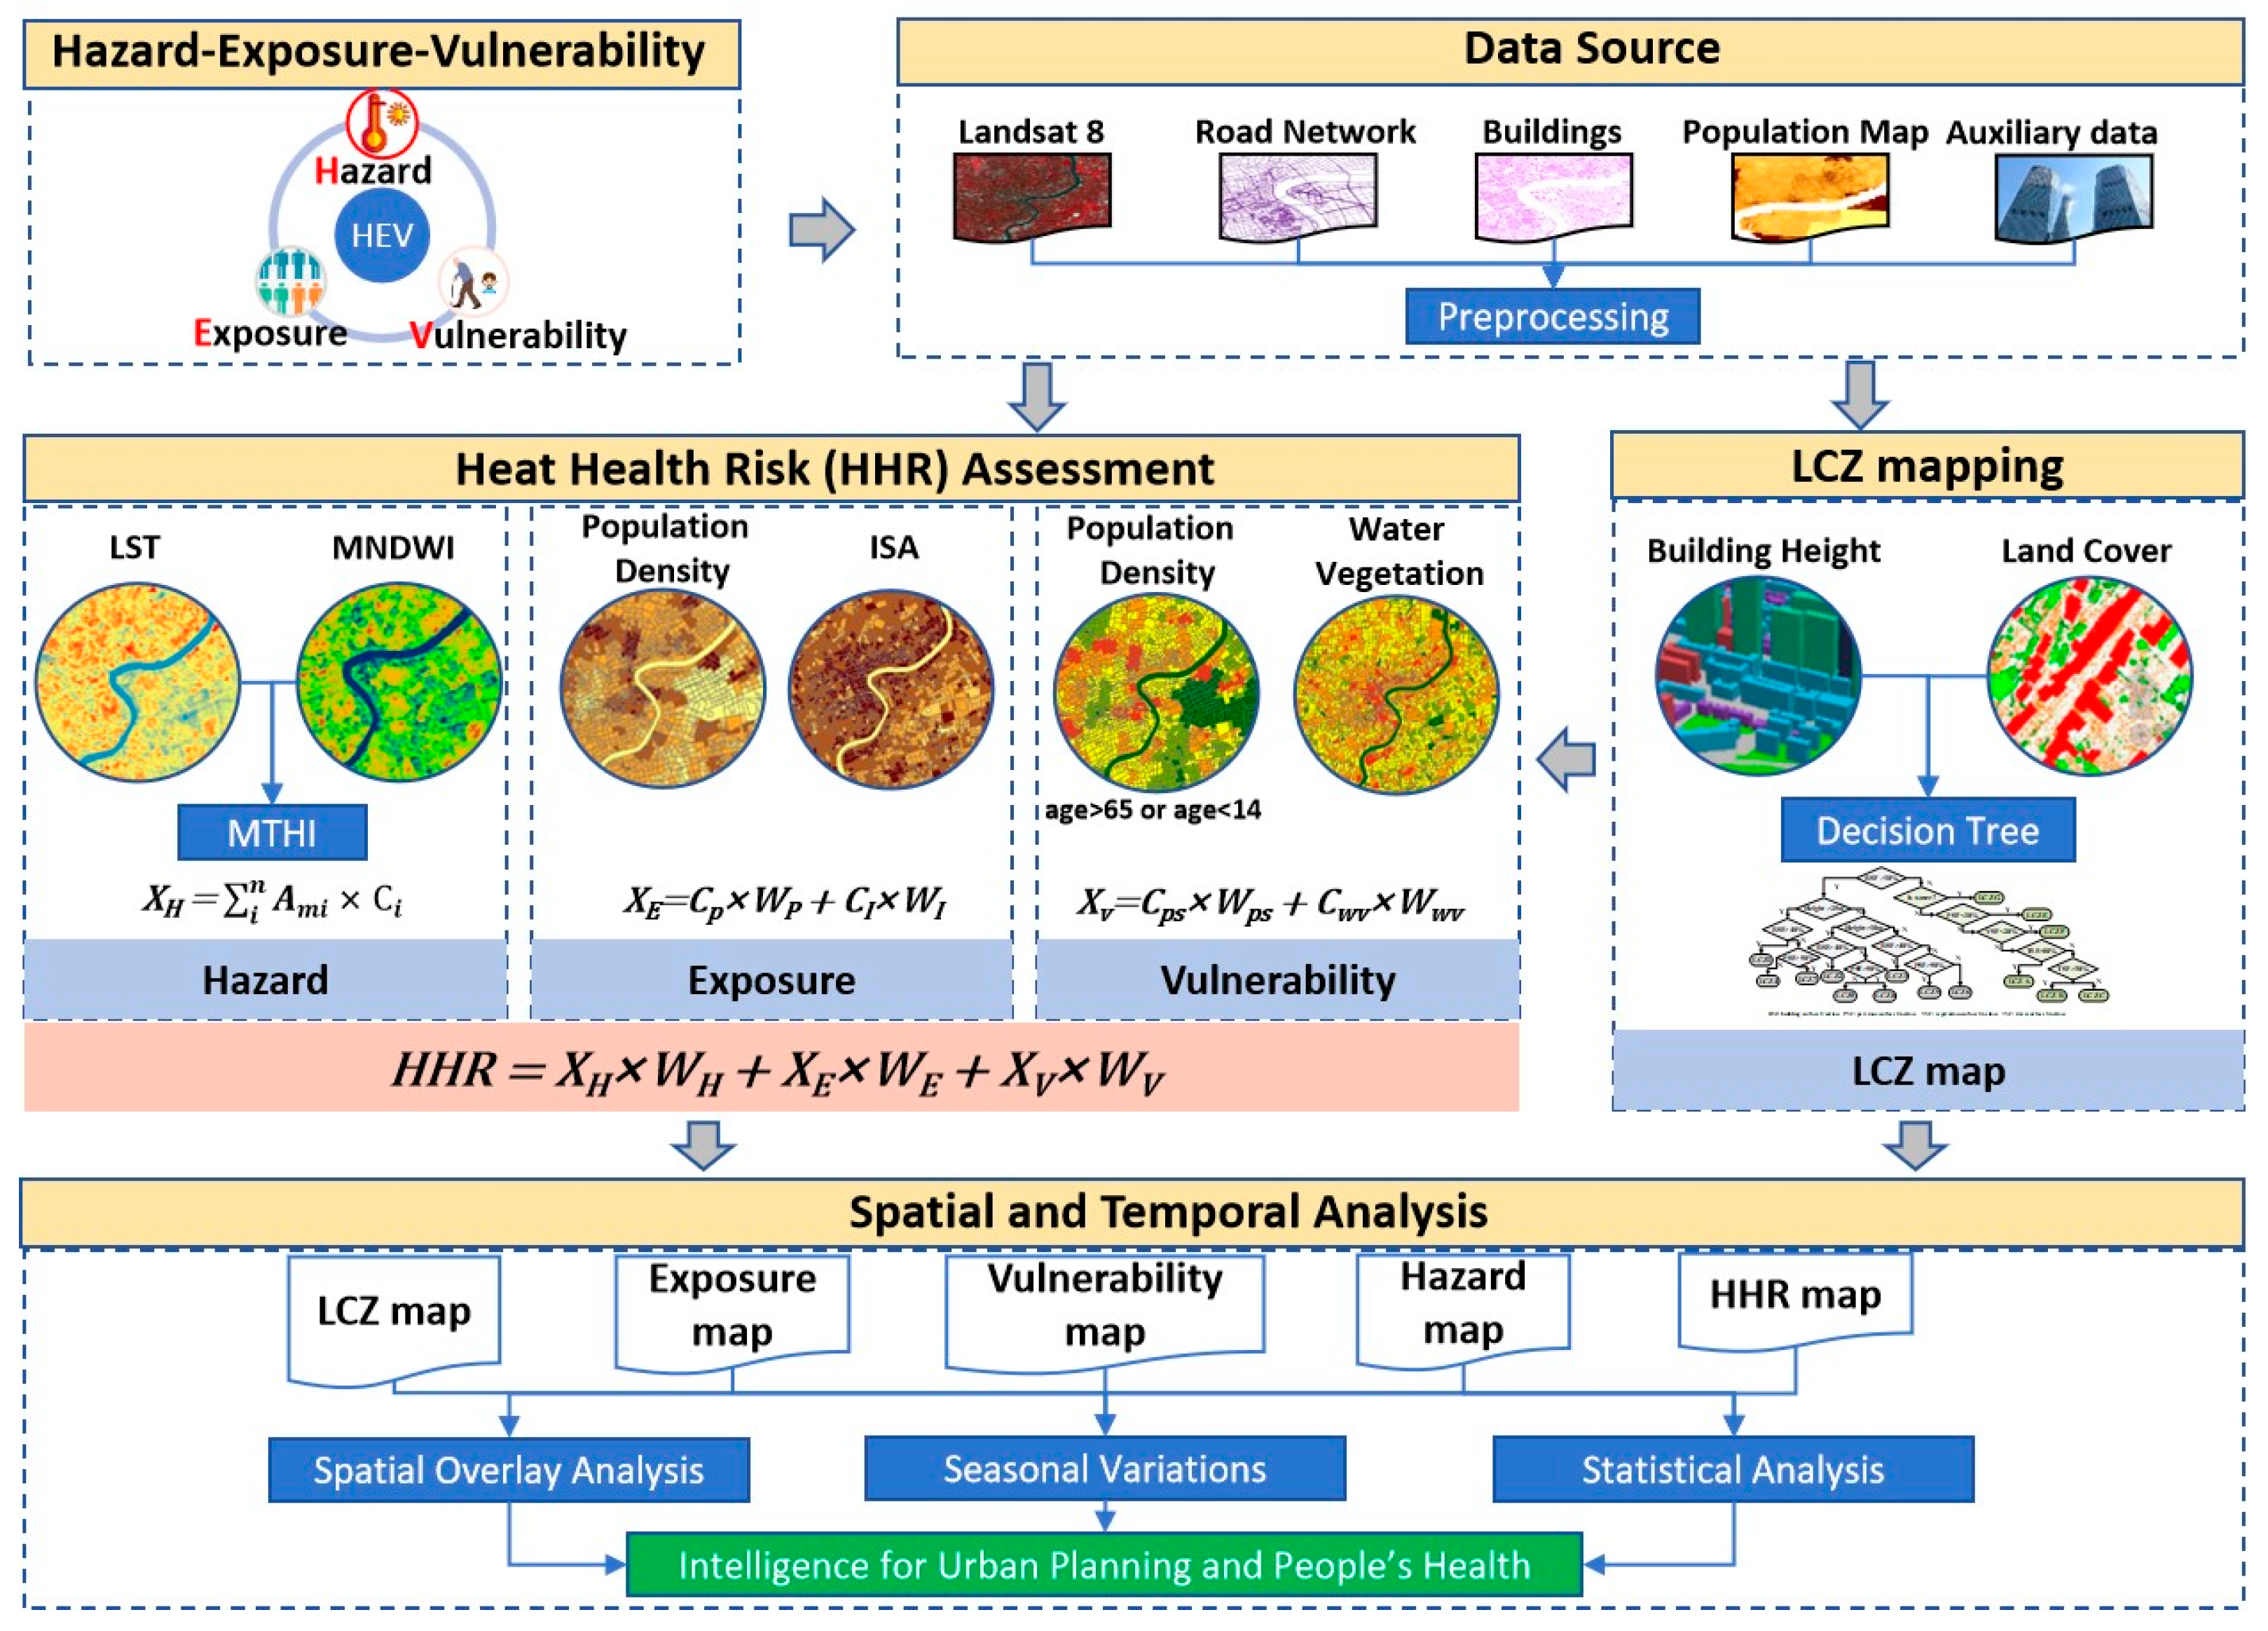
3. Methods
3.1. LCZ Mapping
3.1.1. LCZ Classification Adjustment
3.1.2. LCZ Parameter Calculations
3.2. Hazard–Exposure–Vulnerability Assessment
3.2.1. Heat Hazard Assessment
3.2.2. Heat Exposure Assessment
3.2.3. Heat Vulnerability Assessment
3.3. Heat Health Risk Assessment
4. Results
4.1. LCZ Spatial Patterns
4.2. Spatial Heat Hazard Patterns
4.2.1. Seasonal Spatial Patterns of LSTs in Shanghai
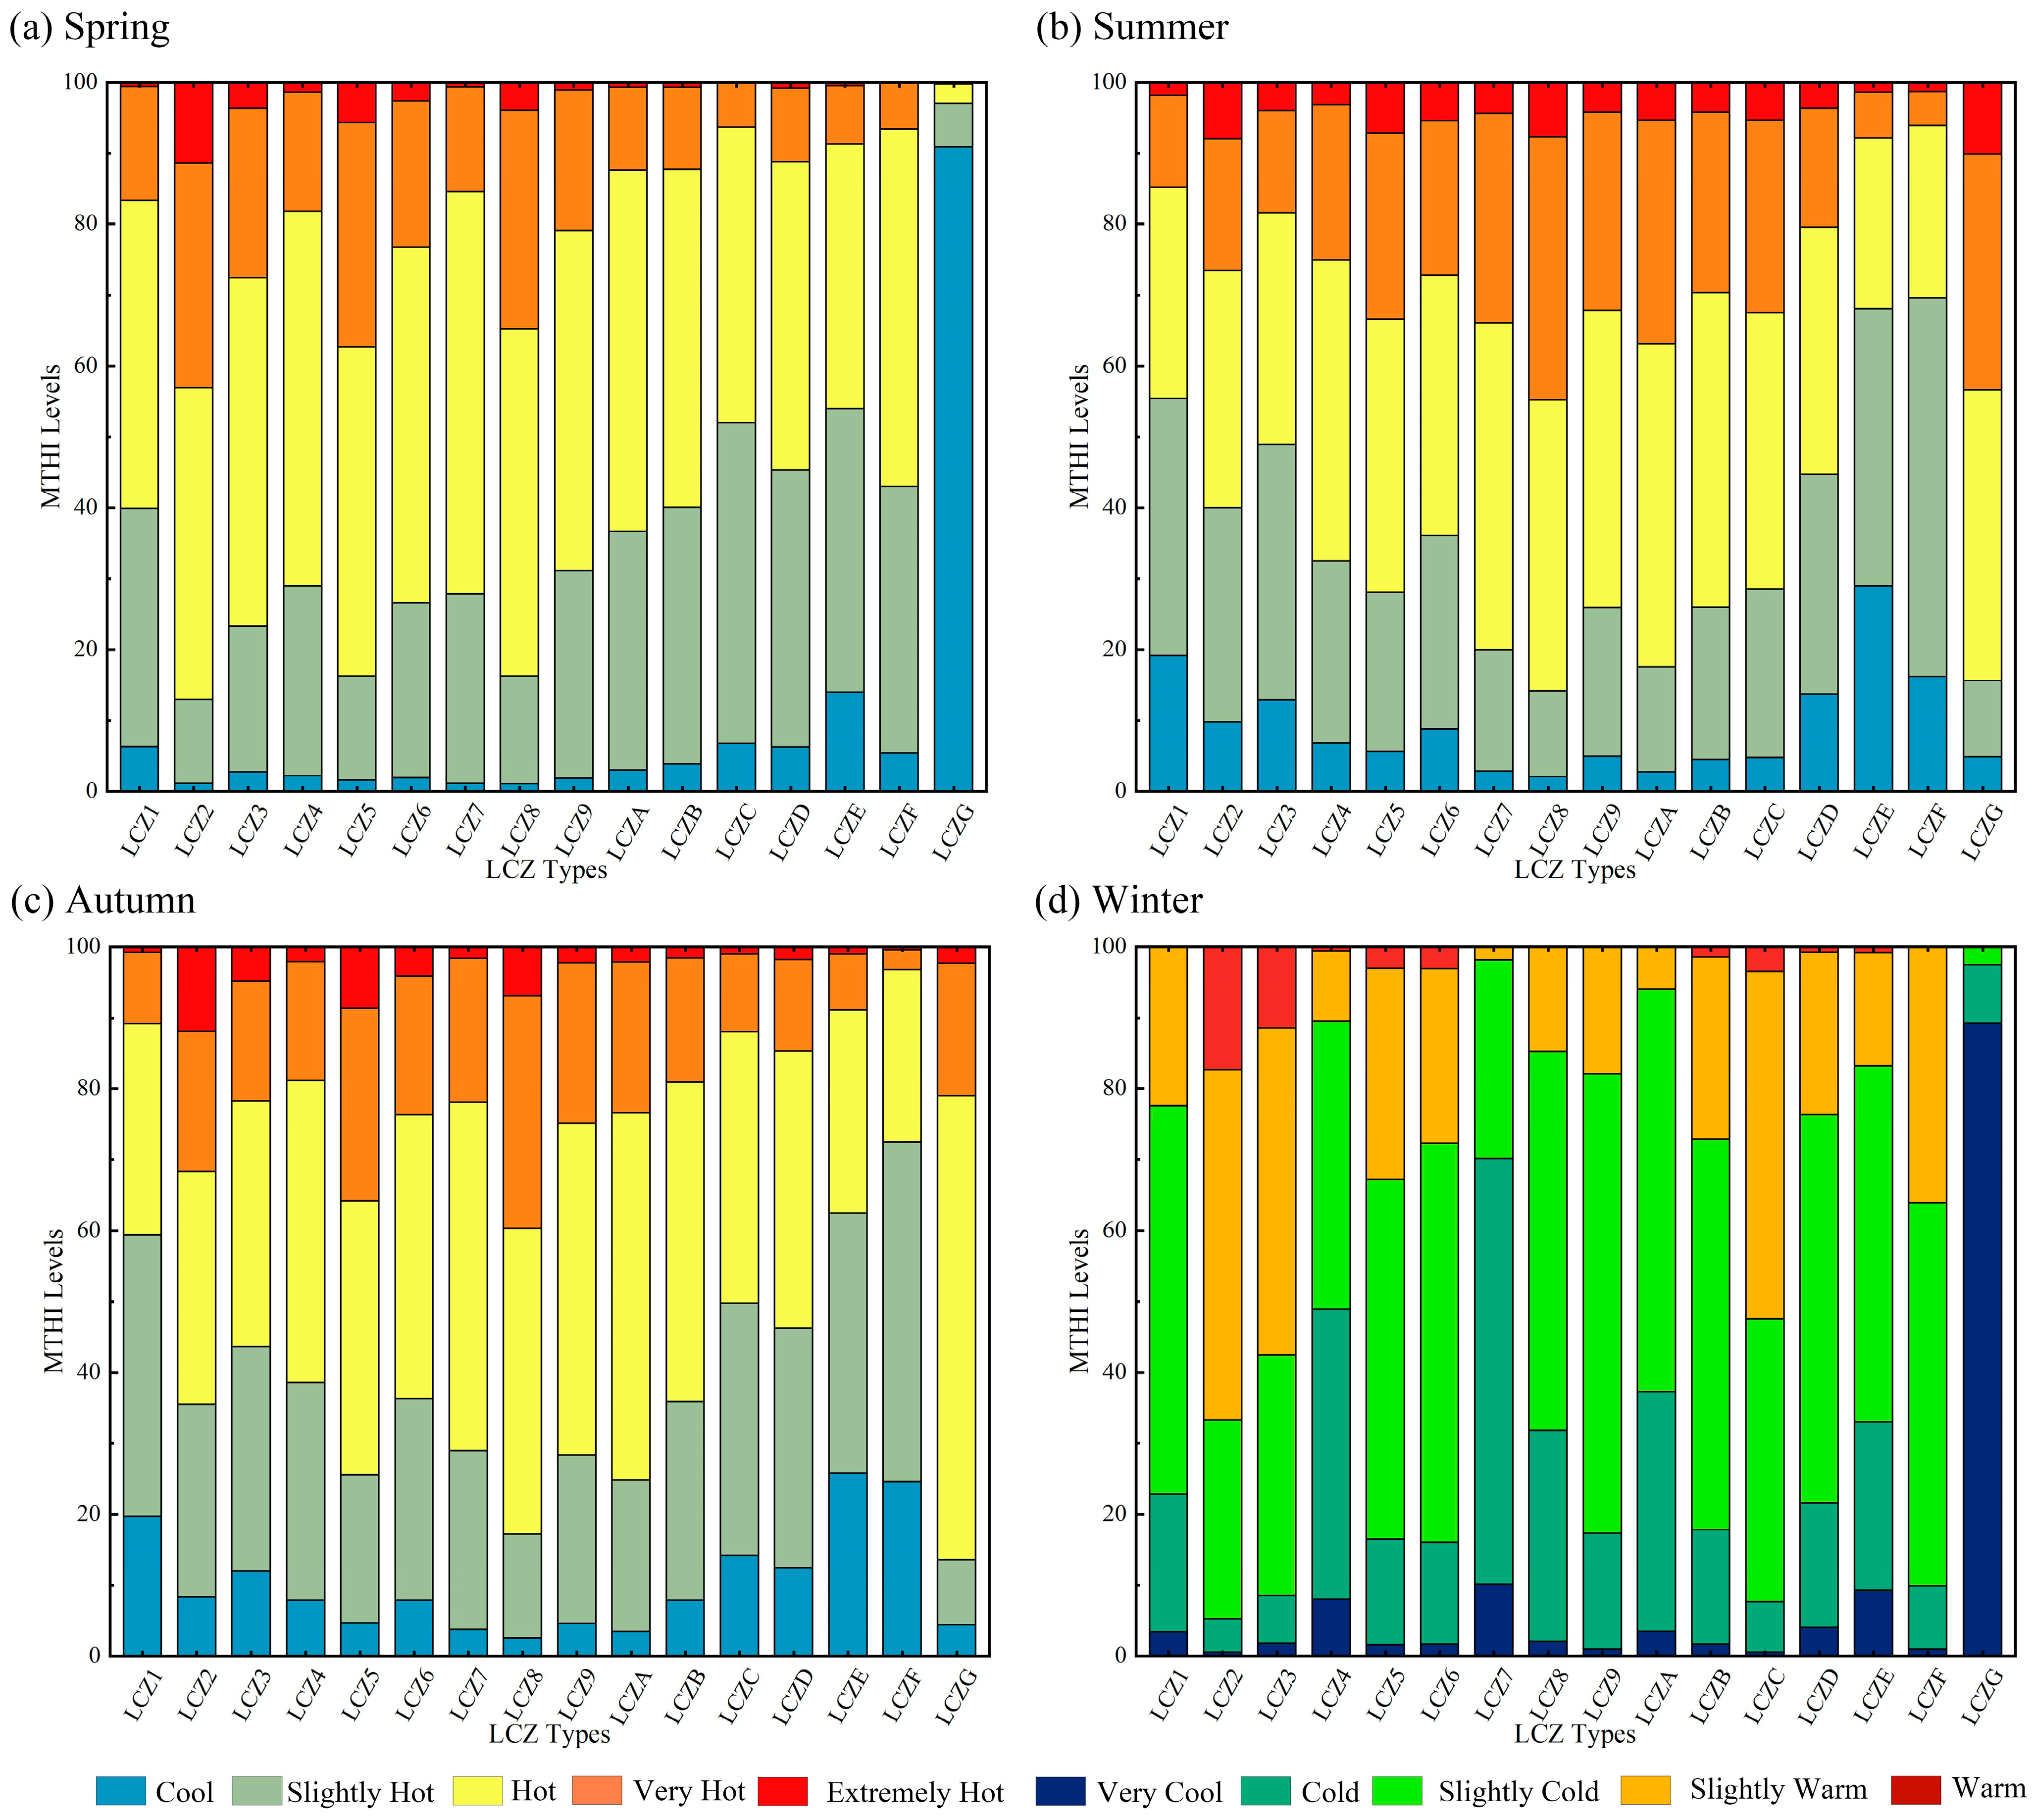
4.2.2. MTHI Spatial Patterns
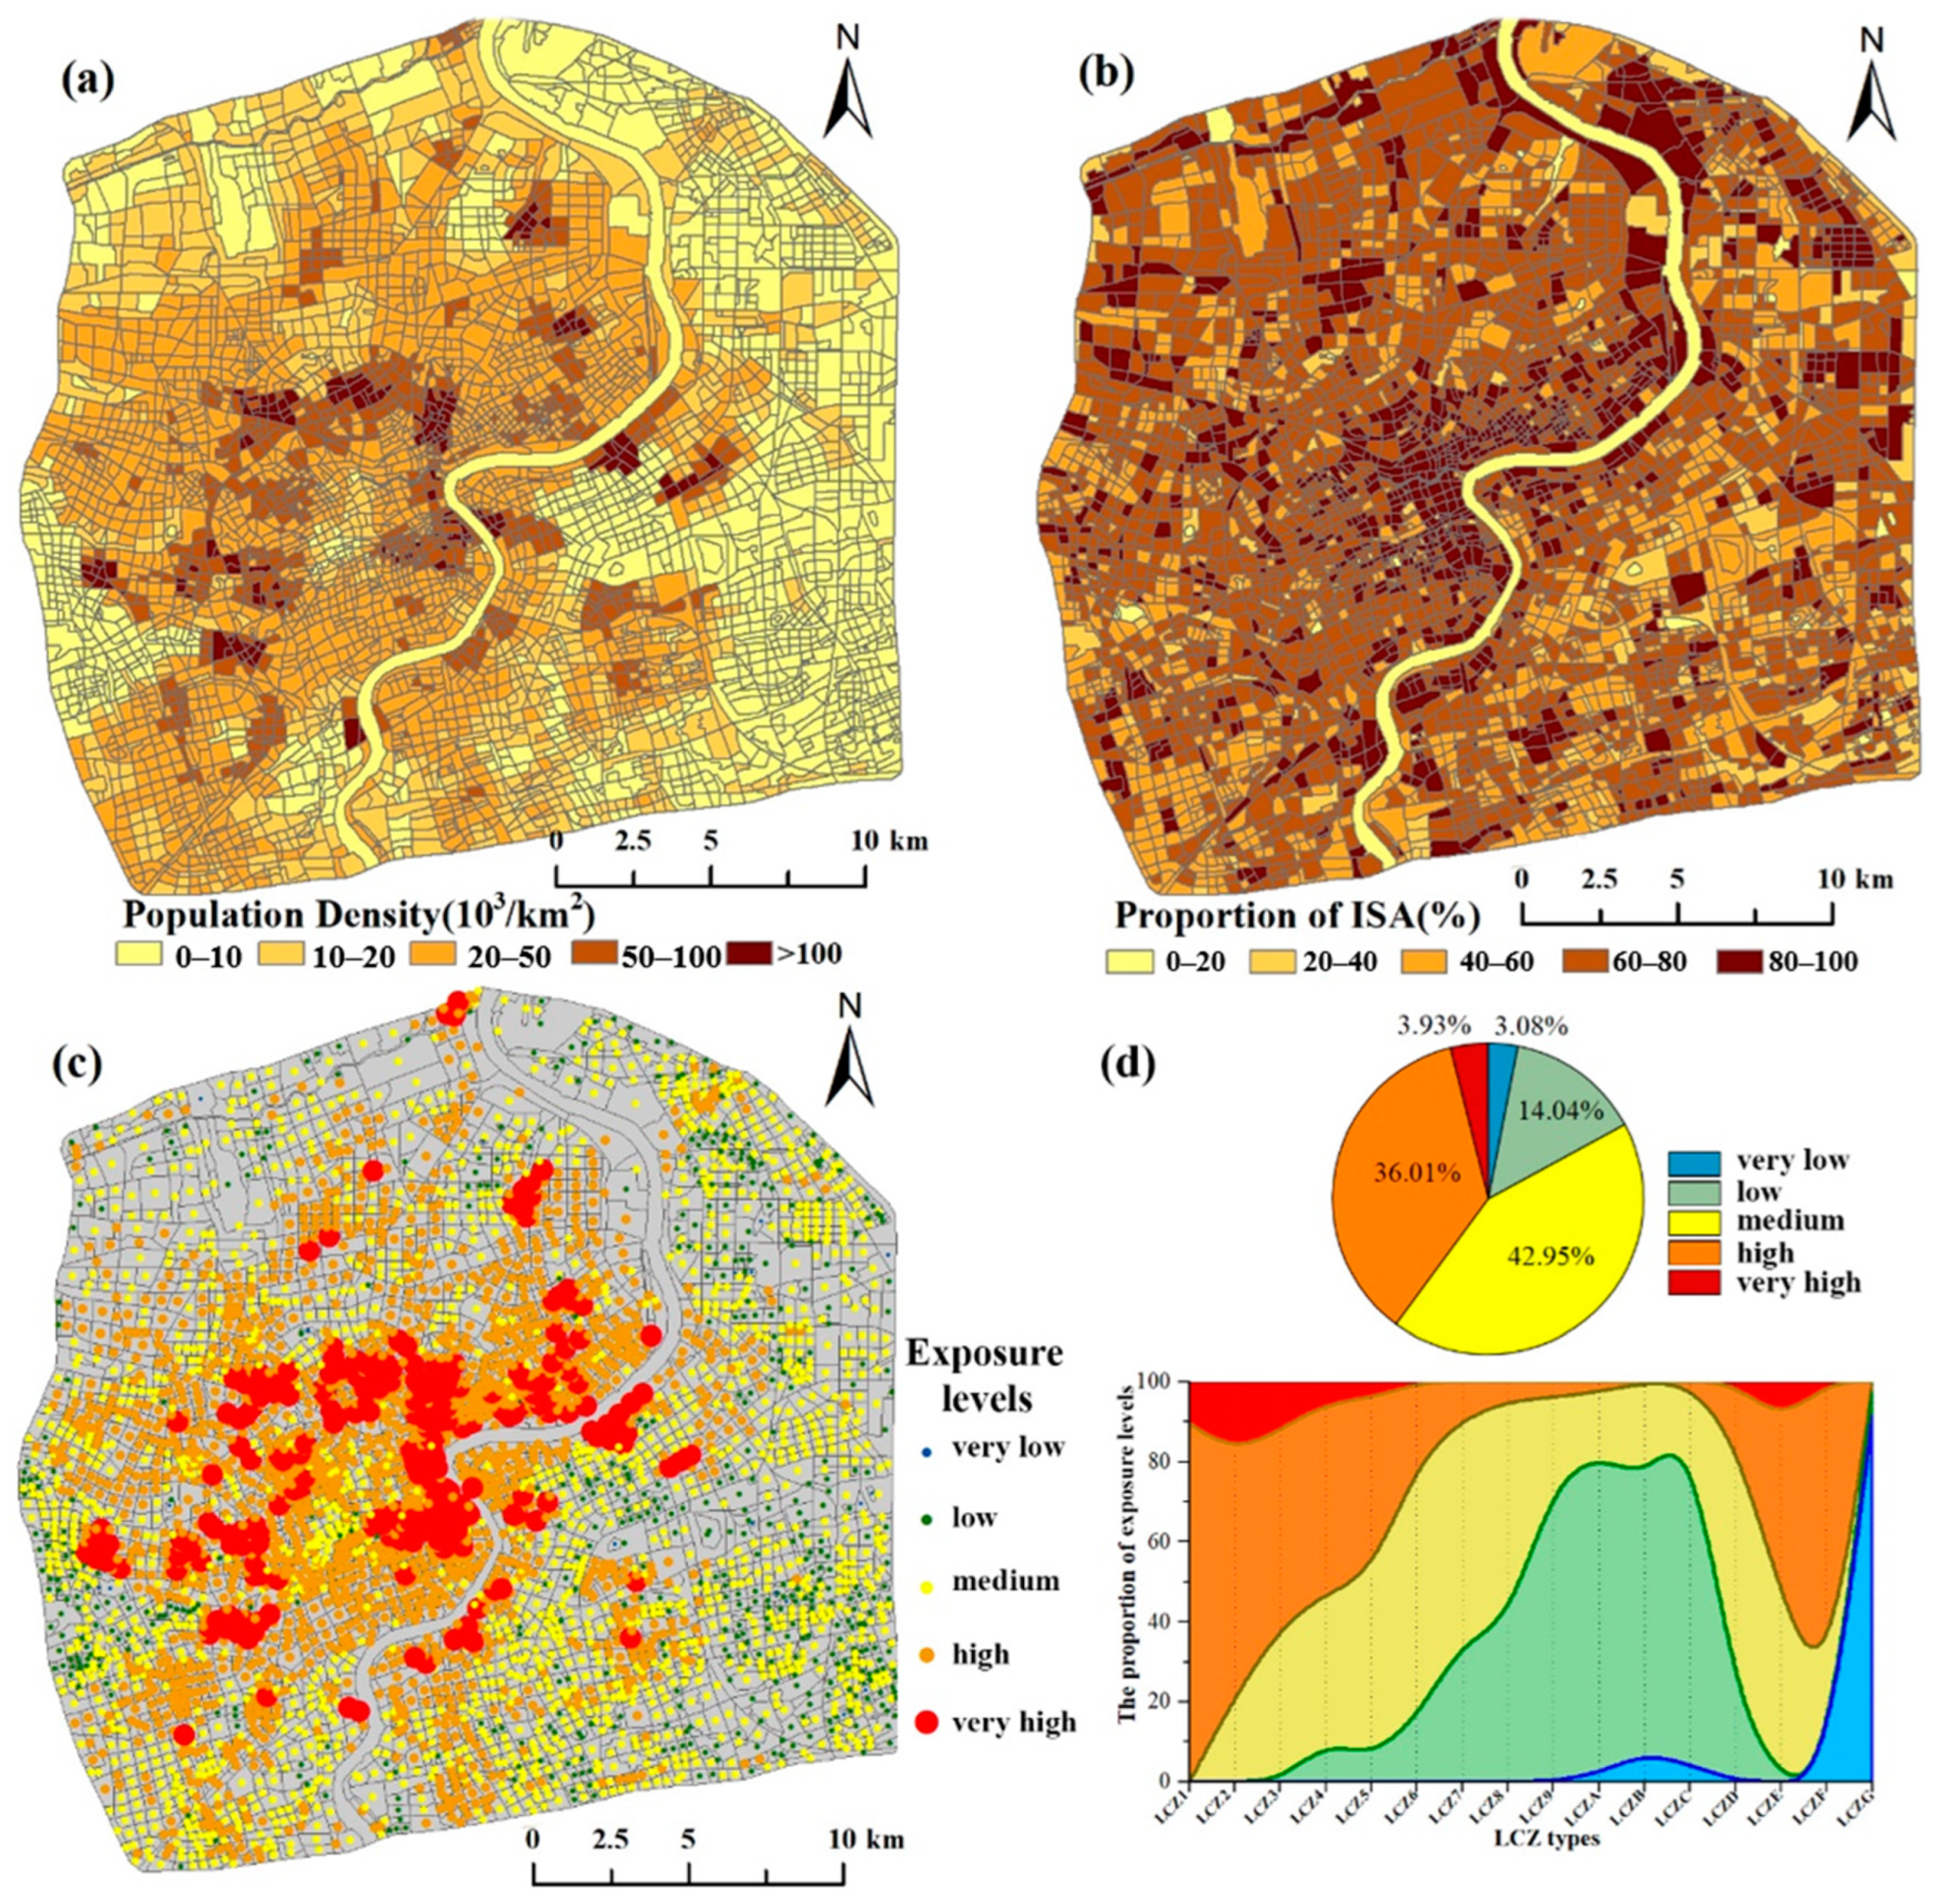
4.3. Spatial Patterns of Heat Exposure
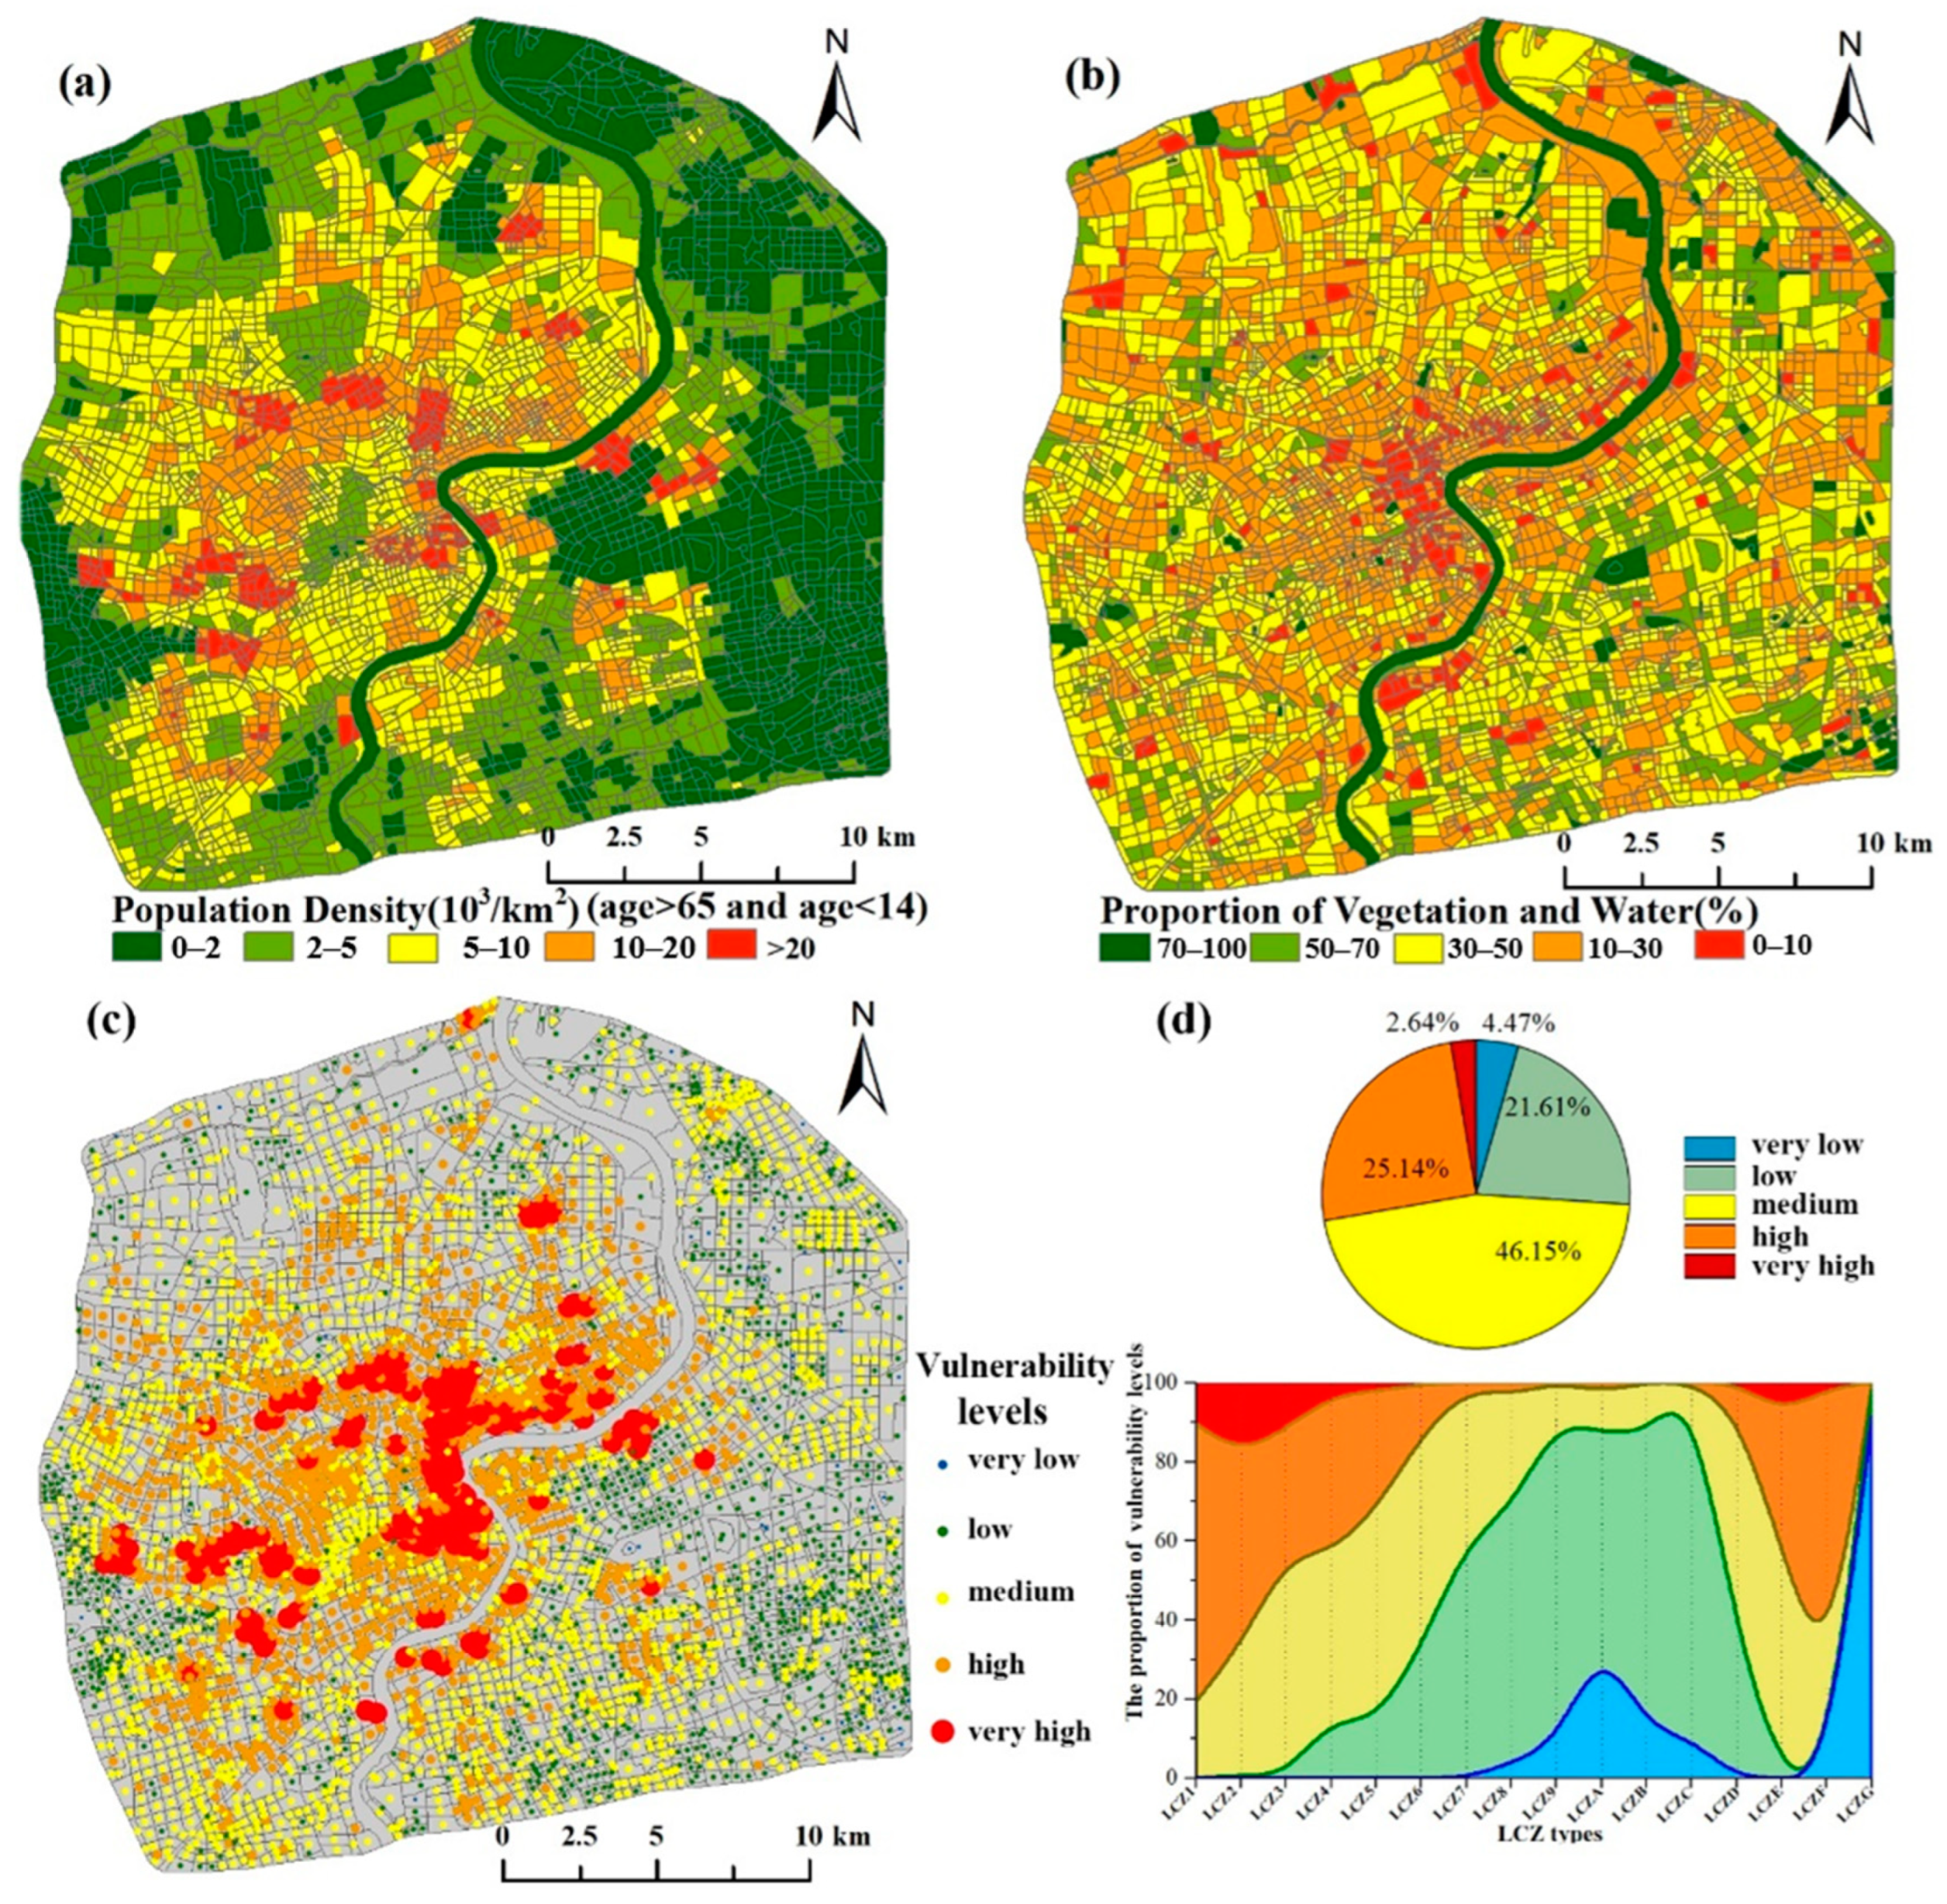
4.4. Spatial Patterns of Heat Vulnerability
4.5. Spatial and Seasonal Variations in HHRs
5. Discussion
5.1. Selection of Indicators for the HHR Assessment Framework
5.2. HHR Differences among LCZ Types
5.3. Implications for Urban Management and Planning
5.4. Study Limitations and Future Work
6. Conclusions
- (1)
- Multi-source data can effectively generate Shanghai LCZ types at the neighborhood level. The results showed that the built LCZ types in Shanghai accounted for 83.16%, whereas natural land cover accounted for only 16.84%. LCZ5 (open mid-rise) and LCZ4 (open high-rise) accounted for the largest area proportions, whereas LCZ1 (compact high-rise) accounted for less than 1%.
- (2)
- The HHR index used here could not only quantify the spatial details of heat risk levels on a fine scale, but also describe seasonal variations. Spring, summer, and autumn had similar spatial patterns of heat risk, characterized by high temperatures, and they had a higher proportion of high-risk regions (27%) than winter (23%).
- (3)
- The HHR showed significant differences among different LCZ types. Typically, the built LCZ had a higher heat risk than the natural land cover LCZs, except for LCZ E (bare paved). LCZ2, 3, and 5 posed a more serious heat risk, while LCZ 6–9 were mainly exposed in low-risk regions. Generally, compact LCZs generate severe heat risks; however, in the context of similar building density, high-rise buildings would reduce the heat risk level in hot seasons owing to shading effects but add risks in winter.
Author Contributions
Funding
Data Availability Statement
Conflicts of Interest
Appendix A

| Building LCZs | Natural LCZs | ||||
|---|---|---|---|---|---|
| LCZ1 |  | Compact high-rise (more than 9 floors) | LCZA |  | Dense trees |
| LCZ2 |  | Compact mid-rise (4–8 floors) | LCZB |  | Scattered trees |
| LCZ3 |  | Compact low-rise (1–3 floors) | LCZC |  | Bush, scrub |
| LCZ4 |  | Open high-rise (more than 9 floors) | LCZD |  | Low plants |
| LCZ5 |  | Open mid-rise (4−8 floors) | LCZE |  | Bare rock or paved |
| LCZ6 |  | Open low-rise (1–3 floors) | LCZF |  | Bare soil or sand |
| LCZ7 |  | Sparse high-rise (more than 9 floors) | LCZG |  | Water |
| LCZ8 |  | Sparse mid-rise (4−8 floors) | LCZ1–3: building density greater than 0.4 LCZ4–6: building density is between 0.2 and 0.4 LCZ7–9: building density less than 0.2 | ||
| LCZ9 |  | Sparse low-rise (1−3 floors) | |||
| Data | Mean | Max | Min | Data | Mean | Max | Min | Data | Mean | Max | Min | |
|---|---|---|---|---|---|---|---|---|---|---|---|---|
| Winter | 13 January 2020 | 8.69 | 19.24 | 2.75 | 30 December 2020 | 1.49 | 18.58 | −12.73 | 2 January 2022 | 9.07 | 22.62 | 4.63 |
| 21 January 2020 | 13.18 | 24.91 | 7.26 | 15 January 2021 | 14.17 | 30.76 | −0.07 | 18 January 2022 | 9.46 | 20.71 | 2.40 | |
| 29 January 2020 | 10.59 | 26.43 | 3.58 | 8 February 2021 | −8.77 | 2.38 | −14.26 | 27 February 2022 | 18.53 | 39.13 | 8.86 | |
| 22 February 2020 | 18.49 | 36.77 | 10.12 | 24 February 2021 | 18.93 | 35.57 | 7.32 | 11 December 2022 | 9.81 | 19.93 | 5.44 | |
| 14 December 2020 | 8.35 | 20.94 | 3.20 | 1 December 2021 | 10.64 | 24.66 | −6.38 | 20 December 2022 | 12.36 | 28.56 | 4.82 | |
| 22 December 2020 | 12.36 | 27.32 | 5.38 | 17 December 2021 | 10.65 | 20.11 | 6.63 | |||||
| Spring | 17 March 2020 | 24.51 | 49.21 | 12.55 | 28 March 2021 | 25.66 | 49.90 | 14.73 | 7 March 2022 | 7.03 | 28.61 | −10.01 |
| 25 March 2020 | 23.26 | 38.65 | 0.71 | 5 April 2021 | 22.91 | 45.03 | 12.60 | 15 March 2022 | 24.11 | 44.27 | 13.09 | |
| 2 April 2020 | 21.66 | 41.35 | 7.51 | 13 April 2021 | 26.83 | 47.28 | 14.38 | 23 March 2022 | 20.50 | 43.43 | 4.07 | |
| 10 April 2020 | 15.95 | 25.20 | 11.24 | 21 April 2021 | 29.23 | 48.53 | 16.03 | 8 April 2022 | 32.94 | 55.75 | 18.24 | |
| 26 April 2020 | 21.58 | 31.83 | 13.86 | 29 April 2021 | 33.63 | 58.99 | 19.90 | 16 April 2022 | 24.22 | 35.28 | 11.40 | |
| Summer | 4 May 2020 | 30.61 | 49.49 | 19.67 | 24 June 2021 | 32.76 | 48.44 | 21.02 | 27 June 2022 | 27.02 | 47.33 | 10.25 |
| 12 May 2020 | 37.39 | 61.83 | 24.02 | 10 July 2021 | 42.08 | 64.10 | 29.03 | 5 July 2022 | 49.47 | 68.87 | 31.77 | |
| 20 May 2020 | 33.36 | 56.83 | 18.96 | 18 July 2021 | 45.12 | 66.74 | 27.53 | 13 July 2022 | 46.24 | 78.14 | 26.31 | |
| 28 May 2020 | 29.51 | 35.99 | 18.64 | 3 August 2021 | 30.56 | 38.02 | 21.17 | 28 July 2022 | 38.42 | 62.06 | 30.13 | |
| 23 July 2020 | 42.44 | 62.68 | 25.45 | 19 August 2021 | 39.56 | 57.99 | 28.77 | 29 July 2022 | 48.07 | 64.21 | 32.83 | |
| 31 July 2020 | 0.90 | 23.87 | −57.64 | 27 August 2021 | 32.85 | 51.21 | 14.29 | 6 August 2022 | 36.52 | 51.72 | 2.47 | |
| 16 August 2020 | 45.47 | 70.29 | 33.93 | 20 September 2021 | 29.14 | 53.51 | 11.15 | 9 August 2022 | 41.68 | 62.64 | −72.62 | |
| 24 August 2020 | 40.00 | 67.06 | 28.47 | 28 September 2021 | 36.35 | 63.98 | 24.24 | 14 August 2022 | 42.06 | 67.15 | 30.65 | |
| 1 September 2020 | 40.36 | 54.84 | 26.72 | 2 May 2022 | 32.80 | 61.41 | 18.43 | 22 August 2022 | 50.54 | 77.53 | 38.29 | |
| 9 September 2020 | 37.56 | 63.17 | 23.05 | 18 May 2022 | 32.28 | 50.12 | 17.01 | 30 August 2022 | 42.19 | 61.75 | 21.88 | |
| 25 September 2020 | 28.68 | 40.72 | 17.54 | 21 May 2022 | 29.16 | 59.77 | 19.12 | 7 September 2022 | 39.41 | 66.33 | 29.40 | |
| 7 May 2021 | 33.70 | 57.76 | 20.23 | 7 June 2022 | 27.03 | 40.10 | 16.38 | 17 September 2022 | 33.32 | 54.22 | 22.48 | |
| 15 May 2021 | 40.10 | 67.04 | 20.64 | 11 June 2022 | 36.08 | 54.81 | 25.83 | 23 September 2022 | 32.48 | 49.67 | 20.41 | |
| Autumn | 11 October 2020 | 29.08 | 56.79 | 14.27 | 4 November 2021 | 22.46 | 29.99 | 16.56 | 21 October 2022 | 23.69 | 39.07 | 13.22 |
| 27 October 2020 | 15.85 | 21.71 | 11.84 | 7 November 2021 | 19.78 | 26.79 | 9.62 | 25 October 2022 | 25.03 | 40.36 | 10.32 | |
| 12 November 2020 | 22.68 | 41.57 | 6.26 | 15 November 2021 | 18.41 | 37.84 | 3.02 | 2 November 2022 | 24.78 | 43.07 | 17.46 | |
| 28 November 2020 | 14.57 | 31.33 | 1.78 | 23 November 2021 | 11.24 | 22.95 | 4.41 | 7 November 2022 | 19.45 | 33.83 | 8.79 | |
| 6 October 2021 | 32.52 | 35.48 | 26.06 | 1 October 2022 | 36.97 | 52.96 | 26.47 | 10 November 2022 | 28.98 | 48.31 | 20.03 | |
| 22 October 2021 | 20.29 | 35.77 | 13.11 | 9 October 2022 | 26.53 | 46.75 | 13.31 | 26 November 2022 | 22.54 | 34.19 | 16.80 | |
| 30 October 2021 | 23.55 | 44.15 | 8.47 | 17 October 2022 | 25.03 | 36.55 | 18.75 |
References
- Guardaro, M.; Hondula, D.M.; Redman, C.L. Social capital: Improving community capacity to respond to urban heat. Local Environ. 2022, 27, 1133–1150. [Google Scholar] [CrossRef]
- Cohen, B. Urbanization in developing countries: Current trends, future projections, and key challenges for sustainability. Technol. Soc. 2006, 28, 63–80. [Google Scholar] [CrossRef]
- IPCC. Climate Change 2022: Impacts, Adaptation and Vulnerability. Working Group II Contribution to the Sixth Assessment Report of the Intergovernmental Panel on Climate Change. Available online: https://www.ipcc.ch/report/ar6/wg2/resources/press/press-release/ (accessed on 28 February 2022).
- Wang, D.; Lau, K.K.L.; Ren, C.; Goggins, W.; Shi, Y.; Ho, H.C.; Lee, T.C.; Lee, L.S.; Woo, J.; Ng, E. The impact of extremely hot weather events on all-cause mortality in a highly urbanized and densely populated subtropical city: A 10-year time-series study (2006–2015). Sci. Total Environ. 2019, 690, 923–931. [Google Scholar] [CrossRef] [PubMed]
- He, B.J.; Wang, J.S.; Zhu, J.; Qi, J.D. Beating the urban heat: Situation, background, impacts and the way forward in China. Renew. Sustain. Energy Rev. 2022, 161, 112350. [Google Scholar] [CrossRef]
- Levermore, G.; Parkinson, J.; Lee, K.; Laycock, P.; Lindley, S. The increasing trend of the urban heat island intensity. Urban Clim. 2017, 24, 360–368. [Google Scholar] [CrossRef]
- Giannaros, C.; Agathangelidis, I.; Papavasileiou, G.; Galanaki, E.; Kotroni, V.; Lagouvardos, K.; Giannaros, T.M.; Cartalis, C.; Matzarakis, A. The extreme heat wave of July–August 2021 in the Athens urban area (Greece): Atmospheric and human-biometeorological analysis exploiting ultra-high resolution numerical modeling and the local climate zone framework. Sci. Total Environ. 2023, 857, 159300. [Google Scholar] [CrossRef]
- Kephart, J.L.; Sánchez, B.N.; Moore, J.; Schinasi, L.H.; Bakhtsiyarava, M.; Ju, Y.; Gouveia, N.; Caiaffa, W.T.; Dronova, I.; Arunachalam, S.; et al. City-level impact of extreme temperatures and mortality in Latin America. Nat. Med. 2022, 28, 1700–1705. [Google Scholar] [CrossRef]
- Ren, Z.B.; Fu, Y.; Dong, Y.L.; Zhang, P.; He, X.Y. Rapid urbanization and climate change significantly contribute to worsening urban human thermal comfort: A national 183-city, 26-year study in China. Urban Clim. 2022, 43, 101154. [Google Scholar] [CrossRef]
- Mcmichael, A.J.; Woodruff, R.E.; Hales, S. Climate change and human health: Present and future risks. Lancet 2006, 367, 859–869. [Google Scholar] [CrossRef]
- Chen, M.; Chen, L.; Zhou, Y.; Hu, M.; Jiang, Y.; Huang, D.; Gong, Y.; Xian, Y. Rising vulnerability of compound risk inequality to ageing and extreme heatwave exposure in global cities. npj Urban Sustain. 2023, 3, 38. [Google Scholar] [CrossRef]
- McPhearson, T.; Andersson, E.; Elmqvist, T.; Frantzeskaki, N. Resilience of and through urban ecosystem services. Ecosyst. Serv. 2015, 12, 152–156. [Google Scholar] [CrossRef]
- Tong, P. Characteristics, dimensions and methods of current assessment for urban resilience to climate-related disasters: A systematic review of the literature. Int. J. Disaster Risk Reduct. 2021, 60, 102276. [Google Scholar] [CrossRef]
- Maggiotto, G.; Miani, A.; Rizzo, E.; Castellone, M.D.; Piscitelli, P. Heat waves and adaptation strategies in a mediterranean urban context. Environ. Res. 2021, 197, 111066. [Google Scholar] [CrossRef] [PubMed]
- Ma, L.; Huang, G.A.; Johnson, B.A.; Chen, Z.J.; Li, M.C.; Yan, Z.Y.; Zhan, W.F.; Lu, H.; He, W.Q.; Lian, D.J. Investigating urban heat-related health risks based on local climate zones: A case study of Changzhou in China. Sustain. Cities Soc. 2023, 91, 104402. [Google Scholar] [CrossRef]
- Jedlovec, G.; Crane, D.; Quattrochi, D. Urban heat wave hazard and risk assessment. Results Phys. 2017, 7, 4294–4295. [Google Scholar] [CrossRef]
- Buchin, O.; Hoelscher, M.T.; Meier, F.; Nehls, T.; Ziegler, F. Evaluation of the health-risk reduction potential of countermeasures to urban heat islands. Energy Build. 2016, 114, 27–37. [Google Scholar] [CrossRef]
- Crichton, D. The risk triangle. Nat. Disaster Manag. 1999, 102, 102–103. [Google Scholar]
- Ellena, M.; Melis, G.; Zengarini, N.; Di Gangi, E.; Ricciardi, G.; Mercogliano, P.; Costa, G. Micro-scale UHI risk assessment on the heat-health nexus within cities by looking at socio-economic factors and built environment characteristics: The Turin case study (Italy). Urban Clim. 2023, 49, 101514. [Google Scholar] [CrossRef]
- Krstic, N.; Yuchi, W.; Ho, H.C.; Walker, B.B.; Knudby, A.J.; Henderson, S.B. The Heat Exposure Integrated Deprivation Index (HEIDI): A data-driven approach to quantifying neighborhood risk during extreme hot weather. Environ. Int. 2017, 109, 42–52. [Google Scholar] [CrossRef]
- Wang, S.Q.; Sun, Q.C.; Huang, X.; Tao, Y.G.; Dong, C.Y.; Das, S.; Liu, Y. Health-integrated heat risk assessment in Australian cities. Environ. Impact Assess. Rev. 2023, 102, 107176. [Google Scholar] [CrossRef]
- Estoque, R.C.; Ooba, M.; Seposo, X.T.; Togawa, T.; Hijioka, Y.; Takahashi, K.; Nakamura, S. Heat health risk assessment in Philippine cities using remotely sensed data and social-ecological indicators. Nat. Commun. 2020, 11, 1581. [Google Scholar] [CrossRef] [PubMed]
- Zeng, P.; Sun, F.; Shi, D.; Liu, Y.; Zhang, R.; Tian, T.; Che, Y. Integrating anthropogenic heat emissions and cooling accessibility to explore environmental justice in heat-related health risks in Shanghai, China. Landsc. Urban Plan. 2022, 226, 104490. [Google Scholar] [CrossRef]
- Johnson, D.P.; Stanforth, A.; Lulla, V.; Luber, G. Developing an applied extreme heat vulnerability index utilizing socioeconomic and environmental data. Appl. Geogr. 2012, 35, 23–31. [Google Scholar] [CrossRef]
- Dong, J.; Peng, J.; He, X.; Corcoran, J.; Qiu, S.; Wang, X. Heatwave-induced human health risk assessment in megacities based on heat stress-social vulnerability-human exposure framework. Landsc. Urban Plan. 2020, 203, 103907. [Google Scholar] [CrossRef]
- Wu, S.; Yu, W.; Chen, B. Observed inequality in thermal comfort exposure and its multifaceted associations with greenspace in United States cities. Landsc. Urban Plan. 2023, 233, 104701. [Google Scholar] [CrossRef]
- Arnberger, A.; Allex, B.; Eder, R.; Ebenberger, M.; Wanka, A.; Kolland, F.; Wallner, P.; Hutter, H.P. Elderly resident’s uses of and preferences for urban green spaces during heat periods. Urban For. Urban Green. 2017, 21, 102–115. [Google Scholar] [CrossRef]
- Zhang, W.J.; Du, Z.C.; Zhang, D.M.; Yu, S.C.; Hao, Y.T. Quantifying the adverse effect of excessive heat on children: An elevated risk of hand, foot and mouth disease in hot days. Sci. Total Environ. 2016, 541, 194–199. [Google Scholar] [CrossRef]
- Macintyre, H.L.; Heaviside, C.; Taylor, J.; Picetti, R.; Symonds, P.; Cai, X.M.; Vardoulakis, S. Assessing urban population vulnerability and environmental risks across an urban area during heatwaves—Implications for health protection. Sci. Total Environ. 2018, 610–611, 678–690. [Google Scholar] [CrossRef]
- He, B.-J. Cause-related injustice, process-related injustice, effect-related injustice and regional heat action planning priorities: An empirical study in Yangtze River Delta and Chengdu-Chongqing urban agglomerations. Landsc. Urban Plan. 2023, 237, 104800. [Google Scholar] [CrossRef]
- Yuan, B.; Zhou, L.; Hu, F.N.; Zhang, Q. Diurnal dynamics of heat exposure in Xi’an: A perspective from local climate zone. Build. Environ. 2022, 222, 109400. [Google Scholar] [CrossRef]
- Jung, W.; Kim, H. Evaluation of Heat Stress Levels Inside Greenhouses during Summer in Korea. Int. J. Environ. Res. Public Health 2022, 19, 12497. [Google Scholar] [CrossRef]
- Hisato, O.; Mori, T.; Shinagawa, K.; Nakayama, S.; Hosobuchi, H.; Mushtaha, E. Risk Assessment of Heat Stroke during the Marathon of the Tokyo 2020 Olympics in Sapporo, Hokkaido. Sustainability 2023, 15, 3997. [Google Scholar] [CrossRef]
- Brimicombe, C.; Lo, C.H.B.; Pappenberger, F.; Di Napoli, C.; Maciel, P.; Quintino, T.; Cornforth, R.; Cloke, H.L. Wet Bulb Globe Temperature: Indicating Extreme Heat Risk on a Global Grid. Geohealth 2023, 7, e2022GH000701. [Google Scholar] [CrossRef] [PubMed]
- Nikolopoulou, M.; Baker, N.; Steemers, K. Thermal comfort in outdoor urban spaces: Understanding the human parameter. Sol. Energy 2001, 70, 227–235. [Google Scholar] [CrossRef]
- Kim, Y.; Li, D.Y.; Xu, Y.Y.; Zhang, Y.; Li, X.Y.; Muhlenforth, L.; Xue, S.L.; Brown, R. Heat vulnerability and street-level outdoor thermal comfort in the city of Houston: Application of google street view image derived SVFs. Urban Clim. 2023, 51, 101617. [Google Scholar] [CrossRef]
- Ren, J.Y.; Yang, J.; Zhang, Y.Q.; Xiao, X.M.; Li, X.M.; Wang, S.H.; Xia, J.C. Exploring thermal comfort of urban buildings based on local climate zones. J. Clean. Prod. 2022, 340, 130744. [Google Scholar] [CrossRef]
- Wu, J.S.; Liu, C.; Wang, H.L. Analysis of Spatio-temporal patterns and related factors of thermal comfort in subtropical coastal cities based on local climate zones. Build. Environ. 2022, 207, 108568. [Google Scholar] [CrossRef]
- Feng, L.; Zhao, M.M.; Zhou, Y.N.; Zhu, L.J.; Tian, H.H. The seasonal and annual impacts of landscape patterns on the urban thermal comfort using Landsat. Ecol. Indic. 2020, 110, 105798. [Google Scholar] [CrossRef]
- Binarti, F.; Koerniawan, M.D.; Triyadi, S.; Utami, S.S.; Matzarakis, A. A review of outdoor thermal comfort indices and neutral ranges for hot-humid regions. Urban Clim. 2020, 31, 100531. [Google Scholar] [CrossRef]
- Dzyuban, Y.; Ching, G.N.Y.; Yik, S.K.; Tan, A.J.; Banerjee, S.; Crank, P.J.; Chow, W.T.L. Outdoor thermal comfort research in transient conditions: A narrative literature review. Landsc. Urban Plan. 2022, 226, 104496. [Google Scholar] [CrossRef]
- Mijani, N.; Alavipanah, S.K.; Firozjaei, M.K.; Arsanjani, J.J.; Hamzeh, S.; Weng, Q.H. Modeling outdoor thermal comfort using satellite imagery: A principle component analysis-based approach. Ecol. Indic. 2020, 117, 106555. [Google Scholar] [CrossRef]
- Zhang, J.; Guo, W.; Cheng, B.; Jiang, L.; Xu, S. A review of the impacts of climate factors on humans’ outdoor thermal perceptions. J. Therm. Biol. 2022, 107, 103272. [Google Scholar] [CrossRef]
- Potchter, O.; Cohen, P.; Lin, T.-P.; Matzarakis, A. A systematic review advocating a framework and benchmarks for assessing outdoor human thermal perception. Sci. Total Environ. 2022, 833, 155128. [Google Scholar] [CrossRef]
- Bao, J.; Li, X.; Yu, C. The Construction and Validation of the Heat Vulnerability Index, a Review. Int. J. Environ. Res. Public Health 2015, 12, 7220–7234. [Google Scholar] [CrossRef]
- Stewart, I.D.; Oke, T.R. Local climate zones for urban temperature studies. Bull. Am. Meteorol. Soc. 2012, 93, 1879–1900. [Google Scholar] [CrossRef]
- Leconte, F.; Bouyer, J.; Claverie, R.; Pétrissans, M. Using Local Climate Zone scheme for UHI assessment: Evaluation of the method using mobile measurements. Build. Environ. 2015, 83, 39–49. [Google Scholar] [CrossRef]
- Bechtel, B.; Demuzere, M.; Mills, G.; Zhan, W.F.; Sismanidis, P.; Small, C.; Voogt, J. SUHI analysis using Local Climate Zones—A comparison of 50 cities. Urban Clim. 2019, 28, 100451. [Google Scholar] [CrossRef]
- Aslam, A.; Rana, I.A. The use of local climate zones in the urban environment: A systematic review of data sources, methods, and themes. Urban Clim. 2022, 42, 101120. [Google Scholar] [CrossRef]
- Zhou, L.; Yuan, B.; Hu, F.N.; Wei, C.Z.; Dang, X.W.; Sun, D.Q. Understanding the effects of 2D/3D urban morphology on land surface temperature based on local climate zones. Build. Environ. 2022, 208, 108578. [Google Scholar] [CrossRef]
- Unal Cilek, M.; Cilek, A. Analyses of land surface temperature (LST) variability among local climate zones (LCZs) comparing Landsat-8 and ENVI-met model data. Sustain. Cities Soc. 2021, 69, 102877. [Google Scholar] [CrossRef]
- Liu, Y.; Li, Q.; Yang, L.; Mu, K.K.; Zhang, M.Y.; Liu, J.P. Urban heat island effects of various urban morphologies under regional climate conditions. Sci. Total Environ. 2020, 743, 140589. [Google Scholar] [CrossRef] [PubMed]
- Zhou, Y.; Zhang, G.; Jiang, L.; Chen, X.; Xie, T.; Wei, Y.; Xu, L.; Pan, Z.; An, P.; Lun, F. Mapping local climate zones and their associated heat risk issues in Beijing: Based on open data. Sustain. Cities Soc. 2021, 74, 103174. [Google Scholar] [CrossRef]
- Yin, Q.; Cao, Y.; Sun, C. Research on outdoor thermal comfort of high-density urban center in severe cold area. Build. Environ. 2021, 200, 107938. [Google Scholar] [CrossRef]
- Xu, M.; Hong, B.; Mi, J.Y.; Yan, S.S. Outdoor thermal comfort in an urban park during winter in cold regions of China. Sustain. Cities Soc. 2018, 43, 208–220. [Google Scholar] [CrossRef]
- Sun, F.Y.; Liu, M.; Wang, Y.C.; Wang, H.; Che, Y. The effects of 3D architectural patterns on the urban surface temperature at a neighborhood scale: Relative contributions and marginal effects. J. Clean. Prod. 2020, 258, 120706. [Google Scholar] [CrossRef]
- Yang, J.; Ren, J.; Sun, D.; Xiao, X.; Xia, J.; Jin, C.; Li, X. Understanding land surface temperature impact factors based on local climate zones. Sustain. Cities Soc. 2021, 69, 102818. [Google Scholar] [CrossRef]
- Yang, C.B.; He, X.Y.; Yan, F.Q.; Yu, L.X.; Bu, K.; Yang, J.C.; Chang, L.P.; Zhang, S.W. Mapping the influence of land use/land cover changes on the urban heat island effect—A case study of Changchun, China. Sustainability 2017, 9, 312. [Google Scholar] [CrossRef]
- Chen, X.; Zhang, Y. Impacts of urban surface characteristics on spatiotemporal pattern of land surface temperature in Kunming of China. Sustain. Cities Soc. 2017, 32, 87–99. [Google Scholar] [CrossRef]
- Huang, F.; Jiang, S.D.; Zhan, W.F.; Bechtel, B.; Liu, Z.H.; Demuzere, M.; Huang, Y.; Xu, Y.; Ma, L.; Xia, W.J.; et al. Mapping local climate zones for cities: A large review. Remote Sens. Environ. 2023, 292, 113573. [Google Scholar] [CrossRef]
- Imran, H.M.; Hossain, A.; Islam, A.K.M.S.; Rahman, A.; Bhuiyan, M.A.E.; Paul, S.; Alam, A. Impact of Land Cover Changes on Land Surface Temperature and Human Thermal Comfort in Dhaka City of Bangladesh. Earth Syst. Environ. 2021, 5, 667–693. [Google Scholar] [CrossRef]
- Yang, C.B.; Zhu, W.H.; Sun, J.B.; Xu, X.L.; Wang, R.H.; Lu, Y.F.; Zhang, S.W.; Zhou, W.Q. Assessing the effects of 2D/3D urban morphology on the 3D urban thermal environment by using multi-source remote sensing data and UAV measurements: A case study of the snow-climate city of Changchun, China. J. Clean. Prod. 2021, 321, 128956. [Google Scholar] [CrossRef]
- Yi, T.; Wang, H.; Liu, C.; Li, X.; Wu, J. Thermal comfort differences between urban villages and formal settlements in Chinese developing cities: A case study in Shenzhen. Sci. Total Environ. 2022, 853, 158283. [Google Scholar] [CrossRef] [PubMed]
- Yang, C.B.; Yan, F.Q.; Lei, X.L.; Ding, X.L.; Zheng, Y.; Liu, L.F.; Zhang, S.W. Investigating Seasonal Effects of Dominant Driving Factors on Urban Land Surface Temperature in a Snow-Climate City in China. Remote Sens. 2020, 12, 3006. [Google Scholar] [CrossRef]
- Yuan, F.; Bauer, M.E. Comparison of impervious surface area and normalized difference vegetation index as indicators of surface urban heat island effects in Landsat imagery. Remote Sens. Environ. 2007, 106, 375–386. [Google Scholar] [CrossRef]
- Fard, B.J.; Mahmood, R.; Hayes, M.; Rowe, C.; Abadi, A.M.; Shulski, M.; Medcalf, S.; Lookadoo, R.; Bell, J.E. Mapping Heat Vulnerability Index Based on Different Urbanization Levels in Nebraska, USA. GeoHealth 2021, 5, e2021GH000478. [Google Scholar] [CrossRef] [PubMed]
- Zhu, W.; Yuan, C. Urban heat health risk assessment in Singapore to support resilient urban design—By integrating urban heat and the distribution of the elderly population. Cities 2023, 132, 104103. [Google Scholar] [CrossRef]
- Zhang, H.B.; Chen, Y.; Rui, J.W.; Yoshino, H.; Zhang, J.F.; Chen, X.; Liu, J. Effects of thermal environment on elderly in urban and rural houses during heating season in a severe cold region of China. Energy Build. 2019, 198, 61–74. [Google Scholar] [CrossRef]
- Jamei, E.; Rajagopalan, P.; Seyedmahmoudian, M.; Jamei, Y. Review on the impact of urban geometry and pedestrian level greening on outdoor thermal comfort. Renew. Sustain. Energy Rev. 2016, 54, 1002–1017. [Google Scholar] [CrossRef]
- Chen, Q.; Ding, M.; Yang, X.; Hu, K.; Qi, J. Spatially explicit assessment of heat health risk by using multi-sensor remote sensing images and socioeconomic data in Yangtze River Delta, China. Int. J. Health Geogr. 2018, 17, 15. [Google Scholar] [CrossRef]
- Huntington, J.L.; Hegewisch, K.C.; Daudert, B.; Morton, C.G.; Abatzoglou, J.T.; McEvoy, D.J.; Erickson, T. Climate Engine: Cloud Computing and Visualization of Climate and Remote Sensing Data for Advanced Natural Resource Monitoring and Process Understanding. Bull. Am. Meteorol. Soc. 2017, 98, 2397–2410. [Google Scholar] [CrossRef]
- Hwang, R.-L.; Lin, T.-P.; Matzarakis, A. Seasonal effects of urban street shading on long-term outdoor thermal comfort. Build. Environ. 2011, 46, 863–870. [Google Scholar] [CrossRef]
- Guo, Z.; Zhang, Z.W.; Wu, X.G.; Wang, J.; Zhang, P.D.; Ma, D.; Liu, Y. Building shading affects the ecosystem service of urban green spaces: Carbon capture in street canyons. Ecol. Model. 2020, 431, 109178. [Google Scholar] [CrossRef]
- Kottek, M.; Grieser, J.; Beck, C.; Rudolf, B.; Rubel, F. World map of the Köppen-Geiger climate classification updated. Meteorol. Z. 2006, 15, 259–263. [Google Scholar] [CrossRef] [PubMed]
- Lin, X.R.; Zhu, G.F.; Qiu, D.D.; Ye, L.L.; Liu, Y.W.; Chen, L.H.; Liu, J.W.; Lu, S.Y.; Wang, L.; Zhao, K.L.; et al. Stable precipitation isotope records of cold wave events in Eurasia. Atmos. Res. 2023, 296, 13. [Google Scholar] [CrossRef]
- Naikoo, M.W.; Islam, A.R.M.T.; Mallick, J.; Rahman, A. Land use/land cover change and its impact on surface urban heat island and urban thermal comfort in a metropolitan city. Urban Clim. 2022, 41, 101052. [Google Scholar]
- Park, Y.; Guldmann, J.-M.; Liu, D. Impacts of tree and building shades on the urban heat island: Combining remote sensing, 3D digital city and spatial regression approaches. Comput. Environ. Urban Syst. 2021, 88, 101655. [Google Scholar] [CrossRef]
- Zhou, L.; Ma, L.; Johnson, B.A.; Yan, Z.Y.; Li, F.X.; Li, M.C. Patch-Based Local Climate Zones Mapping and Population Distribution Pattern in Provincial Capital Cities of China. ISPRS Int. J. Geo-Inf. 2022, 11, 420. [Google Scholar] [CrossRef]
- Lehnert, M.; Brabec, M.; Jurek, M.; Vladimír, T.; Geletic, J. The role of blue and green infrastructure in thermal sensation in public urban areas: A case study of summer days in four Czech cities. Sustain. Cities Soc. 2021, 66, 102683. [Google Scholar] [CrossRef]
- Pamukcu-Albers, P.; Ugolini, F.; La Rosa, D.; Gradinaru, S.R.; Azevedo, J.C.; Wu, J.G. Building green infrastructure to enhance urban resilience to climate change and pandemics. Landsc. Ecol. 2021, 36, 665–673. [Google Scholar] [CrossRef]
- Chen, G.Z.; Hua, J.Y.; Shi, Y.; Ren, C. Constructing air temperature and relative humidity-based hourly thermal comfort dataset for a high-density city using machine learning. Urban Clim. 2023, 47, 101400. [Google Scholar] [CrossRef]


| Type | Data | Time | Resolution | Cloud Cover | ID | Data Source | Description |
|---|---|---|---|---|---|---|---|
| Remote sensing data (tif) | Landsat 8/9 images | 21 January 2020 | 30 m | 5.01% | LC81180382020021LGN00 | https://www.gscloud.cn/, accessed on 1 September 2023. | For the calculation of NDVI, LST, NDMI, ISA, and MNDWI. (1) NDVI, ISA, and MNDWI are used for LCZ mapping. (2) LST and NDMI are used for assessing hazard. (3) ISA is used for assessing exposure. (4) NDVI and MNDWI are used for assessing vulnerability. |
| 16 August 2020 | 30 m | 2.14% | LC81180382020229LGN00 | ||||
| 23 March 2022 | 30 m | 0.27% | LC09_L2SP_118038_20220323_20220424_02_T1 | https://earthexplorer.usgs.gov/, accessed on 1 September 2023. | |||
| 2 November 2022 | 30 m | 12.73% | LC08_L2SP_118038_20191102_20200825_02_T1 | ||||
| Population data | 2020 | 100 m | - | - | https://www.worldpop.org/, accessed on 1 September 2023. | For the calculation of population density and the proportion of sensitive groups in assessing exposure and vulnerability. | |
| Vector data (shp) | Road network | 2020 | - | - | - | https://export.hotosm.org/en/v3/, accessed on 1 September 2023. | For the partition of block boundaries. |
| Building data | 2020 | - | - | - | https://www.resdc.cn/, accessed on 1 September 2023. | For the calculation of building density and height in LCZ mapping. |
| MTHI Level | Range of MTHI Values | |||
|---|---|---|---|---|
| Spring, Summer, Autumn | Winter | |||
| 1 | MTHI < M − 1.5 a | Cool | M + 1.5 a ≤ MTHI | Warm |
| 2 | M − 1.5 a ≤ MTHI < M − 0.5 a | Slightly hot | M + 0.5 a ≤ MTHI < M + 1.5 a | Slightly Warm |
| 3 | M − 0.5 a ≤ MTHI < M + 0.5 a | Hot | M − 0.5 a ≤ MTHI < M + 0.5 a | Slightly Cold |
| 4 | M + 0.5 a ≤ MTHI < M + 1.5 a | Very hot | M − 1.5 a ≤ MTHI < M − 0.5 a | Cold |
| 5 | M + 1.5 a ≤ MTHI | Extremely Hot | MTHI < M − 1.5 a | Very cold |
| Level | Range for Population Density (PD) (103/km2) | Range for ISA Fraction (%) |
|---|---|---|
| 1 | PD < 10 | 0 ≤ ISA < 20 |
| 2 | 10 ≤ PD < 20 | 20 ≤ ISA < 40 |
| 3 | 20 ≤ PD < 50 | 40 ≤ ISA < 60 |
| 4 | 50 ≤ PD < 100 | 60 ≤ ISA < 80 |
| 5 | 100 ≤ PD | 80 ≤ ISA < 100 |
| Descriptive Features | Built LCZ Types | |||||||||
|---|---|---|---|---|---|---|---|---|---|---|
| LCZ1 | LCZ2 | LCZ3 | LCZ4 | LCZ5 | LCZ6 | LCZ7 | LCZ8 | LCZ9 | Total | |
| Number | 12 | 203 | 213 | 489 | 2455 | 306 | 102 | 174 | 40 | 3994 |
| Area (km2) | 0.79 | 19.24 | 24.32 | 52.63 | 373.75 | 42.19 | 12.32 | 21.21 | 4.98 | 551.43 |
| Area Proportion (100%) | 0.12 | 2.90 | 3.67 | 7.94 | 56.37 | 6.36 | 1.86 | 3.20 | 0.75 | 83.16 |
| LCZA | LCZB | LCZC | LCZD | LCZE | LCZF | LCZG | Total | |||
| Number | 96 | 111 | 23 | 145 | 94 | 16 | 22 | 507 | ||
| Area (km2) | 19.45 | 21.21 | 7.07 | 26.77 | 13.33 | 3.95 | 19.87 | 111.65 | ||
| Area Proportion (100%) | 2.93 | 3.20 | 1.07 | 4.04 | 2.01 | 0.60 | 3.00 | 16.84 | ||
| LCZ | Spring | Summer | Autumn | Winter | ||||||||
|---|---|---|---|---|---|---|---|---|---|---|---|---|
| Mean | Max | Min | Mean | Max | Min | Mean | Max | Min | Mean | Max | Min | |
| LCZ1 | 28.93 | 32.32 | 25.57 | 33.82 | 36.34 | 31.74 | 31.51 | 34.01 | 29.50 | 10.37 | 12.10 | 8.31 |
| LCZ2 | 31.06 | 41.41 | 20.85 | 35.13 | 41.93 | 30.37 | 33.10 | 42.23 | 28.09 | 11.35 | 18.38 | 7.75 |
| LCZ3 | 30.14 | 40.57 | 17.59 | 34.59 | 41.43 | 30.09 | 32.43 | 41.25 | 25.52 | 10.95 | 16.61 | 3.77 |
| LCZ4 | 28.17 | 35.70 | 22.58 | 33.08 | 38.22 | 30.01 | 30.86 | 37.25 | 27.85 | 10.06 | 14.84 | 6.64 |
| LCZ5 | 29.45 | 46.14 | 19.59 | 33.90 | 45.40 | 29.35 | 31.95 | 47.96 | 27.00 | 10.67 | 19.39 | 2.43 |
| LCZ6 | 28.69 | 37.41 | 20.52 | 33.15 | 39.80 | 29.19 | 31.10 | 38.13 | 27.26 | 10.54 | 14.78 | 2.77 |
| LCZ7 | 27.15 | 31.74 | 23.10 | 32.08 | 35.39 | 29.72 | 29.96 | 33.97 | 27.80 | 9.86 | 12.35 | 8.60 |
| LCZ8 | 28.14 | 32.56 | 23.14 | 32.52 | 35.93 | 29.43 | 30.71 | 34.58 | 27.61 | 10.41 | 12.57 | 8.68 |
| LCZ9 | 27.58 | 31.33 | 23.39 | 31.85 | 35.12 | 29.55 | 30.02 | 33.55 | 27.36 | 10.47 | 12.24 | 8.87 |
| LCZA | 26.70 | 33.46 | 20.76 | 31.14 | 35.72 | 28.90 | 29.42 | 33.73 | 27.15 | 10.27 | 13.04 | 8.13 |
| LCZB | 27.32 | 34.68 | 21.35 | 31.50 | 36.87 | 28.80 | 29.79 | 35.56 | 27.03 | 10.51 | 13.32 | 8.22 |
| LCZC | 27.77 | 34.35 | 24.36 | 32.20 | 38.48 | 28.70 | 30.52 | 36.19 | 27.00 | 10.82 | 13.21 | 8.90 |
| LCZD | 27.90 | 35.00 | 19.95 | 32.57 | 36.89 | 29.53 | 30.44 | 35.08 | 26.28 | 10.27 | 14.15 | 6.64 |
| LCZE | 28.24 | 35.69 | 20.68 | 33.43 | 38.67 | 30.00 | 31.10 | 38.04 | 27.34 | 9.81 | 14.07 | 3.89 |
| LCZF | 28.97 | 33.44 | 22.32 | 34.21 | 36.32 | 31.23 | 30.80 | 34.34 | 28.13 | 10.44 | 11.99 | 8.22 |
| LCZG | 20.26 | 30.30 | 17.90 | 29.50 | 34.42 | 28.30 | 27.79 | 33.94 | 26.03 | 8.20 | 11.47 | 7.15 |
Disclaimer/Publisher’s Note: The statements, opinions and data contained in all publications are solely those of the individual author(s) and contributor(s) and not of MDPI and/or the editor(s). MDPI and/or the editor(s) disclaim responsibility for any injury to people or property resulting from any ideas, methods, instructions or products referred to in the content. |
© 2024 by the authors. Licensee MDPI, Basel, Switzerland. This article is an open access article distributed under the terms and conditions of the Creative Commons Attribution (CC BY) license (https://creativecommons.org/licenses/by/4.0/).
Share and Cite
Yang, L.; Yang, C.; Zhou, W.; Chen, X.; Wang, C.; Liu, L. Mapping the Spatial and Seasonal Details of Heat Health Risks in Different Local Climate Zones: A Case Study of Shanghai, China. Remote Sens. 2024, 16, 3513. https://doi.org/10.3390/rs16183513
Yang L, Yang C, Zhou W, Chen X, Wang C, Liu L. Mapping the Spatial and Seasonal Details of Heat Health Risks in Different Local Climate Zones: A Case Study of Shanghai, China. Remote Sensing. 2024; 16(18):3513. https://doi.org/10.3390/rs16183513
Chicago/Turabian StyleYang, Lilong, Chaobin Yang, Weiqi Zhou, Xueye Chen, Chao Wang, and Lifeng Liu. 2024. "Mapping the Spatial and Seasonal Details of Heat Health Risks in Different Local Climate Zones: A Case Study of Shanghai, China" Remote Sensing 16, no. 18: 3513. https://doi.org/10.3390/rs16183513