
Monitoring Temporal Sandbar and Shoreline Changes at Saint Louis, Senegal: Using Sentinel-2 Imagery (2015–2022)

 , , , ,
Abstract
:1. Introduction
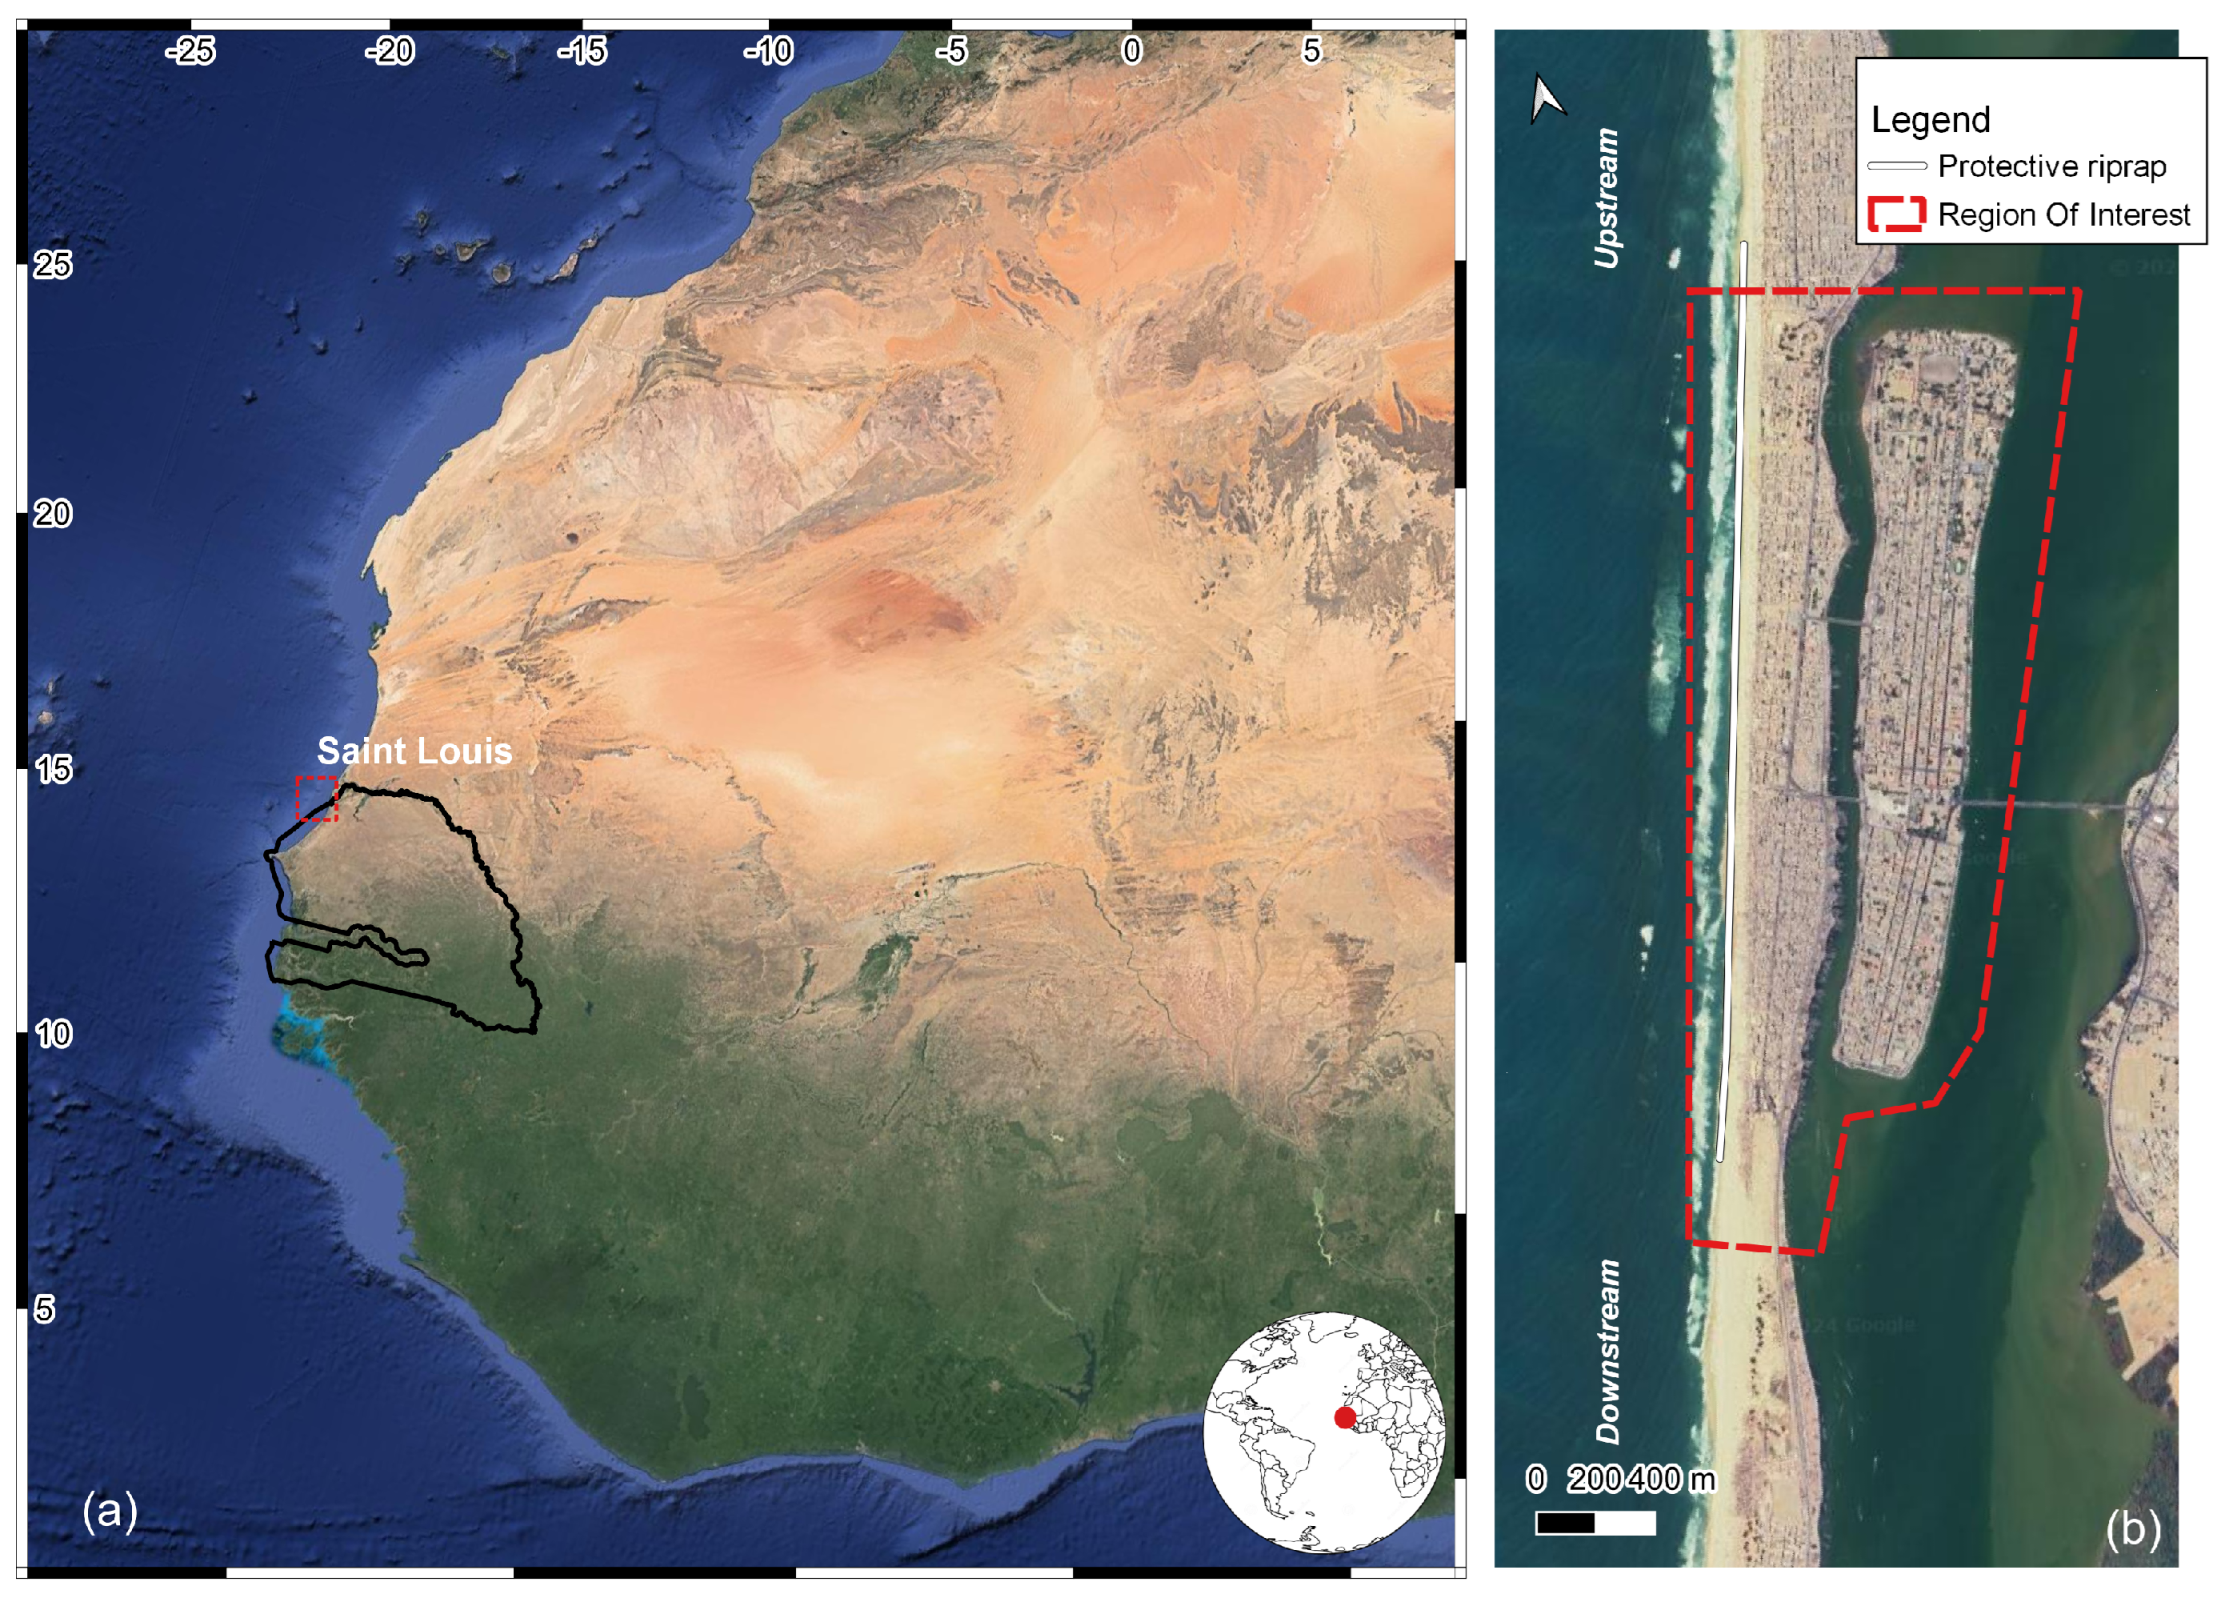
2. Study Site
3. Methods and Data
3.1. Satellite Imagery
3.2. Sandbar and Shoreline Position Extraction
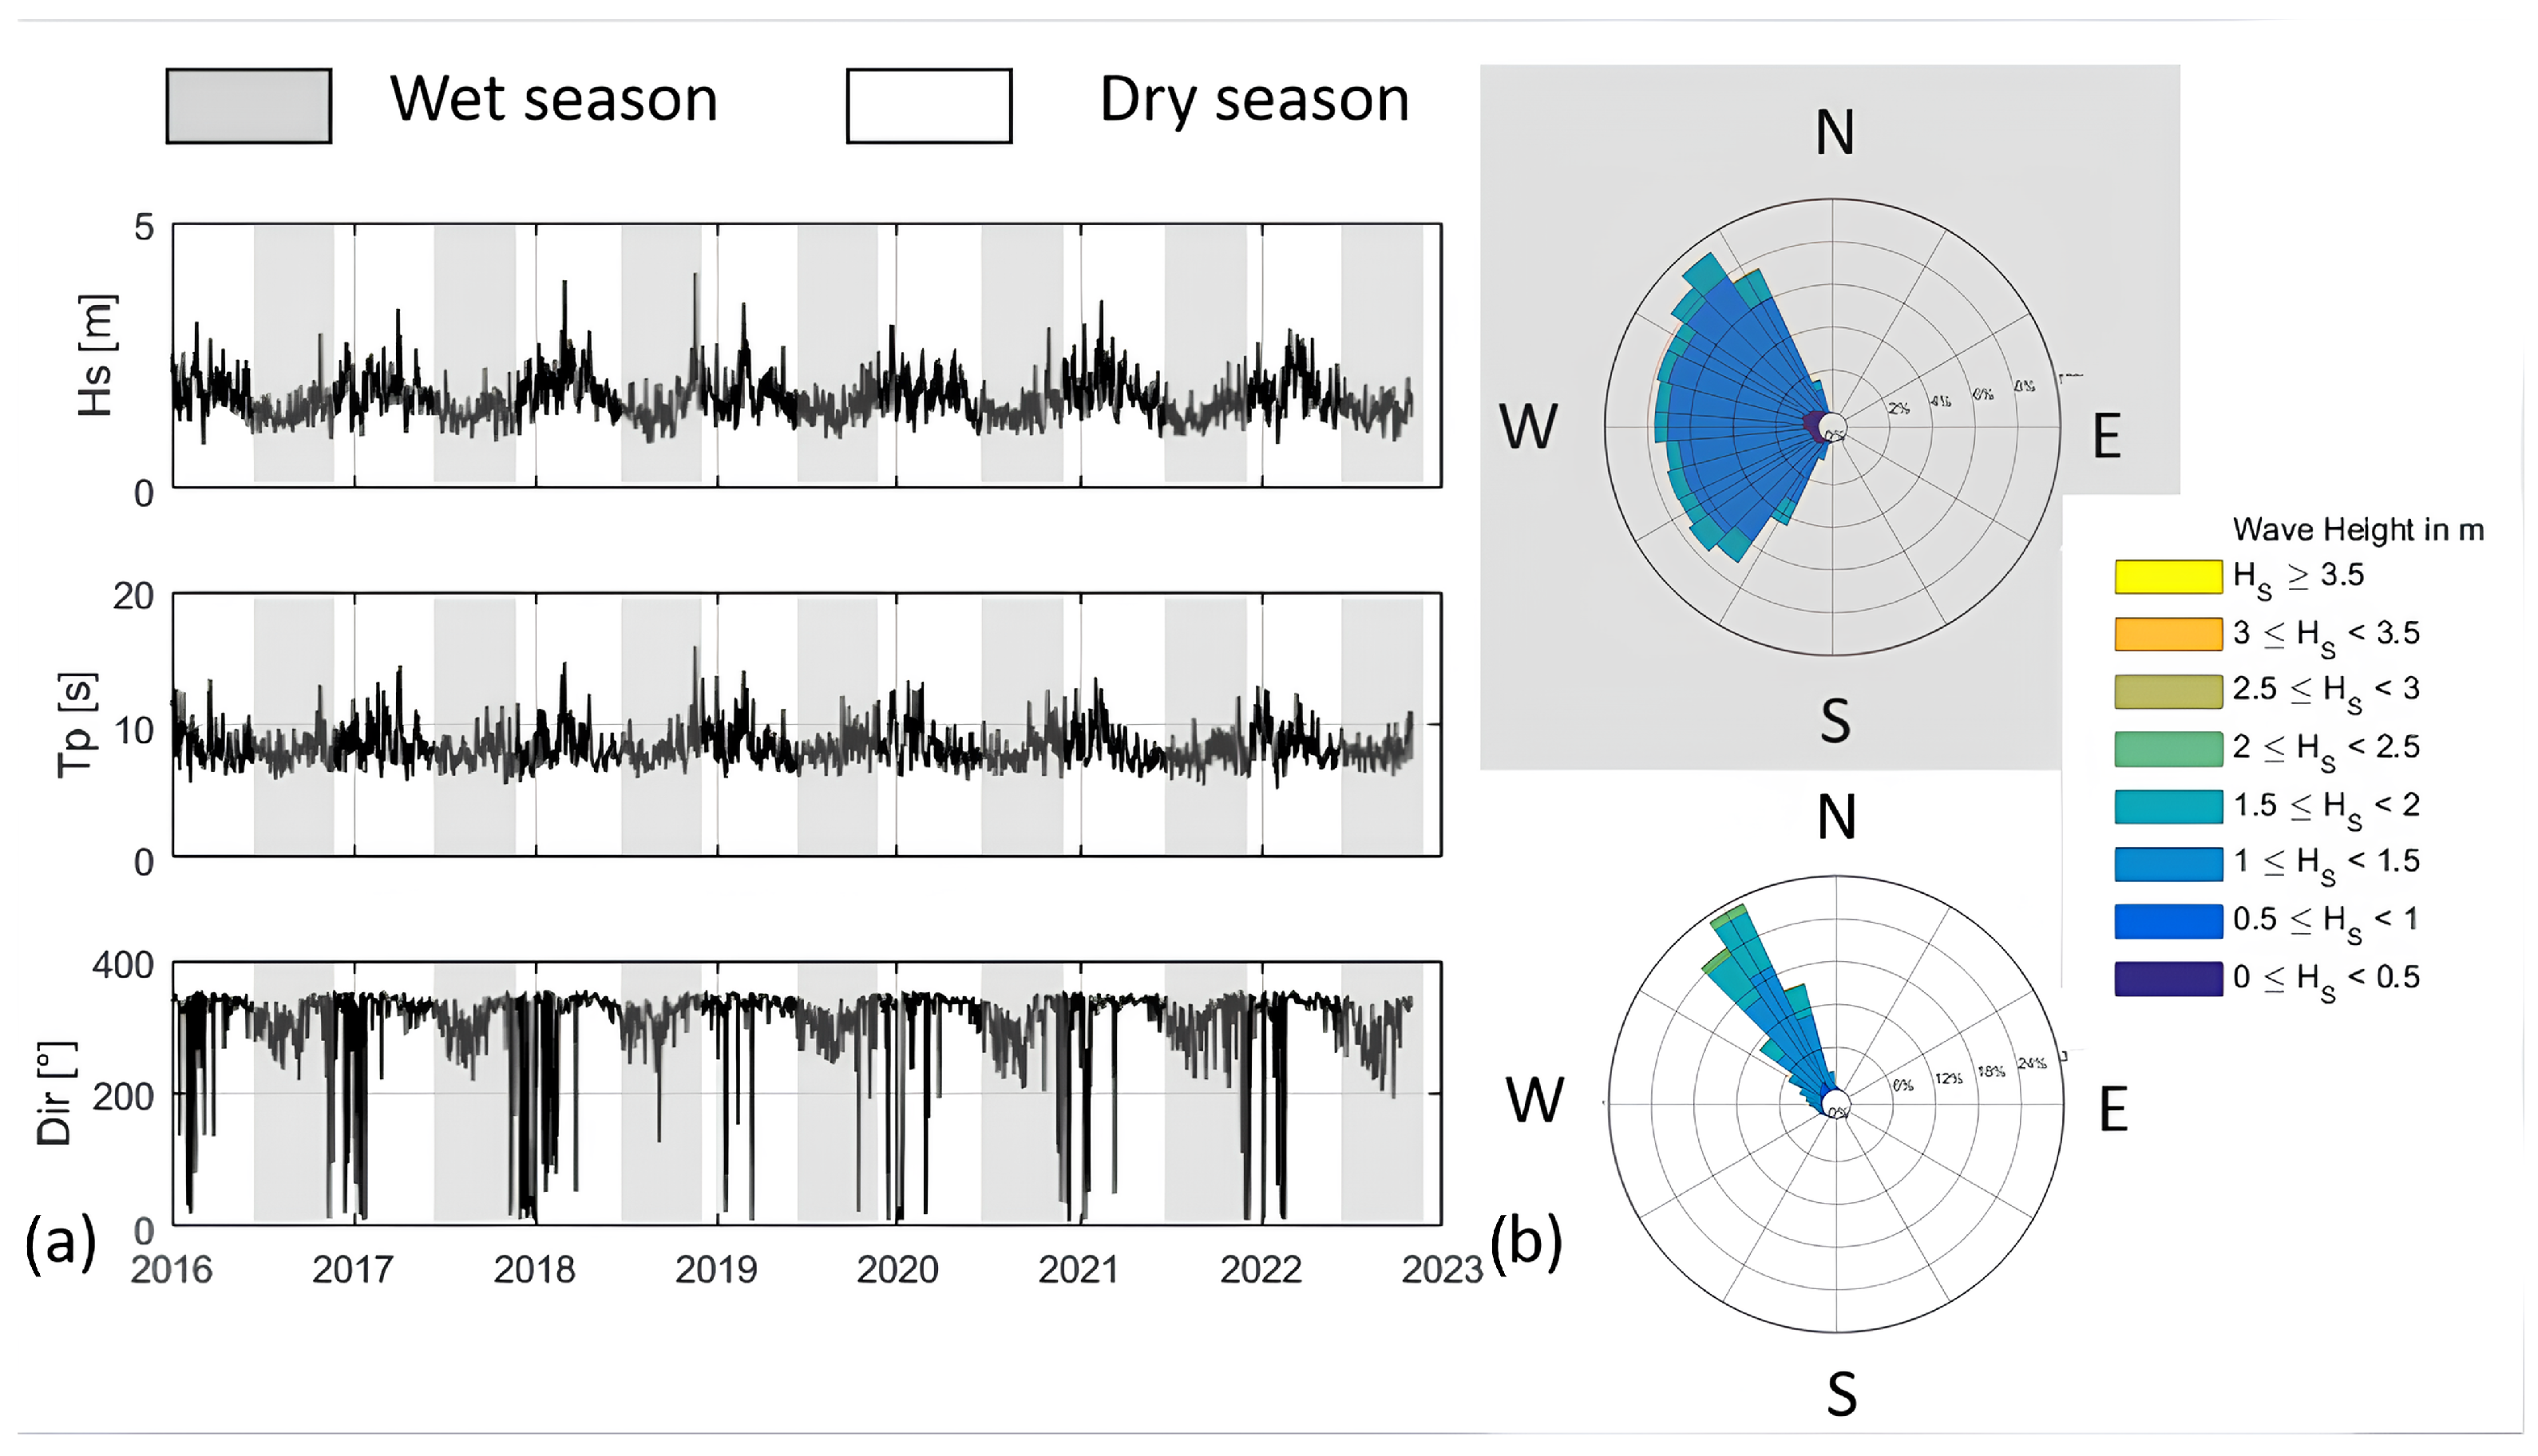
3.3. Ground Truth Validation Dataset and Wave Reanalysis
4. Results
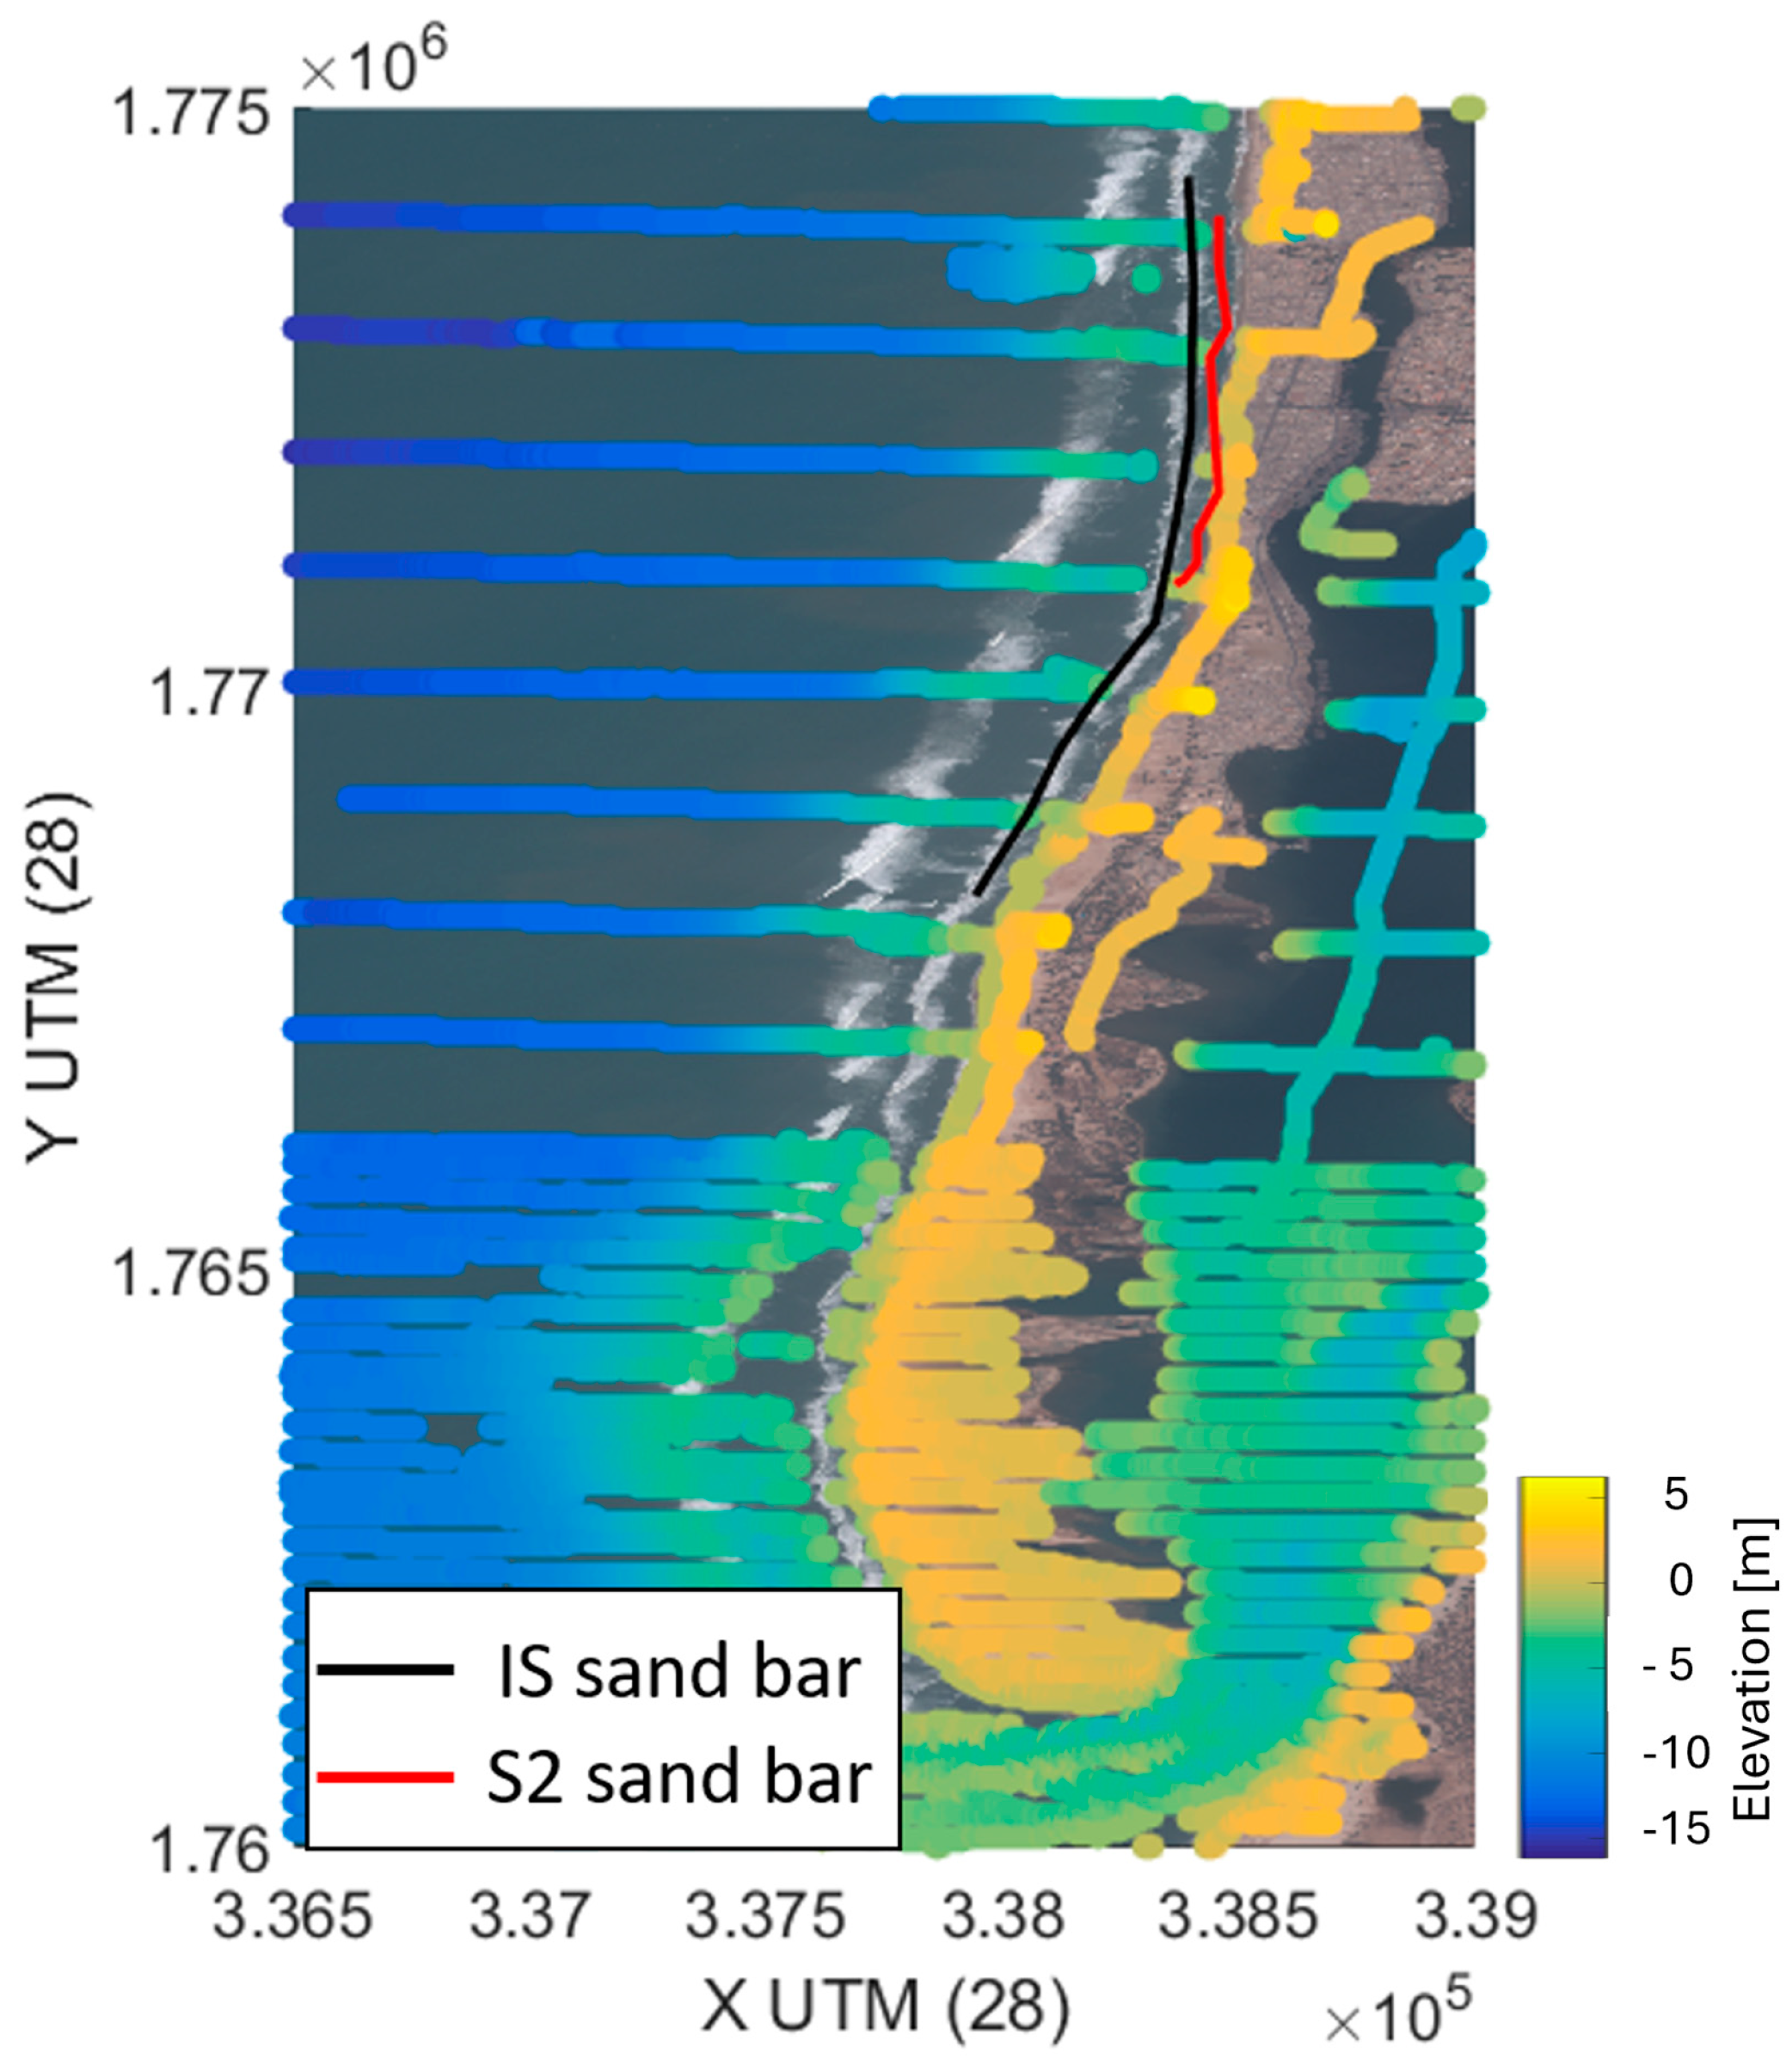
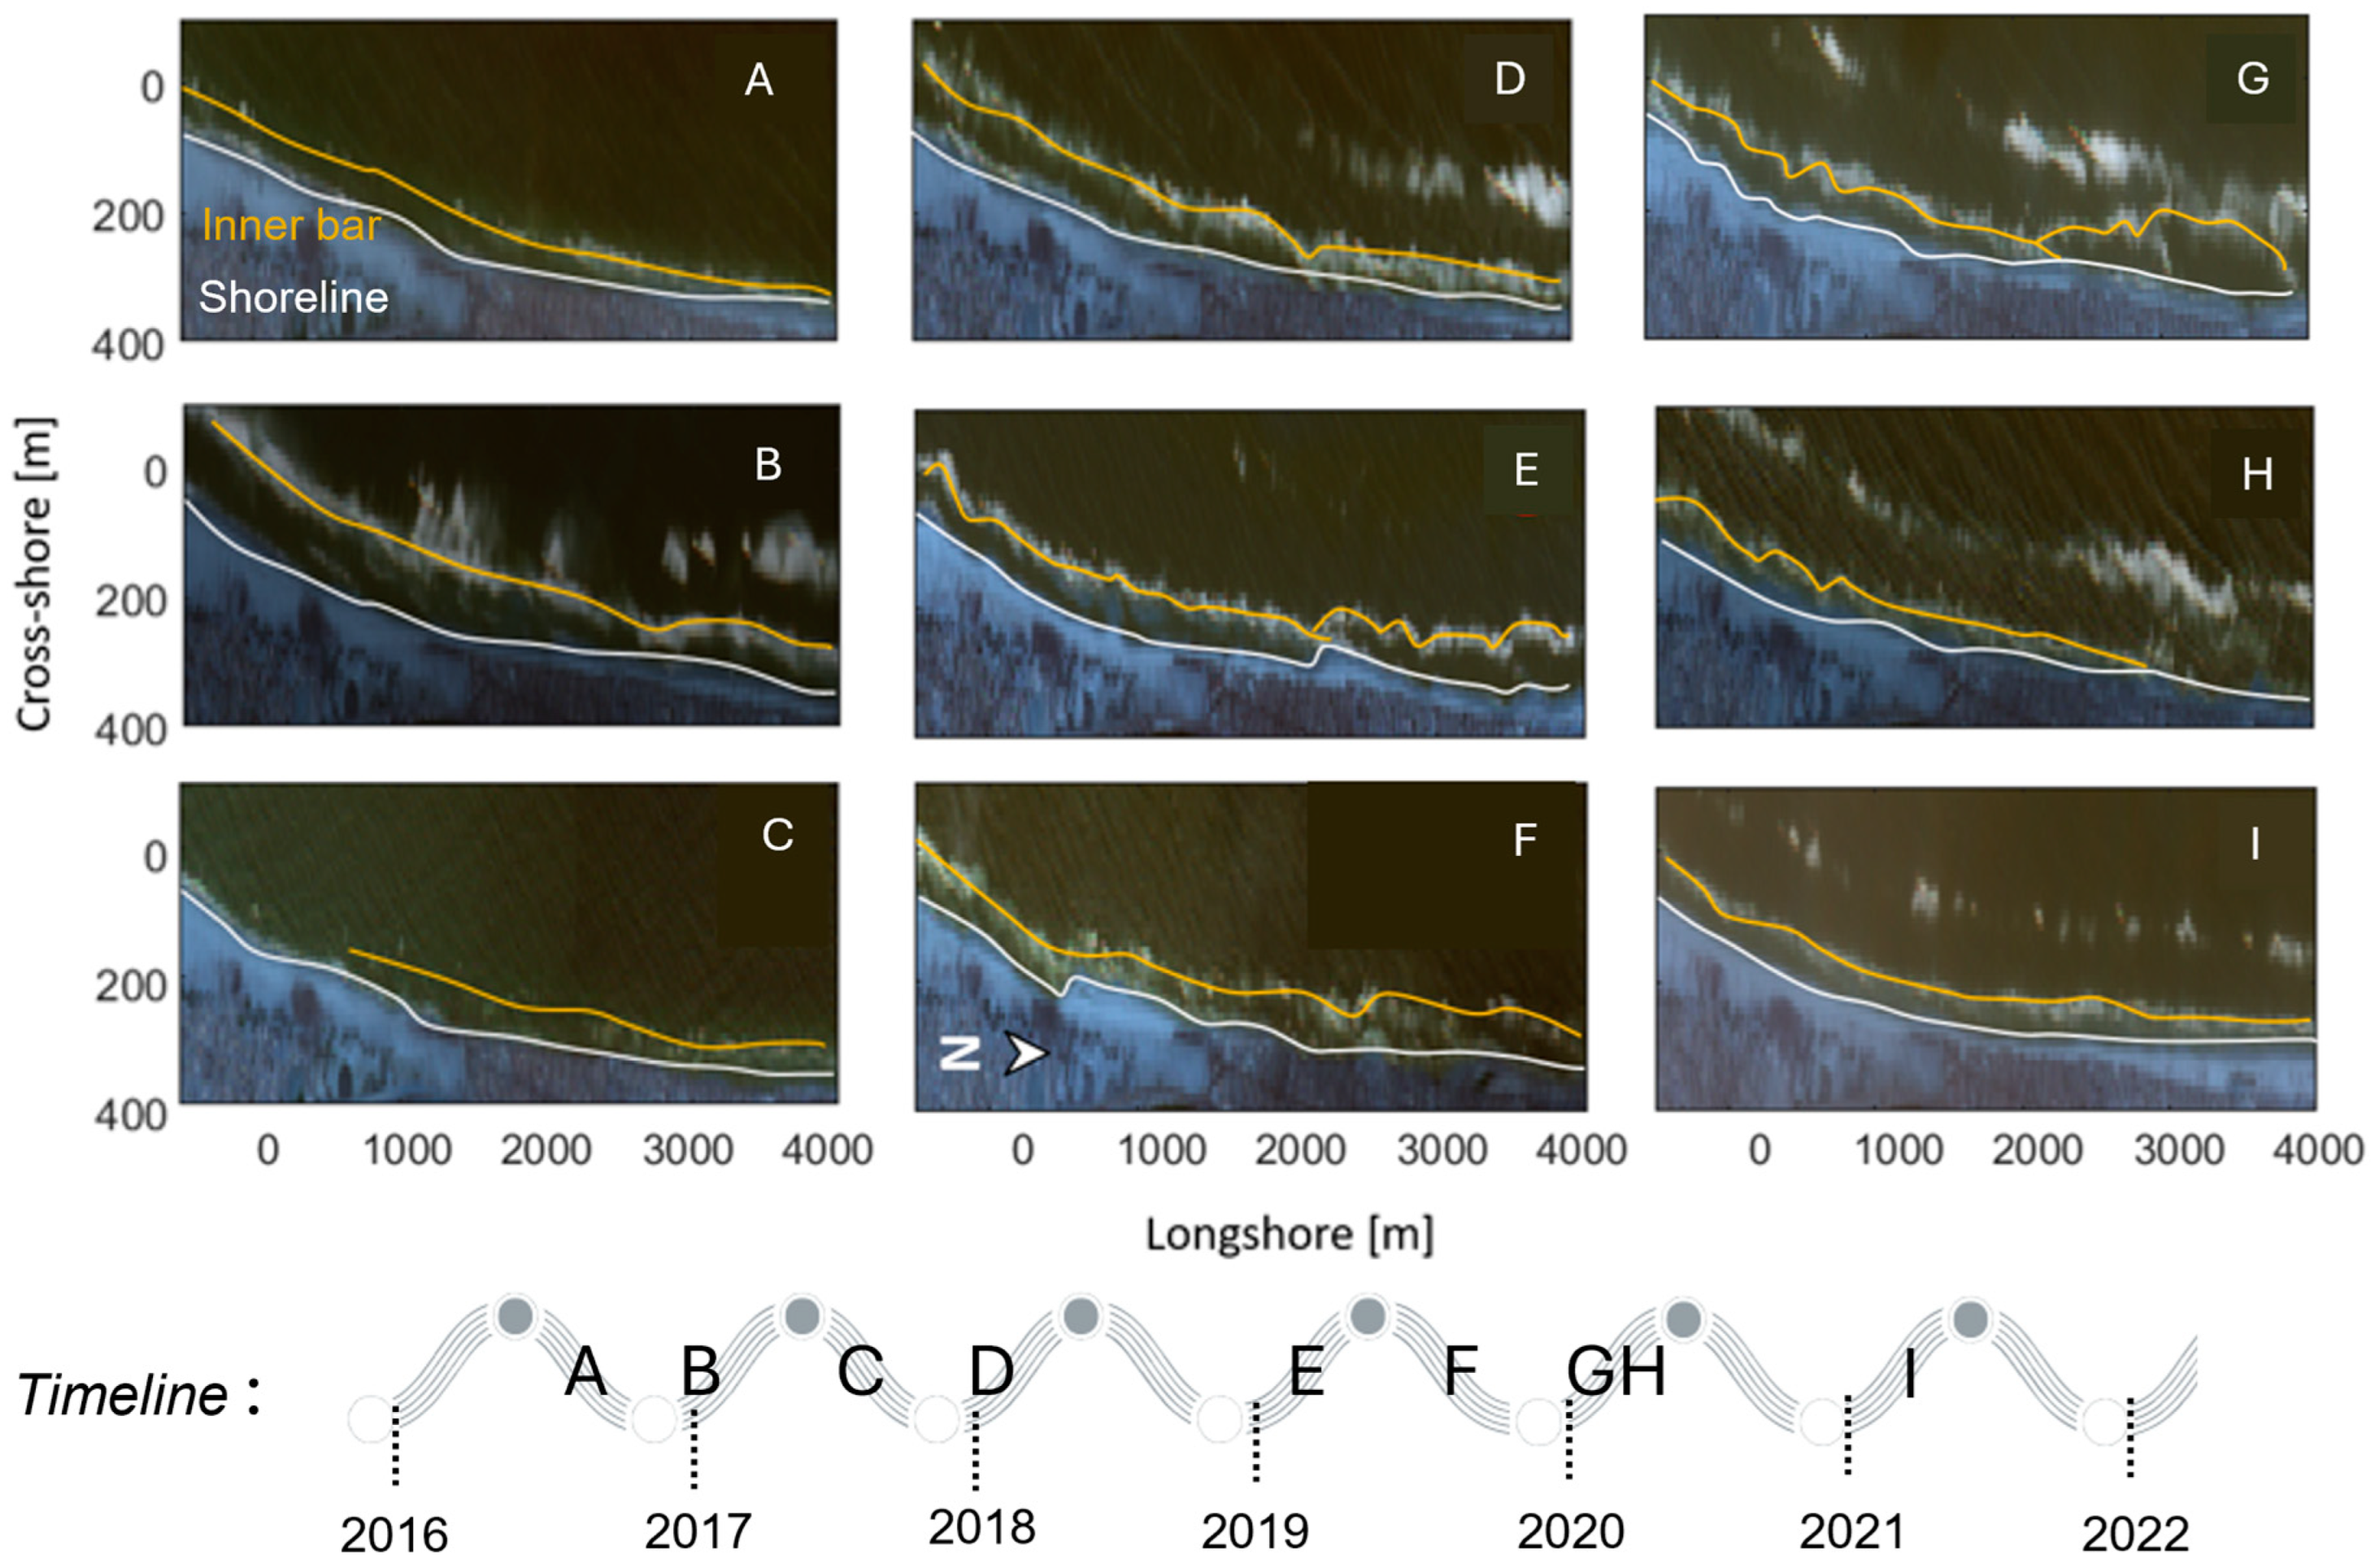
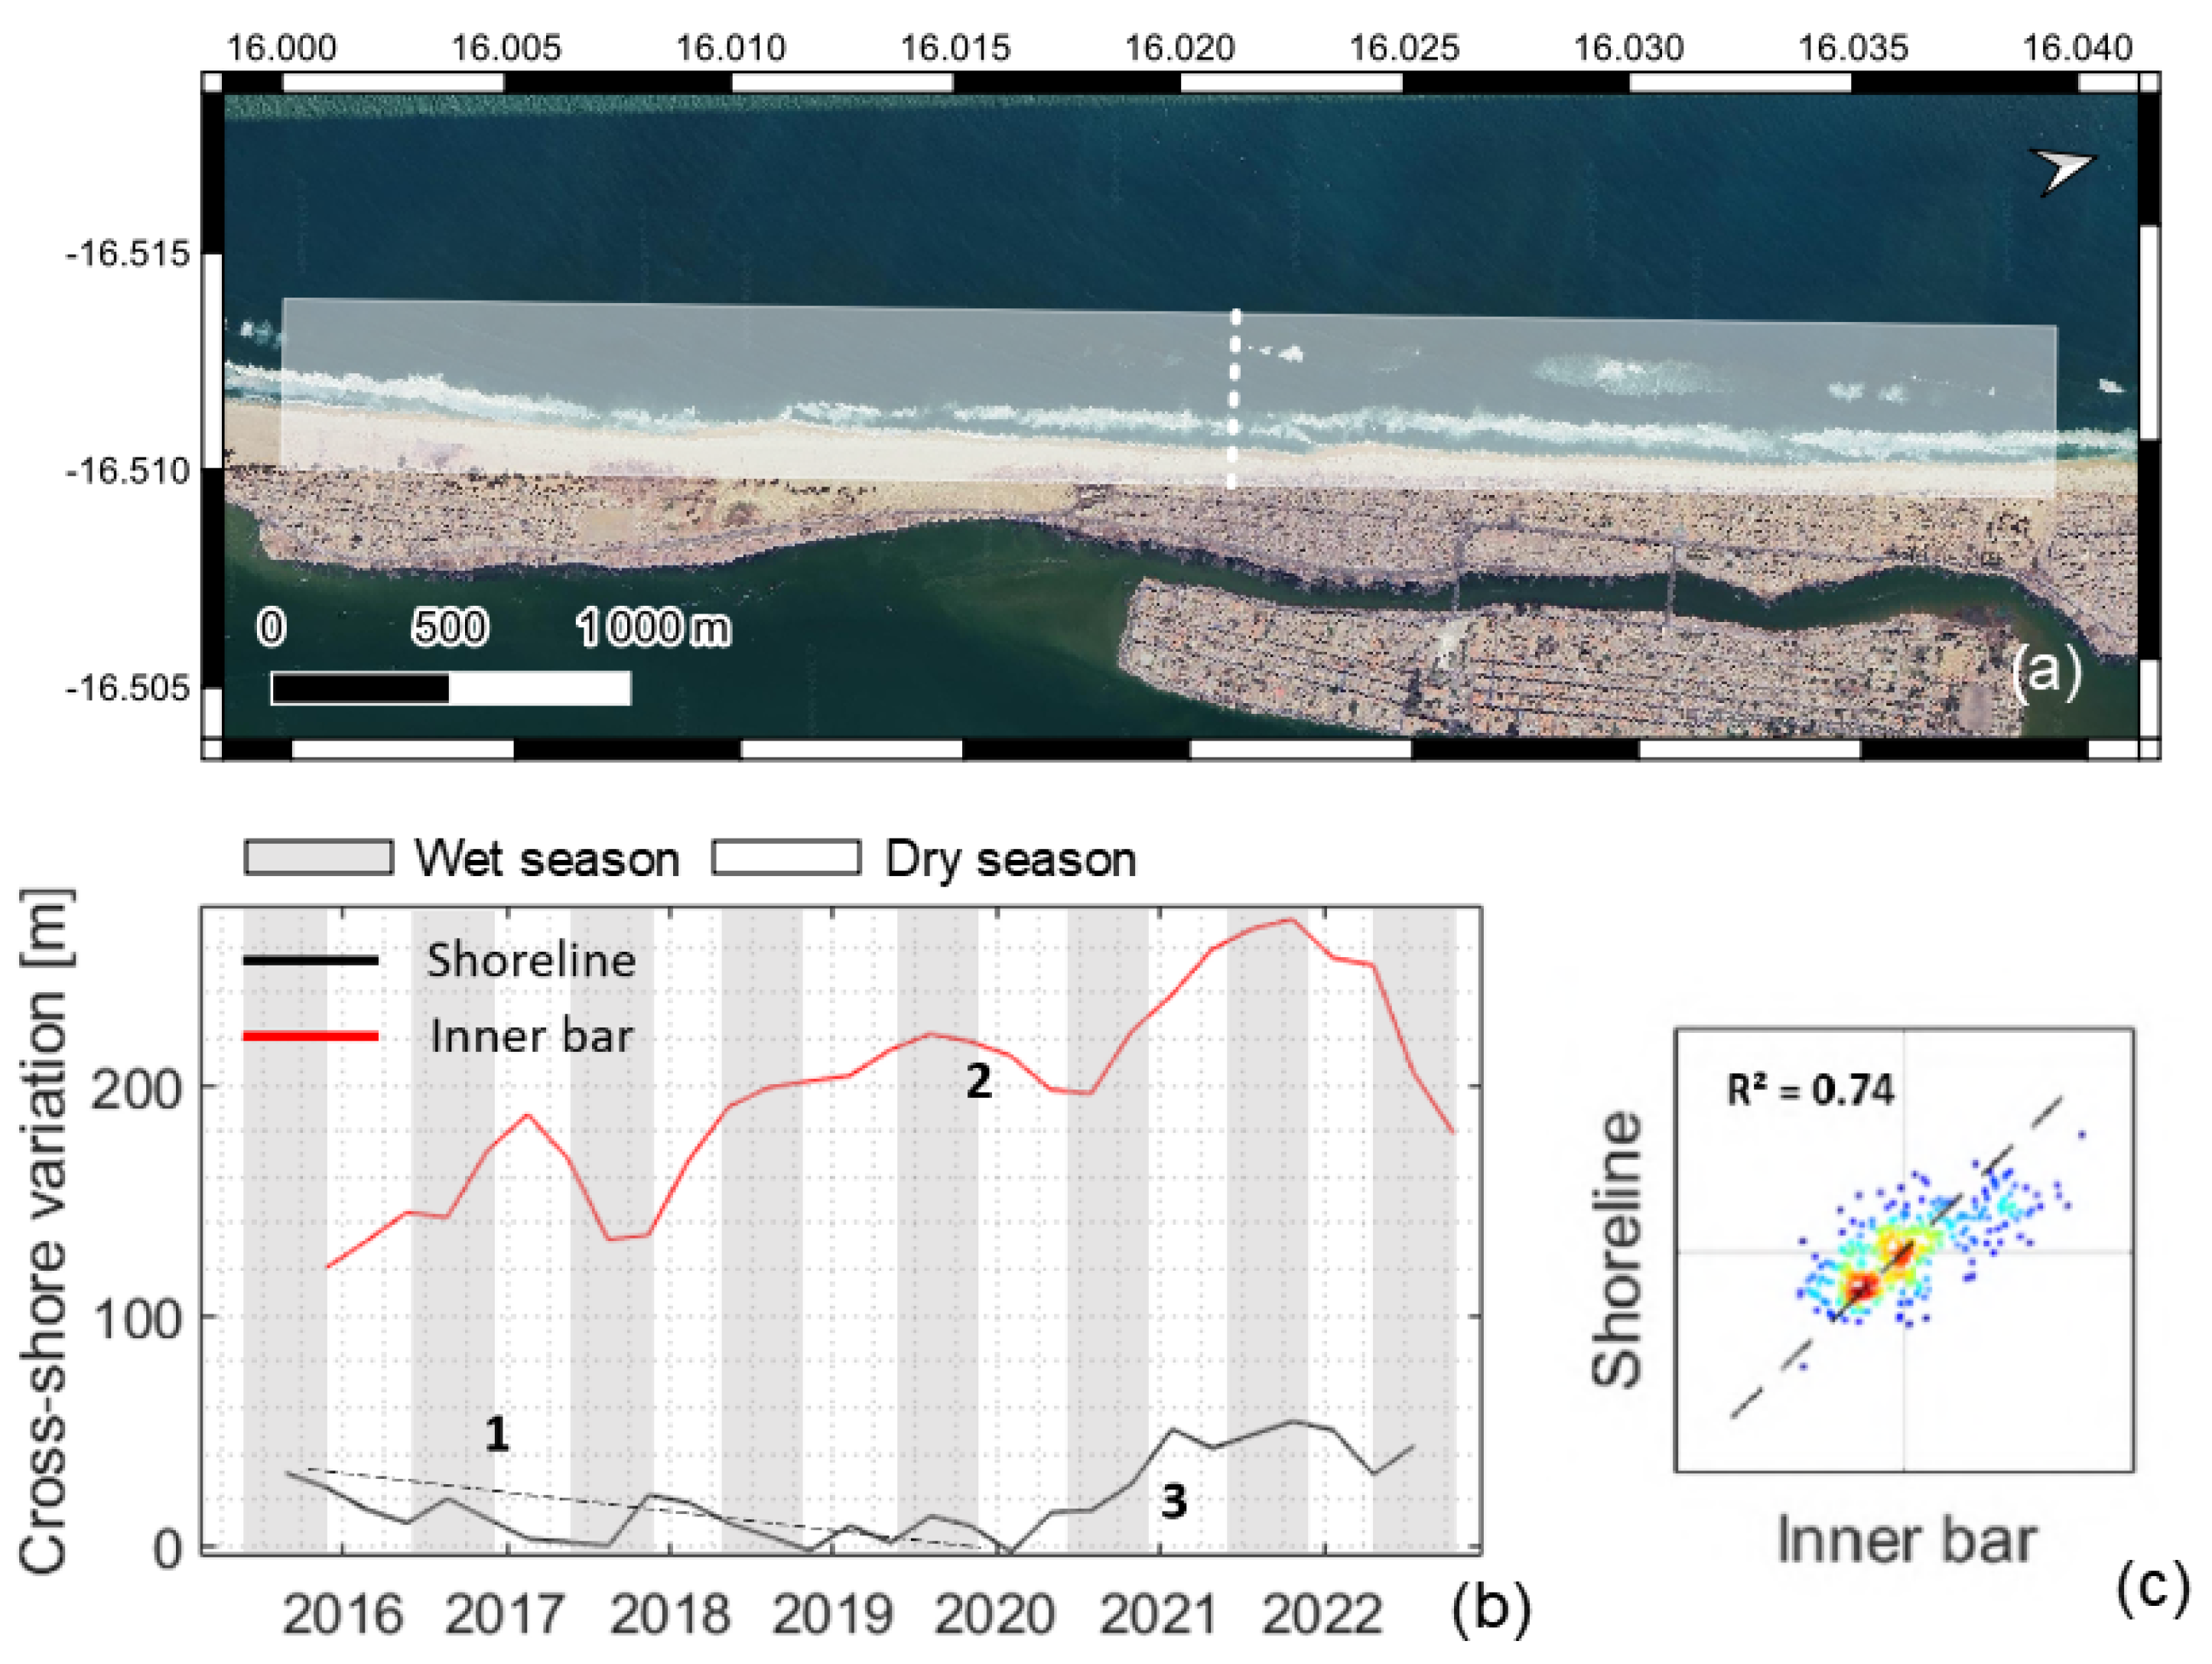
4.1. The Sandbar–Shoreline Coupled System at Saint Louis: Seasonal Cycle and Trend
4.2. Shoreward Accretion Wave Event: Welding of the Sandbar to the Beach
5. Limitations
6. Discussion
7. Conclusions
Author Contributions
Funding
Data Availability Statement
Acknowledgments
Conflicts of Interest
Abbreviations
| GEE | Google Earth Engine |
| RGB | Red–Green–Blue |
| SW | sandbar welding |
| STT | sandbar to terrace bar transition |
| TST | terrace bar to sandbar transition |
| SS | sandbar splitting |
| NOM | net offshore migration |
References
- Van Enckevort, I.; Ruessink, B. Video observations of nearshore bar behaviour. Part 1: Alongshore uniform variability. Cont. Shelf Res. 2003, 23, 501–512. [Google Scholar] [CrossRef]
- Van Enckevort, I.; Ruessink, B.; Coco, G.; Suzuki, K.; Turner, I.; Plant, N.G.; Holman, R.A. Observations of nearshore crescentic sandbars. J. Geophys. Res. Ocean. 2004, 109. [Google Scholar] [CrossRef]
- Castelle, B.; Bourget, J.; Molnar, N.; Strauss, D.; Deschamps, S.; Tomlinson, R. Dynamics of a wave-dominated tidal inlet and influence on adjacent beaches, Currumbin Creek, Gold Coast, Australia. Coast. Eng. 2007, 54, 77–90. [Google Scholar] [CrossRef]
- Ribas, F.; Falqués, A.; Garnier, R. Nearshore sand bars. In Atlas of Bedforms in the Western Mediterranean; Springer: Berlin, Germany, 2017; pp. 73–79. [Google Scholar]
- Wright, L.D.; Short, A.D. Morphodynamic variability of surf zones and beaches: A synthesis. Mar. Geol. 1984, 56, 93–118. [Google Scholar] [CrossRef]
- Lippmann, T.C.; Holman, R.A. Quantification of sand bar morphology: A video technique based on wave dissipation. J. Geophys. Res. Ocean. 1989, 94, 995–1011. [Google Scholar] [CrossRef]
- Lippmann, T.; Holman, R. The spatial and temporal variability of sand bar morphology. J. Geophys. Res. Ocean. 1990, 95, 11575–11590. [Google Scholar] [CrossRef]
- Stive, M.J.; Aarninkhof, S.G.; Hamm, L.; Hanson, H.; Larson, M.; Wijnberg, K.M.; Nicholls, R.J.; Capobianco, M. Variability of shore and shoreline evolution. Coast. Eng. 2002, 47, 211–235. [Google Scholar] [CrossRef]
- Ruessink, B.; Kuriyama, Y.; Reniers, A.; Roelvink, J.; Walstra, D. Modeling cross-shore sandbar behavior on the timescale of weeks. J. Geophys. Res. Earth Surf. 2007, 112. [Google Scholar] [CrossRef]
- Castelle, B.; Ruessink, B.; Bonneton, P.; Marieu, V.; Bruneau, N.; Price, T.D. Coupling mechanisms in double sandbar systems. Part 1: Patterns and physical explanation. Earth Surf. Process. Landforms 2010, 35, 476–486. [Google Scholar] [CrossRef]
- Bouvier, C.; Castelle, B.; Balouin, Y. Modeling the impact of the implementation of a submerged structure on surf zone sandbar dynamics. J. Mar. Sci. Eng. 2019, 7, 117. [Google Scholar] [CrossRef]
- Ruessink, B.; Pape, L.; Turner, I. Daily to interannual cross-shore sandbar migration: Observations from a multiple sandbar system. Cont. Shelf Res. 2009, 29, 1663–1677. [Google Scholar] [CrossRef]
- Almar, R.; Castelle, B.; Ruessink, B.; Sénéchal, N.; Bonneton, P.; Marieu, V. Two-and three-dimensional double-sandbar system behaviour under intense wave forcing and a meso–macro tidal range. Cont. Shelf Res. 2010, 30, 781–792. [Google Scholar] [CrossRef]
- Dubarbier, B.; Castelle, B.; Marieu, V.; Ruessink, G. Process-based modeling of cross-shore sandbar behavior. Coast. Eng. 2015, 95, 35–50. [Google Scholar] [CrossRef]
- Aleman, N.; Certain, R.; Robin, N.; Barusseau, J.P. Morphodynamics of slightly oblique nearshore bars and their relationship with the cycle of net offshore migration. Mar. Geol. 2017, 392, 41–52. [Google Scholar] [CrossRef]
- Shand, R.D. Relationships between episodes of bar switching, cross-shore bar migration and outer bar degeneration at Wanganui, New Zealand. J. Coast. Res. 2003, 19, 157–170. [Google Scholar]
- Melet, A.; Teatini, P.; Le Cozannet, G.; Jamet, C.; Conversi, A.; Benveniste, J.; Almar, R. Earth Observations for Monitoring Marine Coastal Hazards and Their Drivers. Surv. Geophys. 2020, 41, 1489–1534. [Google Scholar] [CrossRef]
- Benveniste, J.; Cazenave, A.; Vignudelli, S.; Fenoglio-Marc, L.; Shah, R.; Almar, R.; Andersen, O.; Birol, F.; Bonnefond, P.; Bouffard, J.; et al. Requirements for a Coastal Hazards Observing System. Front. Mar. Sci. 2019, 6, 348. [Google Scholar] [CrossRef]
- Salameh, E.; Frappart, F.; Almar, R.; Baptista, P.; Heygster, G.; Lubac, B.; Raucoules, D.; Almeida, L.P.; Bergsma, E.W.J.; Capo, S.; et al. Monitoring Beach Topography and Nearshore Bathymetry Using Spaceborne Remote Sensing: A Review. Remote Sens. 2019, 11, 2212. [Google Scholar] [CrossRef]
- Bergsma, E.; Sadio, M.; Sakho, I.; Almar, R.; Garlan, T.; Gosselin, M.; Gauduin, H. Sand-spit evolution and inlet dynamics derived from space-borne optical imagery: Is the Senegal-river inlet closing? J. Coast. Res. 2020, 95, 372–376. [Google Scholar] [CrossRef]
- Ndour, A.; Ba, K.; Almar, A.; Almeida, P.; Sall, M.; Diedhiou, P.; Floc’h, F.; Daly, C.; Grandjean, P.; Boivin, J.P.; et al. On the natural and anthropogenic drivers of the Senegalese (West Africa) low coast evolution: Saint Louis Beach 2016 COASTVAR experiment and 3D modeling of short term coastal protection measures. J. Coast. Res. 2020, 95, 583–587. [Google Scholar] [CrossRef]
- Sadio, M.; Anthony, E.J.; Diaw, A.T.; Dussouillez, P.; Fleury, J.T.; Kane, A.; Almar, R.; Kestenare, E. Shoreline Changes on the Wave-Influenced Senegal River Delta, West Africa: The Roles of Natural Processes and Human Interventions. Water 2017, 9, 357. [Google Scholar] [CrossRef]
- Valentini, N.; Saponieri, A.; Molfetta, M.G.; Damiani, L. New algorithms for shoreline monitoring from coastal video systems. Earth Sci. Inform. 2017, 10, 495–506. [Google Scholar] [CrossRef]
- Plant, N.G.; Aarninkhof, S.G.; Turner, I.L.; Kingston, K.S. The performance of shoreline detection models applied to video imagery. J. Coast. Res. 2007, 23, 658–670. [Google Scholar] [CrossRef]
- Luijendijk, A.; Hagenaars, G.; Ranasinghe, R.; Baart, F.; Donchyts, G.; Aarninkhof, S. The state of the world’s beaches. Sci. Rep. 2018, 8, 6641. [Google Scholar] [CrossRef]
- Vos, K.; Splinter, K.D.; Harley, M.D.; Simmons, J.A.; Turner, I.L. CoastSat: A Google Earth Engine-enabled Python toolkit to extract shorelines from publicly available satellite imagery. Environ. Model. Softw. 2019, 122, 104528. [Google Scholar] [CrossRef]
- Cabezas-Rabadán, C.; Almonacid-Caballer, J.; Benavente, J.; Castelle, B.; Del Río, L.; Montes, J.; Palomar-Vázquez, J.; Pardo-Pascual, J.E. Assessing Satellite-Derived Shoreline Detection on a Mesotidal Dissipative Beach. Remote Sens. 2024, 16, 617. [Google Scholar] [CrossRef]
- Bergsma, E.W.; Klotz, A.N.; Artigues, S.; Graffin, M.; Prenowitz, A.; Delvit, J.M.; Almar, R. Shoreliner: A Sub-Pixel Coastal Waterline Extraction Pipeline for Multi-Spectral Satellite Optical Imagery. Remote Sens. 2024, 16, 2795. [Google Scholar] [CrossRef]
- Almeida, L.P.; de Oliveira, I.E.; Lyra, R.; Dazzi, R.L.S.; Martins, V.G.; da Fontoura Klein, A.H. Coastal analyst system from space imagery engine (CASSIE): Shoreline management module. Environ. Model. Softw. 2021, 140, 105033. [Google Scholar] [CrossRef]
- Mentaschi, L.; Vousdoukas, M.I.; Pekel, J.F.; Voukouvalas, E.; Feyen, L. Global long-term observations of coastal erosion and accretion. Sci. Rep. 2018, 8, 12876. [Google Scholar] [CrossRef]
- Pardo-Pascual, J.E.; Sánchez-García, E.; Almonacid-Caballer, J.; Palomar-Vázquez, J.M.; Priego De Los Santos, E.; Fernández-Sarría, A.; Balaguer-Beser, Á. Assessing the accuracy of automatically extracted shorelines on microtidal beaches from Landsat 7, Landsat 8 and Sentinel-2 imagery. Remote Sens. 2018, 10, 326. [Google Scholar] [CrossRef]
- Holman, R.; Stanley, J. The history and technical capabilities of Argus. Coast. Eng. 2007, 54, 477–491. [Google Scholar] [CrossRef]
- Lippmann, T.C.; Smith, G.M. Shallow Surveying in Hazardous Waters. In Proceedings of the U.S. Hydrographic Conference, Norfolk, VA, USA, 11–14 May 2009; pp. 1–12. [Google Scholar]
- Almar, R.; Bonneton, P.; Senechal, N.; Roelvink, D. Wave celerity from video imaging: A new method. In Coastal Engineering 2008: (In 5 Volumes); World Scientific: Singapore, 2009; pp. 661–673. [Google Scholar]
- Turner, I.L.; Harley, M.D.; Almar, R.; Bergsma, E.W.J. Satellite optical imagery in Coastal Engineering. Coast. Eng. 2021, 167, 103919. [Google Scholar] [CrossRef]
- Almar, R.; Stieglitz, T.; Addo, K.A.; Ba, K.; Ondoa, G.A.; Bergsma, E.W.; Bonou, F.; Dada, O.; Angnuureng, D.; Arino, O. Coastal zone changes in West Africa: Challenges and opportunities for satellite earth observations. Surv. Geophys. 2023, 44, 249–275. [Google Scholar] [CrossRef]
- Lafon, V.; Apoluceno, D.D.M.; Dupuis, H.; Michel, D.; Howa, H.; Froidefond, J.M. Morphodynamics of nearshore rhythmic sandbars in a mixed-energy environment (SW France): I. Mapping beach changes using visible satellite imagery. Estuar. Coast. Shelf Sci. 2004, 61, 289–299. [Google Scholar] [CrossRef]
- Zhang, X.; Wu, C.; Zhang, Y.; Hu, R.; Yang, Z. Using free satellite imagery to study the long-term evolution of intertidal bar systems. Coast. Eng. 2022, 174, 104123. [Google Scholar] [CrossRef]
- Do, J.D.; Jin, J.Y.; Jeong, W.M.; Lee, B.; Kim, C.H.; Chang, Y.S. Observation of nearshore crescentic sandbar formation during storm wave conditions using satellite images and video monitoring data. Mar. Geol. 2021, 442, 106661. [Google Scholar] [CrossRef]
- Janušaitė, R.; Jukna, L.; Jarmalavičius, D.; Pupienis, D.; Žilinskas, G. A novel GIS-based approach for automated detection of nearshore sandbar morphological characteristics in optical satellite imagery. Remote Sens. 2021, 13, 2233. [Google Scholar] [CrossRef]
- Tătui, F.; Constantin, S. Nearshore sandbars crest position dynamics analysed based on Earth Observation data. Remote Sens. Environ. 2020, 237, 111555. [Google Scholar] [CrossRef]
- Davidson, M.; Van Koningsveld, M.; de Kruif, A.; Rawson, J.; Holman, R.; Lamberti, A.; Medina, R.; Kroon, A.; Aarninkhof, S. The CoastView project: Developing video-derived Coastal State Indicators in support of coastal zone management. Coast. Eng. 2007, 54, 463–475. [Google Scholar] [CrossRef]
- Ndour, A.; Laïbi, R.A.; Sadio, M.; Degbe, C.G.; Diaw, A.T.; Oyédé, L.M.; Anthony, E.J.; Dussouillez, P.; Sambou, H.; hadji Balla Dièye, E. Management strategies for coastal erosion problems in west Africa: Analysis, issues, and constraints drawn from the examples of Senegal and Benin. Ocean. Coast. Manag. 2018, 156, 92–106. [Google Scholar] [CrossRef]
- Cisse, C.O.T.; Brempong, E.; Taveneau, A.; Almar, R.; Sy, B.A.; Angnuureng, D.B. Extreme coastal water levels with potential flooding risk at the low-lying Saint Louis historic city, Senegal (West Africa). Front. Mar. Sci. 2022, 9, 993644. [Google Scholar] [CrossRef]
- Almar, R.; Kestenare, E.; Boucharel, J. On the key influence of remote climate variability from Tropical Cyclones, North and South Atlantic mid-latitude storms on the Senegalese coast (West Africa). Environ. Res. Commun. 2019, 1, 071001. [Google Scholar] [CrossRef]
- Anthony, E. Patterns of Sand Spit Development and Their Management Implications on Deltaic, Drift-Aligned Coasts: The Cases of the Senegal and Volta River Delta Spits, West Africa. In Sand and Gravel Spits; Randazzo, G., Jackson, D., Cooper, J., Eds.; Coastal Research Library; Springer: Cham, Switzerland, 2015; pp. 21–36. [Google Scholar]
- Taveneau, A.; Almar, R.; Bergsma, E.W.J.; Sy, B.A.; Ndour, A.; Sadio, M.; Garlan, T. Observing and Predicting Coastal Erosion at the Langue de Barbarie Sand Spit around Saint Louis (Senegal, West Africa) through Satellite-Derived Digital Elevation Model and Shoreline. Remote Sens. 2021, 13, 2454. [Google Scholar] [CrossRef]
- Rodríguez, S.; Alonso Bilbao, I.; Sánchez García, M.J.; Casamayor Font, M.; García Weil, L.F.; Sy, B.; Sy, A.; Faye, C. Morphodynamic study of an artificial inlet in Langue de Barbarie (Senegal) from 2003 to 2014 using Landsat images. In Proceedings of the IV Congress of Marine Sciences, Las Palmas de Gran Canaria, Spain, 11–13 June 2014. [Google Scholar]
- Dean, R.; Dalrymple, R. Long-term processes. In Coastal Processes with Engineering Applications; Cambridge University Press: Cambridge, UK, 2001; pp. 35–70. [Google Scholar]
- Aubrey, D.; Gaines, A. Rapid formation and degradation of barrier spits in areas with low rates of littoral drift. Mar. Geol. 1982, 49, 257–277. [Google Scholar] [CrossRef]
- Bergsma, E.W.; Almar, R. Coastal coverage of ESA’ Sentinel 2 mission. Adv. Space Res. 2020, 65, 2636–2644. [Google Scholar] [CrossRef]
- Van Enckevort, I.; Ruessink, B. Effect of hydrodynamics and bathymetry on video estimates of nearshore sandbar position. J. Geophys. Res. Ocean. 2001, 106, 16969–16979. [Google Scholar] [CrossRef]
- Pape, L.; Ruessink, B. Multivariate analysis of nonlinearity in sandbar behavior. Nonlinear Process. Geophys. 2008, 15, 145–158. [Google Scholar] [CrossRef]
- Hersbach, H.; Bell, B.; Berrisford, P.; Hirahara, S.; Horányi, A.; Muñoz-Sabater, J.; Nicolas, J.; Peubey, C.; Radu, R.; Schepers, D.; et al. The ERA5 global reanalysis. Q. J. R. Meteorol. Soc. 2020, 146, 1999–2049. [Google Scholar] [CrossRef]
- Pereira, D. Wind Rose: MATLAB Central File Exchange. Available online: https://fr.mathworks.com/matlabcentral/fileexchange/47248-wind-rose (accessed on 23 November 2021).
- Garlan, T.; Almar, R.; Gauduin, H.; Gosselin, M.; Morio, O.; Labarthe, C. 3D variability of sediment granulometry in two tropical environments: Nha Trang (Vietnam) and Saint-Louis (Senegal). J. Coast. Res. 2020, 95, 495–499. [Google Scholar] [CrossRef]
- Vidal-Ruiz, J.A.; de Alegría-Arzaburu, A.R. Modes of onshore sandbar migration at a single-barred and swell-dominated beach. Mar. Geol. 2020, 426, 106222. [Google Scholar] [CrossRef]
- Alari, V.; Raudsepp, U. Simulation of wave damping near coast due to offshore wind farms. J. Coast. Res. 2012, 28, 143–148. [Google Scholar] [CrossRef]
- Price, T.D.; Ruessink, B.G.; Castelle, B. Morphological Coupling in a Double Sandbar System; Utrecht University: Utrecht, The Netherlands, 2013. [Google Scholar]
- Price, T.; van Kuik, N.; de Wit, L.; Dionísio António, S.; Ruessink, B. Shoreward propagating accretionary waves (SPAWs): Observations from a multiple sandbar system. In Proceedings of the Coastal Dynamics 2017, Helsingør, Denmark, 12–16 June 2017; pp. 1081–1089. [Google Scholar]
- Wijnberg, K.M.; Holman, R. Video-observations of shoreward propagating accretionary waves. Proc. RCEM 2007, 2007, 737–743. [Google Scholar]
- Bergsma, E.W.; Almar, R.; Anthony, E.J.; Garlan, T.; Kestenare, E. Wave variability along the world’s continental shelves and coasts: Monitoring opportunities from satellite Earth observation. Adv. Space Res. 2022, 69, 3236–3244. [Google Scholar] [CrossRef]
- Anthony, E.J.; Aagaard, T. The lower shoreface: Morphodynamics and sediment connectivity with the upper shoreface and beach. Earth-Sci. Rev. 2020, 210, 103334. [Google Scholar] [CrossRef]
- Alves, B.; Angnuureng, D.B.; Morand, P.; Almar, R. A review on coastal erosion and flooding risks and best management practices in West Africa: What has been done and should be done. J. Coast. Conserv. 2020, 24, 1–22. [Google Scholar] [CrossRef]
- Vitousek, S.; Buscombe, D.D.; Vos, K.; Barnard, P.; Ritchie, A.; Warrick, J. The future of coastal monitoring through satellite remote sensing. Camb. Prism. Coast. Futures 2023, 1, e10. [Google Scholar] [CrossRef]

Disclaimer/Publisher’s Note: The statements, opinions and data contained in all publications are solely those of the individual author(s) and contributor(s) and not of MDPI and/or the editor(s). MDPI and/or the editor(s) disclaim responsibility for any injury to people or property resulting from any ideas, methods, instructions or products referred to in the content. |
© 2024 by the authors. Licensee MDPI, Basel, Switzerland. This article is an open access article distributed under the terms and conditions of the Creative Commons Attribution (CC BY) license (https://creativecommons.org/licenses/by/4.0/).
Share and Cite
Taveneau, A.; Almar, R.; Bergsma, E.W.J.; Cissé, C.O.T.; Sy, B.A.; Ndour, A. Monitoring Temporal Sandbar and Shoreline Changes at Saint Louis, Senegal: Using Sentinel-2 Imagery (2015–2022). Remote Sens. 2024, 16, 3551. https://doi.org/10.3390/rs16193551
Taveneau A, Almar R, Bergsma EWJ, Cissé COT, Sy BA, Ndour A. Monitoring Temporal Sandbar and Shoreline Changes at Saint Louis, Senegal: Using Sentinel-2 Imagery (2015–2022). Remote Sensing. 2024; 16(19):3551. https://doi.org/10.3390/rs16193551
Chicago/Turabian StyleTaveneau, Adélaïde, Rafael Almar, Erwin W. J. Bergsma, Cheikh Omar Tidjani Cissé, Boubou Aldiouma Sy, and Abdoulaye Ndour. 2024. "Monitoring Temporal Sandbar and Shoreline Changes at Saint Louis, Senegal: Using Sentinel-2 Imagery (2015–2022)" Remote Sensing 16, no. 19: 3551. https://doi.org/10.3390/rs16193551