Article

Tidal Flat Extraction and Analysis in China Based on Multi-Source Remote Sensing Image Collection and MSIC-OA Algorithm

1
CAS Key Laboratory of Coastal Environmental Processes and Ecological Remediation, Yantai Institute of Coastal Zone Research, Chinese Academy of Sciences, Yantai 264003, China
2
Shandong Provincial Key Laboratory of Coastal Zone Environmental Processes, Yantai 264003, China
3
University of Chinese Academy of Sciences, Beijing 100049, China
*
Author to whom correspondence should be addressed.
Remote Sens. 2024, 16(19), 3607; https://doi.org/10.3390/rs16193607
Submission received: 15 July 2024 / Revised: 19 August 2024 / Accepted: 6 September 2024 / Published: 27 September 2024
(This article belongs to the Special Issue Remote Sensing of Coastal, Wetland, and Intertidal Zones)

Abstract

:
Tidal flats, a critical part of coastal wetlands, offer unique ecosystem services and functions. However, in China, these areas are under significant threat from industrialization, urbanization, aquaculture expansion, and coastline reconstruction. There is an urgent need for macroscopic, accurate and periodic tidal flat resource data to support the scientific management and development of coastal resources. At present, the lack of macroscopic, accurate and periodic high-resolution tidal flat maps in China greatly limits the spatio-temporal analysis of the dynamic changes of tidal flats in China, and is insufficient to support practical management efforts. In this study, we used the Google Earth Engine (GEE) platform to construct multi-source intensive time series remote sensing image collection from Sentinel-2 (MSI), Landsat 8 (OLI) and Landsat 9 (OLI-2) images, and then automated the execution of improved MSIC-OA (Maximum Spectral Index Composite and Otsu Algorithm) to process the collection, and then extracted and analyzed the tidal flat data of China in 2018 and 2023. The results are as follows: (1) the overall classification accuracy of the tidal flat in 2023 is 95.19%, with an F1 score of 0.92. In 2018, these values are 92.77% and 0.88, respectively. (2) The total tidal flat area in 2018 and 2023 is 8300.34 km2 and 8151.54 km2, respectively, showing a decrease of 148.80 km2. (3) In 2023, estuarine and bay tidal flats account for 54.88% of the total area, with most tidal flats distribute near river inlets and bays. (4) In 2023, the total length of the coastline adjacent to the tidal flat is 10,196.17 km, of which the artificial shoreline accounts for 67.06%. The development degree of the tidal flat is 2.04, indicating that the majority of tidal flats have been developed and utilized. The results can provide a valuable data reference for the protection and scientific planning of tidal flat resources in China.

1. Introduction

Tidal flats, including intertidal mudflats, rocks, and sandy beaches, are transitional zones between marine and terrestrial environments [1,2]. Tidal flats provide unique ecosystem services, such as defending against storm surges, maintaining shorelines, filtering pollutants, promoting carbon storage, and serving as feeding grounds for migratory birds and spawning and feeding grounds for fish and other marine wildlife [3,4,5]. Despite their importance, tidal flats are fragile and highly threatened by tidal reclamation and natural disturbance [6,7,8]. Rapid socio-economic development and climate change in coastal areas have worsened the depletion of these wetlands [9]. From 1970 to 2015, approximately 35% of the world’s coastal wetlands were lost [10]. The sustainable management of tidal flats has been included in the Sustainable Development Goals of the 2030 Agenda of the United Nations [11]. Studies have shown that preserving the long-term stability of these ecosystems is crucial for achieving sustainability in coastal regions, especially in the face of climate change [12,13].
Over the past four decades, China’s coastal tidal flats have been significantly threatened by industrialization, urbanization, and the expansion of aquaculture [14,15,16]. More than two-thirds of China’s coastline has been converted into artificial sea walls, causing extensive damage to tidal flats [17]. The government has made great efforts to restore and manage degraded coastal ecosystems in order to achieve the Sustainable Development Goals related to sustainable management of coastal resources [18]. In 2020, China issued the Master Plan for Major National Projects for the Protection and Restoration of Important Ecosystems (2021–2035), which emphasized the restoration of shorelines and tidal flats as key to improving the coastal ecological environment [19]. Since China began to gradually pay attention to the protection of coastal wetlands in 2003, there is still considerable room for improvement in the protection and restoration [20,21,22].
In recent years, human activities have increasingly influenced the evolution of tidal flats, leading to their rapid degradation [23,24]. Artificial structures built on the tidal flats disrupt the exchange of terrestrial and marine materials, inhibit natural sediment migration and deposition, and accelerate the erosion and shrinkage of the tidal flats [25,26]. Artificial development activities alter the depth and velocity of the sea–land exchange, thus altering the sedimentation process of tidal flats [27]. Reclamation shortens the natural sedimentary path, allowing finer particulate matter to enter the marine system directly, which exacerbates tidal flat erosion [28]. Long-term observations in the reclamation area of the tidal flats in Jiangsu show that continuous reclamation has destroyed the original balance of erosion and deposition, resulting in their degradation and shrinkage [29]. It is essential to thoroughly examine the current utilization and development trends of tidal flats to inform their protection and restoration [30,31].
Remote sensing has long been utilized for mapping intertidal zones, with the primary challenge being the variability of tidal inundations. Local-scale mapping efforts typically rely on high-resolution imagery, such as Topobathymetric LiDAR and field measurements from tide stations [32,33]. With advancements in image acquisition, storage, and computing capabilities, studies have successfully mapped tidal flats over extensive regions [4,34,35,36]. Tidal flat mapping methodologies using optical imagery can generally be categorized into three approaches: tide model or terrain-based methods [37], machine learning based on training samples [38,39], and knowledge-based decision trees [2,40]. Current large-scale mapping efforts rely on auxiliary data such as tide levels [37], digital elevation models (DEMs) [23,41], training samples [36,38,39], involved manual intervention thresholds [2,40] and required pre- and post-processing. To overcome these limitations, Jia et al. developed the Maximum Spectral Index Composite and Otsu Algorithm (MSIC-OA), producing an up-to-date 10 m spatial resolution tidal flat map of China [42]. While the traditional MSIC-OA algorithm using Sentinel-2 imagery can quickly and reliably map large-scale tidal flats, there is still room for improvement. In this study, we enhanced the traditional MSIC-OA algorithm by incorporating Landsat 8 and Landsat 9 alongside Sentinel-2, creating multi-source data to improve temporal resolution for more accurate tidal flat extraction. Additionally, we eliminated the interference of floating mud pixels to enhance the scientific accuracy of tidal flat mapping.
Google Earth Engine (GEE) is a cloud computing platform developed by Google for satellite data analysis and processing. It has been widely used in large-scale remote sensing research. It includes comprehensive datasets, such as Landsat, Sentinel-1, Sentinel-2 satellite imagery, weather data, land cover data, and even socioeconomic data.
Currently, the lack of comprehensive and accurate spatial survey data, along with insufficient periodic information on tidal flat resources in China, significantly limits the spatio-temporal analysis of the dynamic changes of tidal flats of China. To address the limitations of existing tidal flat maps, this study utilized Sentinel-2, Landsat 8, and Landsat 9 imagery as data sources within the GEE platform, constructing a multi-source intensive time-series remote sensing image collection. Using the improved MSIC-OA algorithm, we conducted refined mapping of China’s tidal flats for the years 2018 and 2023. This comprehensive study examines tidal flat resources from various aspects, including resource stock, distribution characteristics, utilization patterns, development levels, and dynamic changes. The results provide a scientific data foundation and theoretical basis for the protection, development, and utilization of coastal zone resources.

2. Materials and Methods

2.1. Study Area

China’s coastal belt stretches from the mouth of the Yalu River in the north to the mouth of the Beilun River in the south, spanning over 20 degrees of latitude (18.2°N to 40.5°N) and covering a coastline of approximately 18,000 km. From north to south, the coastal areas encompass three climate zones—tropical, subtropical, and temperate—with average annual temperatures ranging from 5 °C to 26 °C and precipitation between 400 and 1800 mm [43,44]. The elevations in these regions range from sea level to more than 3700 m [2], with the northern half being predominantly low-lying, although some mountains and hills in northeast China and the Shandong Peninsula extend to the coastal areas. The primary landscapes of China’s intertidal zone include tidal flats, mangroves, salt marshes, aquaculture ponds, artificial areas, and waters (Figure 1).

2.2. Data Sources

In this study, the multi-spectral remote sensing data used included Sentinel-2 (MSI), Landsat 8 (OLI) and Landsat 9 (OLI-2). The Sentinel-2 data were level 2A (L2A) surface reflectance products, processed after atmospheric correction. The Landsat 8/9 data were Collection 2 Tier 1 top-of-atmosphere reflectance products. The time periods analyzed were from July 2017 to June 2019 and from July 2022 to June 2024. The image band parameters are shown in Table 1. Cloud removal was performed using the QA60 band for Sentinel-2 images and the QA_PIXEL band for Landsat images [41]. For Sentinel-2, the SWIR 1 band was sampled up to a 10-meter spatial resolution by bilinear interpolation. For Landsat 8 and Landsat 9, atmospheric correction was applied, followed by a data fusion method based on Gram–Schmidt (GS) [45]. This process upsampled the 30-meter multispectral bands to 15 m using the 15-meter panchromatic band. After up-sampling, the spatial resolution of Sentinel-2 and Landsat multi-spectral bands are 10 m and 15 m, respectively. All these operations were implemented on the GEE platform.

2.3. Extraction of Tidal Flat

In this study, tidal flats were defined as silty or sandy non-vegetated areas in the tide-flooded area between the maximum and minimum tidal inundation, excluding regions covered by mangroves, spartina alterniflora, and other intertidal plants. This definition also includes portions of the radiating sand ridge, commonly referred to as the “intertidal zone” [40].
The MSIC algorithm selects a band contained in each image in the input image set as the quality band, compares the value of the quality band in each image at each pixel position, and selects the sorted maximum value as the final output value of the pixel. In the GEE platform, this process can be executed using the “imageCollection.qualityMosaic()” function.
The Otsu algorithm (OA) [46], also known as the maximum inter-class variance method, determines the optimal threshold based on the gray-level histogram of an image. This threshold divides the image into background and foreground regions, maximizing inter-class variance while minimizing intra-class variance, thus achieving automatic binary classification.
We selected spectral index based on Jia’s research result [42]. The modified Normalized Difference Water Index (mNDWI) [47] enhanced the difference between artificial shoreline and water body. In order to suppress the influence of other types of background water bodies such as aquaculture ponds, we selected mNDWI to extract water body information. The Normalized Difference Vegetation Index (NDVI) [48] value of non-water (vegetation and tidal flat) pixels is higher than the water pixels. We created maximum spectral index composite image of NDVI to extract the minimum water surface. The image can not only enhance the difference between vegetation and water, but also remove the influence of periodic seawater inundation on the extraction of tidal flat. We effectively separate tidal flat from water by NDVI.
The formula for mNDWI is:
mNDWI = G r e e n S W I R 1 G r e e n + S W I R 1
where Green is the green light band of the image, SWIR1 is the short-wave infrared band 1 of the image.
The formula for NDVI is:
NDVI = N i r R e d N i r + R e d
where Nir is the near infrared band of the image, and Red is the red band of the image.
The process of automatic, rapid and high-precision tidal flat extraction constructed in this study is illustrated in Figure 2. The workflow of the MSIC-OA algorithm is described as follows.
  • Maximal Water Extent: Apply the MSIC algorithm to the mNDWI band to generate a composite image representing the maximal water extent (mNDWI-MSIC). Then, use the Otsu algorithm on the mNDWI-MSIC image to obtain the original maximal water extent image, which includes both seawater and inland water. Exclude the inland water based on the principle of maximum connectivity to derive the maximal water surface image.
  • Minimal Water Extent: Apply the MSIC algorithm to the NDVI band to create a composite image of the minimal water extent (NDVI-MSIC).
  • Intertidal Area Creation: Clip the minimal water image using the maximal water surface image. This results in an intertidal area image, referred to as the original high water image, which includes seawater, tidal flats, and intertidal vegetation.
  • Removal of Intertidal Vegetation: Use the Otsu algorithm on the original high water image to identify the maximal intertidal vegetation extent, and then remove the vegetation from the original high water image. This yields an image containing only seawater and tidal flats.
  • Final Tidal Flat Extraction: Apply the Otsu algorithm to the seawater and tidal flat image to isolate the tidal flats.
Some extraction results may include floating mud. To address this, the Otsu algorithm can be applied again to separate floating mud from the tidal flats.

2.4. Extraction and Classification of Shoreline

According to the Technical Regulations for Coastal Zone Restoration of the China Offshore Comprehensive Marine Survey and Evaluation Project (908 Project), and based on the actual types of coastal shorelines in China relevant to this study, China’s coastline was categorized into natural shorelines (formed by natural interactions between land and sea) and artificial shorelines (formed through human reconstruction). The upper boundary of the tidal flat, considered the shoreline, was determined by intersecting the maximum inundation range with the tidal flat extraction results. The shoreline classification was conducted through manual visual interpretation (Table 2).
The Tidal Flat Development Degree Index (TFDDI) was established to reflect the development degree of tidal flats. The TFDDI is calculated as follows:
T F D D I = L 1 L 2
In this formula, TFDDI represents the development degree of a tidal flat in a given area, where L1 is the length of the artificial shoreline and L2 is the length of the natural shoreline adjacent to the tidal flat. A higher TFDDI value indicates a higher degree of tidal flat development.

3. Results

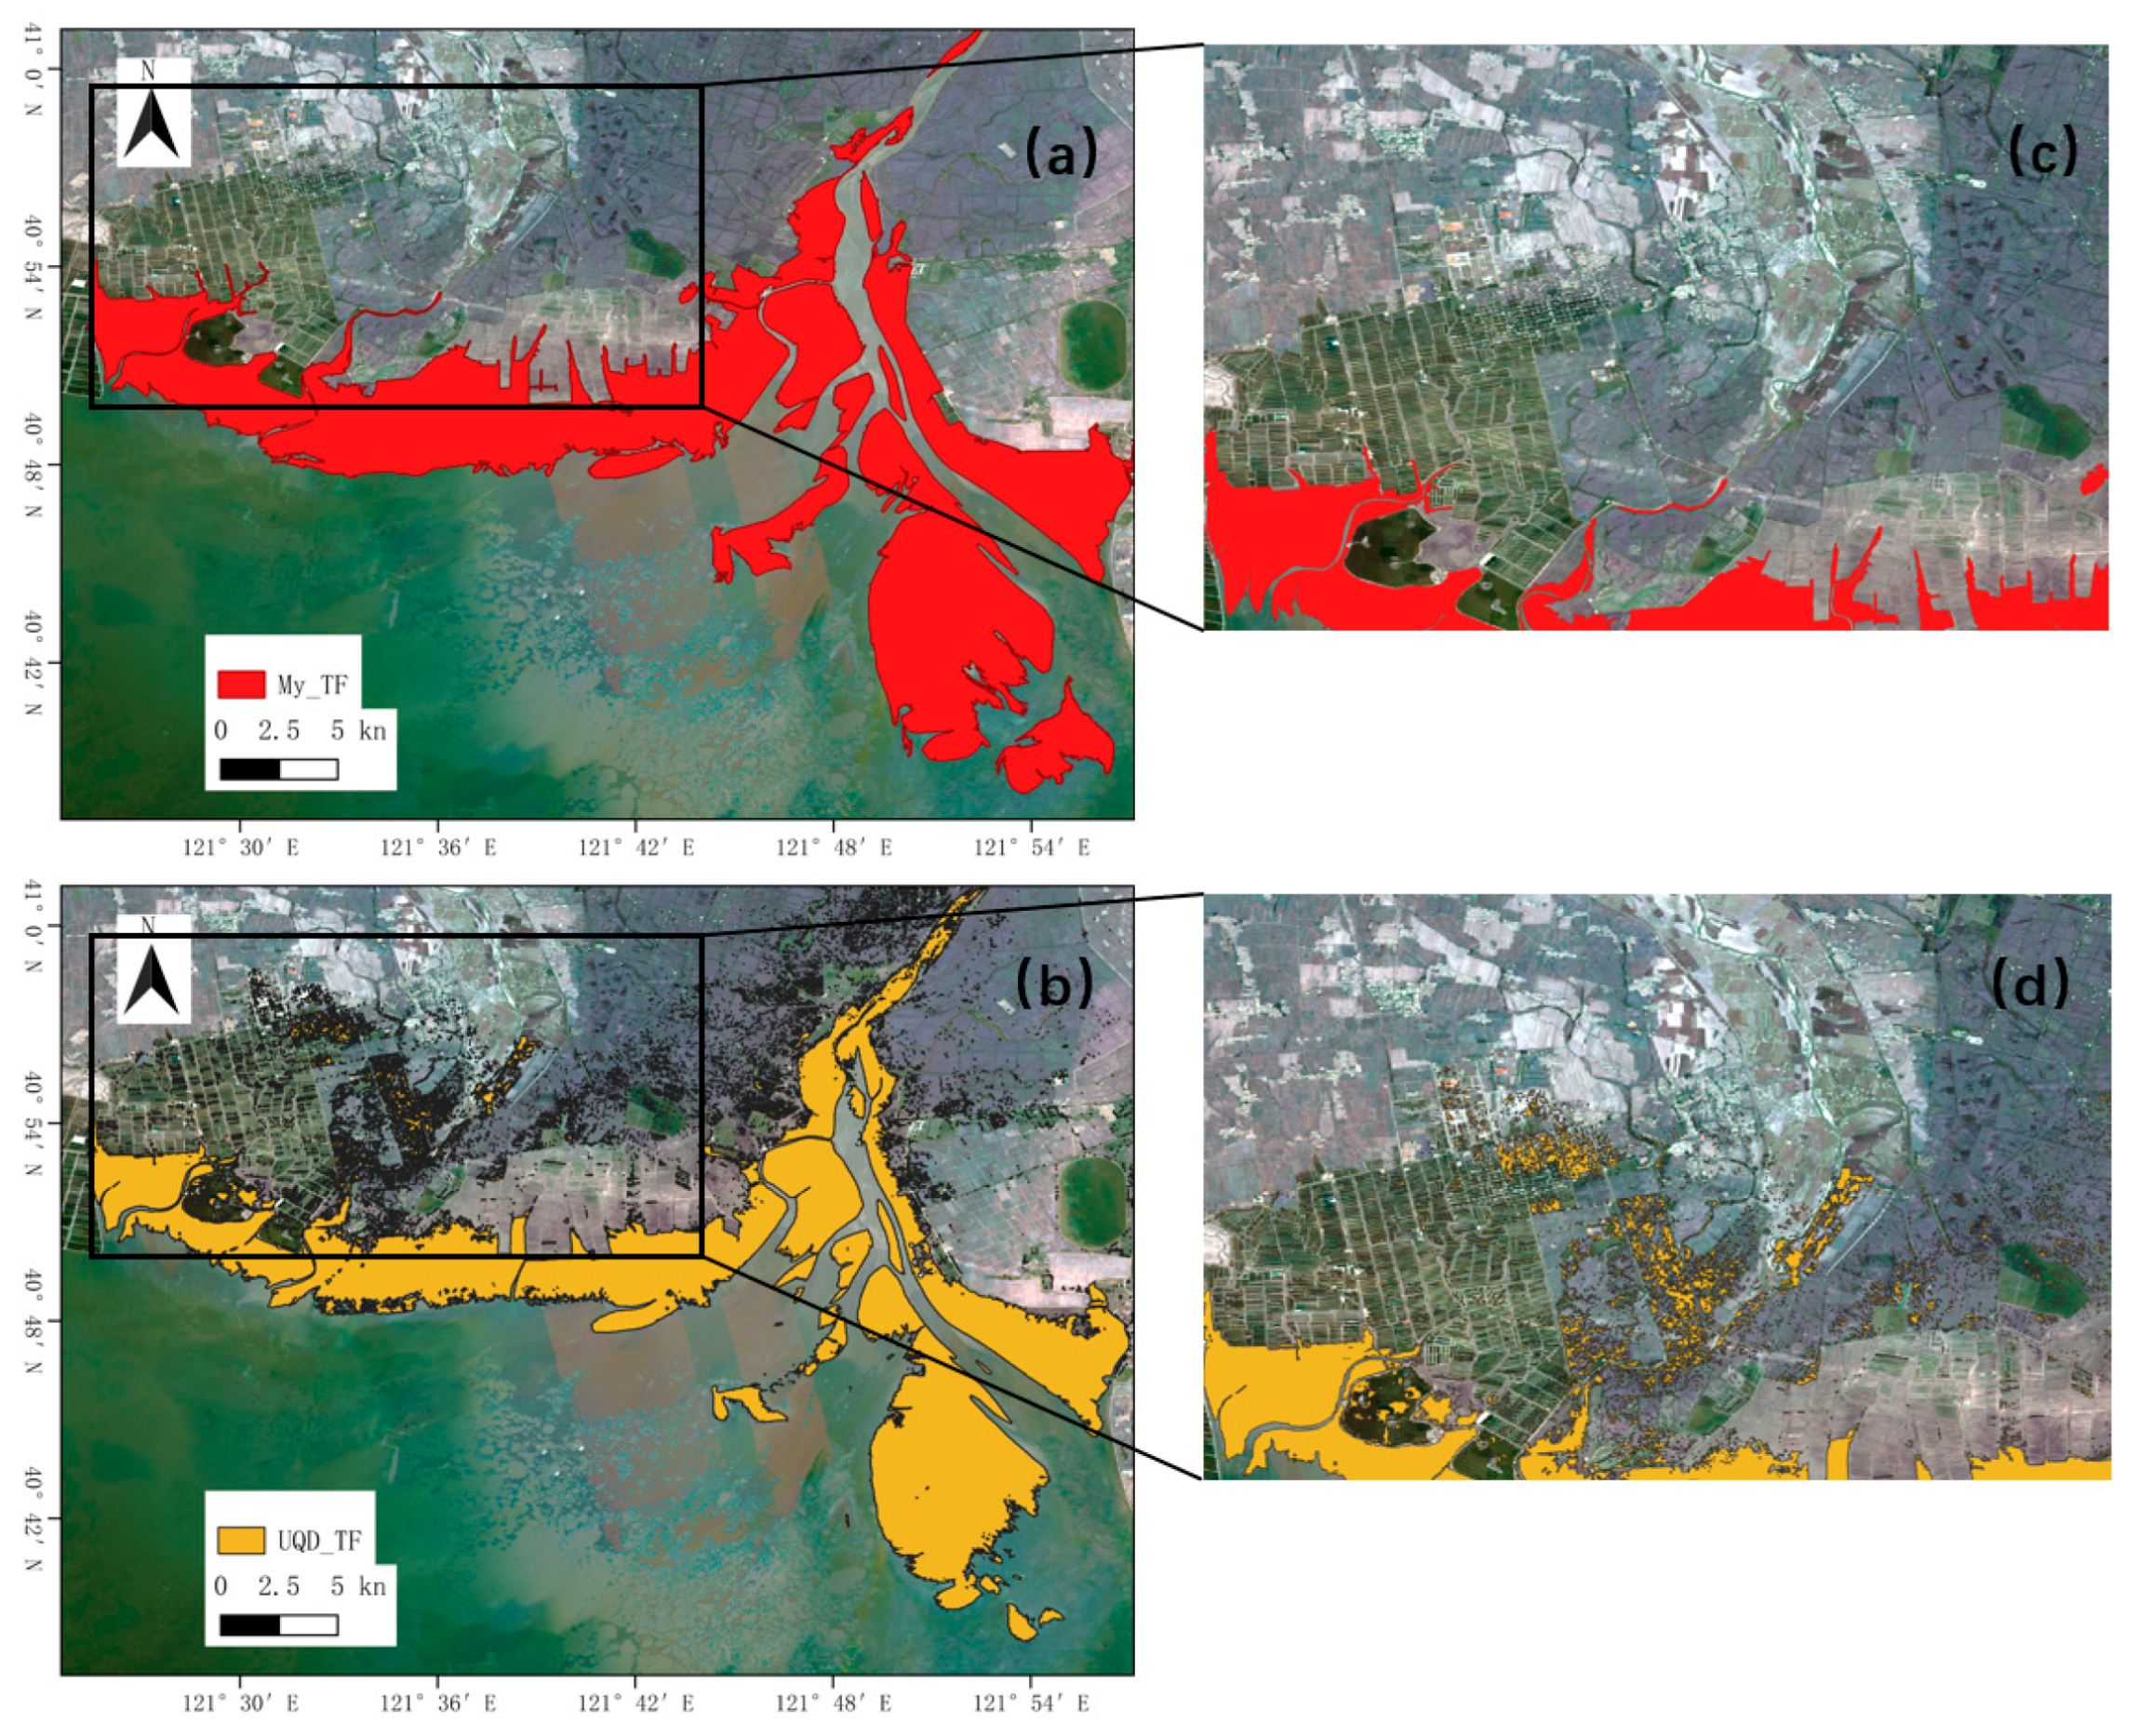
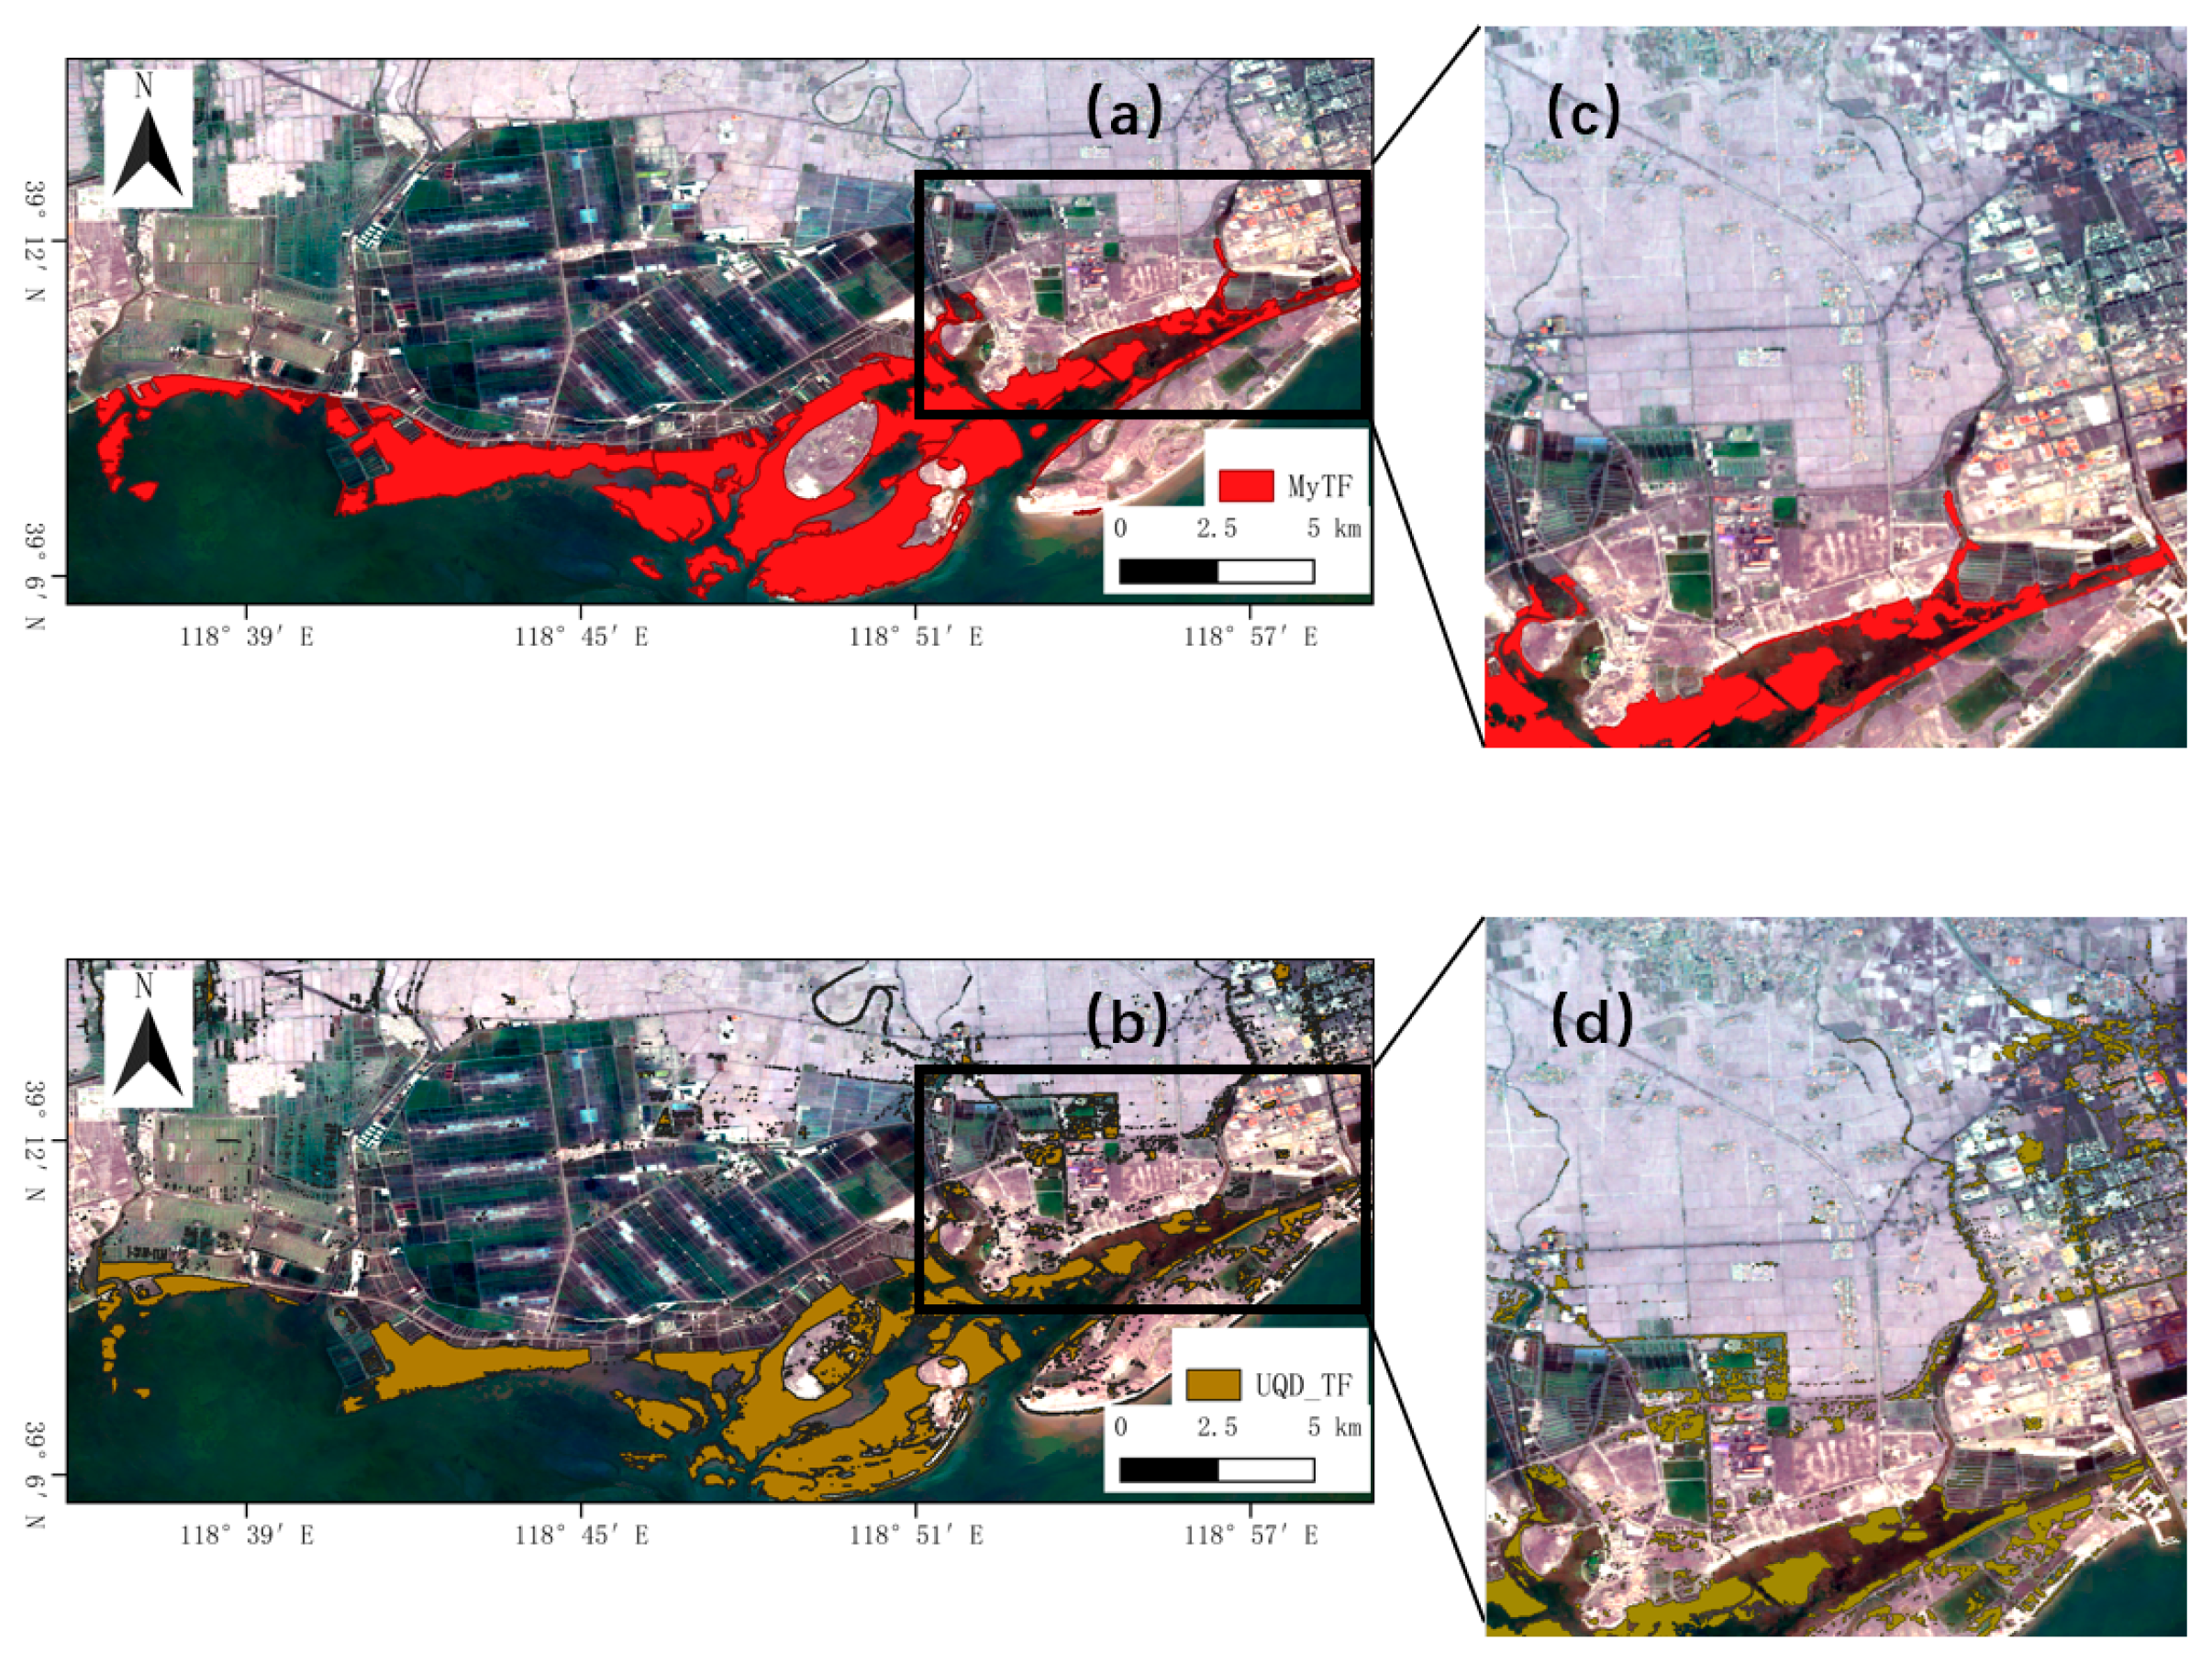
3.1. Precision Analysis of Tidal Flat Extraction

To assess the accuracy of the tidal flat extraction results, both quantitative and qualitative analyses were conducted. For the quantitative analysis, we used Sentinel-2 and Landsat images captured during the lowest tide periods and generated random sample points to validate the accuracy of the extraction. Tidal flats and non-tidal flats were distinguished through manual visual interpretation, and the accuracy of tidal flat extent across all observation periods was evaluated using the confusion matrix method. The confusion matrices for tidal flats in 2018 and 2023 were generated (Table 3). The overall accuracy and F1 score for the tidal flat extraction in 2018 were 92.77% and 0.88, respectively. For 2023, these metrics improved to 95.19% and 0.92. Overall accuracy indicates the proportion of ground truth samples correctly mapped, while the F1 score, a harmonic mean of producer’s accuracy and user’s accuracy, reflects the classification performance for a single class [49].
For the qualitative analysis, we incorporated UQD data (2017–2019) produced by Murray on the GEE platform. We selected three typical regions: Liao River Estuary, Caofeidian, and central Jiangsu. Then, we compared the extracted tidal flats from 2018 with the UQD data. The findings revealed that the UQD data were largely consistent with the tidal flats extracted in this study. Moreover, compared to the UQD data, the tidal flat extraction results from this study effectively minimize the interference from inland water bodies and ground features, as shown in Figure 3, Figure 4 and Figure 5.
In summary, the tidal flat extraction results in this study are reliable.

3.2. Tidal Flat Stock

The total area of tidal flats in China in 2023 is 8151.54 km2 (Table 4). Jiangsu province has the largest tidal flat area, covering 2149.01 km2 and accounting for 26.36% of the total. In contrast, Tianjin has the smallest tidal flat area, with just 55.33 km2, making up 0.68%.
In estuarine areas, sediment deposition is particularly significant due to the abundant sediment supply and favorable conditions for accumulation. The effect of wave energy divergence in bays, combined with minimal disturbance from wind waves and large tidal changes, contributes to the formation of extensive sediment deposits. When examining the spatial distribution of tidal flats, they can be categorized into estuarine, bay, and other types. According to the classification shown in Figure 6, the tidal flat areas of estuaries and bays are 1828.08 km2 and 2644.82 km2, respectively, accounting for 22.43% and 32.45% of the total, or 54.88% combined. Excluding Jiangsu province, the total tidal flat area in the remaining regions is 6002.53 km2. Of this, estuarine and bay tidal flats make up 1785.14 km2 and 2574.83 km2, representing 29.74% and 42.90%, accounting for 72.64% in total. These data indicate that the majority of tidal flats in China are concentrated near river estuaries and bays.

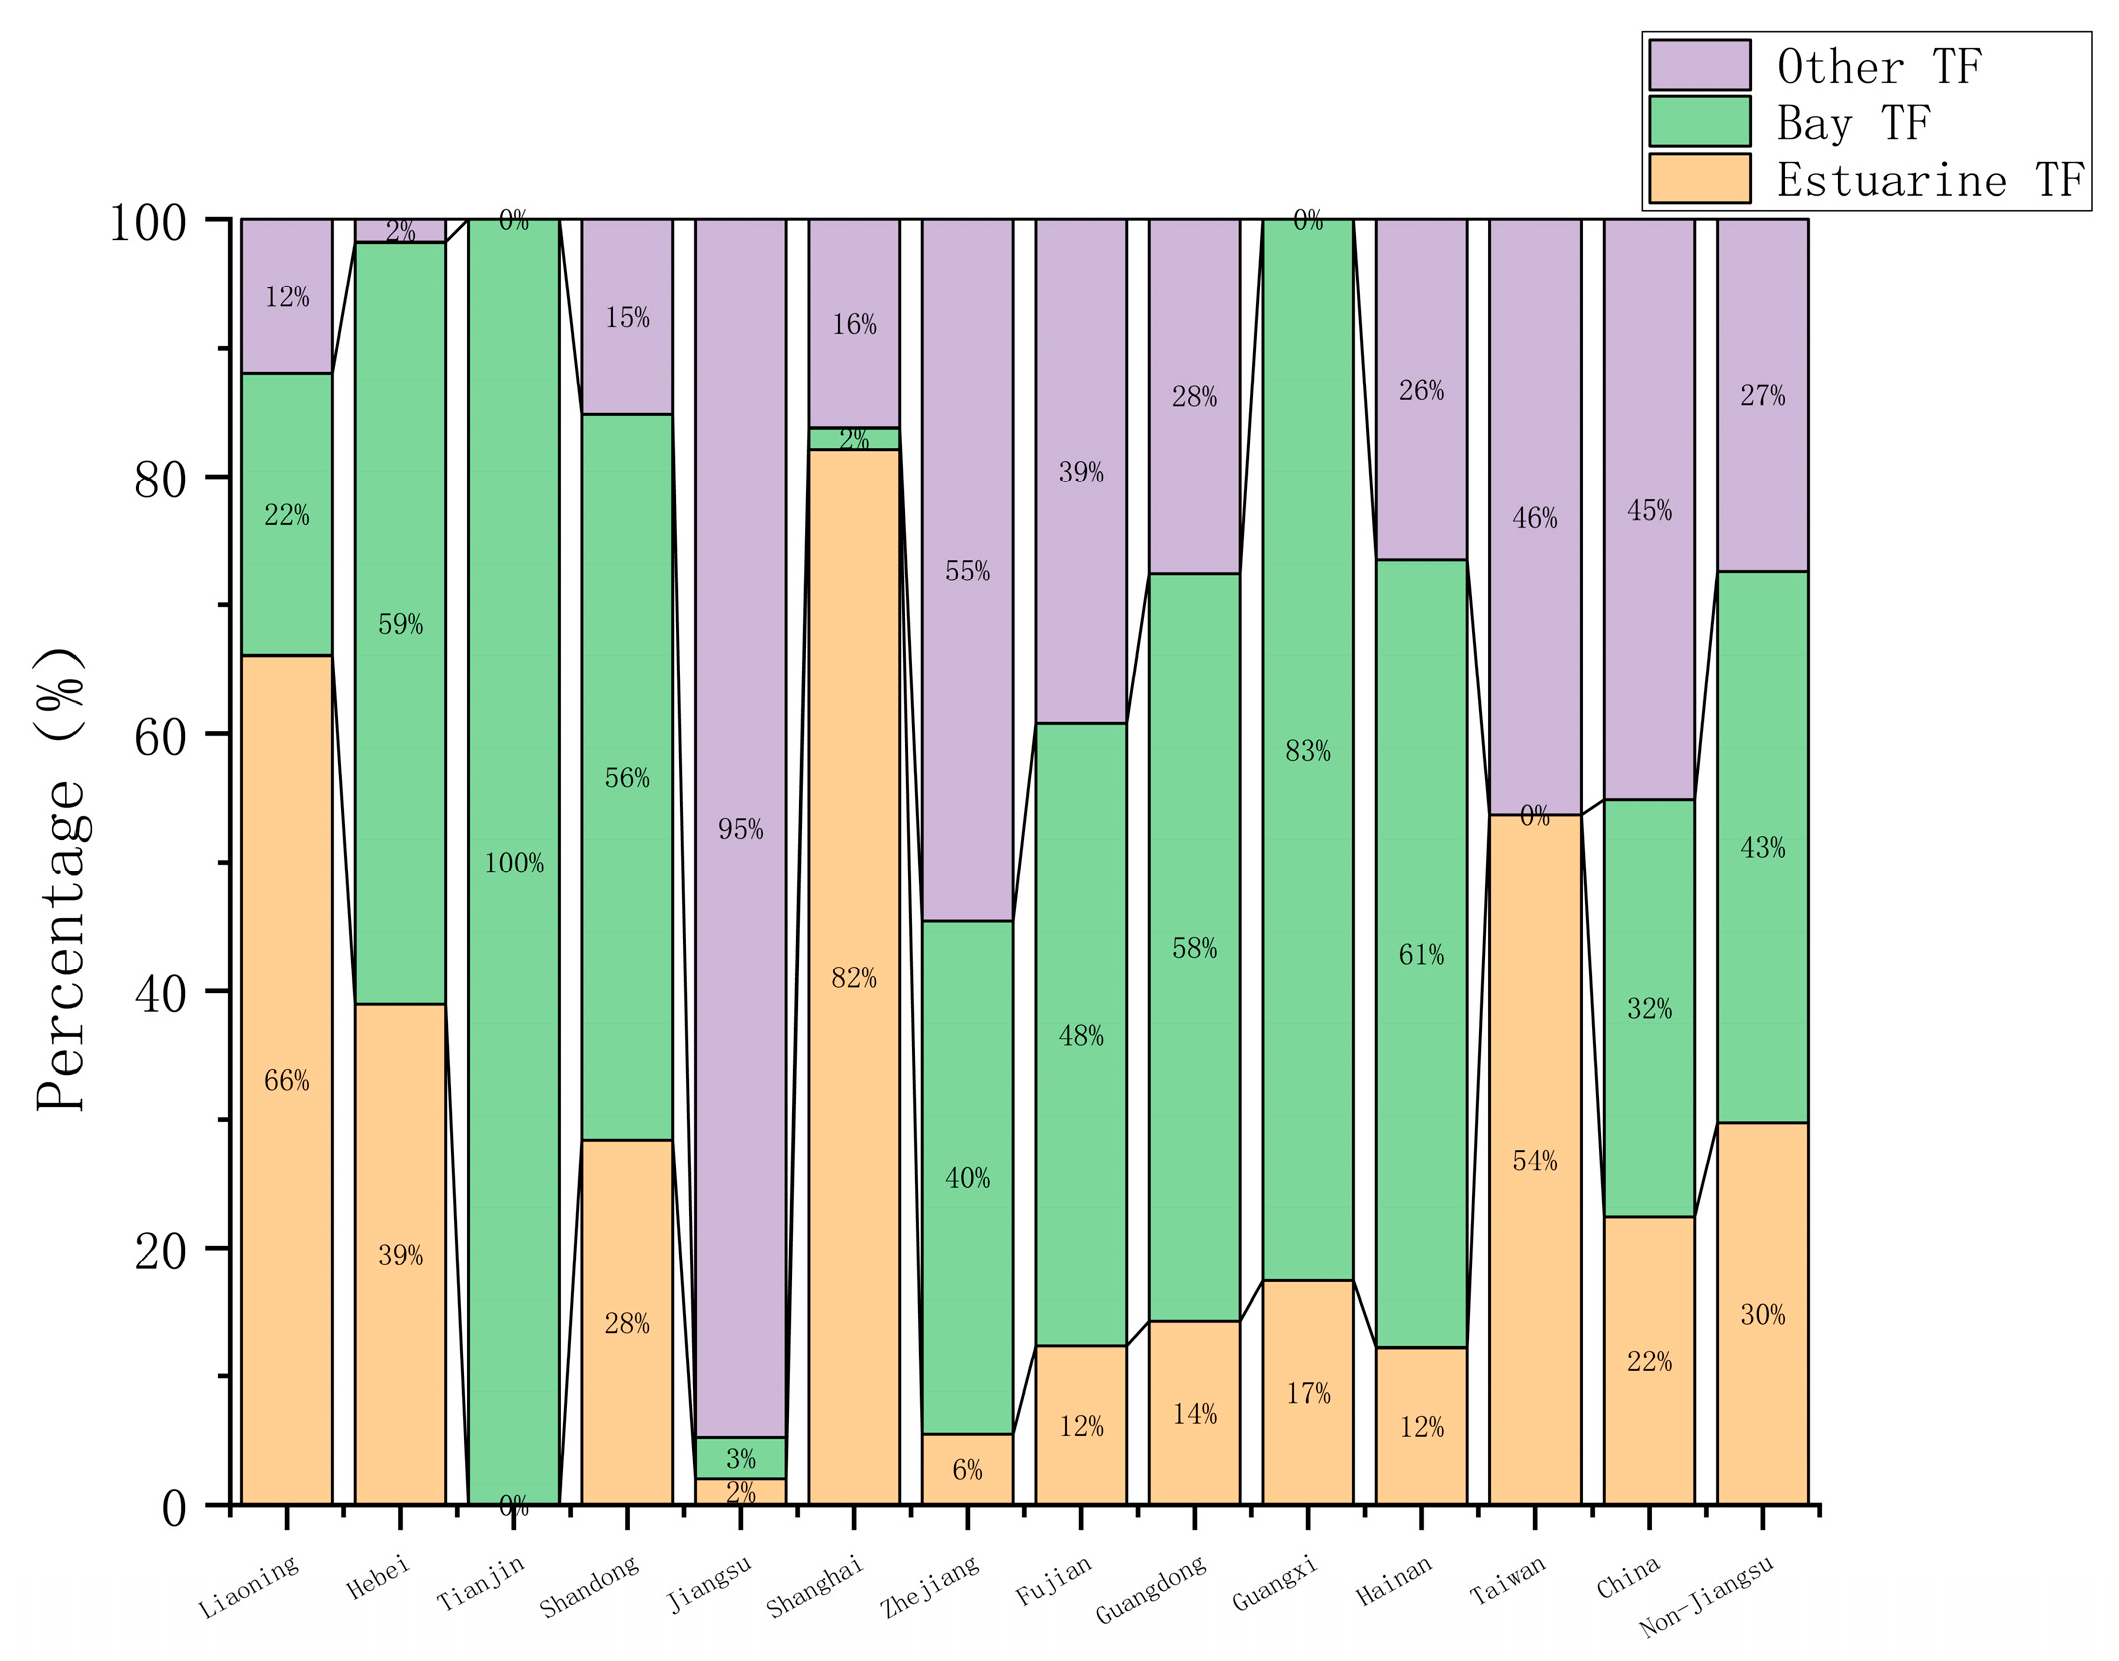
3.3. Spatial Distribution of Tidal Flats

The spatial distribution of tidal flats in China in 2023 is shown in Figure 7. In Liaoning province, tidal flats were predominantly found along the Yellow Sea coastline and the Liao River estuary in Liaodong Bay, representing 43.98% and 39.73% of the province’s total tidal flats, respectively. In Hebei province, the main concentrations are along the Daqing Estuary and Bohai Bay, accounting for 36.81% and 59.22%, respectively. Tianjin’s tidal flats are entirely situated in Bohai Bay, primarily flanking Tianjin Port, with 56.98% located in the north and 43.02% in the south. Shandong province’s tidal flats are concentrated in Bohai Bay, Laizhou Bay, and the Yellow River delta, comprising 15.49%, 31.09%, and 25.74%, respectively. Jiangsu province’s tidal flats are predominantly located from the Sheyang Estuary to the Yangtze River estuary, making up 91.63% of the province’s total. In Shanghai, the majority of tidal flats were found at the Yangtze River estuary, accounting for 82.12%. Zhejiang province exhibits a more fragmented distribution, with significant tidal flats in the Hangzhou Bay area, accounting for 28.57%. Fujian province’s tidal flats are evenly spread along its extensive coastline. In Guangdong province, the tidal flats are notably fragmented, with a significant concentration in Zhanjiang, located in the southwest, where tidal flats accounted for 51.50%. Specifically, Beibu Gulf in the west and Leizhou Bay in the east contribute 27.32% and 24.18%, respectively. In Guangxi Zhuang Autonomous Region, tidal flats are evenly distributed within Beibu Gulf. Hainan province’s tidal flats were primarily found in the Beibu Bay area, including Danzhou Bay, constituting 60.12% of the island’s tidal flats. In Taiwan, the tidal flats are predominantly located in the northwest, accounting for 97.12% of its total.

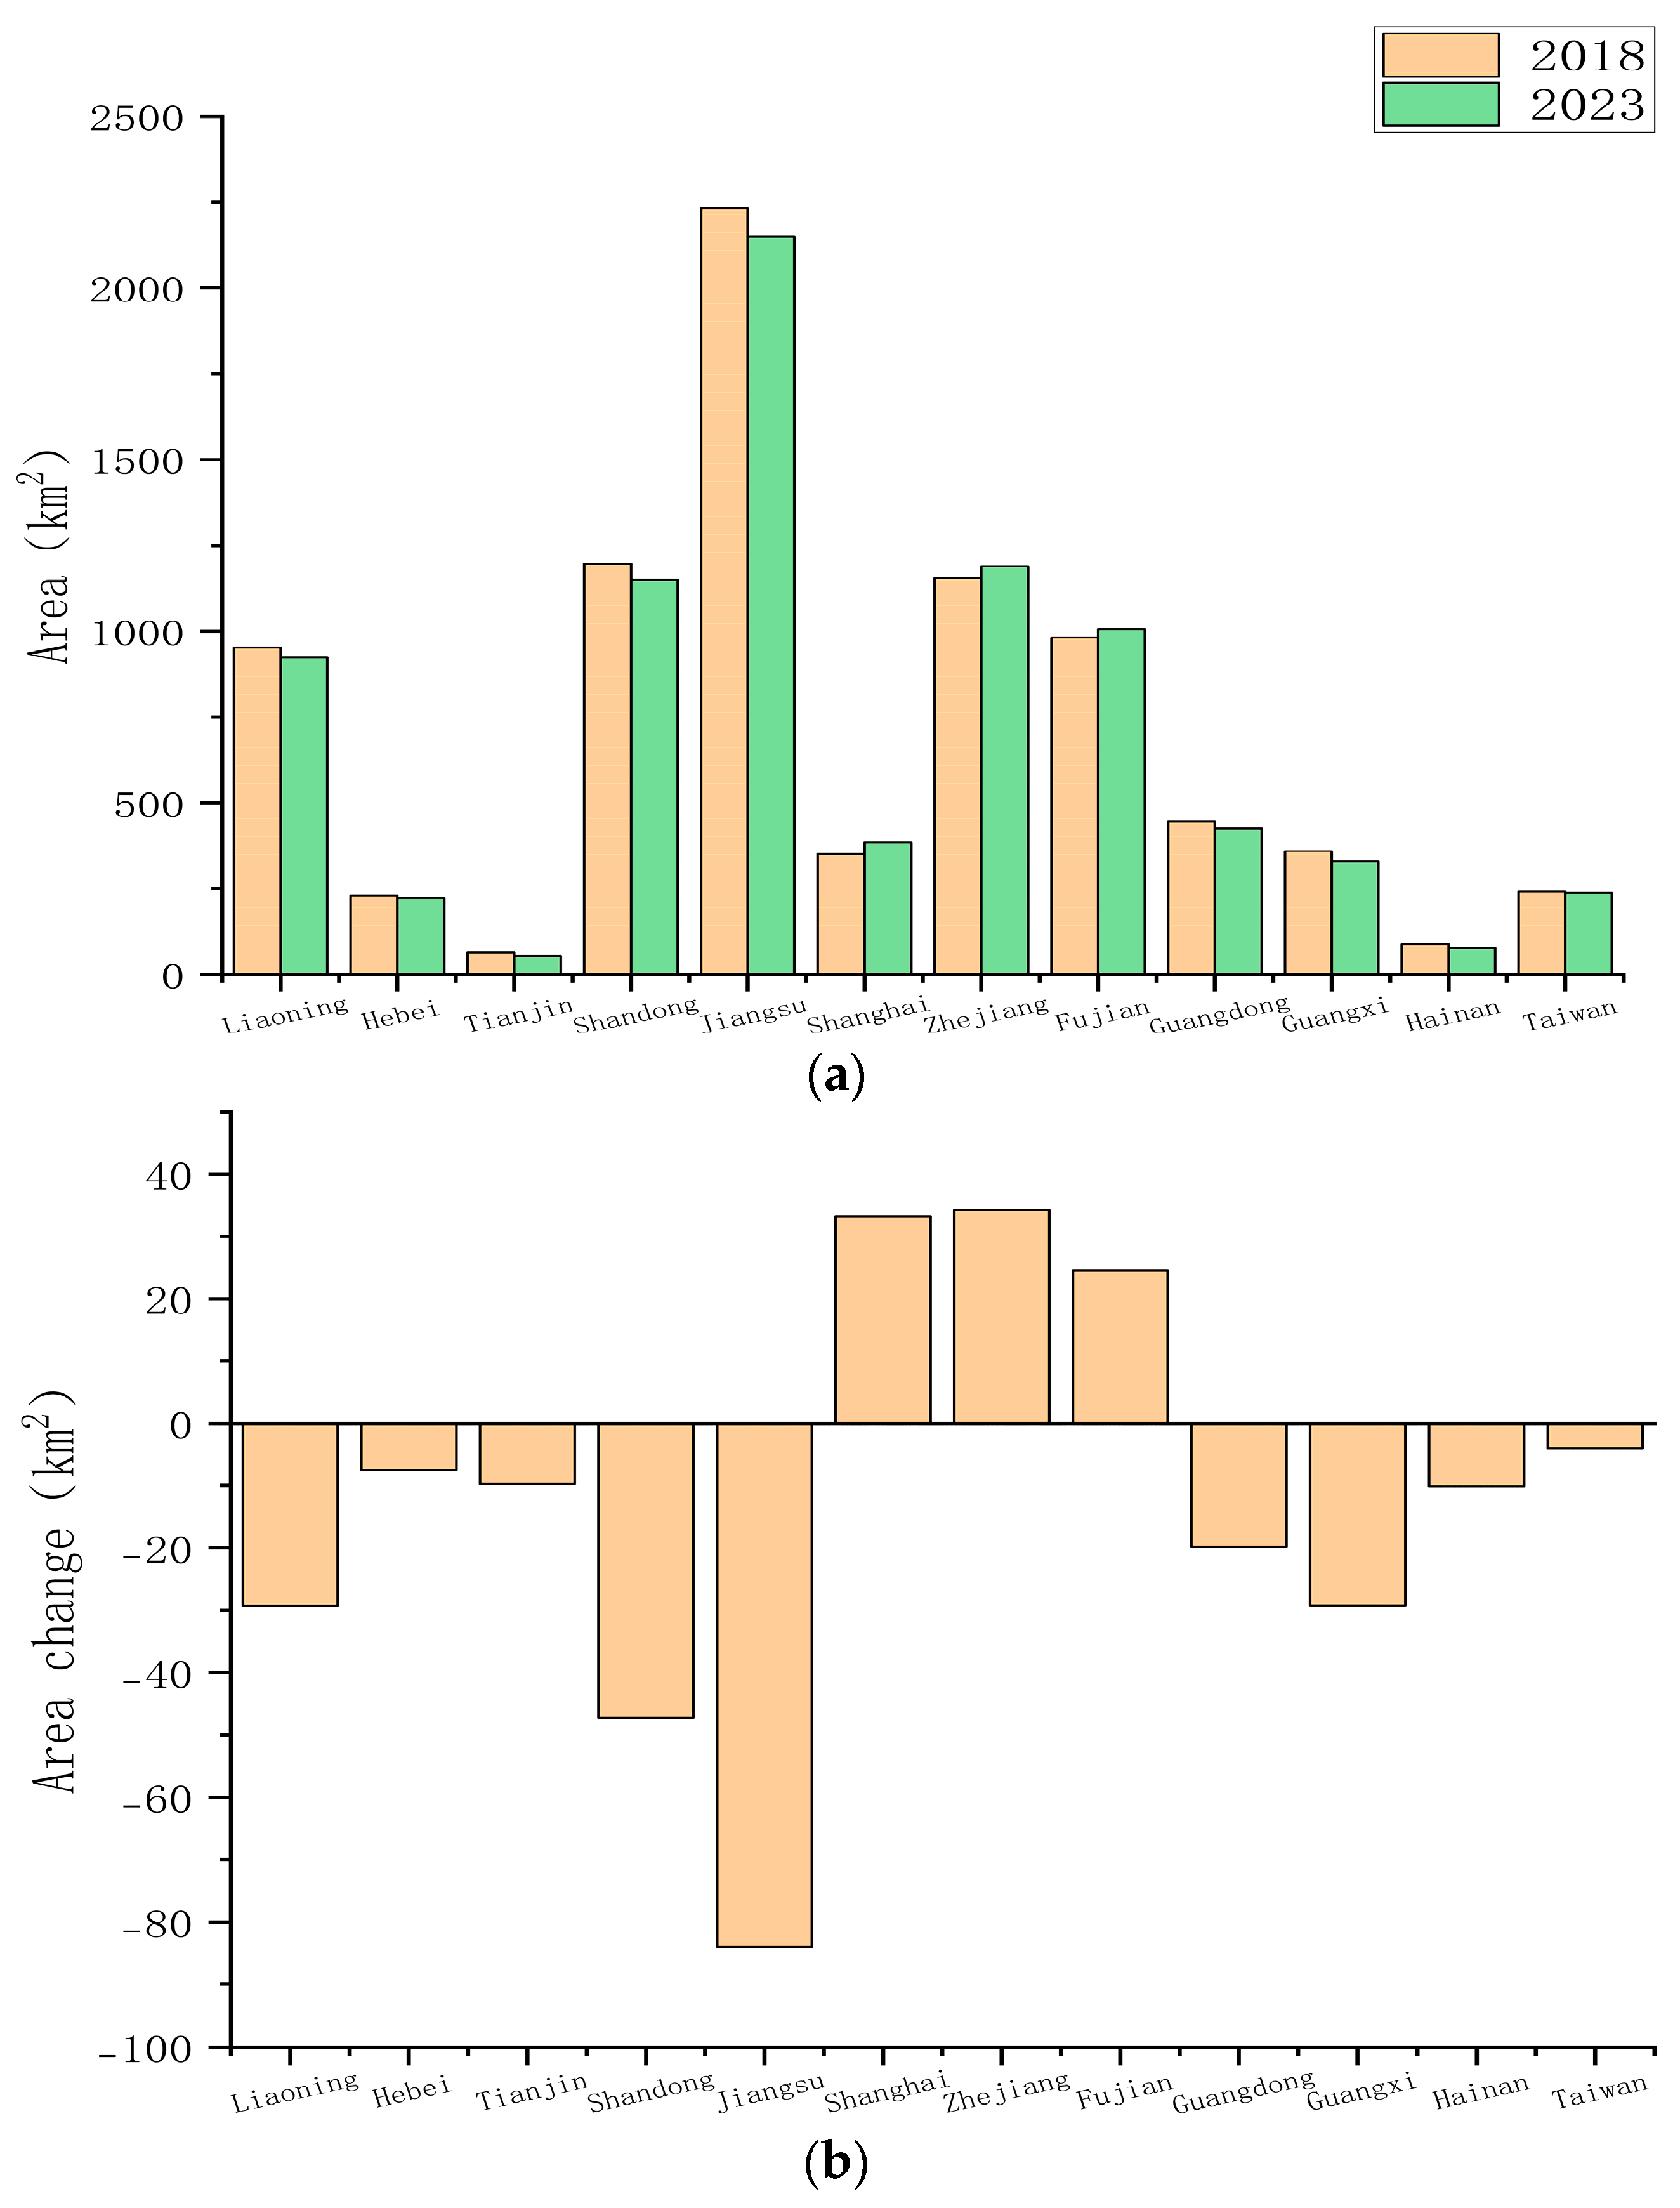
3.4. Tidal Flat Area Change in China, 2018–2023

The total area of China’s tidal flats was 8300.34 km2 in 2018 and 8151.54 km2 in 2023, marking a decrease of 148.80 km2 over this period. Figure 8a provides detailed information on the tidal flat areas for each provincial administrative unit in China for both 2018 and 2023. As illustrated in Figure 8b, of the 12 units analyzed, only Zhejiang, Shanghai, and Fujian (listed in descending order of area increase) experienced growth in their tidal flat areas from 2018 to 2023.

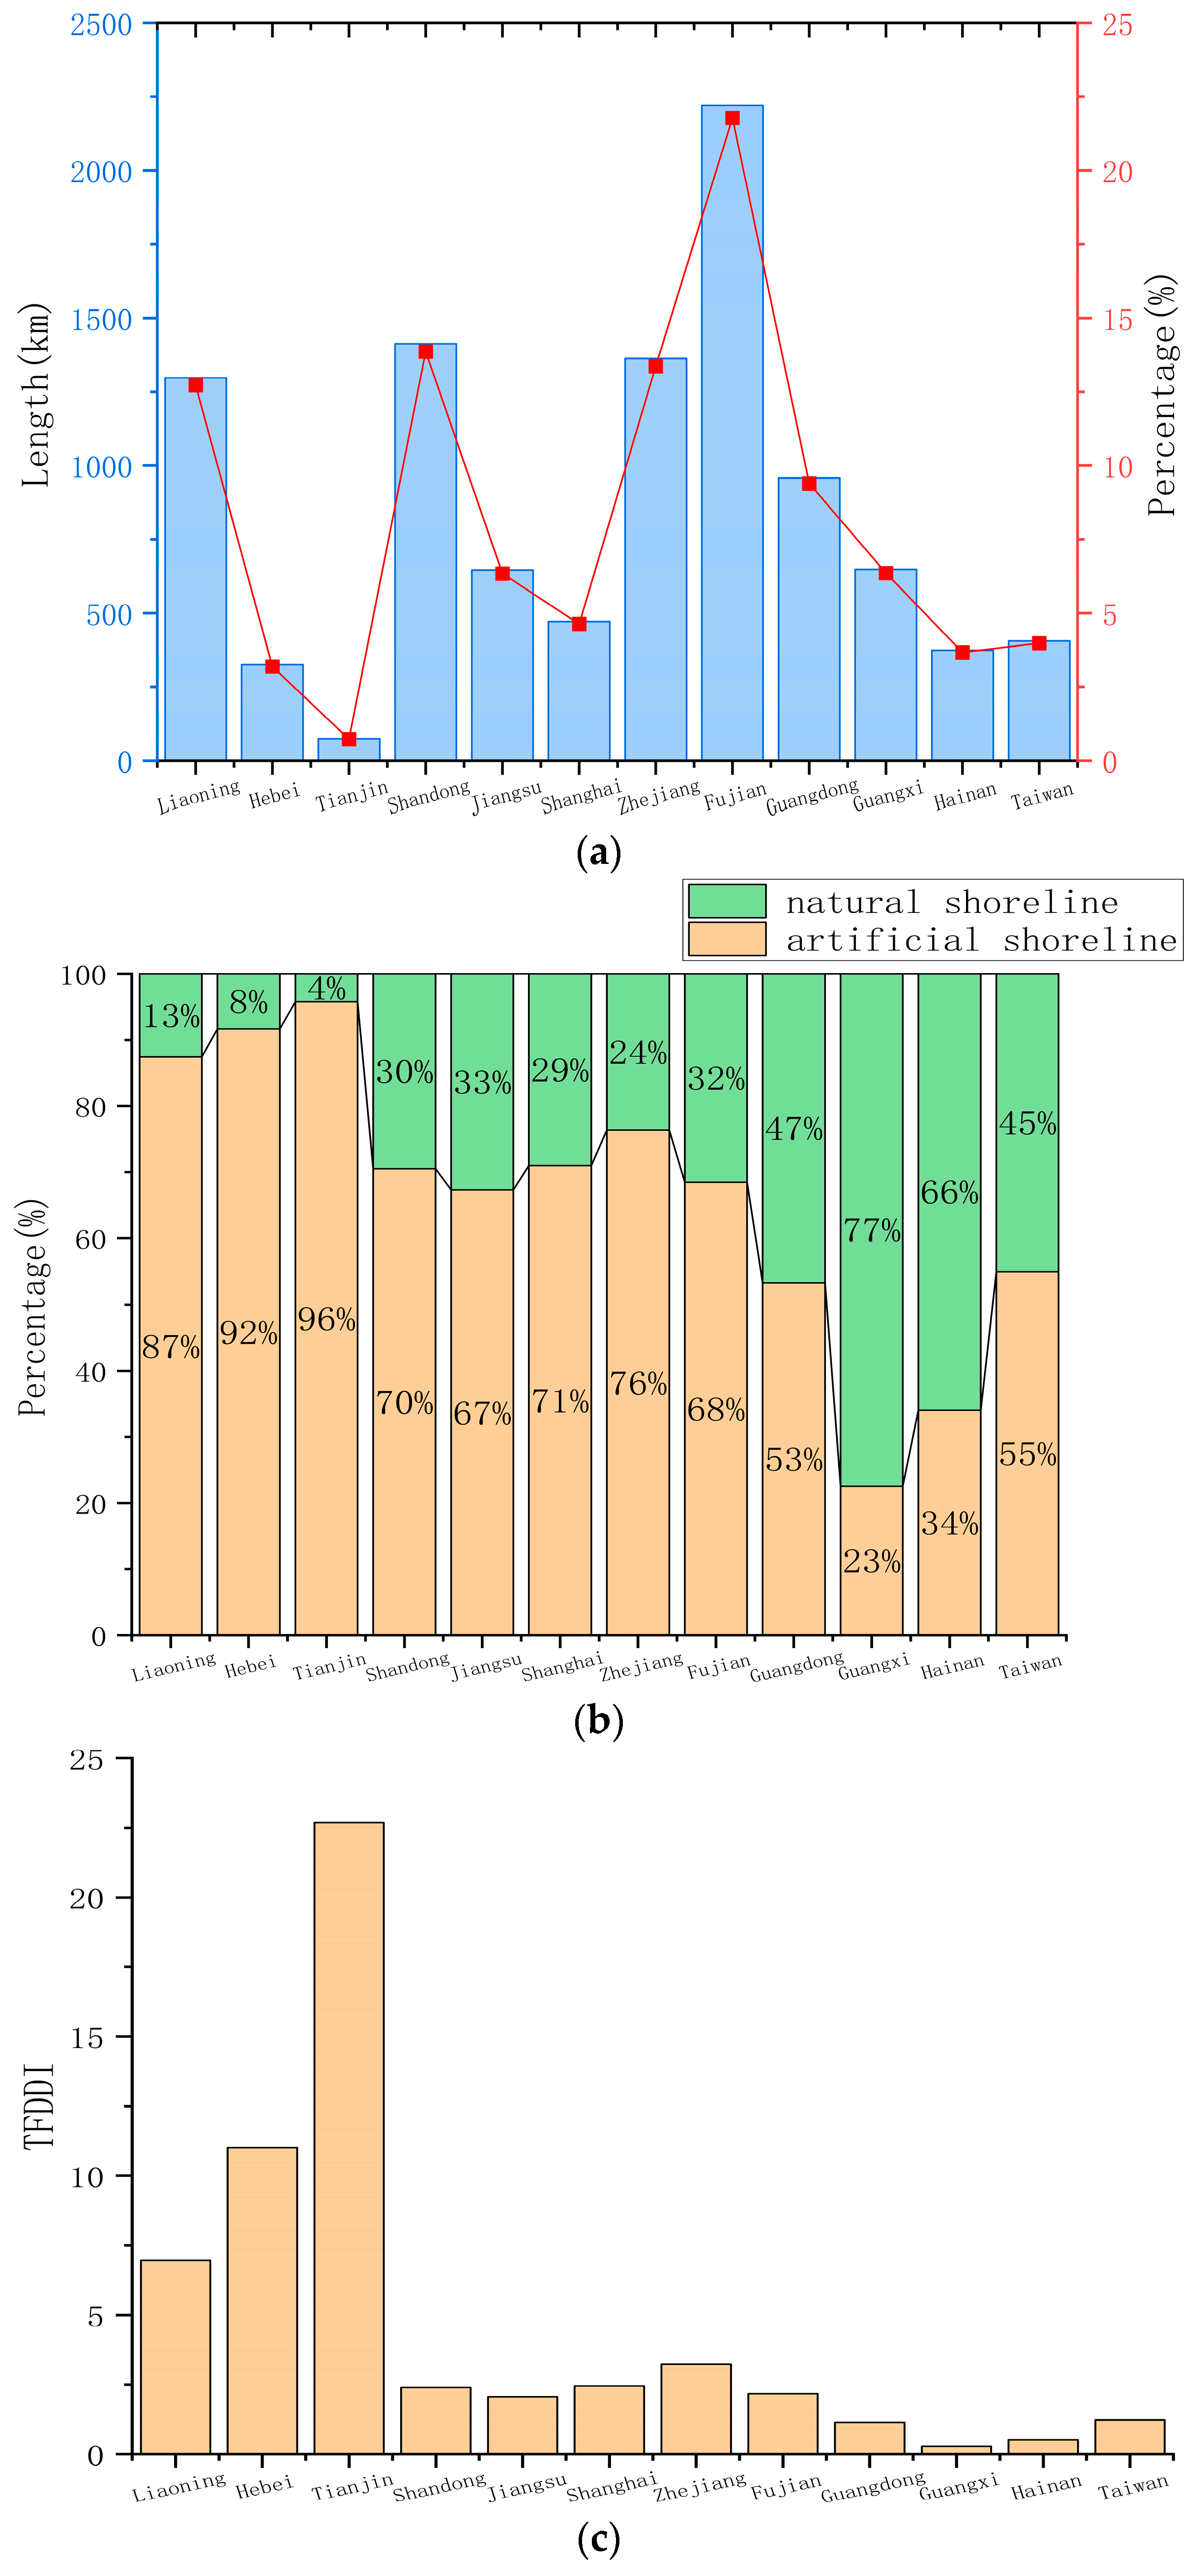
3.5. Coastline Information

In 2023, the total length of shoreline adjacent to tidal flats in China is 10,196.17 km. Fujian province has the longest stretch of tidal flats, measuring 2220.45 km and accounting for 21.78% of the total, while Tianjin has the shortest, with just 74.51 km, representing 0.73%. Artificial shorelines constitute 67.06% of the total, with natural shorelines making up the remaining 32.94%. The TFDDI of China’s tidal flats is 2.04, indicating significant development and utilization across most tidal flat areas. Tianjin exhibits the highest TFDDI at 22.69, while Guangxi has the lowest at 0.29, as shown in Figure 9.

4. Discussion

In this study, Sentinel-2 (MSI), Landsat 8 (OLI), and Landsat 9 (OLI-2) images were selected using the GEE platform, followed by a series of preprocessing steps including atmospheric correction, up-sampling, and cloud removal to create a multi-source, high-quality, dense time series image collection. The spatial resolution of Sentinel-2 images is 10 m, with a revisit interval of 2–5 days. This high spatial resolution enables more precise identification of tidal flat boundaries, while the high temporal resolution offers a good opportunity to capture both the lowest and highest tides. Compared to Sentinel-2 alone, the inclusion of Landsat 8 and Landsat 9 in the multi-source image collection improves time resolution, resulting in more accurate and robust depictions of tidal flats. Building on previous research [33], two spectral indices, mNDWI and NDVI, were selected and combined with the MSIC-OA algorithm to achieve rapid and automatic classification and extraction of China’s tidal flats. Detailed mappings of tidal flats in 2018 and 2023 were completed, allowing for an in-depth study of tidal flats from the perspectives of resource stock, distribution characteristics, dynamic changes, utilization modes, and development levels.
One issue with the traditional MSIC-OA algorithm is that it tends to extract not only tidal flats but also floating mud in seawater. This study proposes an improvement by eliminating floating mud pixels, resulting in more accurate extraction outcomes.
The overall classification accuracy for China’s tidal flats is 95.19% in 2023, with an F1 score of 0.92. In 2018, the accuracy is slightly lower at 92.77% with an F1 score of 0.88. The lower accuracy in 2018 is attributed to the unavailability of Landsat 9 data, which covers the period from October 2021 to June 2024, thereby highlighting the benefits of a multi-source image set.
Qualitative analysis using UQD data shows that the tidal flat extraction results are generally consistent with those in this study. However, Murray’s extraction method, which includes a 50 km buffer zone around the coastline, mistakenly classifies inland features as tidal flats, leading to significant discrepancies on the land side. The method proposes in this study effectively eliminates interference from inland water bodies and terrestrial features, improving the accuracy of tidal flat extraction.
The total area of China’s tidal flats decreased from 8300.34 km2 in 2018 to 8151.54 km2 in 2023, a reduction of 148.80 km2. Among the 12 regions, only Zhejiang, Shanghai, and Fujian had increases in tidal flat area. Jiangsu, Shandong, and Liaoning experienced the largest decreases. In 2023, the tidal flat area in descending order is Jiangsu, Zhejiang, Shandong, Fujian, Liaoning, Guangdong, Shanghai, Guangxi, Taiwan, Hebei, Hainan and Tianjin.
In 2023, 54.88% of China’s tidal flats were distributed in estuaries and bays, with 22.43% in estuaries and 32.45% in bays. Although Jiangsu province has the largest tidal flat area, only 5.25% is located in estuaries and bays. Excluding Jiangsu, 72.64% of China’s tidal flats are in estuaries and bays, with 29.74% in estuaries and 42.90% in bays. This distribution pattern aligns with the sediment accumulation characteristics typical of estuaries and bays [50].
Analysis of the shoreline revealed that the total length of China’s tidal flat-adjacent shoreline in 2023 is 10,196.17 km, with artificial shorelines comprising 67.06% of the total. The TFDDI is 2.04, indicating significant human impact and alteration of most tidal flats. Tianjin exhibits the highest development degree at 22.69, likely due to urbanization and industrialization, emphasizing the need to balance ecological protection with economic development in tidal flat resource management.
Future studies should consider incorporating more data sources or higher-resolution imagery to further enhance the temporal and spatial resolution of the multi-source high-quality dense time series image collection, thereby improving the accuracy of tidal flat extraction.

5. Conclusions

Based on the GEE platform, this study constructs a multi-source, high-quality dense time series image collection and applies an improved MSIC-OA algorithm to extract and analyze tidal flats in China for the years 2018 and 2023. The results offer valuable insights for the scientific planning and rational utilization of China’s tidal flat resources. Although the construction of multi-source dense time series image sets provides better opportunities to capture the lowest and highest tides, there is still a discrepancy between the obtained tide images and the actual conditions. Future studies should consider incorporating additional remote sensing images to further enhance the temporal resolution of these image sets. The main conclusions are as follows:
  • The overall classification accuracy of the tidal flat extraction results in China in 2018 is 92.77%, with an area of 8300.34 km2. In 2023, the accuracy improves to 95.19%, with the total area reducing to 8151.54 km2, indicating a decrease of 148.80 km2 from 2018 to 2023.
  • The three provinces with the largest tidal flat area in 2023 are: Jiangsu, Zhejiang and Shandong
  • In 2023, 54.88% of China’s tidal flats are distributed in river and bay areas, and when excluding Jiangsu province, this proportion increases to 72.64%. Most of China’s tidal flats are located near river inlets and bays.
  • The total length of China’s coastline adjacent to tidal flats in 2023 is 10,196.17 km. The development degree of the tidal flats is 2.04, indicating that most tidal flats have been significantly developed and utilized.

Author Contributions

Conceptualization, J.S. and C.T.; methodology, J.S.; software, J.S.; validation, K.M. and J.S.; formal analysis, J.S.; investigation, J.S.; resources, J.S. and C.T.; data curation, J.S.; writing—original draft preparation, J.S.; writing—review and editing, J.S., X.Z., T.Z., K.M. and Y.L.; visualization, J.S.; supervision, C.T.; project administration, C.T.; funding acquisition, T.Z. All authors have read and agreed to the published version of the manuscript.

Funding

Science & Technology Fundamental Resources Investigation Program (Grant No. 2022FY100300).

Data Availability Statement

Data and code associated with this research are available and can be obtained by contacting the corresponding author.

Acknowledgments

The authors thank the editors and reviewers for their helpful comments and valuable suggestions that greatly improved the paper.

Conflicts of Interest

The authors declare no conflicts of interest.

References

  1. Murray, N.J.; Phinn, S.R.; Clemens, R.S.; Roelfsema, C.M.; Fuller, R.A. Continental scale mapping of tidal flats across East Asia using the Landsat archive. Remote Sens. 2012, 4, 3417–3426. [Google Scholar] [CrossRef]
  2. Wang, X.; Xiao, X.; Zou, Z.; Chen, B.; Ma, J.; Dong, J.; Doughty, R.B.; Zhong, Q.; Qin, Y.; Dai, S.; et al. Tracking annual changes of coastal tidal flats in China during 1986–2016 through analyses of Landsat images with Google Earth Engine. Remote Sens. Environ. 2020, 238, 110987. [Google Scholar] [CrossRef]
  3. Barbier, E.B.; Koch, E.W.; Silliman, B.R.; Hacker, S.D.; Wolanski, E.; Primavera, J.; Granek, E.F.; Polasky, S.; Aswani, S.; Cramer, L.A.; et al. Coastal ecosystem-based management with nonlinear ecological functions and values. Science 2008, 319, 321–323. [Google Scholar] [CrossRef]
  4. Dhanjal-Adams, K.L.; Hanson, J.O.; Murray, N.J.; Phinn, S.R.; Wingate, V.R.; Mustin, K.; Lee, J.R.; Allan, J.R.; Cappadonna, J.L.; Studds, C.E.; et al. The distribution and protection of intertidal habitats in Australia. Emu-Austral Ornithol. 2016, 116, 208–214. [Google Scholar] [CrossRef]
  5. Ghosh, S.; Mishra, D.R.; Gitelson, A.A. Long-term monitoring of biophysical characteristics of tidal wetlands in the northern Gulf of Mexico—A methodological approach using MODIS. Remote Sens. Environ. 2016, 173, 39–58. [Google Scholar] [CrossRef]
  6. Tiner, R.W. Tidal Wetlands Primer: An Introduction to Their Ecology, Natural History, Status, and Conservation; University of Massachusetts Press: Amherst, MA, USA, 2013. [Google Scholar]
  7. Murray, N.J.; Ma, Z.; Fuller, R.A. Tidal flats of the Yellow Sea: A review of ecosystem status and anthropogenic threats. Austral Ecol. 2015, 40, 472–481. [Google Scholar] [CrossRef]
  8. Meng, W.; Hu, B.; He, M.; Liu, B.; Mo, X.; Li, H.; Wang, Z.; Zhang, Y. Temporal-spatial variations and driving factors analysis of coastal reclamation in China. Estuar. Coast. Shelf Sci. 2017, 191, 39–49. [Google Scholar] [CrossRef]
  9. Deegan, L.A.; Johnson, D.S.; Warren, R.S.; Peterson, B.J.; Fleeger, J.W.; Fagherazzi, S.; Wollheim, W.M. Coastal eutrophication as a driver of salt marsh loss. Nature 2012, 490, 388–392. [Google Scholar] [CrossRef]
  10. Gardner, R.C.; Finlayson, C. Global Wetland Outlook: State of the World’s Wetlands and Their Services to People; Ramsar Convention Secretariat: Gland, Switzerland, 2018; pp. 2020–2025. [Google Scholar]
  11. Cf, O. Transforming Our World: The 2030 Agenda for Sustainable Development; United Nations: New York, NY, USA, 2015. [Google Scholar]
  12. Arkema, K.K.; Guannel, G.; Verutes, G.; Wood, S.A.; Guerry, A.; Ruckelshaus, M.; Kareiva, P.; Lacayo, M.; Silver, J.M. Coastal habitats shield people and property from sea-level rise and storms. Nat. Clim. Chang. 2013, 3, 913–918. [Google Scholar] [CrossRef]
  13. Zhu, Z.; Vuik, V.; Visser, P.J.; Soens, T.; van Wesenbeeck, B.; van de Koppel, J.; Jonkman, S.N.; Temmerman, S.; Bouma, T.J. Historic storms and the hidden value of coastal wetlands for nature-based flood defence. Nat. Sustain. 2020, 3, 853–862. [Google Scholar] [CrossRef]
  14. Hou, X.Y.; Wu, T.; Hou, W.; Chen, Q.; Wang, Y.; Yu, L. Characteristics of coastline changes in mainland China since the early 1940s. Sci. China Earth Sci. 2016, 59, 1791–1802. [Google Scholar] [CrossRef]
  15. Mao, D.; Wang, Z.; Wu, J.; Wu, B.; Zeng, Y.; Song, K.; Yi, K.; Luo, L. China’s wetlands loss to urban expansion. Land Degrad. Dev. 2018, 29, 2644–2657. [Google Scholar] [CrossRef]
  16. Xu, N.; Gong, P. Significant coastline changes in China during 1991–2015 tracked by Landsat data. Sci. Bull. 2018, 63, 883–886. [Google Scholar] [CrossRef] [PubMed]
  17. Ma, Z.; Melville, D.S.; Liu, J.; Chen, Y.; Yang, H.; Ren, W.; Zhang, Z.; Piersma, T.; Li, B. Rethinking China’s new great wall. Science 2014, 346, 912–914. [Google Scholar] [CrossRef]
  18. Guo, Q.; Pu, R.; Tapley, K.; Cheng, J.; Li, J.; Jiao, T. Impacts of coastal development strategies on long-term coastline changes: A comparison between Tampa Bay, USA and Xiangshan Harbor, China. Pap. Appl. Geogr. 2019, 5, 126–139. [Google Scholar] [CrossRef]
  19. NDRC, Ministry of Natural Resources. The National Major Project Overall Planning of Important Ecosystem Protection and Restoration (2021–2035) [EB/OL]. 12 June 2020. Available online: http://www.gov.cn/zhengce/zhengceku/2020-06/12/content_5518982.htm (accessed on 1 July 2021).
  20. Sun, Z.; Sun, W.; Tong, C.; Zeng, C.; Yu, X.; Mou, X. China’s coastal wetlands: Conservation history, implementation efforts, existing issues and strategies for future improvement. Environ. Int. 2015, 79, 25–41. [Google Scholar] [CrossRef]
  21. Xu, W.; Xiao, Y.; Zhang, J.; Yang, W.; Zhang, L.; Hull, V.; Wang, Z.; Zheng, H.; Liu, J.; Polasky, S.; et al. Reply to Yang et al.: Coastal wetlands are not well represented by protected areas for endangered birds. Proc. Natl. Acad. Sci. USA 2017, 114, E5493. [Google Scholar] [CrossRef]
  22. Yang, H.; Ma, M.; Thompson, J.R.; Flower, R.J. Protect coastal wetlands in China to save endangered migratory birds. Proc. Natl. Acad. Sci. USA 2017, 114, E5491–E5492. [Google Scholar] [CrossRef]
  23. Zhao, C.; Qin, C.Z.; Teng, J. Mapping large-area tidal flats without the dependence on tidal elevations: A case study of Southern China. ISPRS J. Photogramm. Remote Sens. 2020, 159, 256–270. [Google Scholar] [CrossRef]
  24. Tian, B.; Wu, W.; Yang, Z.; Zhou, Y. Drivers, trends, and potential impacts of long-term coastal reclamation in China from 1985 to 2010. Estuar. Coast. Shelf Sci. 2016, 170, 83–90. [Google Scholar] [CrossRef]
  25. Mueller-Navarra, K.; Milker, Y.; Bunzel, D.; Lindhorst, S.; Friedrich, J.; Arz, H.; Schmiedl, G. Evolution of a salt marsh in the southeastern North Sea region–anthropogenic and natural forcing. Estuar. Coast. Shelf Sci. 2019, 218, 268–277. [Google Scholar] [CrossRef]
  26. Jiang, W.; Lv, J.; Wang, C.; Chen, Z.; Liu, Y. Marsh wetland degradation risk assessment and change analysis: A case study in the Zoige Plateau, China. Ecol. Indic. 2017, 82, 316–326. [Google Scholar] [CrossRef]
  27. Cozzoli, F.; Smolders, S.; Eelkema, M.; Ysebaert, T.; Escaravage, V.; Temmerman, S.; Meire, P.; Herman, P.M.; Bouma, T.J. A modeling approach to assess coastal management effects on benthic habitat quality: A case study on coastal defense and navigability. Estuar. Coast. Shelf Sci. 2017, 184, 67–82. [Google Scholar] [CrossRef]
  28. Xu, Y.; Cai, Y.; Sun, T.; Yang, Z.; Hao, Y. Coupled hydrodynamic and ecological simulation for prognosticating land reclamation impacts in river estuaries. Estuar. Coast. Shelf Sci. 2018, 202, 290–301. [Google Scholar] [CrossRef]
  29. Wang, Y.P.; Gao, S.; Jia, J.; Thompson, C.E.; Gao, J.; Yang, Y. Sediment transport over an accretional intertidal flat with influences of reclamation, Jiangsu coast, China. Mar. Geol. 2012, 291, 147–161. [Google Scholar] [CrossRef]
  30. Garcia-Oliva, M.; Hooper, T.; Djordjević, S.; Belmont, M. Exploring the implications of tidal farms deployment for wetland-birds habitats in a highly protected estuary. Mar. Policy 2017, 81, 359–367. [Google Scholar] [CrossRef]
  31. de Vriend, H.J. Ecosystem-based coastal defence in the face of global change. Nat. Int. Wkly. J. Sci. 2013, 504, 79–83. [Google Scholar]
  32. Campbell, A.; Wang, Y. High spatial resolution remote sensing for salt marsh mapping and change analysis at Fire Island National Seashore. Remote Sens. 2019, 11, 1107. [Google Scholar] [CrossRef]
  33. Sagar, S.; Roberts, D.; Bala, B.; Lymburner, L. Extracting the intertidal extent and topography of the Australian coastline from a 28 year time series of Landsat observations. Remote Sens. Environ. 2017, 195, 153–169. [Google Scholar] [CrossRef]
  34. Murray, N.J.; Clemens, R.S.; Phinn, S.R.; Possingham, H.P.; Fuller, R.A. Tracking the rapid loss of tidal wetlands in the Yellow Sea. Front. Ecol. Environ. 2014, 12, 267–272. [Google Scholar] [CrossRef]
  35. Murray, N.J.; Phinn, S.R.; DeWitt, M.; Ferrari, R.; Johnston, R.; Lyons, M.B.; Clinton, N.; Thau, D.; Fuller, R.A. The global distribution and trajectory of tidal flats. Nature 2019, 565, 222–225. [Google Scholar] [CrossRef] [PubMed]
  36. Han, Q.; Niu, Z.; Wu, M.; Wang, J. Remote-sensing monitoring and analysis of China intertidal zone changes based on tidal correction. Chin. Sci. Bull. 2019, 64, 456–473. [Google Scholar]
  37. Zhang, H.; Jiang, Q.; Xu, J. Coastline Extraction Using Support Vector Machine from Remote Sensing Image. J. Multimed. 2013, 8, 175–182. [Google Scholar]
  38. Zhang, D.; Liu, G.; Hu, W. Mapping Tidal Flats with Landsat 8 images and Google earth engine: A case study of the China’s Eastern Coastal Zone circa 2015. Remote Sens. 2019, 11, 924. [Google Scholar] [CrossRef]
  39. Cao, W.; Zhou, Y.; Li, R.; Li, X. Mapping changes in coastlines and tidal flats in developing islands using the full time series of Landsat images. Remote Sens. Environ. 2020, 239, 111665. [Google Scholar] [CrossRef]
  40. Wang, X.; Xiao, X.; Zou, Z.; Hou, L.; Qin, Y.; Dong, J.; Doughty, R.B.; Chen, B.; Zhang, X.; Chen, Y.; et al. Mapping coastal wetlands of China using time series Landsat images in 2018 and Google Earth Engine. ISPRS J. Photogramm. Remote Sens. 2020, 163, 312–326. [Google Scholar] [CrossRef]
  41. Li, H.; Jia, M.; Zhang, R.; Ren, Y.; Wen, X. Incorporating the plant Phenological trajectory into mangrove species mapping with dense time series Sentinel-2 imagery and the Google earth engine platform. Remote Sens. 2019, 11, 2479. [Google Scholar] [CrossRef]
  42. Jia, M.; Wang, Z.; Mao, D.; Ren, C.; Wang, C.; Wang, Y. Rapid, robust, and automated mapping of tidal flats in China using time series Sentinel-2 images and Google Earth Engine. Remote Sens. Environ. 2021, 255, 112285. [Google Scholar] [CrossRef]
  43. Mao, D.; Liu, M.; Wang, Z.; Li, L.; Man, W.; Jia, M.; Zhang, Y. Rapid Invasion of Spartina Alterniflora in the Coastal Zone of Mainland China: Spatiotemporal Patterns and Human Prevention. Sensors 2019, 19, 2308. [Google Scholar] [CrossRef]
  44. Liu, J.; Kuang, W.; Zhang, Z.; Xu, X.; Qin, Y.; Ning, J.; Zhou, W.; Zhang, S.; Li, R.; Yan, C.; et al. Spatiotemporal characteristics patterns causes of land-use changes in China since the late 1980s. J. Geogr. Sci. 2014, 24, 195–210. [Google Scholar] [CrossRef]
  45. Lic, J.; Liul, Y.; Wangj, H. Comparison of two methods of fusing remote sensing images with fidelity of spectral information. J. Image Graph. 2004, 9, 1376–1385. [Google Scholar]
  46. Otsu, N. A threshold selection method from gray-level histograms. IEEE Trans. Syst. Man Cybern. 1979, 9, 62. [Google Scholar] [CrossRef]
  47. Xu, H. Modification of normalized difference water index (NDWI) to enhance open water features in remotely sensed imagery. Int. J. Remote Sens. 2006, 27, 3025–3033. [Google Scholar] [CrossRef]
  48. Tucker, C.J. Red and photographic infrared linear combinations for monitoring vegetation. Remote Sens. Environ. 1979, 8, 127–150. [Google Scholar] [CrossRef]
  49. Zhong, L.; Hu, L.; Zhou, H. Deep learning based multi-temporal crop classification. Remote Sens. Environ. 2019, 221, 430–443. [Google Scholar] [CrossRef]
  50. Wang, Y.; Zhu, D.K. Tidal Flats in China, Oceanology of China Seas; Springer: Berlin/Heidelberg, Germany, 1994; pp. 445–456. [Google Scholar]
Figure 1. Study area.
Remotesensing 16 03607 g001
Figure 2. Technical route.
Remotesensing 16 03607 g002
Figure 3. The comparison of the accuracy of the extraction results of the tidal flat in Liao River Estuary with the UQD map. (a) the tidal flat extraction result of this study; (b) the tidal flat extraction result of UQD map; (c) the magnification of the typical area of this study; (d) the magnification of the typical area of UQD map.
Remotesensing 16 03607 g003
Figure 4. The comparison of the accuracy of the extraction results of the tidal flat in Caofeidian with the UQD map. (a) the tidal flat extraction result of this study; (b) the tidal flat extraction result of UQD map; (c) the magnification of the typical area of this study; (d) the magnification of the typical area of UQD map.
Remotesensing 16 03607 g004
Figure 5. The comparison of the accuracy of the extraction results of the tidal flat in the radiating shoal tidal flat area in central Jiangsu with the UQD map. (a) the tidal flat extraction result of this study; (b) the tidal flat extraction result of UQD map.
Remotesensing 16 03607 g005
Figure 6. Stacked percentage chart of tidal flat classification.
Remotesensing 16 03607 g006
Figure 7. Distribution map of tidal flats in China.
Remotesensing 16 03607 g007
Figure 8. The area and variation of tidal flats in 2018 and 2023: (a) area in 2018 and 2023; (b) variation in area from 2018 to 2023.
Remotesensing 16 03607 g008
Figure 9. Shoreline types and development intensity in China: (a) shoreline length and proportion; (b) stacked percentage chart of shoreline classification; (c) TFDDI.
Remotesensing 16 03607 g009
Table 1. Satellite image data parameters.
SatelliteBandResolution/m
Sentinel-2 (MSI)B3 (Green)10
B4 (Red)10
B8 (NIR)10
B11 (SWIR1)20
Landsat 8 (OLI)B3 (Green)30
B4 (Red)30
B5 (NIR)30
B6 (SWIR1)30
B8 (Panchromatic)15
Landsat 9 (OLI-2)B3 (Green)30
B4 (Red)30
B5 (NIR)30
B6 (SWIR1)30
B8 (Panchromatic)15
Table 2. Shoreline classification system.
Primary ClassificationSecondary ClassificationInterpretation SymbolDescription
Natural ShorelineSandy ShorelineRemotesensing 16 03607 i001Located in sandy beach areas
Mud ShorelineRemotesensing 16 03607 i002Located in mud or silt-sand mudflat areas
Rocky ShorelineRemotesensing 16 03607 i003Located in rocky coastal areas
Artificial ShorelineEngineered EmbankmentRemotesensing 16 03607 i004Located in urban and transportation construction areas, including shorelines formed by port and dock construction
Non-engineered EmbankmentRemotesensing 16 03607 i005Regularly distributed patches such as aquaculture water bodies, farmland, and salt fields on the inland side
Table 3. Confusion matrix and precision analysis.
Reference Category
TFNon-TFTotalUse. Acc/%Pro. Acc/%Ove. Acc/%F1 Score
2018Image CategoryTF2772308308090.0096.9892.770.88
Non-TF4156505692094.0095.48
Total3187681310,000
2023TF2752272302491.0192.9495.190.92
Non-TF2096767697697.0096.14
Total2961703910,000
Table 4. Area and proportion of tidal flats in China in 2023.
RegionArea (km2)Proportion (%)
Liaoning923.4411.33
Hebei222.632.73
Tianjin55.330.68
Shandong1150.0714.11
Jiangsu2149.0126.36
Shanghai384.944.72
Zhejiang1189.4914.59
Fujian1006.1312.34
Guangdong425.455.22
Guangxi329.634.04
Hainan77.900.96
Taiwan237.522.91
China8151.54100.00
Disclaimer/Publisher’s Note: The statements, opinions and data contained in all publications are solely those of the individual author(s) and contributor(s) and not of MDPI and/or the editor(s). MDPI and/or the editor(s) disclaim responsibility for any injury to people or property resulting from any ideas, methods, instructions or products referred to in the content.

