Article

Impact of Long-Term Drought on Surface Water and Water Balance Variations in Iran: Insights from Highland and Lowland Regions

1
Department of Civil, Constructional and Environmental Engineering, Sapienza University of Rome, 00185 Rome, Italy
2
School of Engineering, Università degli Studi della Basilicata, Via Nazario Sauro 85, 85100 Potenza, Italy
3
Department of Geography and Environmental Sustainability, University of Oklahoma, Norman, OK 73019, USA
4
Department of Urban Studies and Planning, University of Maryland, College Park, MD 20740, USA
5
Research Center for Digital Mountain and Remote Sensing Application, Institute of Mountain Hazards and Environment, Chinese Academy of Sciences, Chengdu 610041, China
6
School of Surveying and Geospatial Engineering, University of Tehran, Tehran 1439957131, Iran
7
Geospatial Surveying Engineer, Transport for London, London SE10 0ES, UK
8
Department of Geography and Geology, University of Turku, 20014 Turku, Finland
9
Institute of Methodologies for Environmental Analysis, Italian National Research Council, C/da S. Loja, 85050 Tito Scalo, Italy
*
Author to whom correspondence should be addressed.
Remote Sens. 2024, 16(19), 3636; https://doi.org/10.3390/rs16193636 (registering DOI)
Submission received: 4 July 2024 / Revised: 28 August 2024 / Accepted: 30 August 2024 / Published: 29 September 2024

Abstract

:
Droughts have a significant impact on surface water resources, especially in arid and semi-arid regions. Computational and data handling limitations have constrained previous time-series analyses. However, advances in cloud computing services and remote sensing technology allow for a more detailed examination. This study integrates multi-source satellite-derived data with a cloud computing platform to assess the impact of long-term drought on surface water and water balance in Iran from 2000 to 2021. Given the varying effects of drought on highlands and lowlands, the analysis was conducted at three levels: the entire country, the highlands, and the lowlands. The results of this study reveal imbalances between water balance from 2000 to 2021, with notable disparities observed during 2000–2007, 2009–2014, and 2016–2019. The results also show varying drought trends (e.g., −1.22 in 2000 and −0.73 in 2021), with severe conditions captured in 2008 (SPI: −1.92). Additionally, our analysis illustrated that lowlands were more impacted by droughts compared to highlands. Long-term drought and permanent surface water had correlation values of 0.33 across the country, 0.33 in the highlands, and 0.31 in the lowlands. For seasonal surface water, coefficients were 0.18 for the entire country, 0.16 for the highlands, and 0.18 for the lowlands. Overall, long-term drought had minimal effect on reducing surface water. These findings show that drought is only part of the explanation for the decrease in surface water resources.

1. Introduction

Drought is characterized by a shortage of available water compared to typical conditions, with “normal” being determined by an average set over a specific period or a defined threshold [1,2]. Drought is a climate-related occurrence manifesting across various time scales and influencing the hydrological cycle [3]. The intensification of the global water cycle, driven by both climate change and increased human activities, has accelerated the escalation of droughts since the 1950s [4]. Increases in precipitation variability and temperature have resulted in more frequent and severe droughts, affecting larger areas around the world [5]. Characterizing drought effects is challenging because they vary spatially and temporally and have direct or indirect effects [6]. Droughts, regardless of the form (i.e., agricultural, meteorological, socioeconomic, ecological, and hydrological droughts), significantly impact socio-economic and ecological systems [7]. Drought also impacts water balance due to drastic decreases in precipitation over an extended period [8,9]. Additionally, drought can affect both water quantity and quality. In the domain of water quality, reduced flows can lead to a decrease in organic matter, nutrients, and sediment pathways in surface water streams. The occurrence of droughts also results in limited water availability to support and sustain various social, environmental, and economic services [10]. This is crucial as many regions are anticipated to witness more frequent and severe droughts due to future climate change [11,12]. Consequently, drought monitoring and mitigation have become major research topics [11].
While drought occurs throughout the world, its frequency and intensity are higher in arid and semi-arid regions because of the extreme climate variability found in these areas [13]. Water shortages and low per-capita water allocations are typical characteristics of arid and semi-arid environments [14]. Iran, which has become drier over the last 60 years with its arid and semi-arid climate [15], has encountered a severe water crisis in recent decades [16]. For instance, since 2000, the size of Iran’s largest lake, Lake Urmia, has drastically decreased [17,18]. Significant changes have also occurred over the past few decades in other Iranian surface water bodies, including Lake Shadeghan in the southwest [19], Lake Bakhtegan in the center [20], and Lake Hamoun in the east [21]. These significant water losses pose unprecedented challenges and difficulties to sustainable development and ecosystem health of the country. Consequently, Iran’s drought monitoring has drawn the attention of numerous scholars [22,23,24,25]. However, these studies either did not investigate the influence of drought on water balance or only focused on local scales (basin-scale), leaving a research gap concerning how drought has impacted surface water and water balance in Iran over the past few decades.
Historically, in situ station-based measurements, such as the Palmer drought severity index [26], were the main approaches used for drought monitoring. A revolutionary change in drought observation happened towards the end of the twentieth century with the advent of earth observation and remote sensing technologies, especially with the launch of the Landsat satellite in 1972 [11]. Satellite-based methods not only record meteorological data but also track Earth’s surface changes, like surface water extension and dynamics, offering a wealth of contextual information for drought monitoring [22]. Remote sensing has thus reshaped the field by enabling the observation and tracking of important drought-related variables over broader temporal and spatial scales than were previously impossible with traditional techniques [27]. The literature demonstrates the effective application of remote sensing data for drought monitoring at all scales, from local to global [22,28,29]. Commonly employed indices such as the Standardized Precipitation Index (SPI) [30], Standardized Water-level Index (SWI) [31], and Vegetation Condition Index (VCI) [32] serve to measure meteorological, hydrological, and agricultural droughts, respectively. The SPI method focuses solely on precipitation in its computation, offering versatility across various time scales without statistical constraints [33]. By integrating cumulative precipitation deficits at different spatiotemporal scales, SPI emerges as a multi-scalar tool [34]. Although SPI operates under the assumption that rainfall variability predominantly drives droughts, with other factors such as temperature considered stationary, its capacity to detect drought across different time scales (1, 3, 6, 12, and 24 months) underscores its utility in monitoring diverse drought types (meteorological, agricultural, and hydrological) [35]. Given the objective of this study to examine the nexus between drought and surface water resources, the SPI emerges as particularly valuable for its adeptness in capturing drought dynamics across various temporal scales [36,37].
Combining data from multiple remote sensing sources can boost research accuracy by taking advantage of the strengths of different datasets while minimizing their weaknesses [38]. Satellite-derived Moderate Resolution Imaging Spectroradiometer (MODIS) time series imagery, along with Landsat and Sentinel-2, are widely used satellite-derived data for large-scale drought monitoring [39]. MODIS data, despite their lower resolution, are incredibly useful for large-scale drought monitoring because they offer a high revisit frequency. On the other hand, Landsat and Sentinel-2 provide higher-resolution images (30 m and 10 m, respectively), making them great for extracting smaller changes. When studying a large-scale area (e.g., national scale), processing and assessing big remote sensing data is mandatory [40,41]. GEE is a geospatial processing platform providing free access to large volumes of remote sensing imagery and pre-processed products, rapid parallel processing, and advanced machine learning algorithms [42]. Studies have shown that combining multi-source remote sensing data with GEE can be very effective in environmental monitoring studies [40,43]. Khan and Gilani [29] used multi-source remote sensing data for global monitoring of drought based on GEE. Therefore, integrating multi-source satellite-derived data and cloud computing platforms can enhance our understanding of droughts and their potential link with surface water area and water balance fluctuations.
Drought status varies not just among regions, but also between lowlands and highlands [44,45]. More specifically, drought unquestionably affects both lowlands and highlands, but its severity varies between these environments [46]. As a result, the goal of this research is to not only investigate the drought trend in Iran as a whole but also in the highlands and lowlands, offering precise information on how droughts occur in Iran. Overall, the objectives of this study can be described as follows:
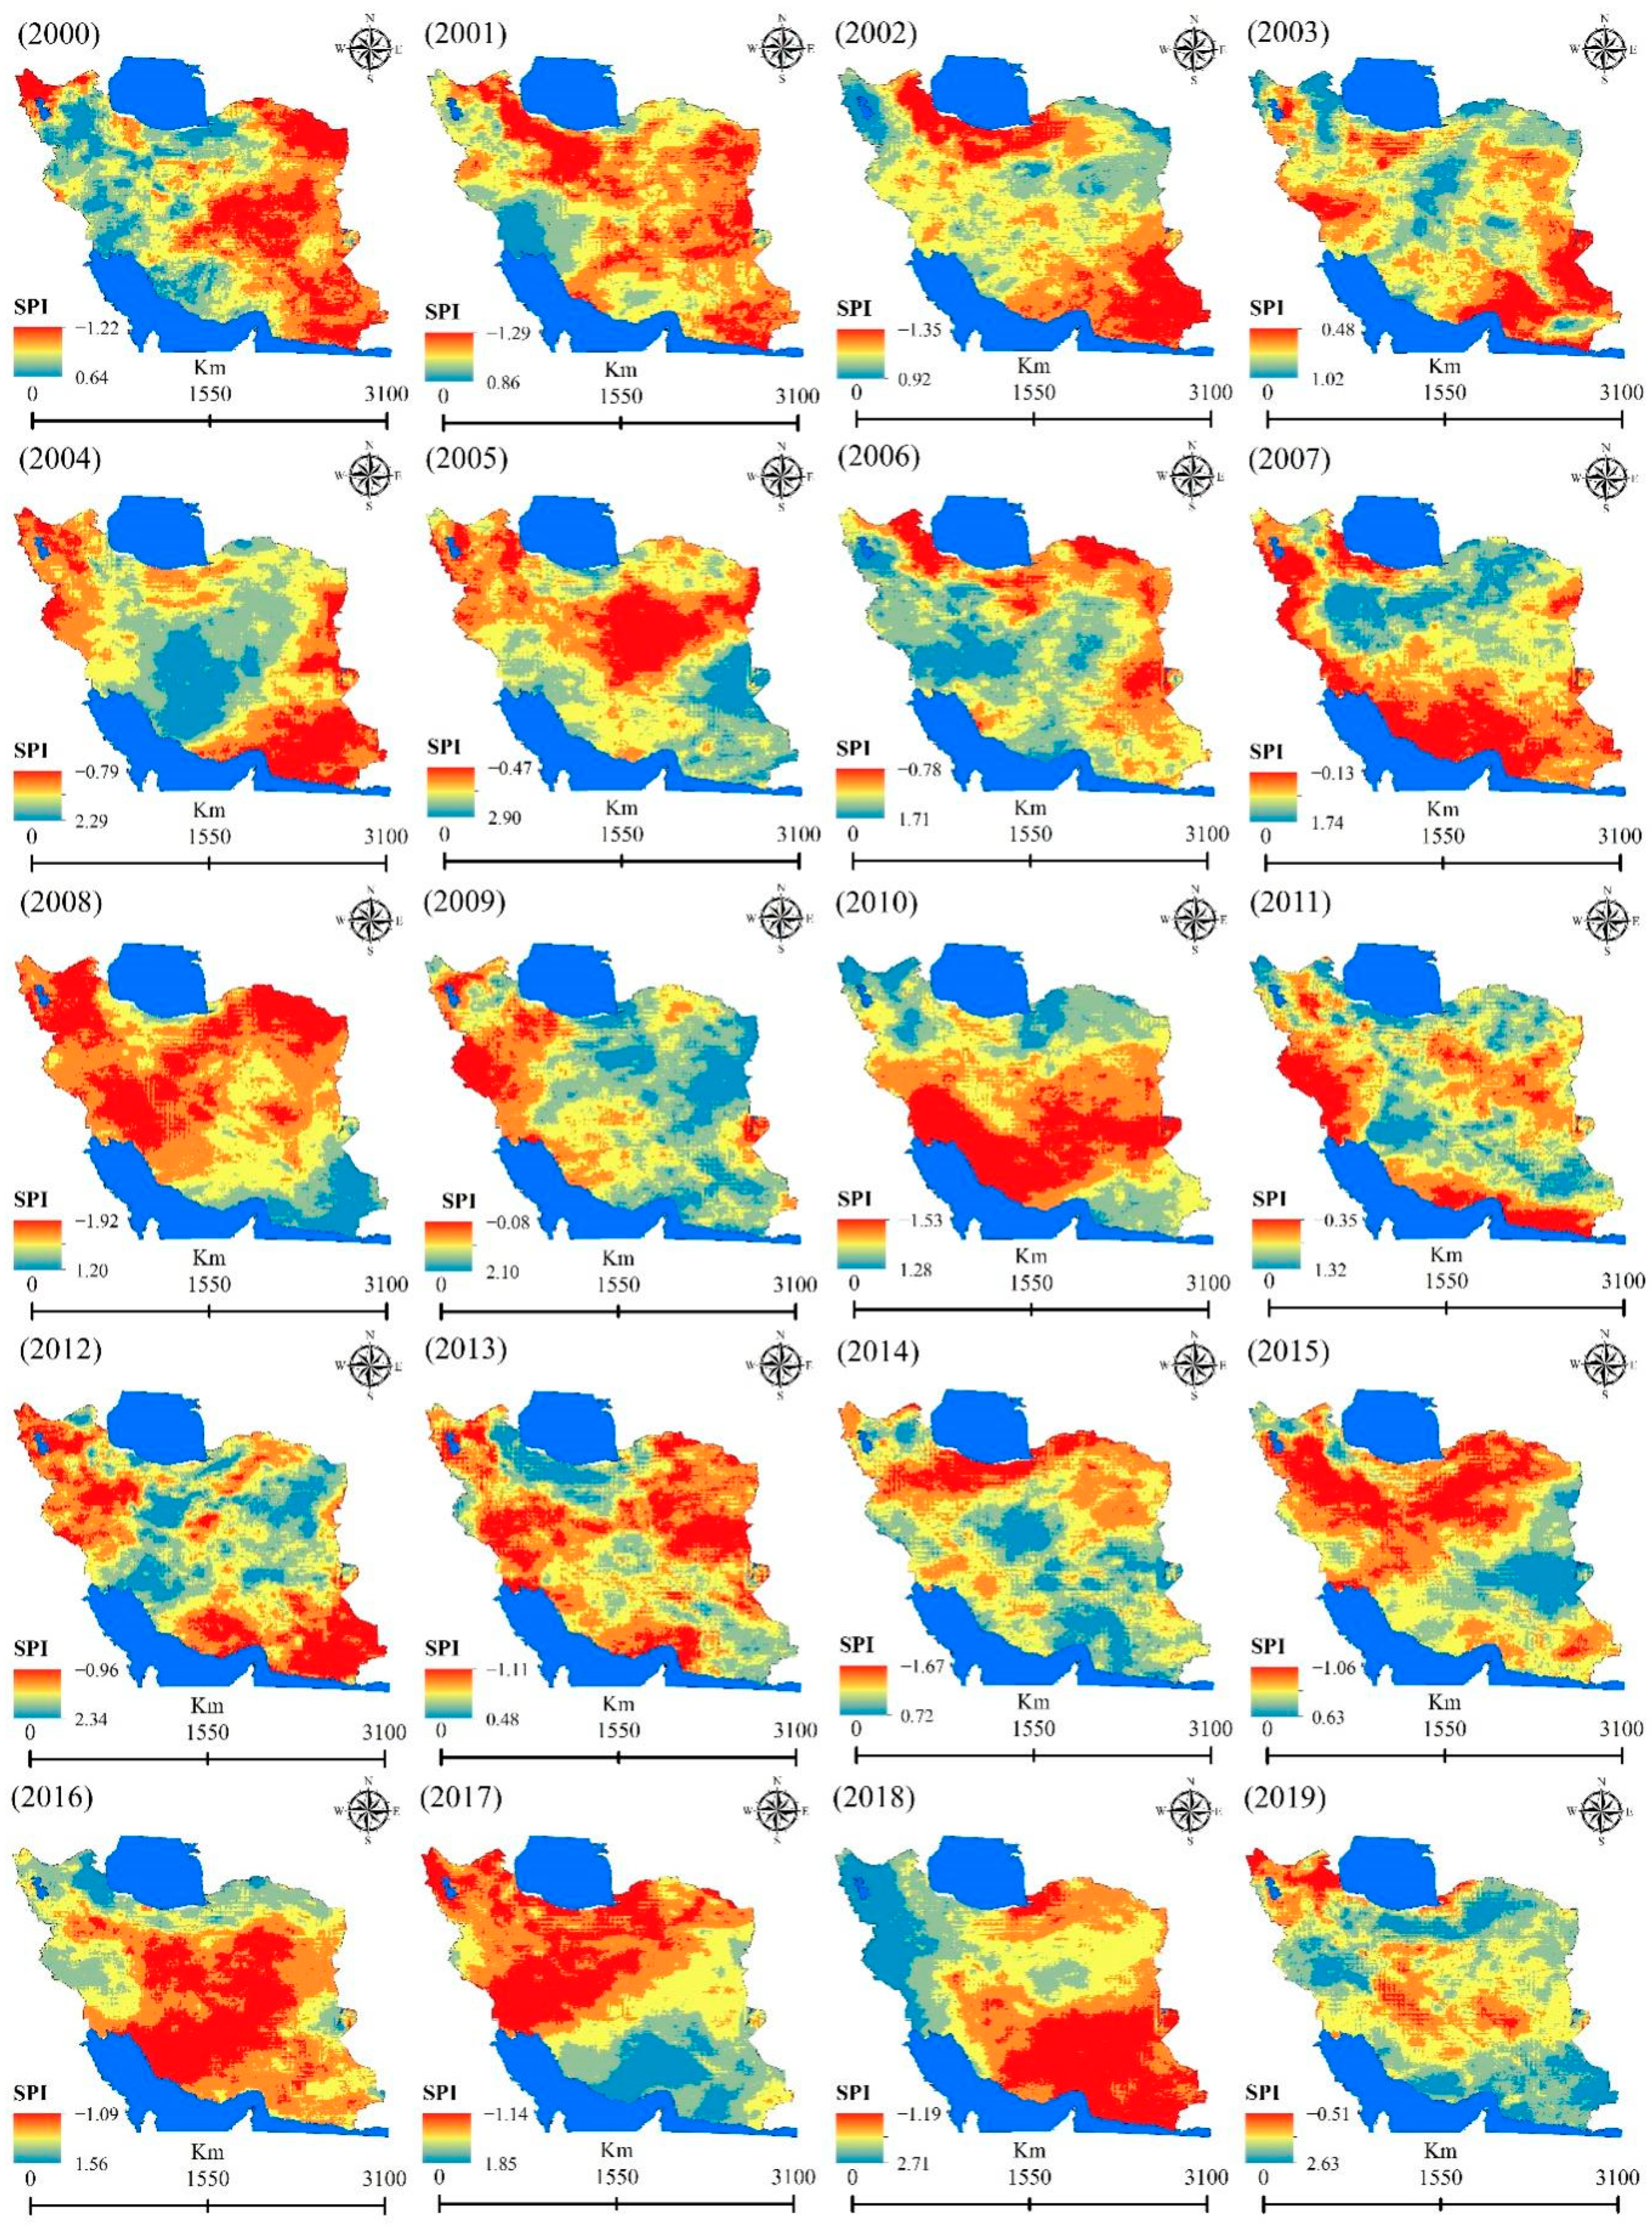
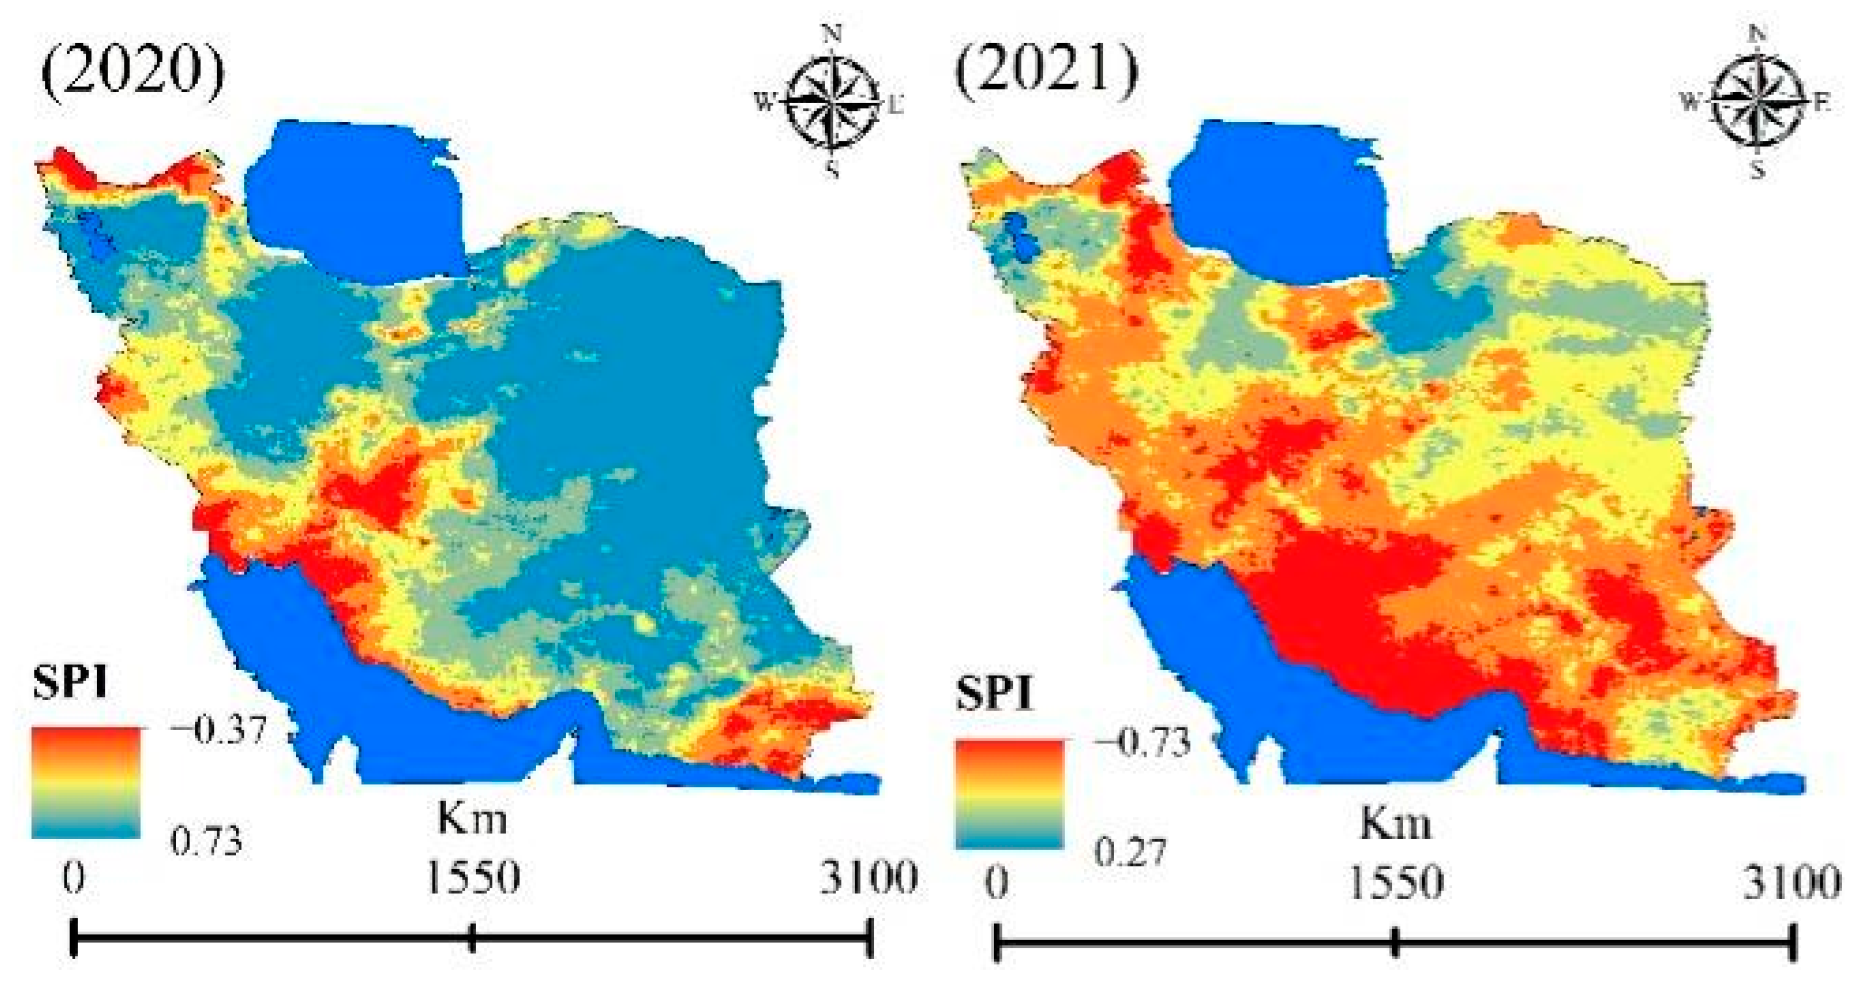
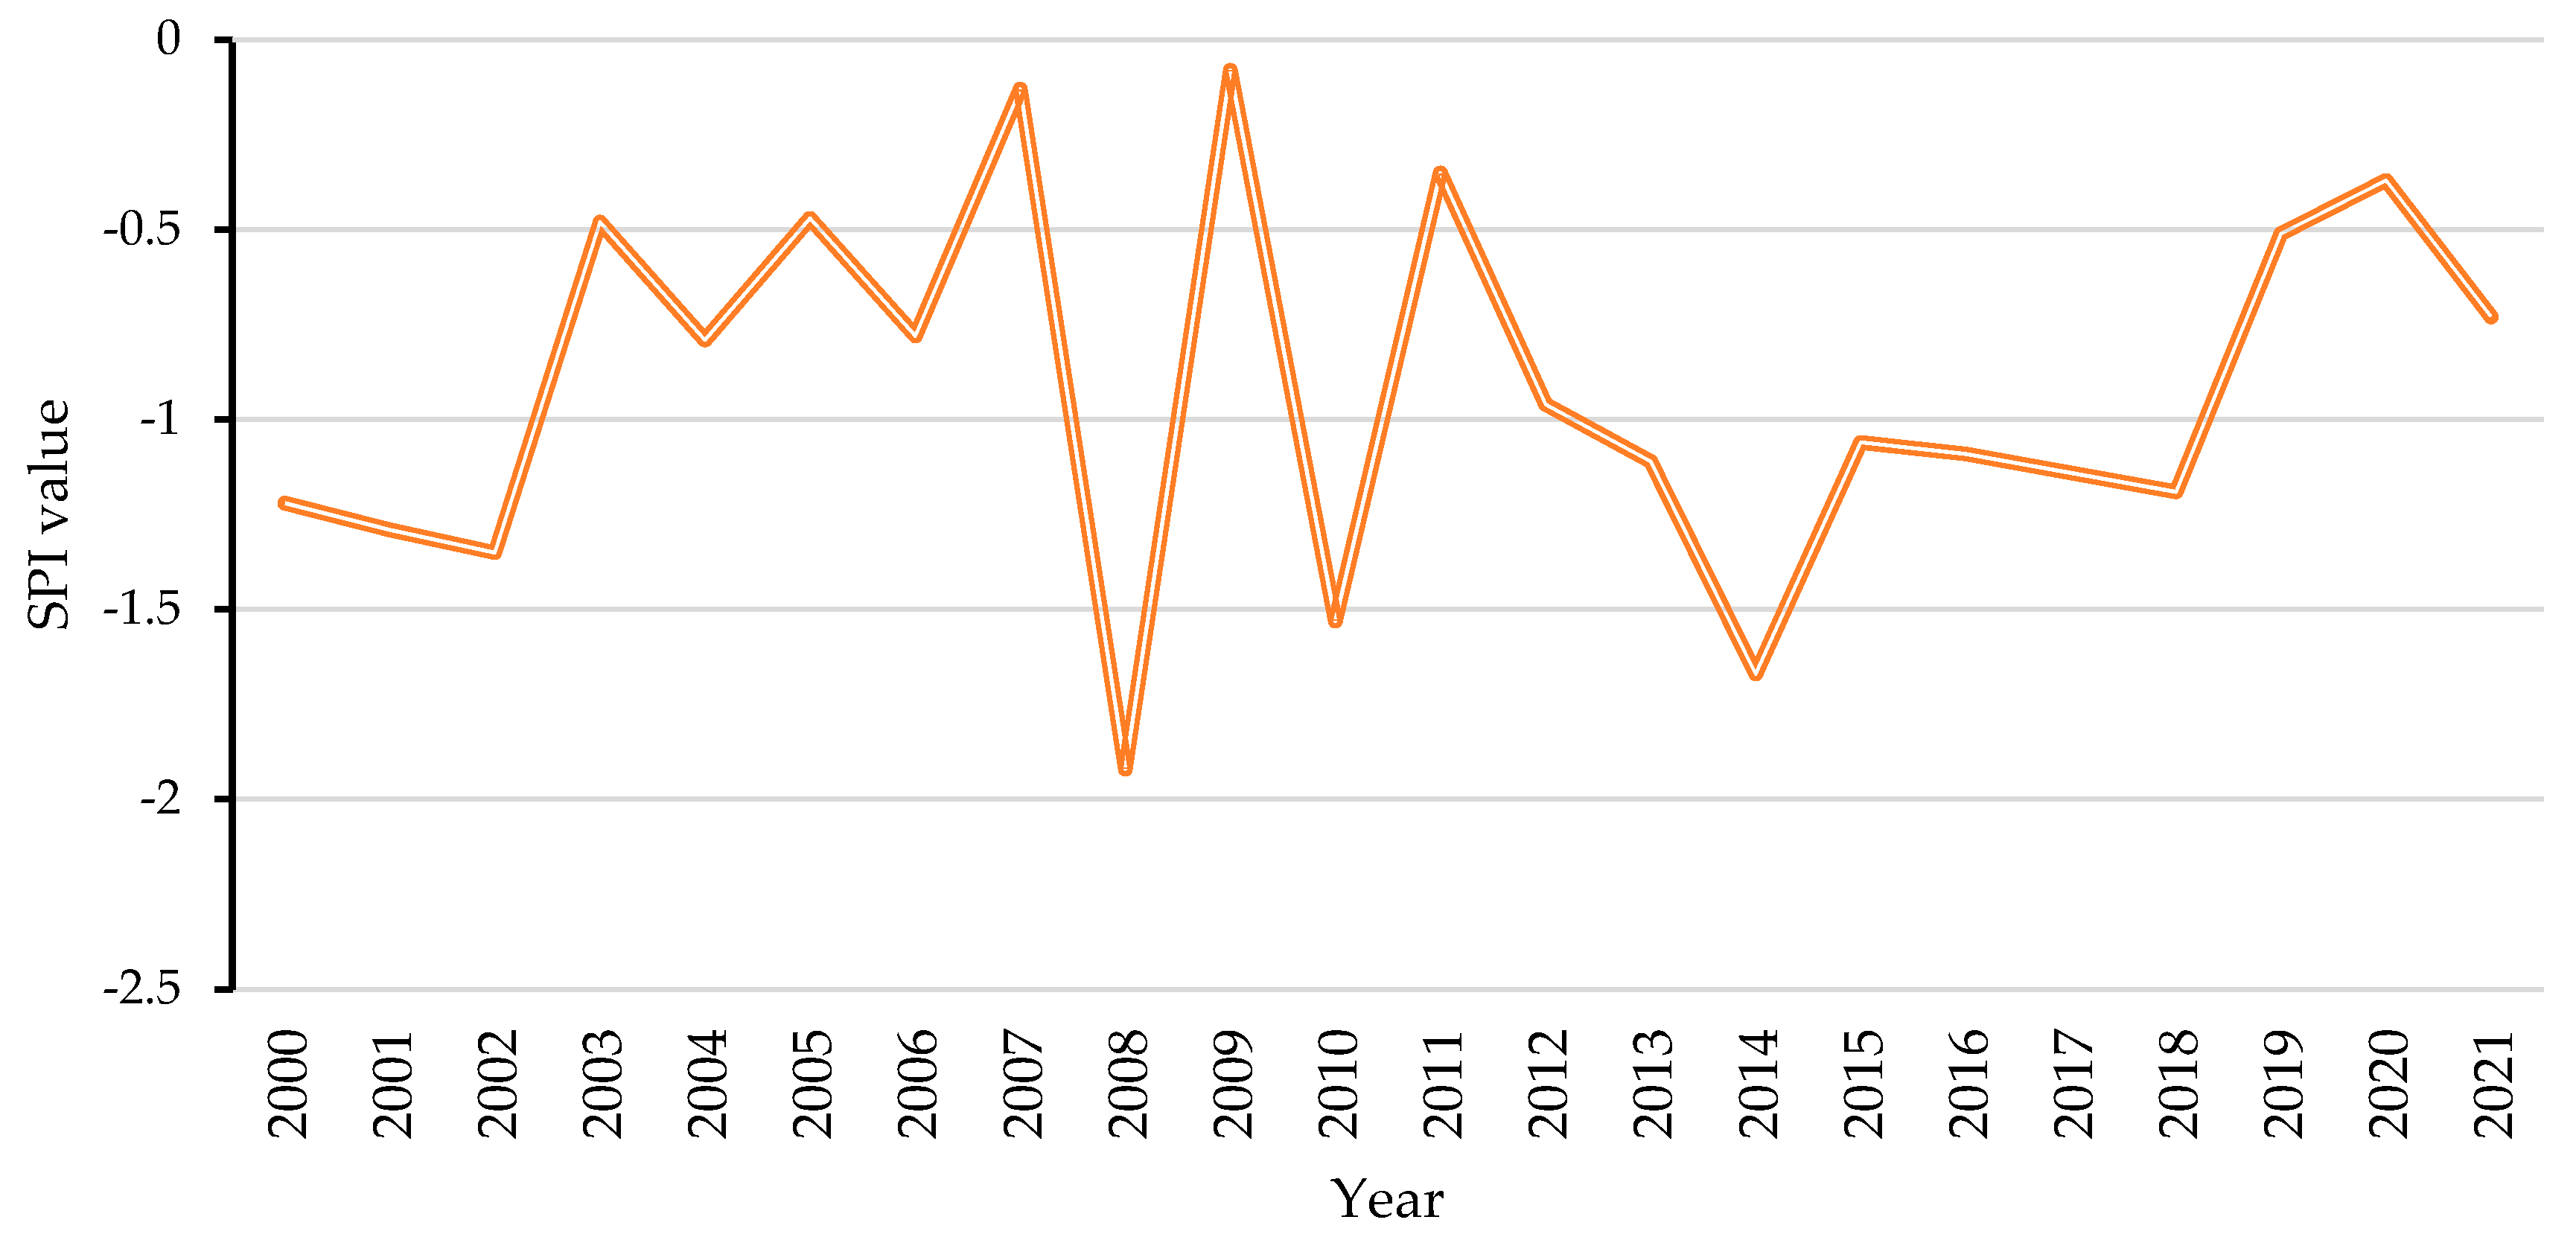
  • Track the drought trend in Iran from 2000 to 2021, and assess drought intensity for the entire country, the lowlands, and the highlands.
  • Examine the possible impact of drought on surface water and water balance changes in Iran over the last two decades.
  • Determine which is more affected by drought: surface water in highlands or lowlands.

2. Materials and Methods

2.1. Study Area

Iran is one of the most developed and populated countries in Western Asia, covering a territory of approximately 1,648,195 km2 and extending from 44° to 63° E and 25° to 40° N (Figure 1). The country’s average annual precipitation stands at around 250 mm/year, showing a decreasing trend in recent years [47]. Precipitation levels vary from 50 mm/year in hyper-arid low-elevation regions, such as the Kavir and Lut deserts, to 1600 mm/year in northern areas adjacent to the Caspian Sea [48,49]. Most of Iran experiences an arid climate characterized by scant rainfall and high potential evapotranspiration. Temperature fluctuations across Iran are considerable due to its diverse topography. Winters in the northwest are notably frigid, with temperatures plummeting as low as −20 °C, whereas the southwest endures scorching summers, with temperatures soaring close to 50 °C.
Iran’s landscape is characterized by rugged, mountainous terrain enclosing elevated interior basins and flats. The prominent Zagros Mountains form the primary mountain chain extending from the northwest to the southeast. Along the Caspian Sea coast lies in the north another mountain range, the narrow yet lofty Alborz Mountains. At the heart of Iran lies the Central Plateau, comprising several enclosed basins. The plateau maintains an average elevation of about 900 m, with towering mountains exceeding 3000 m. To the east, the plateau is dominated by two salt deserts, the Dasht-e Kavir (Great Salt Desert) and the Dasht-e Lut. Iran’s lowlands are limited to the southwest with the Khuzestan Plain and coastal plain to the north with the Caspian Sea. The Persian Gulf coast to the south of Khuzestan and the Gulf of Oman coast lack significant plains due to the Zagros Mountains extending to the shoreline [49].

2.2. Materials

This study used three types of datasets (Table 1) which are freely available on GEE for drought monitoring and analysis of its effects on surface water and water balance variations in Iran between 2000 and 2021. More specifically, the global surface water data (version 1.4) generated by the Joint Research Center (JRC) were employed to monitor various surface water bodies, including permanent, seasonal, dams, and lakes, and changes in this study. We also included the Terra Net Evapotranspiration product of MODIS (MOD16A2GF Version 6.1) in the water balance computation. These data, which have been available since 2000, are generated by the Penman–Monteith equation logic based on daily meteorological reanalysis data and other MODIS products like vegetation property dynamics, albedo, and land cover. Precipitation of CHIRPS product version 2 was also used in this study to calculate SPI and water balance values across the entire country; its accuracy for Iran was validated by [50,51]. CHRIPS provides precipitation time series data from 1981 using in situ station data and satellite imagery.

2.3. Methodology

The entire process (Figure 2) was executed through the GEE cloud computing platform and comprised four primary steps: drought monitoring, surface water area change tracking, water balance change analysis, and examining the possible drought effect on surface water resources and water balance. Given that the rate and impact of drought varies between lowlands and highlands, it is important to highlight that we conducted our research at three levels: the entire nation, lowlands, and highlands. To separate between lowlands and highlands, we determined an elevation threshold of 1500 m, categorizing places above 1500 m as highlands and those below as lowlands. It is crucial to note that this threshold may differ in different parts of the world, as it was determined using the unique elevation conditions in Iran.

2.3.1. Drought Monitoring

This study employed the well-known Standardized Precipitation Index (SPI) [52] to track the trend of drought in Iran from 2000 and 2021. This index, introduced by [30], is designed to evaluate drought severity across various time frames (e.g., 1, 3, 6, 9, 12, 24, and 48 months). The SPI is closely linked to soil moisture over short timescales, while over longer periods, it is related to groundwater levels and reservoir storage. The SPI measures precipitation by comparing observed values to a selected probability distribution, quantifying the deviation from the norm. Typically, raw precipitation data are fitted to a gamma or Pearson Type III distribution and then transformed into a normal distribution [53]. This technique includes standardizing precipitation data collected over specific time intervals by fitting them to an appropriate statistical distribution, often the gamma distribution. Subsequently, the standardized data are transformed into a standard normal distribution [30]. The probability density function for the gamma distribution is utilized in this process.
g x = 1 β α Γ ( α ) x α 1 e x / β
where α represents a shape parameter (α > 0), β indicates a scale parameter (β > 0), x represents the precipitation value (x > 0), and Γ(α) indicates the gamma function, expressed as  0 y α 1 e y d y .
α and β are evaluated based on the following Equation (2):
α = 1 + 1 + 4 A 3 4 A ,   β = x ¯ α
where  A = ln ( x ¯ ) ln ( x ) n  and n is the number of observations in the time series.
Precipitation has a cumulative probability G(x) expressed based on Equation (3):
G x = 0 x g x d x = 0 x x α 1 e x / β d x β α Γ ( α )
By letting  t = x / β , Equation (3) is not a complete gamma function.
G x = 0 x t α 1 e t d t Γ ( α )
The gamma distribution is not defined for x = 0, thus the cumulative probability of 0 precipitation (q) is considered separately and final cumulative probability is calculated based on Equation (5):
H x = q + 1 q G ( x )
To assess SPI, the approximation can be employed to transform the cumulative probability into normal distribution using Equation (6):
S P I = t c 0 + c 1 t + c 2 t 2 1 + d 1 t + d 2 t 2 + d 3 t 3 ,   0 < H ( x ) 0.5
where  t = ln ( 1 / H ( x ) 2 ) .
S P I = t c 0 + c 1 t + c 2 t 2 1 + d 1 t + d 2 t 2 + d 3 t 3 ,   0.5 < H ( x ) 1.0
where  t = ln ( 1 / 1 H ( x ) 2 )    and the values of various variables are  c 0  = 2.515517,  c 1  = 0.802853,  c 2  = 0.010328,  d 1  = 1.43278,  d 2  = 0.189269, and  d 3  = 0.001308.

2.3.2. Surface Water Area Change Tracking

The Joint Research Centre (JRC) released global surface water data employing all available Landsat data in Google Earth Engine (GEE) since 1984 [43]. In this research, we tracked surface water changes over the research area using the yearly water classification (version 1.4) produced by JRC. We employed two senior remote sensing experts to conduct a thorough visual review of the JRC data set since several studies have indicated substantial noise in the data set for the years prior to 2000. Based on our review, the data set for the study area and time period was error-free. Then, based on the objectives of this study, we calculated yearly variations in seasonal and permanent surface water areas across Iran from 2000 to 2021. Once data for the entire nation were acquired, the same procedure was repeated for both highlands and lowlands. In this study, permanent water refers to surface water that is present throughout the entire year, while seasonal water refers to water sources that are available only during certain times of the year.

2.3.3. Water Balance Monitoring

In this study, we used a simple method to calculate the water balance value where the water balance for each pixel in the study area was calculated by differentiating precipitation from evapotranspiration. To this end, we first utilized precipitation data from the CHIRPS product to calculate the precipitation rate on an annual basis. Because the CHIRPS product is only available for each day, we collected all available CHIRPS products for the research area between 1 January and 31 December and calculated the aggregated value for each pixel. Next, to estimate evapotranspiration, we estimated evapotranspiration using the MOD16A2GF Version 6.1 product. We used the same approach to calculate annual evapotranspiration for the study area. Finally, we differentiated precipitation from evapotranspiration. This approach determines if a specific place experiences a water surplus or deficit during a given time period.

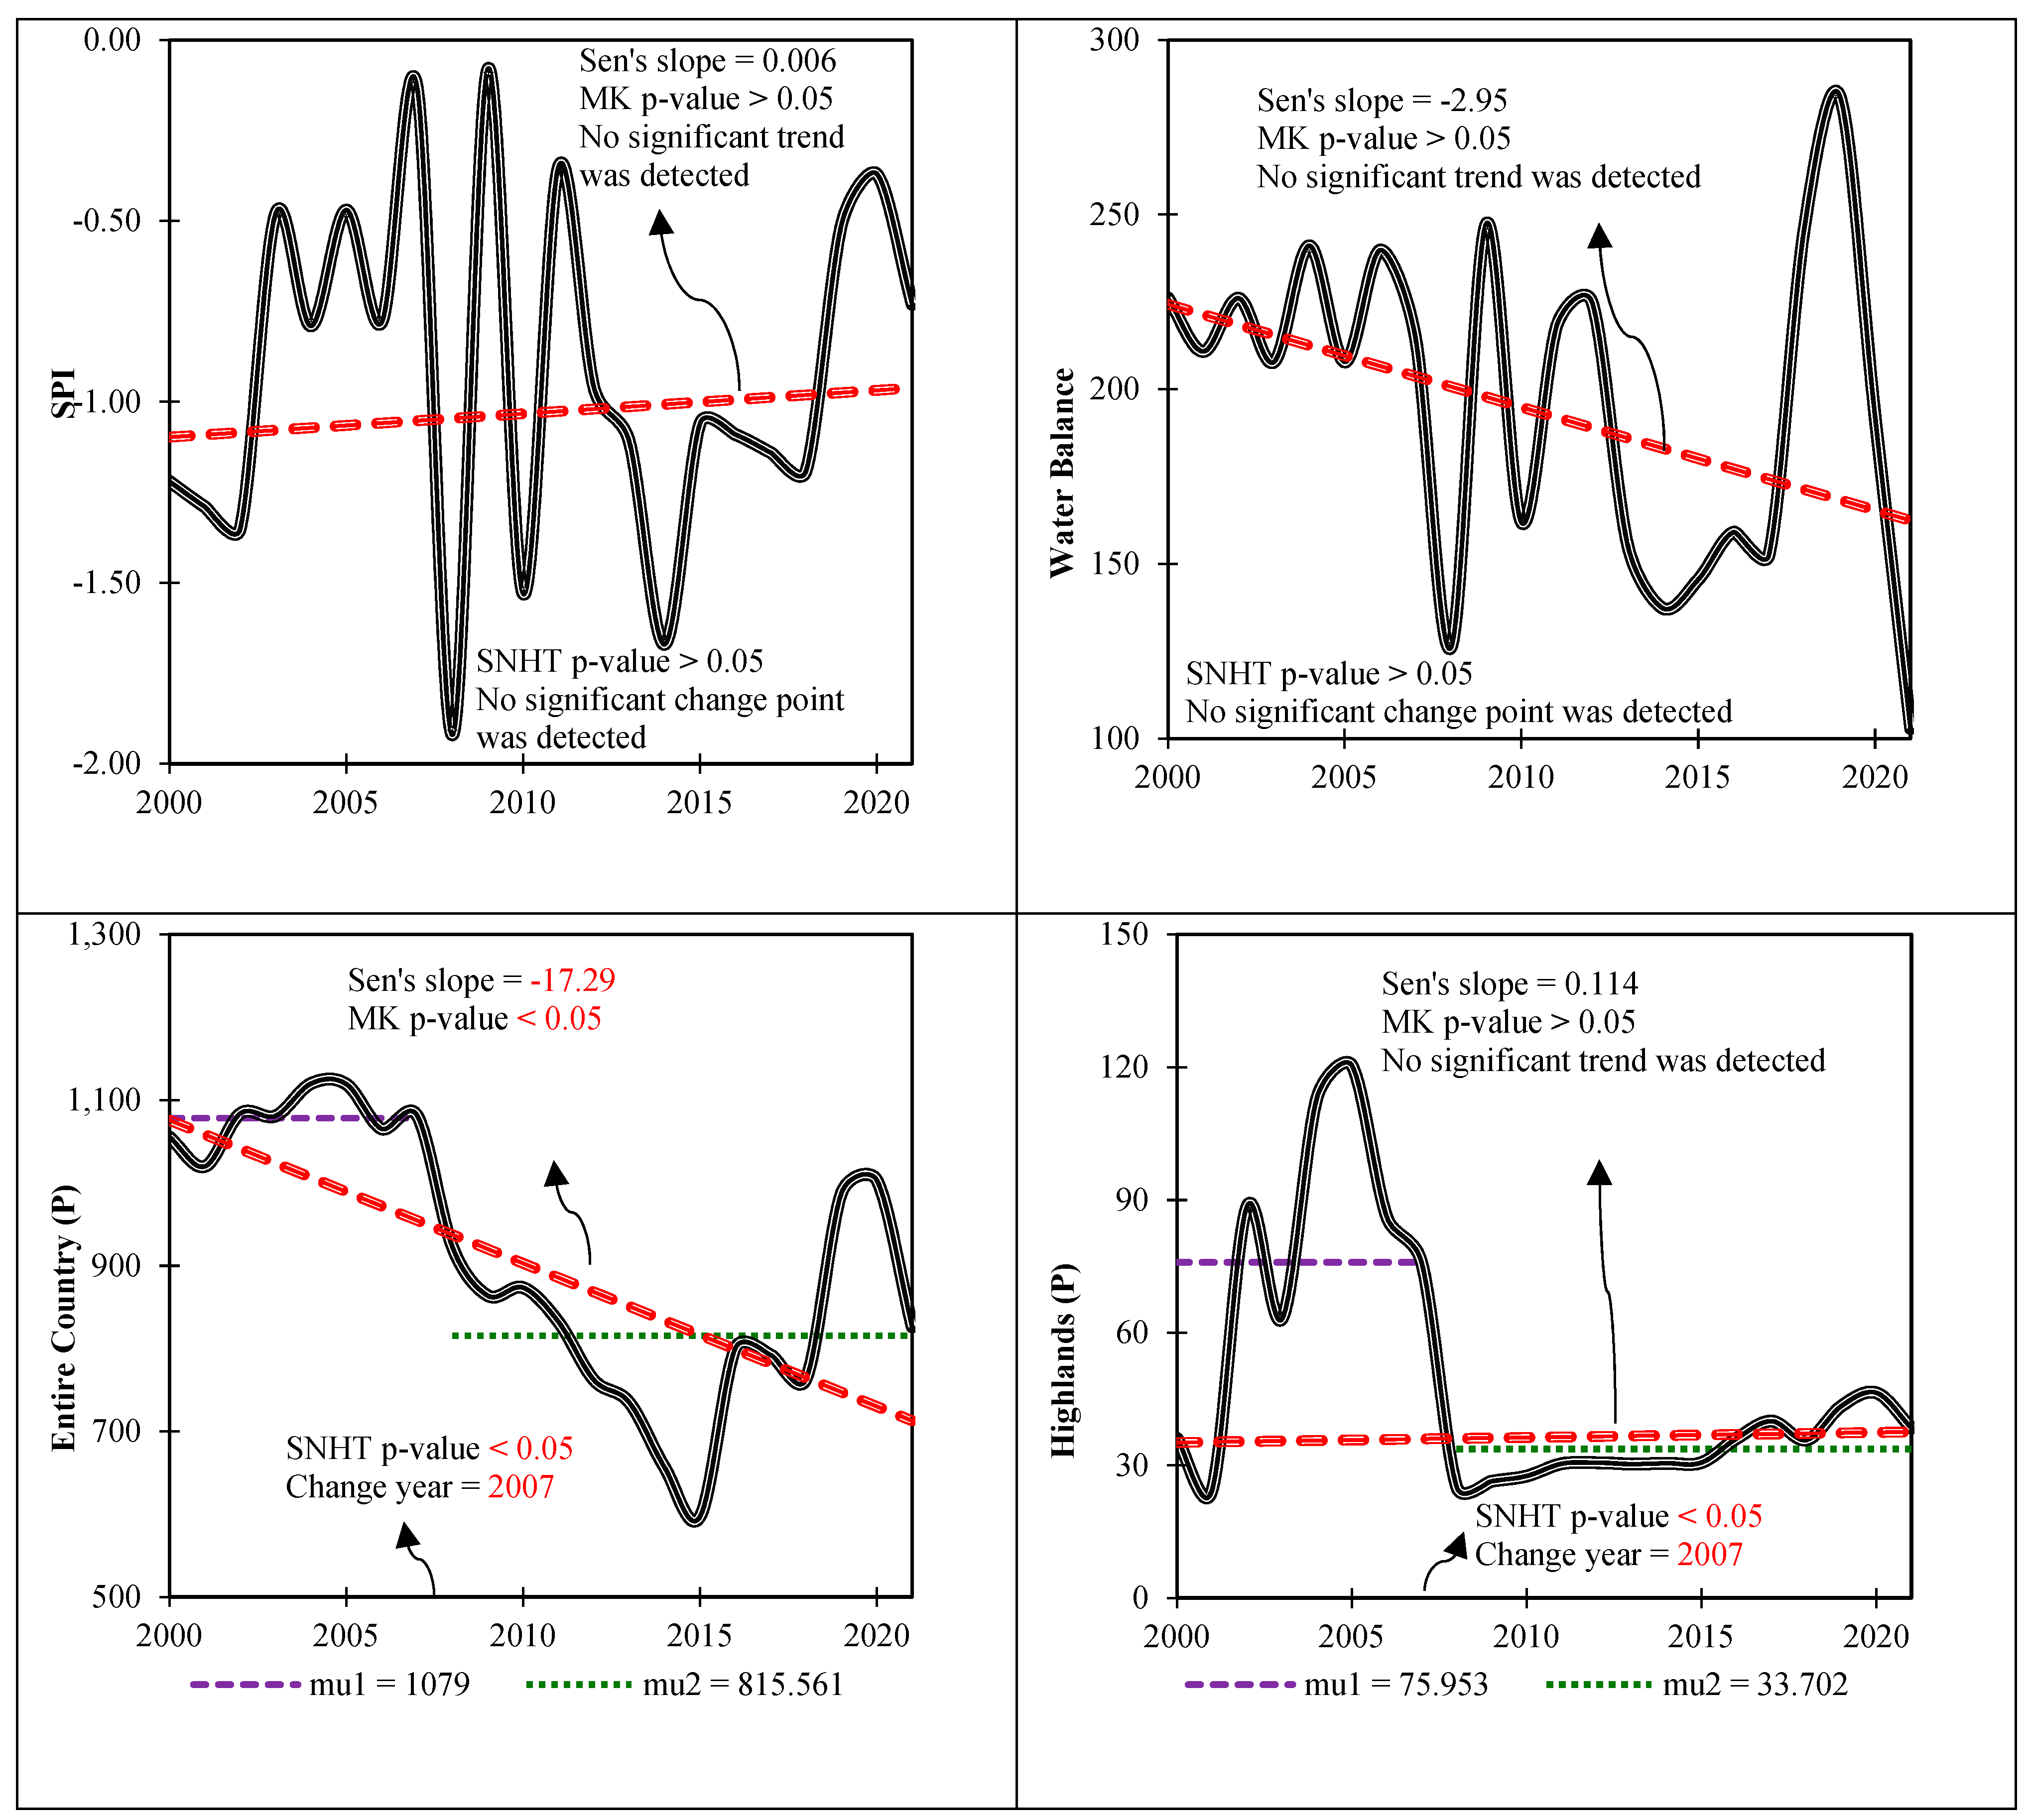
2.3.4. Statistical Analyses

We applied the Mann–Kendall (MK) non-parametric trend test [54,55] to find significant trends (with a significance level of p < 0.05) in the time series dataset. To solve serial correlation, we used the modified version of the MK test [56]. In this method, a slope estimator is used to calculate the magnitude of significant trends. Additionally, the Standard Normal Homogeneity Test (SNHT) [57] was employed to detect abrupt shift points in the time series. These methods have been utilized in many research studies for monitoring the impacts of climate variability and changes on hydroclimatology [15,58,59]. Furthermore, Pearson’s correlation coefficient [60] was applied to assess the relationship between drought and surface water in Iran.

3. Results

3.1. Drought Trend

The analysis of drought revealed several significant patterns and fluctuations in Iran from 2000 to 2021, as depicted in Figure 3 and Figure 4. According to Figure 3 and Figure 4, from 2000 to 2002, there was an increase in drought severity, with an average decrease in the SPI value (around −0.13). Notably, the majority of Iran (this includes both highlands such as the Elburz and Khorasan Mountains, and lowlands like the Kavir and Lut deserts) was severely affected by drought, excluding southwest and west regions. From 2003 to 2007, there was a noticeable decrease in drought severity, approximately −0.35; however, in 2008, the drought value abruptly peaked at −1.92, marking the most severe drought in the study period. In this year, except for the southeast, the entire country experienced severe drought conditions.
Following the peak in 2009, drought decreased to −0.08, with the northwest and west, predominantly highland regions, being the most affected. In 2010, drought significantly increased again to −1.53, impacting the southern, central, southwestern, and eastern regions severely. The subsequent year, 2011, saw a slight reduction in the drought value to around −1.18. From 2011 to 2014, drought exhibited a gradual increase, reaching a severe point of −1.32 in 2014. In 2015, the severity of drought decreased, but it began to increase again until 2018, reaching approximately −0.13. The years 2019 and 2020 showed a decrease in drought severity; however, in 2021, there was an observed increase in drought once more. The most severe drought conditions were recorded in 2008 (−1.92), followed by 2014 (−1.67) and 2010 (−1.53). Conversely, the years 2009, 2007, and 2011 were identified as having more moderate drought conditions, with values of −0.08, −0.13, and −0.35, respectively.
Overall, the results indicate that both the highlands and lowlands across Iran have been variably affected by drought over the years. The severity of drought has fluctuated, impacting different regions at different times. Nonetheless, all parts of the country have experienced the adverse effects of drought, underscoring the widespread nature of this phenomenon.

3.2. Surface Water Variation

The analysis of surface water trends from 2000 to 2021 reveals significant variations in both permanent and seasonal surface water resources across Iran, as depicted in Figure 5, Figure 6 and Figure 7. For the entire country, there was a net reduction of 2292 km2 in permanent surface water from 2000 to 2021. Specifically, between 2000 and 2005, there was a slight increase of 64.2 km2. However, from 2006 to 2015, a significant decrease of 468.5 km2 was observed. The trend reversed from 2016 to 2020, showing an increase in permanent surface water; however, 2021 saw another decrease. In the highlands, permanent surface water increased by 2.4 km2 over the study period. From 2000 to 2005, there was an increase of 84.4 km2 followed by a significant reduction of 95.4 km2 between 2005 and 2008. Subsequently, there was a consistent increase of 13.4 km2 s from 2008 to 2021. In the lowlands, permanent surface water resources decreased by approximately 231.6 km2 from 2000 to 2021. The variation was minimal from 2000 to 2007; however, a significant reduction of 331.3 km2 occurred from 2008 to 2015. From 2016 onwards, there was a recovery, with permanent surface water increasing from 764.4 km2 in 2016 to 787.9 km2 in 2021.
Seasonal surface water resources generally increased across the country from 2000 to 2021, with a net increase of about 687.34 km2. From 2000 to 2012, there was a steady increase that accelerated from 2013, reaching a peak of 1984.3 km2 in 2019. A decrease was observed from 2020 onwards. In the highlands, the volume of seasonal surface water was 175.3 km2 in 2000 but decreased by about 54.2 km2 in 2001. From 2001 to 2004, it increased by about 46.5 km2 followed by a decrease of 43.3 km2 until 2010. There was a resurgence from 2011 to 2012, and although 2014 and 2015 saw little change, the level rose to 151.6 km2 in 2016. The highest level was recorded in 2017 at 248.6 km2, while 2018 had the lowest at 111.7 km2. From 2019 to 2020, seasonal surface water increased, but decreased again in 2021. In the lowlands, seasonal surface water increased by 737.2 km2 from 2000 to 2021. There was a regular increase of 511.9 km2 from 2000 to 2018, reaching a peak of 1778.6 km2 in 2019; however, there was a decline in 2020 and 2021 compared to 2019.
Overall, permanent surface water resources decreased in the entire country and in the lowlands from 2000 to 2021, but did not change in the highlands. In contrast, seasonal surface water resources increased in the entire country and in the lowlands from 2000 to 2021 but decreased in the highlands over the same period. As illustrated in Figure 6 (box plots), the variability in seasonal surface water is higher than the variability in permanent surface water. Figure 7 further indicates that 44% of surface water is permanent and 56% is seasonal. Among the permanent surface water, 5% is in the highlands and 95% is in the lowlands. For seasonal surface water, the highlands account for 14%, while the lowlands represent 86%, indicating the highlands’ seasonal water share is three times greater.

3.3. Relationship between Drought Trend and Surface Water Variation
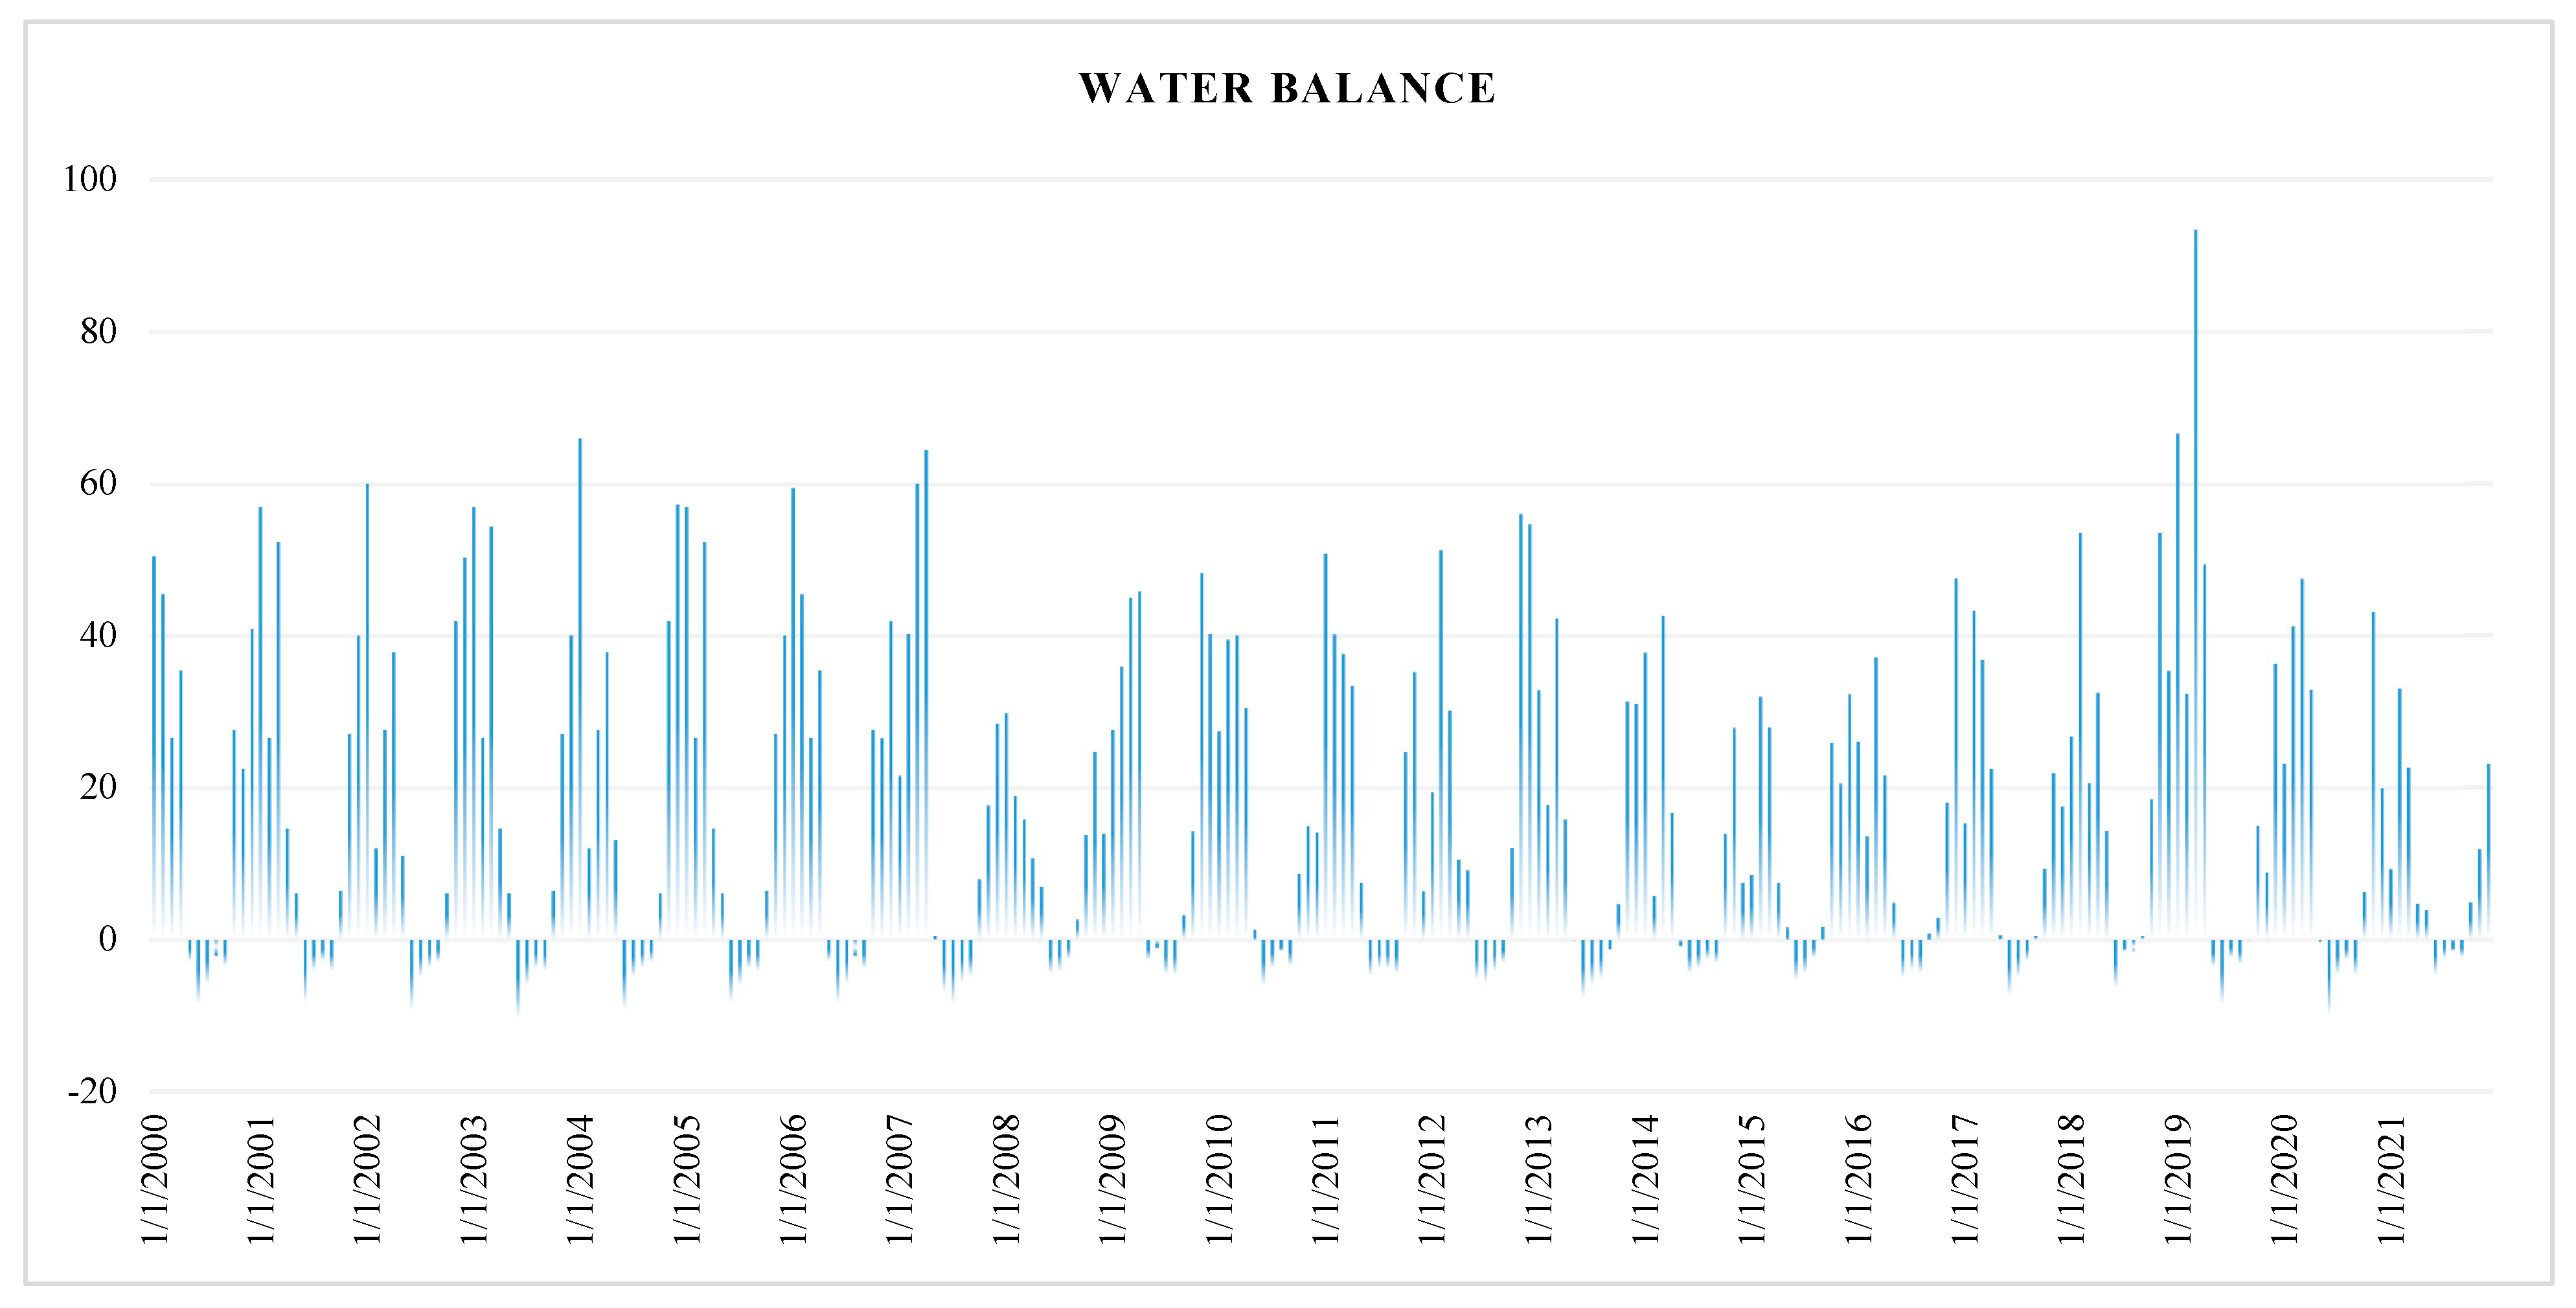
Analysis of the correlation between the SPI and various hydrological variables provides important insights into the relationship between drought conditions and water availability in Iran (Figure 8). This implies that wetter conditions contribute to increased water availability in the basin, which is a reasonable and expected outcome.
For permanent surface water, the moderate positive correlation with SPI (0.33 for the entire country, 0.33 for the highlands, and 0.31 for the lowlands) suggests that improvements in precipitation conditions positively influence the extent of permanent surface water bodies. This indicates that drought conditions, as reflected by lower SPI values, have a noticeable impact on reducing permanent surface water.
In the case of seasonal surface water, the coefficients of correlation with SPI are lower (0.18 for the entire country, 0.16 for the highlands, and 0.18 for the lowlands). This weaker positive correlation suggests that while seasonal surface water bodies are affected by changes in precipitation, the impact is less pronounced compared to permanent surface water bodies. Seasonal surface water is likely more influenced by short-term precipitation events and other factors such as temperature and evaporation rates.

3.4. Water Balance

Water balance in Iran is a complex and critical issue due to several factors, including its arid and semi-arid climate, limited water resources, population growth, and inefficient water management practices [58]. Iran faces significant challenges in maintaining a sustainable water balance, particularly given the increasing demand for water across various sectors such as agriculture, industry, and domestic use. Figure 9 illustrates the fluctuations in water balance in Iran from 2000 to 2021. There is a noticeable imbalance between water precipitation and evapotranspiration throughout this period. The disparity between evapotranspiration was particularly pronounced from 2000 to 2007; however, by 2008, water inflows and outflows started to converge, as depicted in Figure 9. From 2009 to 2014, the relationship between water inflows and outflows reverted to a pattern similar to that observed before 2008. In 2015, there was a significant alignment between water inflows and outflows in Iran. From 2016 to 2019, the correlation between water inflows and outflows increased again, reaching an unprecedented level in 2019 compared to the previous two decades. Since 2020, there has been a trend towards a more balanced correlation between water inflows and outflows, moving towards a normalized condition.

4. Discussion

4.1. Remote Sensing for Drought Monitoring

Drought conditions can result in decreased water levels in reservoirs, lakes, and ponds, as well as diminished streamflow in rivers. This scarcity of water can lead to the contraction of wetlands, depletion of groundwater, and potential deterioration of water quality due to elevated concentrations of salts and contaminants [61]. Thus, this study utilized an integrated approach involving remote sensing and GEE to monitor the impacts of prolonged drought on surface water resources in Iran from 2000 to 2021. Our research emphasizes the minimal effects of long-term drought on surface water resources. The correlation coefficients illustrate the relationship between drought and surface water resources (Figure 8). Numerous studies have applied remote sensing technology to monitor long-term drought and its impacts on water quality and surface water availability [6,61,62]. These studies, however, typically assessed the effects of drought on water bodies collectively, without distinguishing between various types of water resources like permanent and seasonal rivers, lakes, and dams. In contrast, the present study investigates the effects of long-term drought on various surface water resources across different topographies.
Moderate Resolution Imaging Spectroradiometer (MODIS) water mask was employed in previous research for long-term water pattern monitoring. Our study, on the other hand, applied the high-resolution Landsat JRC yearly water classification history, v1.4. MODIS water mask is limited to 250 m spatial resolution, which may not provide further details about different types of water resources. Landsat high-resolution JRC product, however, offers a spatial resolution of 30 m, making it an appropriate choice for detecting and monitoring diverse surface water resources effectively [43].
Drought in Iran is mostly characterized by insufficient rainfall [63,64]. Reduction in the amount of precipitation leads to a negative water balance, causing water deficits and potential drought conditions. These effects are more intense in most parts of Iran, specifically in the central, northwest, and eastern parts of the country. Reduction in the volume of water entering rivers, aquifers, and lakes further diminishes water resources, with lakes Urmia and Hamoun serving as good examples of these effects in Iran over the last decades.

4.2. Effects of Long-Term Drought on Permanent Surface Water in Highlands and Lowlands

According to the findings of this study, there were positive correlation coefficients of 0.33, 0.33, and 0.31 between long-term drought and permanent surface water in the entire country, highlands, and lowland regions, respectively. This indicates that decreasing drought was associated with a decrease in the volume of permanent surface water resources in these regions. According to Figure 3, the most severe droughts occurred in 2008 and 2014, coinciding with a significant decrease in surface water in these years. Our findings indicate a decrease in drought severity from 2000 to 2021, with fluctuations during this period affecting some areas more severely than others.
For clarification, our study exemplified two vital dried lakes situated in the lowlands. Lake Hamoun was Iran’s largest freshwater body in the southeast over the last decades. It has now disappeared, causing the emergence of sand storms, which trigger soil erosion in many southeastern villages [65]. Lake Hamoun was affected by both local and regional rainfall, snowmelt in the Hazarajat Mountains in Afghanistan, and the frequency of wet/dry spells. The frequency of droughts, inefficient water resource management, and the expansion of agricultural land are the main factors contributing to changes in water bodies in the Sistan Plain over the past two decades [66,67]. Similarly, Lake Urmia in the northwest has experienced the same situation, losing much of its water and nearing complete desiccation [18]. Both anthropogenic and climatic factors have contributed to the shrinking of the lake over the last decades [17,58].

4.3. Analysis of the Effects of Long-Term Drought on Seasonal Surface Water in Highlands and Lowlands

According to the findings of our study, weak positive correlation coefficients of 0.18, 0.16, and 0.18 were found between long-term drought and seasonal surface water in the entire country, highlands, and lowlands, respectively. It can be concluded that decreasing drought has little impact on increasing the volume of seasonal surface water. The results of this study indicated weak impacts of long-term drought on surface water resources at the national level, while the effects of other factors such as anthropogenic activities were significant. Additionally, the use of surface water resources for different applications, including agriculture, providing enough water for an increasing population, and the industrial sector would be other reasons for the decrease in permanent surface water volume and the increase in seasonal surface water resources.
In highlands, surface water availability typically follows a seasonal pattern affected by precipitation cycles, such as wet and dry seasons. Rainfall and snowmelt replenish rivers, streams, and reservoirs during the wet season, resulting in an abundance of surface water. Conversely, decreased precipitation and increased evaporation can significantly reduce surface water levels during the dry season, making these regions susceptible to drought. In many highland regions of Iran, the accumulation of snowpack during winter acts as a vital water reserve, which plays a crucial role in sustaining surface water flows in spring and early summer. However, decreased snowfall or early melting due to high temperatures [68] can disrupt this balance, causing a shortage of water in the dry season.

4.4. Limitations of This Study and Future Work

The successful implications of remote sensing data for various environmental studies have been stated in the literature, but noisy pixels can be an issue when studying large-scale regions. As a result, users should consider possible noise/error when interpreting remote sensing data. Compared to the JRC Global Surface Water Mapping Layers v1.4 product, the JRC Yearly Water Classification History v1.4 provides yearly information for monitoring surface water at permanent and seasonal levels. However, this product does not account for changes from permanent to seasonal or from seasonal to permanent surface water, which could enhance understanding of surface water resource fluctuations. Since a strong correlation between drought and surface water resources was not established in this study, future work should investigate the effects of anthropogenic variables (e.g., the increase in agricultural lands) and climatic factors (e.g., temperature) on surface water resources.

5. Conclusions

This research applied an integrated approach of remote sensing and GEE for monitoring long-term drought effects on surface water resources in Iran from 2000 to 2021. The results of this study demonstrate a weak correlation between long-term drought and surface water across the entire country, highlands, and lowlands. Specifically, our findings showed a reduction in permanent surface water and, in contrast, an increase in seasonal surface water from 2000 to 2021. The results of this research highlight the capability of remote sensing datasets and the cloud-free platform GEE for long-term monitoring of Earth’s features on a large scale. The methodology applied in this research demonstrated strong potential for monitoring and simulating drought and water patterns in semi-arid and arid regions like Iran. Interestingly, a weak correlation between drought and surface water resources suggests that factors other than climate variability, particularly human activities, might play a more significant role in Iran’s water crisis. The overuse of water resources for industry, agriculture, and domestic purposes likely exacerbates the situation, overshadowing the impact of drought alone. In summary, the findings of this study would be valuable for professionals in the domains of hydrology, water management, and drought monitoring. They highlight the need for integrated water resource management strategies that consider both natural and human-induced factors to address the ongoing water crisis in Iran effectively.

Author Contributions

M.K.G.: conceptualization, writing—original draft, methodology; N.A.: methodology, investigation; E.S.: formal analysis, data curation, conceptualization; A.N.: methodology, writing—original draft, supervision; I.K.: formal analysis, writing—original draft; A.R.B.L.: data curation, writing—original draft; A.S.: methodology, validation; S.M.: methodology, writing—review and editing. All authors have read and agreed to the published version of the manuscript.

Funding

This work was supported by the Sichuan Science and Technology Program under Grant 2023YFWZ0007.

Data Availability Statement

All the data used in this research are freely accessible via the Google Earth Engine cloud computing platform (https://developers.google.com/earth-engine/datasets).

Conflicts of Interest

The authors declare no conflicts of interest.

References

  1. Du, L.; Tian, Q.; Yu, T.; Meng, Q.; Jancso, T.; Udvardy, P.; Huang, Y. A comprehensive drought monitoring method integrating MODIS and TRMM data. Int. J. Appl. Earth Obs. Geoinf. 2013, 23, 245–253. [Google Scholar] [CrossRef]
  2. Slette, I.J.; Post, A.K.; Awad, M.; Even, T.; Punzalan, A.; Williams, S.; Smith, M.D.; Knapp, A.K. How ecologists define drought, and why we should do better. Glob. Change Biol. 2019, 25, 3193–3200. [Google Scholar] [CrossRef] [PubMed]
  3. Adams, H.D.; Zeppel, M.J.; Anderegg, W.R.; Hartmann, H.; Landhäusser, S.M.; Tissue, D.T.; Huxman, T.E.; Hudson, P.J.; Franz, T.E.; Allen, C.D. A multi-species synthesis of physiological mechanisms in drought-induced tree mortality. Nat. Ecol. Evol. 2017, 1, 1285–1291. [Google Scholar] [CrossRef] [PubMed]
  4. Baldocchi, D.D. How eddy covariance flux measurements have contributed to our understanding of Global Change Biology. Glob. Chang. Biol. 2020, 26, 242–260. [Google Scholar] [CrossRef]
  5. Li, Q.; Ye, A.; Wada, Y.; Zhang, Y.; Zhou, J. Climate change leads to an expansion of global drought-sensitive area. J. Hydrol. 2024, 632, 130874. [Google Scholar] [CrossRef]
  6. Bhaga, T.D.; Dube, T.; Shekede, M.D.; Shoko, C. Impacts of climate variability and drought on surface water resources in Sub-Saharan Africa using remote sensing: A review. Remote Sens. 2020, 12, 4184. [Google Scholar] [CrossRef]
  7. Zheng, S.; Zhang, Z.; Yan, H.; Zhao, Y.; Li, Z. Characterizing drought events occurred in the Yangtze River Basin from 1979 to 2017 by reconstructing water storage anomalies based on GRACE and meteorological data. Sci. Total Environ. 2023, 868, 161755. [Google Scholar] [CrossRef]
  8. Keshavarz, M.R.; Vazifedoust, M.; Alizadeh, A. Drought monitoring using a Soil Wetness Deficit Index (SWDI) derived from MODIS satellite data. Agric. Water Manag. 2014, 132, 37–45. [Google Scholar] [CrossRef]
  9. Huang, S.; Li, P.; Huang, Q.; Leng, G.; Hou, B.; Ma, L. The propagation from meteorological to hydrological drought and its potential influence factors. J. Hydrol. 2017, 547, 184–195. [Google Scholar] [CrossRef]
  10. Hagenlocher, M.; Meza, I.; Anderson, C.C.; Min, A.; Renaud, F.G.; Walz, Y.; Siebert, S.; Sebesvari, Z. Drought vulnerability and risk assessments: State of the art, persistent gaps, and research agenda. Environ. Res. Lett. 2019, 14, 083002. [Google Scholar] [CrossRef]
  11. Jiao, W.; Wang, L.; McCabe, M.F. Multi-sensor remote sensing for drought characterization: Current status, opportunities and a roadmap for the future. Remote Sens. Environ. 2021, 256, 112313. [Google Scholar] [CrossRef]
  12. AghaKouchak, A.; Farahmand, A.; Melton, F.S.; Teixeira, J.; Anderson, M.C.; Wardlow, B.D.; Hain, C.R. Remote sensing of drought: Progress, challenges and opportunities. Rev. Geophys. 2015, 53, 452–480. [Google Scholar] [CrossRef]
  13. Mokhtari, F.; Honarbakhsh, A.; Soltani, S. Investigation of the effects of climate change on hydrological drought and pattern detection for severe climatic conditions using CCT and SWAT models in the semi-arid region—Case study: Karkheh river basin. Arab. J. Geosci. 2023, 16, 534. [Google Scholar] [CrossRef]
  14. Masaeli, N.; Afshari, E.; Baniasadi, E.; Baharlou-Houreh, N.; Ghaedamini, M. Experimental analysis of water transfer and thermal–hydraulic performance of membrane humidifiers with three flow field designs. Appl. Energy 2023, 336, 120823. [Google Scholar] [CrossRef]
  15. Sadeqi, A.; Kahya, E. Spatiotemporal analysis of air temperature indices, aridity conditions, and precipitation in Iran. Theor. Appl. Climatol. 2021, 145, 703–716. [Google Scholar] [CrossRef]
  16. Moshir Panahi, D.; Kalantari, Z.; Ghajarnia, N.; Seifollahi-Aghmiuni, S.; Destouni, G. Variability and change in the hydro-climate and water resources of Iran over a recent 30-year period. Sci. Rep. 2020, 10, 7450. [Google Scholar] [CrossRef]
  17. Naboureh, A.; Li, A.; Ebrahimy, H.; Bian, J.; Azadbakht, M.; Amani, M.; Lei, G.; Nan, X. Assessing the effects of irrigated agricultural expansions on Lake Urmia using multi-decadal Landsat imagery and a sample migration technique within Google Earth Engine. Int. J. Appl. Earth Obs. Geoinf. 2021, 105, 102607. [Google Scholar] [CrossRef]
  18. Kazemi Garajeh, M.; Akbari, R.; Aghaei Chaleshtori, S.; Shenavaei Abbasi, M.; Tramutoli, V.; Lim, S.; Sadeqi, A. A Comprehensive Assessment of Climate Change and Anthropogenic Effects on Surface Water Resources in the Lake Urmia Basin, Iran. Remote Sens. 2024, 16, 1960. [Google Scholar] [CrossRef]
  19. Nasirian, H.; Irvine, K.; Sadeghi, S.M.T.; Mahvi, A.H.; Nazmara, S. Assessment of bed sediment metal contamination in the Shadegan and Hawr Al Azim wetlands, Iran. Environ. Monit. Assess. 2016, 188, 1–15. [Google Scholar] [CrossRef]
  20. Mozafari, M.; Hosseini, Z.; Fijani, E.; Eskandari, R.; Siahpoush, S.; Ghader, F. Effects of climate change and human activity on lake drying in Bakhtegan Basin, southwest Iran. Sustain. Water Resour. Manag. 2022, 8, 109. [Google Scholar] [CrossRef]
  21. Kharazmi, R.; Tavili, A.; Rahdari, M.R.; Chaban, L.; Panidi, E.; Rodrigo-Comino, J. Monitoring and assessment of seasonal land cover changes using remote sensing: A 30-year (1987–2016) case study of Hamoun Wetland, Iran. Environ. Monit. Assess. 2018, 190, 356. [Google Scholar] [CrossRef]
  22. Pouyan, S.; Bordbar, M.; Ravichandran, V.; Tiefenbacher, J.P.; Kherad, M.; Pourghasemi, H.R. Spatiotemporal monitoring of droughts in Iran using remote-sensing indices. Nat. Hazards 2023, 117, 1–24. [Google Scholar] [CrossRef]
  23. Shojaei, S.; Rahimzadegan, M. Improving a comprehensive remote sensing drought index (CRSDI) in the Western part of Iran. Geocarto Int. 2022, 37, 1318–1336. [Google Scholar] [CrossRef]
  24. Mikaili, O.; Rahimzadegan, M. Investigating remote sensing indices to monitor drought impacts on a local scale (case study: Fars province, Iran). Nat. Hazards 2022, 111, 2511–2529. [Google Scholar] [CrossRef]
  25. Jalili, M.; Gharibshah, J.; Ghavami, S.M.; Beheshtifar, M.; Farshi, R. Nationwide prediction of drought conditions in Iran based on remote sensing data. IEEE Trans. Comput. 2013, 63, 90–101. [Google Scholar] [CrossRef]
  26. Palmer, W. Meteorological Drought; US Weather Bureau Research Paper No. 45; US Weather Bureau: Washington, DC, USA, 1965; 58p. [Google Scholar]
  27. Mansourihanis, O.; Maghsoodi Tilaki, M.J.; Yousefian, S.; Zaroujtaghi, A. A computational geospatial approach to assessing land-use compatibility in urban planning. Land 2023, 12, 2083. [Google Scholar] [CrossRef]
  28. Fuentes, I.; Padarian, J.; Vervoort, R.W. Spatial and temporal global patterns of drought propagation. Front. Environ. Sci. 2022, 10, 788248. [Google Scholar] [CrossRef]
  29. Khan, R.; Gilani, H. Global drought monitoring with drought severity index (DSI) using Google Earth Engine. Theor. Appl. Climatol. 2021, 146, 411–427. [Google Scholar] [CrossRef]
  30. McKee, T.B.; Doesken, N.J.; Kleist, J. The relationship of drought frequency and duration to time scales. In Proceedings of the 8th Conference on Applied Climatology, Anaheim, CA, USA, 17–22 January 1993; pp. 179–183. [Google Scholar]
  31. Kugytė, G.; Valiuškevičius, G. Identification of Hydrological Droughts in Lithuanian Rivers. Geogr. Ir. Edukac 2021, 9, 87–99. [Google Scholar] [CrossRef]
  32. Singh, R.P.; Roy, S.; Kogan, F. Vegetation and temperature condition indices from NOAA AVHRR data for drought monitoring over India. Int. J. Remote Sens. 2003, 24, 4393–4402. [Google Scholar] [CrossRef]
  33. Vicente-Serrano, S.M.; Beguería, S.; López-Moreno, J.I. A multiscalar drought index sensitive to global warming: The standardized precipitation evapotranspiration index. J. Clim. 2010, 23, 1696–1718. [Google Scholar] [CrossRef]
  34. Lorenzo, M.; Pereira, H.; Alvarez, I.; Dias, J. Standardized Precipitation Index (SPI) evolution over the Iberian Peninsula during the 21st century. Atmos. Res. 2023, 297, 107132. [Google Scholar] [CrossRef]
  35. Shah, R.; Bharadiya, N.; Manekar, V. Drought index computation using standardized precipitation index (SPI) method for Surat District, Gujarat. Aquat. Procedia 2015, 4, 1243–1249. [Google Scholar] [CrossRef]
  36. Nguyen-Huy, T.; Kath, J.; Nagler, T.; Khaung, Y.; Aung, T.S.S.; Mushtaq, S.; Marcussen, T.; Stone, R. A satellite-based Standardized Antecedent Precipitation Index (SAPI) for mapping extreme rainfall risk in Myanmar. Remote Sens. Appl. Soc. Environ. 2022, 26, 100733. [Google Scholar] [CrossRef]
  37. Wang, Z.; Huang, S.; Singh, V.P.; Mu, Z.; Leng, G.; Li, J.; Duan, W.; Ling, H.; Xu, J.; Nie, M. Contrasting characteristics and drivers of dry and warm snow droughts in China’s largest inland river basin. J. Hydrol. Reg. Stud. 2024, 53, 101751. [Google Scholar] [CrossRef]
  38. Naboureh, A.; Bian, J.; Lei, G.; Li, A. A review of land use/land cover change mapping in the China-Central Asia-West Asia economic corridor countries. Big Earth Data 2021, 5, 237–257. [Google Scholar] [CrossRef]
  39. Ghazaryan, G.; Dubovyk, O.; Graw, V.; Kussul, N.; Schellberg, J. Local-scale agricultural drought monitoring with satellite-based multi-sensor time-series. GISci. Remote Sens. 2020, 57, 704–718. [Google Scholar] [CrossRef]
  40. Naboureh, A.; Li, A.; Bian, J.; Lei, G.; Nan, X.; Zhang, Z.; Shami, S.; Lin, X. Green space coverage versus air pollution: A cloud-based remote sensing data analysis in Sichuan, Western China. Int. J. Digit. Earth 2024, 17, 2383454. [Google Scholar] [CrossRef]
  41. Naboureh, A.; Li, A.; Bian, J.; Lei, G.; Nan, X. Land cover dataset of the China Central-Asia West-Asia Economic Corridor from 1993 to 2018. Sci. Data 2023, 10, 728. [Google Scholar] [CrossRef]
  42. Gorelick, N.; Hancher, M.; Dixon, M.; Ilyushchenko, S.; Thau, D.; Moore, R. Google Earth Engine: Planetary-scale geospatial analysis for everyone. Remote Sens. Environ. 2017, 202, 18–27. [Google Scholar] [CrossRef]
  43. Pekel, J.-F.; Cottam, A.; Gorelick, N.; Belward, A.S. High-resolution mapping of global surface water and its long-term changes. Nature 2016, 540, 418–422. [Google Scholar] [CrossRef]
  44. MacDonald, A.M.; Bell, R.A.; Kebede, S.; Azagegn, T.; Yehualaeshet, T.; Pichon, F.; Young, M.; McKenzie, A.; Lapworth, D.J.; Black, E. Groundwater and resilience to drought in the Ethiopian highlands. Environ. Res. Lett. 2019, 14, 095003. [Google Scholar] [CrossRef]
  45. Gidey, E.; Mhangara, P.; Gebregergs, T.; Zeweld, W.; Gebretsadik, H.; Dikinya, O.; Mussa, S.; Zenebe, A.; Girma, A.; Fisseha, G. Analysis of drought coping strategies in northern Ethiopian highlands. SN Appl. Sci. 2023, 5, 195. [Google Scholar] [CrossRef]
  46. Gidey, E.; Dikinya, O.; Sebego, R.; Segosebe, E.; Zenebe, A. Analysis of the long-term agricultural drought onset, cessation, duration, frequency, severity and spatial extent using Vegetation Health Index (VHI) in Raya and its environs, Northern Ethiopia. Environ. Syst. Res. 2018, 7, 1–18. [Google Scholar] [CrossRef]
  47. Feizizadeh, B.; Garajeh, M.K.; Lakes, T.; Blaschke, T. A deep learning convolutional neural network algorithm for detecting saline flow sources and mapping the environmental impacts of the Urmia Lake drought in Iran. Catena 2021, 207, 105585. [Google Scholar] [CrossRef]
  48. Eskandari Dameneh, H.; Gholami, H.; Telfer, M.W.; Comino, J.R.; Collins, A.L.; Jansen, J.D. Desertification of Iran in the early twenty-first century: Assessment using climate and vegetation indices. Sci. Rep. 2021, 11, 20548. [Google Scholar] [CrossRef] [PubMed]
  49. Kheyruri, Y.; Sharafati, A. Spatiotemporal assessment of the NASA POWER satellite precipitation product over different regions of Iran. Pure Appl. Geophys. 2022, 179, 3427–3439. [Google Scholar] [CrossRef]
  50. Saeidizand, R.; Sabetghadam, S.; Tarnavsky, E.; Pierleoni, A. Evaluation of CHIRPS rainfall estimates over Iran. Q. J. R. Meteorol. Soc. 2018, 144, 282–291. [Google Scholar] [CrossRef]
  51. Mianabadi, A.; Salari, K.; Pourmohamad, Y. Drought monitoring using the long-term CHIRPS precipitation over Southeastern Iran. Appl. Water Sci. 2022, 12, 183. [Google Scholar] [CrossRef]
  52. Vélez-Nicolás, M.; García-López, S.; Ruiz-Ortiz, V.; Zazo, S.; Molina, J.L. Precipitation variability and drought assessment using the SPI: Application to long-term series in the strait of Gibraltar Area. Water 2022, 14, 884. [Google Scholar] [CrossRef]
  53. Edwards, D.C.; McKee, T.B. Characteristics of 20th Century Drought in the United States at Multiple Time Scales; Department of Atmospheric Science, Colorado State University: Fort Collins, CO, USA, 1997. [Google Scholar]
  54. Mann, H.B. Nonparametric tests against trend. Econom. J. Econom. Soc. 1945, 13, 245–259. [Google Scholar] [CrossRef]
  55. Kendall, M.G. Rank Correlation Methods; American Psychological Association: Washington, DC, USA, 1948. [Google Scholar]
  56. Hamed, K.H.; Rao, A.R. A modified Mann-Kendall trend test for autocorrelated data. J. Hydrol. 1998, 204, 182–196. [Google Scholar] [CrossRef]
  57. Alexandersson, H. A homogeneity test applied to precipitation data. J. Climatol. 1986, 6, 661–675. [Google Scholar] [CrossRef]
  58. Kazemi Garajeh, M.; Haji, F.; Tohidfar, M.; Sadeqi, A.; Ahmadi, R.; Kariminejad, N. Spatiotemporal monitoring of climate change impacts on water resources using an integrated approach of remote sensing and Google Earth Engine. Sci. Rep. 2024, 14, 5469. [Google Scholar] [CrossRef] [PubMed]
  59. Sadeqi, A.; Tabari, H.; Dinpashoh, Y. Spatio-temporal analysis of heating and cooling degree-days over Iran. Stoch. Environ. Res. Risk Assess. 2022, 36, 869–891. [Google Scholar] [CrossRef]
  60. Helsel, D.R.; Hirsch, R.M. Statistical Methods in Water Resources; Elsevier: Amsterdam, The Netherlands, 1993. [Google Scholar]
  61. Peña-Guerrero, M.D.; Nauditt, A.; Muñoz-Robles, C.; Ribbe, L.; Meza, F. Drought impacts on water quality and potential implications for agricultural production in the Maipo River Basin, Central Chile. Hydrol. Sci. J. 2020, 65, 1005–1021. [Google Scholar] [CrossRef]
  62. Apurv, T.; Cai, X. Impact of droughts on water supply in US watersheds: The role of renewable surface and groundwater resources. Earth’s Future 2020, 8, e2020EF001648. [Google Scholar] [CrossRef]
  63. Javari, M. Spatial variability of rainfall trends in Iran. Arab. J. Geosci. 2017, 10, 78. [Google Scholar] [CrossRef]
  64. Emadodin, I.; Reinsch, T.; Taube, F. Drought and desertification in Iran. Hydrology 2019, 6, 66. [Google Scholar] [CrossRef]
  65. Foltz, R.C. Iran’s water crisis: Cultural, political, and ethical dimensions. J. Agric. Environ. Ethics 2002, 15, 357–380. [Google Scholar] [CrossRef]
  66. Saatsaz, M. A historical investigation on water resources management in Iran. Environ. Dev. Sustain. 2020, 22, 1749–1785. [Google Scholar] [CrossRef]
  67. Farrokhzadeh, S.; Hashemi Monfared, S.A.; Azizyan, G.; Sardar Shahraki, A.; Ertsen, M.W.; Abraham, E. Sustainable water resources management in an arid area using a coupled optimization-simulation modeling. Water 2020, 12, 885. [Google Scholar] [CrossRef]
  68. Sadeqi, A.; Irannezhad, M.; Bahmani, S.; Jelodarlu, K.A.; Varandili, S.A.; Pham, Q.B. Long-Term Variability and Trends in Snow Depth and Cover Days Throughout Iranian Mountain Ranges. Water Resour. Res. 2024, 60, e2023WR035411. [Google Scholar] [CrossRef]
Figure 1. Location of the study area: (a) In the world, (b) Iran’s river basins, and (c) elevation and distribution of permanent rivers throughout the country.
Remotesensing 16 03636 g001
Figure 2. An overview of the applied methodology for monitoring the long-term drought trends and their effects on surface water bodies and water balance variations in Iran.
Remotesensing 16 03636 g002
Figure 3. Drought trends in Iran from 2000 to 2021 estimated using SPI.
Remotesensing 16 03636 g003aRemotesensing 16 03636 g003b
Figure 4. Graph of the drought trend from 2000 to 2021 estimated using SPI.
Remotesensing 16 03636 g004
Figure 5. Time series analysis illustrating the yearly fluctuations and trends in surface water bodies, along with the long-term drought patterns indicated by the SPI.
Remotesensing 16 03636 g005aRemotesensing 16 03636 g005b
Figure 6. Box plots showing variations in surface water bodies.
Remotesensing 16 03636 g006
Figure 7. The share of permanent and seasonal water resources in Iran from 2000 to 2021.
Remotesensing 16 03636 g007
Figure 8. Correlation between long-term drought and surface water bodies in Iran, analyzed using the Pearson technique.
Remotesensing 16 03636 g008
Figure 9. Water balance in Iran from 2000 to 2021.
Remotesensing 16 03636 g009
Table 1. Data used in this study.
VariableProductSpatial Resolution (m)Temporal ResolutionGoogle Earth Engine ID
Surface waterJRC Yearly Water Classification History, v1.430YearlyJRC/GSW1_4/YearlyHistory
EvapotranspirationMOD16A2GF.061: Terra Net Evapotranspiration5008-dayMOD16A2GF Version 6.1
PrecipitationCHIRPS Daily: Climate Hazards Group InfraRed Precipitation with Station Data (V2.0)5566DailyUCSB-CHG/CHIRPS/DAILY
Disclaimer/Publisher’s Note: The statements, opinions and data contained in all publications are solely those of the individual author(s) and contributor(s) and not of MDPI and/or the editor(s). MDPI and/or the editor(s) disclaim responsibility for any injury to people or property resulting from any ideas, methods, instructions or products referred to in the content.

