Article

An Evaluation and Improvement of Microphysical Parameterization for a Heavy Rainfall Process during the Meiyu Season

1
China Meteorological Administration Basin Heavy Rainfall Key Laboratory, Hubei Key Laboratory for Heavy Rain Monitoring and Warning Research, Institute of Heavy Rain, China Meteorological Administration, Wuhan 430205, China
2
State Key Laboratory of Severe Weather, Chinese Academy of Meteorological Sciences, Beijing 100081, China
3
Hubei Lightning Protection Center, Wuhan 430074, China
*
Author to whom correspondence should be addressed.
Remote Sens. 2024, 16(9), 1636; https://doi.org/10.3390/rs16091636
Submission received: 9 February 2024 / Revised: 12 April 2024 / Accepted: 30 April 2024 / Published: 3 May 2024

Abstract

:
The present study assesses the simulated precipitation and cloud properties using three microphysics schemes (Morrison, Thompson and MY) implemented in the Weather Research and Forecasting model. The precipitation, differential reflectivity (ZDR), specific differential phase (KDP) and mass-weighted mean diameter of raindrops (Dm) are compared with measurements from a heavy rainfall event that occurred on 27 June 2020 during the Integrative Monsoon Frontal Rainfall Experiment (IMFRE). The results indicate that all three microphysics schemes generally capture the characteristics of rainfall, ZDR, KDP and Dm, but tend to overestimate their intensity. To enhance the model performance, adjustments are made based on the MY scheme, which exhibited the best performance. Specifically, the overall coalescence and collision parameter (Ec) is reduced, which effectively decreases Dm and makes it more consistent with observations. Generally, reducing Ec leads to an increase in the simulated content (Qr) and number concentration (Nr) of raindrops across most time steps and altitudes. With a smaller Ec, the impact of microphysical processes on Nr and Qr varies with time and altitude. Generally, the autoconversion of droplets to raindrops primarily contributes to Nr, while the accretion of cloud droplets by raindrops plays a more significant role in increasing Qr. In this study, it is emphasized that even if the precipitation characteristics could be adequately reproduced, accurately simulating microphysical characteristics remains challenging and it still needs adjustments in the most physically based parameterizations to achieve more accurate simulation.

1. Introduction

The Meiyu season, also known as baiu in Japan, is a specific period during the East Asian summer monsoon. It is characterized by a significant amount of rainfall from the Yangtze–Huai River Valley (YHRV) in central China to Japan [1,2,3,4,5,6,7]. This season is one of the three major periods of heavy rainfall in China [8,9,10,11]. The Meiyu frontal rainfall typically contributes approximately 32% of the annual precipitation in Hubei Province [12], central China, and reaches 50% in certain years [13].
Many studies analyzed the dynamical and thermodynamical processes [14,15,16,17,18] and water vapor transport [19] favorable for heavy Meiyu rainfall. With the advancements in observation ability, the microphysical observations on Meiyu frontal heavy rainfall have also received increasing attention. The Wuhan Institute of Heavy Rain (IHR) of the China Meteorological Administration conducted two field campaigns (the Integrative Monsoon Frontal Rainfall Experiment, IMFRE) in 2018 and 2020, respectively, in the middle reaches of the YHRV, a region strongly affected by the East Asian summer monsoon, to gain a better understanding of the microphysical processes of Meiyu frontal rainfall [20,21]. These campaigns have yielded new insights into Meiyu frontal rainfall. For instance, Hu et al. [22,23] discovered that condensation heating plays a significant role in Meiyu frontogenesis, primarily through its thermodynamic effect and additionally through its dynamic feedback. Sun et al. [24] found that the collision coalescence of raindrops contributes a little more than the breakup and evaporation of raindrops in stratiform precipitation, while it is predominant in convective precipitation. Data from six flights in 2018 indicates that the liquid water content (LWC) and the number concentration of cloud droplets appeared different characteristics in different typical clouds [25]. Large differences have been found in the number concentration, evaporation, and breakup processes of raindrops in different rainfall intensities [26]. The characteristics of raindrop size distribution have been analyzed using 2D video disdrometer data in Hubei province during the 2016–2018 Meiyu seasons [27]. Additionally, the distribution and evolution characteristics of LWC in central China, during the Meiyu seasons, have been analyzed [28].
Although observations about Meiyu frontal heavy rainfall help us understand it better, a lot of microphysical characteristics that are difficult to study still exist. Therefore, the numerical weather prediction (NWP) models are important tools for our research. Clouds play key roles in weather and climate, and microphysics parameterizations affect the performance of the NWP models. All the observations should be used to verify the reliability of microphysical schemes in the NWP model. Some cumulative precipitation comparisons have been carried out [29,30].
In recent years, dual-polarization radars have been used to compare the microphysical characteristics of heavy rainfall between observations and the NWP models [31,32,33,34,35,36]. This comparison aims to improve the microphysics schemes implemented in the models. Based on the S-band polarization Doppler radar in South China, Gao et al. [37] evaluated the modeled reflectivity, differential reflectivity (ZDR) and improved model results by controlling the intercept parameter of raindrop size distribution and by increasing the raindrop breakup rates in the microphysics scheme. Zhou et al. [38] simulated a merger-formation bow echo in southeast China during the pre-summer rainy season using three microphysics schemes to compare against polarimetric observations. By decreasing the cutoff diameter of rain breakup parameterization and increasing evaporation efficiency, the simulated DSDs and precipitation were greatly improved. Sun et al. [39] compared polarimetric radar variables derived by Weather Research and Forecasting (WRF) and radar forward models and the corresponding hydrometeor species with radar observations and retrievals for a severe squall line over central China. These studies demonstrate the valuable role of dual-polarization radars in evaluating and improving microphysics schemes in models.
As for heavy rainfall in Meiyu seasons in China, the estimation and improvement of microphysical schemes in the NWP models by polarimetric radar observations are still not carried out. This study aims to (a) evaluate the differences in WRF-simulated heavy rainfall among the three double-moment schemes (Morrison, Thompson, MY) during the Meiyu season in central China and (b) explore options to modify the best-performed scheme (i.e., MY) to better match the microphysical properties deduced from polarimetric radar observations. The rest of this paper is organized as follows. Section 2 introduces the heavy rainfall case and Section 3 introduces the data and methods used. Section 4 evaluates the simulations from the three microphysics schemes in the WRF model, followed by the modifications of microphysics parameterizations. Finally, the conclusions and discussions are given in Section 5.

2. Case Description

A Meiyu front heavy rainfall hit the middle of the Yangtze River from the 27th to the 28th of June 2020, which caused great economic loss. In the initial stage of precipitation (Figure 1(a1)), a shortwave trough is observed at 500 hPa over the middle and upper reaches of the Yangtze River. The entrance region of the upper-level jet stream is located in the northeastern area of the middle and lower reaches of the Yangtze River at the same time. These mid-level and upper-level circulation patterns could induce vertical motion adiabatically in the middle reaches of the Yangtze River. A low-level vortex is found to move downstream along the Yangtze River at 700 hPa. Correspondingly, the area of high temperature and high humidity represented by the generalized potential temperature is also located near the vortex (Figure 1(b1)). At 850 hPa, there is also a strong water vapor convergence zone near the vortex (Figure 1(c1)). These mid- and lower-level circulation characteristics are conducive to precipitation formation in the middle reaches of the Yangtze River. During the mature stage (Figure 1(a2,b2)), the mid- and upper-level circulations favorable for precipitation weaken, i.e., the mid-level shortwave trough weakens, and the upper-level jet stream core moves northward. However, the high temperature and humidity remain over the Yangtze River region, and there is also an evident water vapor convergence in the lower levels (Figure 1(c2)). Accordingly, the hourly precipitation averaged over the middle reaches of the Yangtze River remains at 3.5 mm. During the decay stage, the mid- and upper-level circulations favorable for precipitation continue to weaken and shift eastward (Figure 1(a3,b3)). The area of strong water vapor convergence in the lower levels has shifted northeastward to the lower reaches of the Yangtze River. Moderate water vapor convergence can still be observed in the middle reaches of the Yangtze River, but the precipitation gradually decreases (Figure 1(c3)).

3. Materials and Methods

3.1. Data Description

The data used in this study include surface precipitation data at a spatial resolution of 0.1° × 0.1°, obtained from CMORPH (Climate Prediction Center Morphing). The data cover mainland China from 00:00 UTC on 26 June to 12:00 UTC on 28 June 2020 and were provided by the China Meteorological Administration with quality control [40]. This dataset is a high spatiotemporal resolution gauge-satellite merged product based on hourly precipitation observations. Discrepancies ranging from −0.3 mm/h to 0.4 mm/h were found between the hourly CMORPH data and gauge data. Additionally, the ERA5 dataset, provided by the Copernicus Climate Change Service (C3S) at the European Center for Medium-range Weather Forecasts, offers initialization and lateral boundary conditions with a resolution of 0.25° × 0.25° and a one-hour interval in the model experiment.
The radar observation data in this study are mainly from the S-band polarimetric radar located at Suizhou City in Hubei province, central China (named SZ_SPOL). As a member of China’s weather surveillance radar network, SZ_SPOL has been upgraded with polarimetric capability since 2020. The maximum detection range of SZ_SPOL is more than 250 km, with the range resolution (bin width) of 250 m, and the sampling time interval for volumetric scanning costs is about 6 min. The main configuration of SZ_SPOL is also shown in Table 1.
Here, ZH is a horizontally polarized radar reflectivity factor, which provides information about the intensity of radar echoes for horizontally polarized electromagnetic waves. ZDR is differential reflectivity, which provides information about the shape and size of hydrometeors. ΦDP, or differential phase shift, is used to measure the difference in the phase of the received radar signals between the two polarization states. KDP, the specific differential phase, is calculated by taking the derivative of ΦDP with respect to the range. It represents the rate of change of the phase shift with distance.
To ensure the reliability of radar data in quantitative applications, the data quality procedures similar to Huang et al. [41] (including the removal of non-meteorological echoes, attenuation correction of ZH, bias correction of ZDR and process of ΦDP) are performed first. In particular, the least square fitting algorithm [42] is used in this study to calculate KDP.
To enable a comparison with numerical model output, the radar data were interpolated onto a three-dimensional Cartesian grid with both horizontal and vertical grid spacing of 500 m using the Radx C++ library developed by the National Center for Atmosphere [43]. Subsequently, the hydrometeor identification (HID) algorithm adapted for S-band [44] was used to classify the precipitation into 10 categories. Then, the raindrop size distributions (DSDs) were retrieved from ZH and ZDR at the grid points classified as liquid hydrometeors (drizzle, rain and big drops) by the HID algorithm assuming a constrained-gamma DSD model [45], with the shape–slope relationship adapted for central China [27]. The mass-weighted mean diameters Dm (unit: mm) were calculated from the retrieved DSDs for analysis.

3.2. Model Configuration

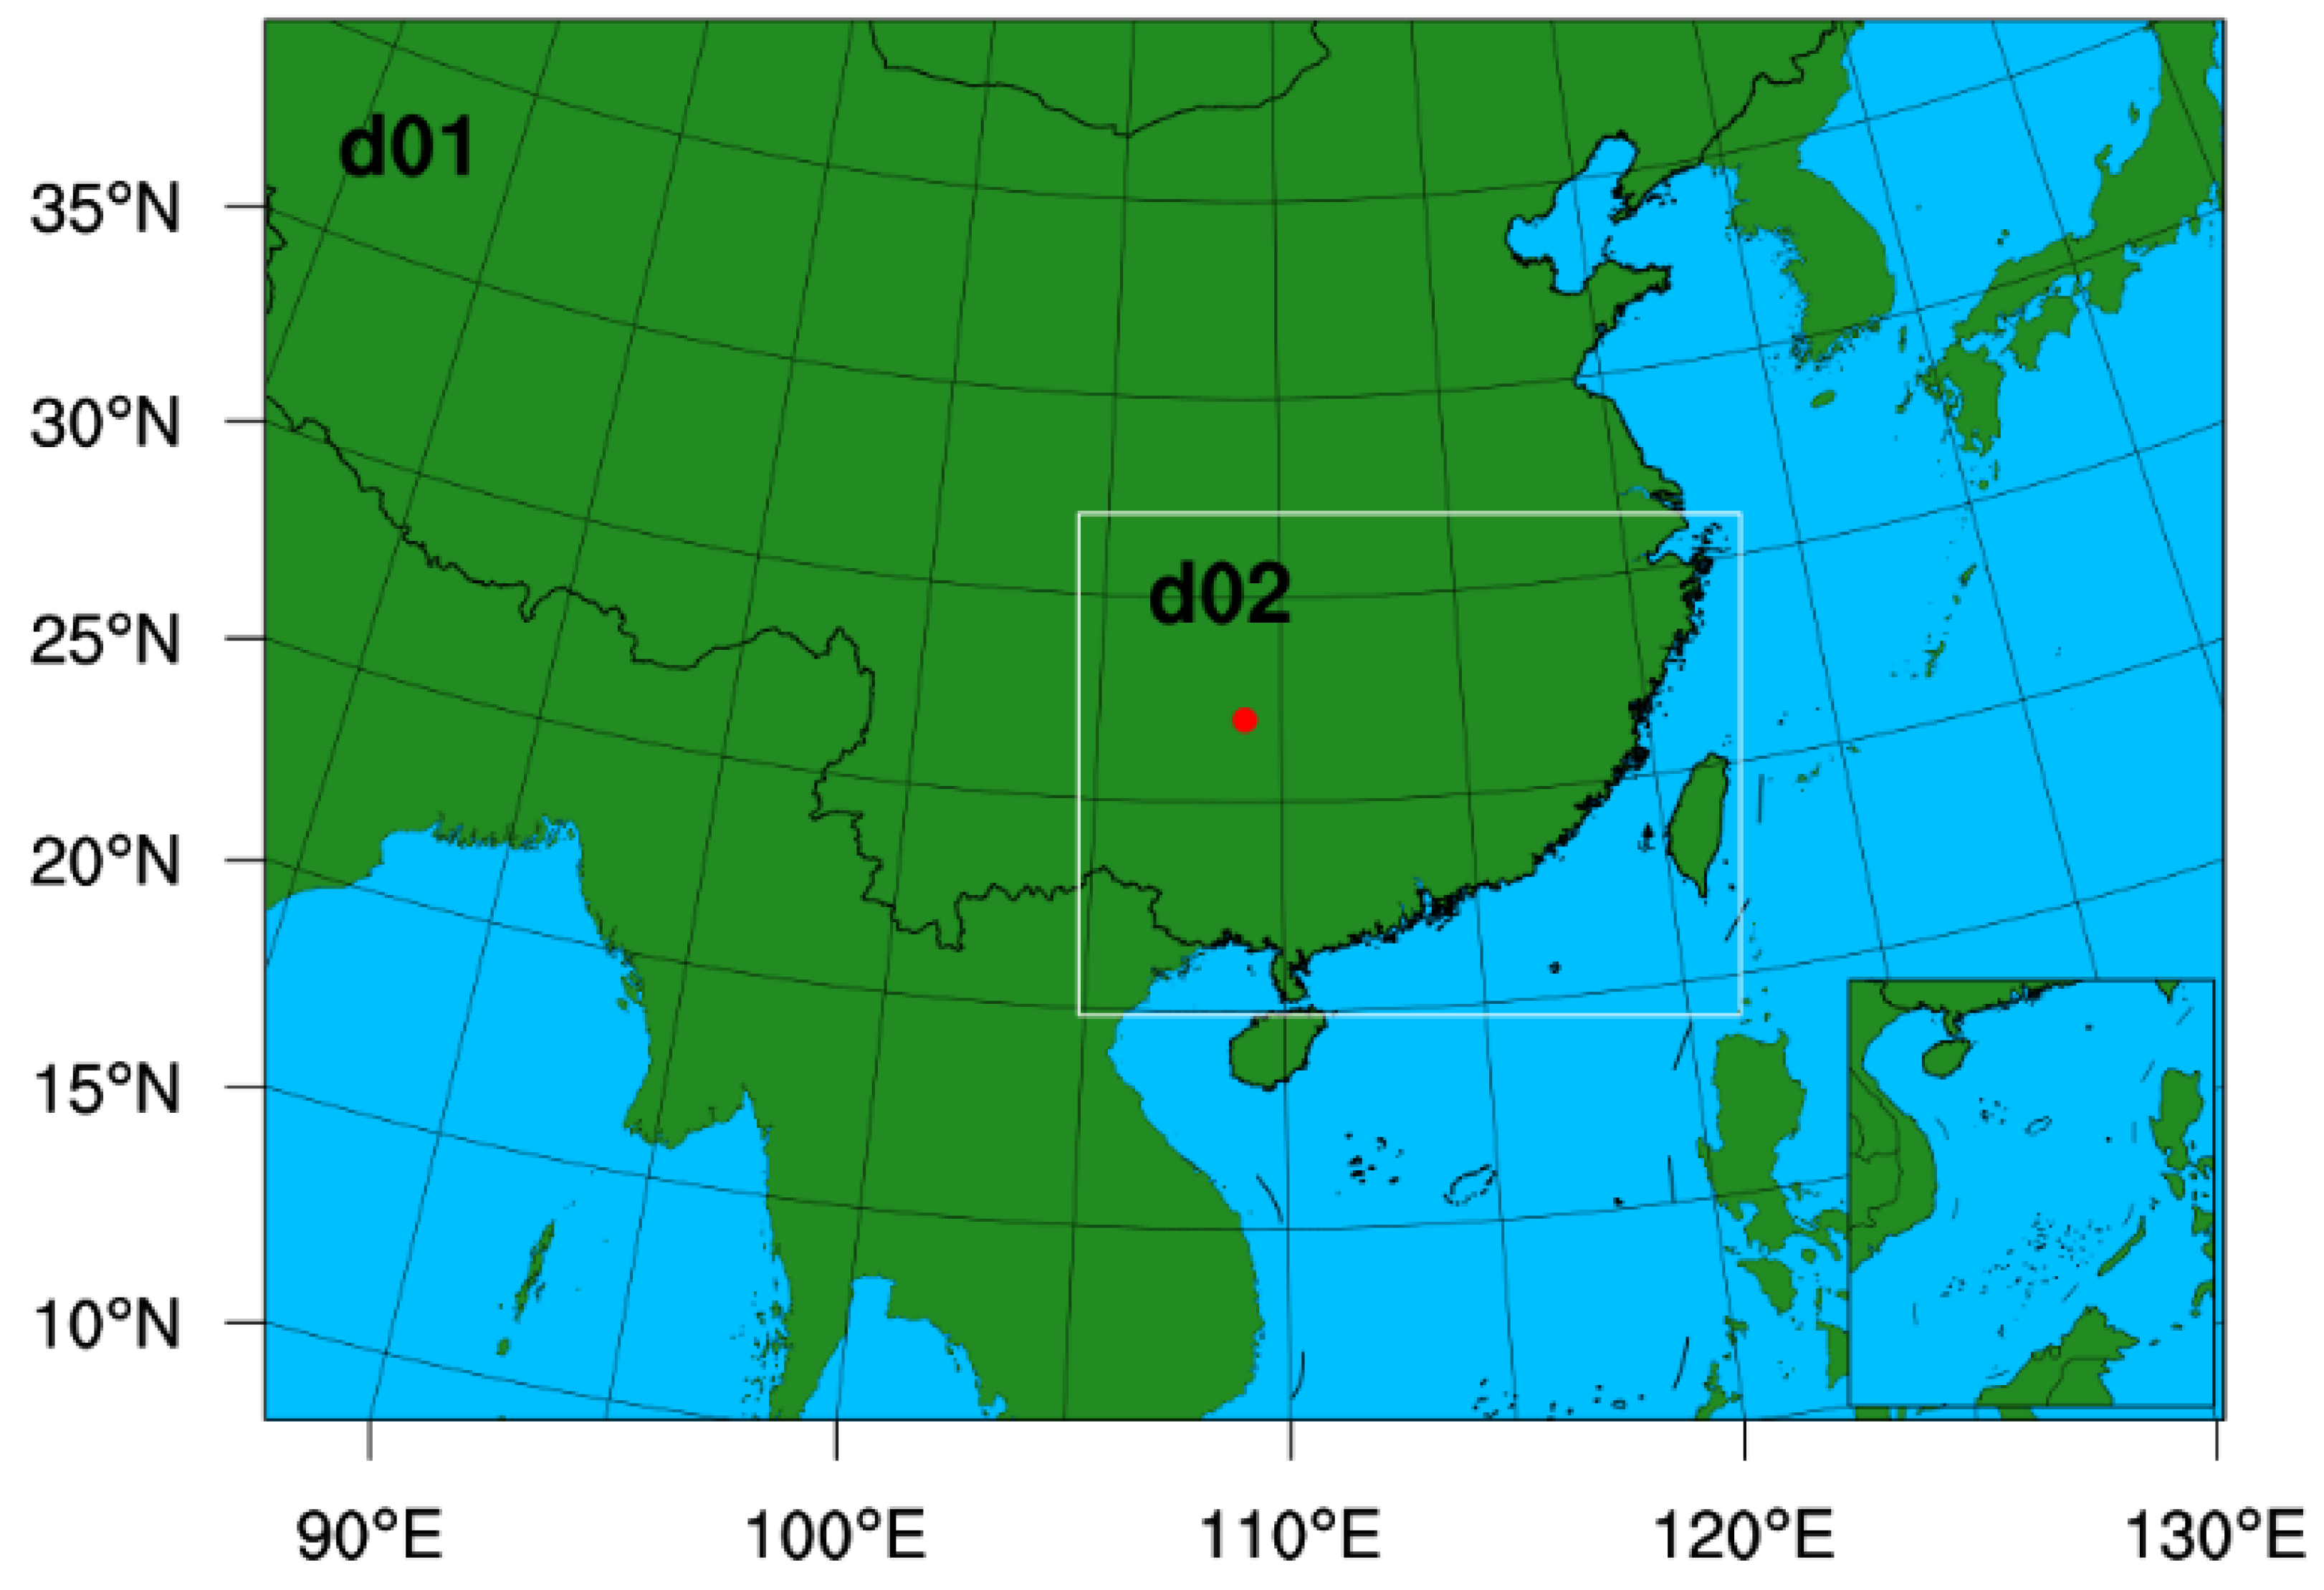
We utilized the WRF model version 3.4.1 with three two-moment microphysical schemes to carry out the simulation. The numerical experiment involved one-way nested domains with horizontal grid spacings of 9 km and 3 km, and time steps of 30 s and 10 s. The horizontal grids were 601 × 430 and 610 × 463, respectively (refer to Figure 2). All domains were configured with 51 vertical levels, extending from the surface to a model top at 10 hPa. The physics schemes employed in this study included the Noah land surface model [46], the Mellor–Yamada–Janjic TKE planetary boundary layer (PBL) scheme [47], the Duhia short wave radiation scheme [48], the RRTM longwave radiation scheme [49] and the Kain–Fritsch cumulus scheme [50], which was turned off in the inner domain. Additionally, simulations were conducted using the Morrison [51], Thompson [52] and MY [53,54] microphysical schemes to assess the model’s sensitivity to different microphysical parameterizations. The model integration began at 12:00 UTC on 26 June and ran for 48 h until 12:00 UTC on 28 June 2020, with the first 12 h of results discarded in the analysis. The analysis primarily focused on outputs from the inner domain, as it better resolved fine-scale orographic features and convective processes.
The analysis of hydrometeors budget is valuable for understanding cloud microphysical processes and mechanisms in surface precipitation. However, discrepancies in the definition of hydrometeors and microphysical processes contribute to increased uncertainties in microphysical schemes. To focus on the contribution of hydrometeors to precipitation and the relationship between liquid and frozen hydrometeors, mass transfer among frozen hydrometeors was not considered. Instead, all frozen hydrometeors were treated as a whole when examining the microphysical processes between liquid particles and frozen hydrometeors [30].
The main source and sink terms of raindrop are listed in Table 2. “N-” and “Q-” hereinafter indicate the number concentration (unit: m−3) and mass content (unit: g m3) of raindrop by the microphysical processes.

4. Results

4.1. Comparison of Simulation Results to Observations

4.1.1. Precipitation and Radar Reflectivity

Figure 3 shows the observed 36 h cumulative rainfall from 00:00 UTC 27th to 12:00 UTC 28th in 2020 and simulated cumulative rainfall with different microphysics schemes from 00:00 UTC 27th to 12:00 UTC 28th in 2020.
The modeled cumulative precipitation is interpolated to a resolution of 0.1° to compare with observations. The nearly southwest–northeast-oriented rain bands can be seen at the surface. The region of intense rainfall is primarily situated in Hubei province (represented by the red solid square in Figure 3), central China. To facilitate a direct comparison with the modeled microphysical outputs, the radar observations are interpolated to match the same resolution as the model outputs in the area indicated by the solid dashed line in Figure 3a. The three model runs generally reproduce the overall distribution of cumulative precipitation well, especially in the southwest and northeast of the area indicated by the red solid square. However, the modeled precipitation is obviously overestimated. The maximum cumulative precipitation during 00:00 UTC 27th to 12:00 UTC 28th in 2020 in Hubei province produced by the Morrison, Thompson and MY schemes is 484.74 mm, 423.17 mm and 409.89 mm, respectively, while the observed precipitation is less than 250 mm. Generally, the MY run performs slightly better than the other two runs.
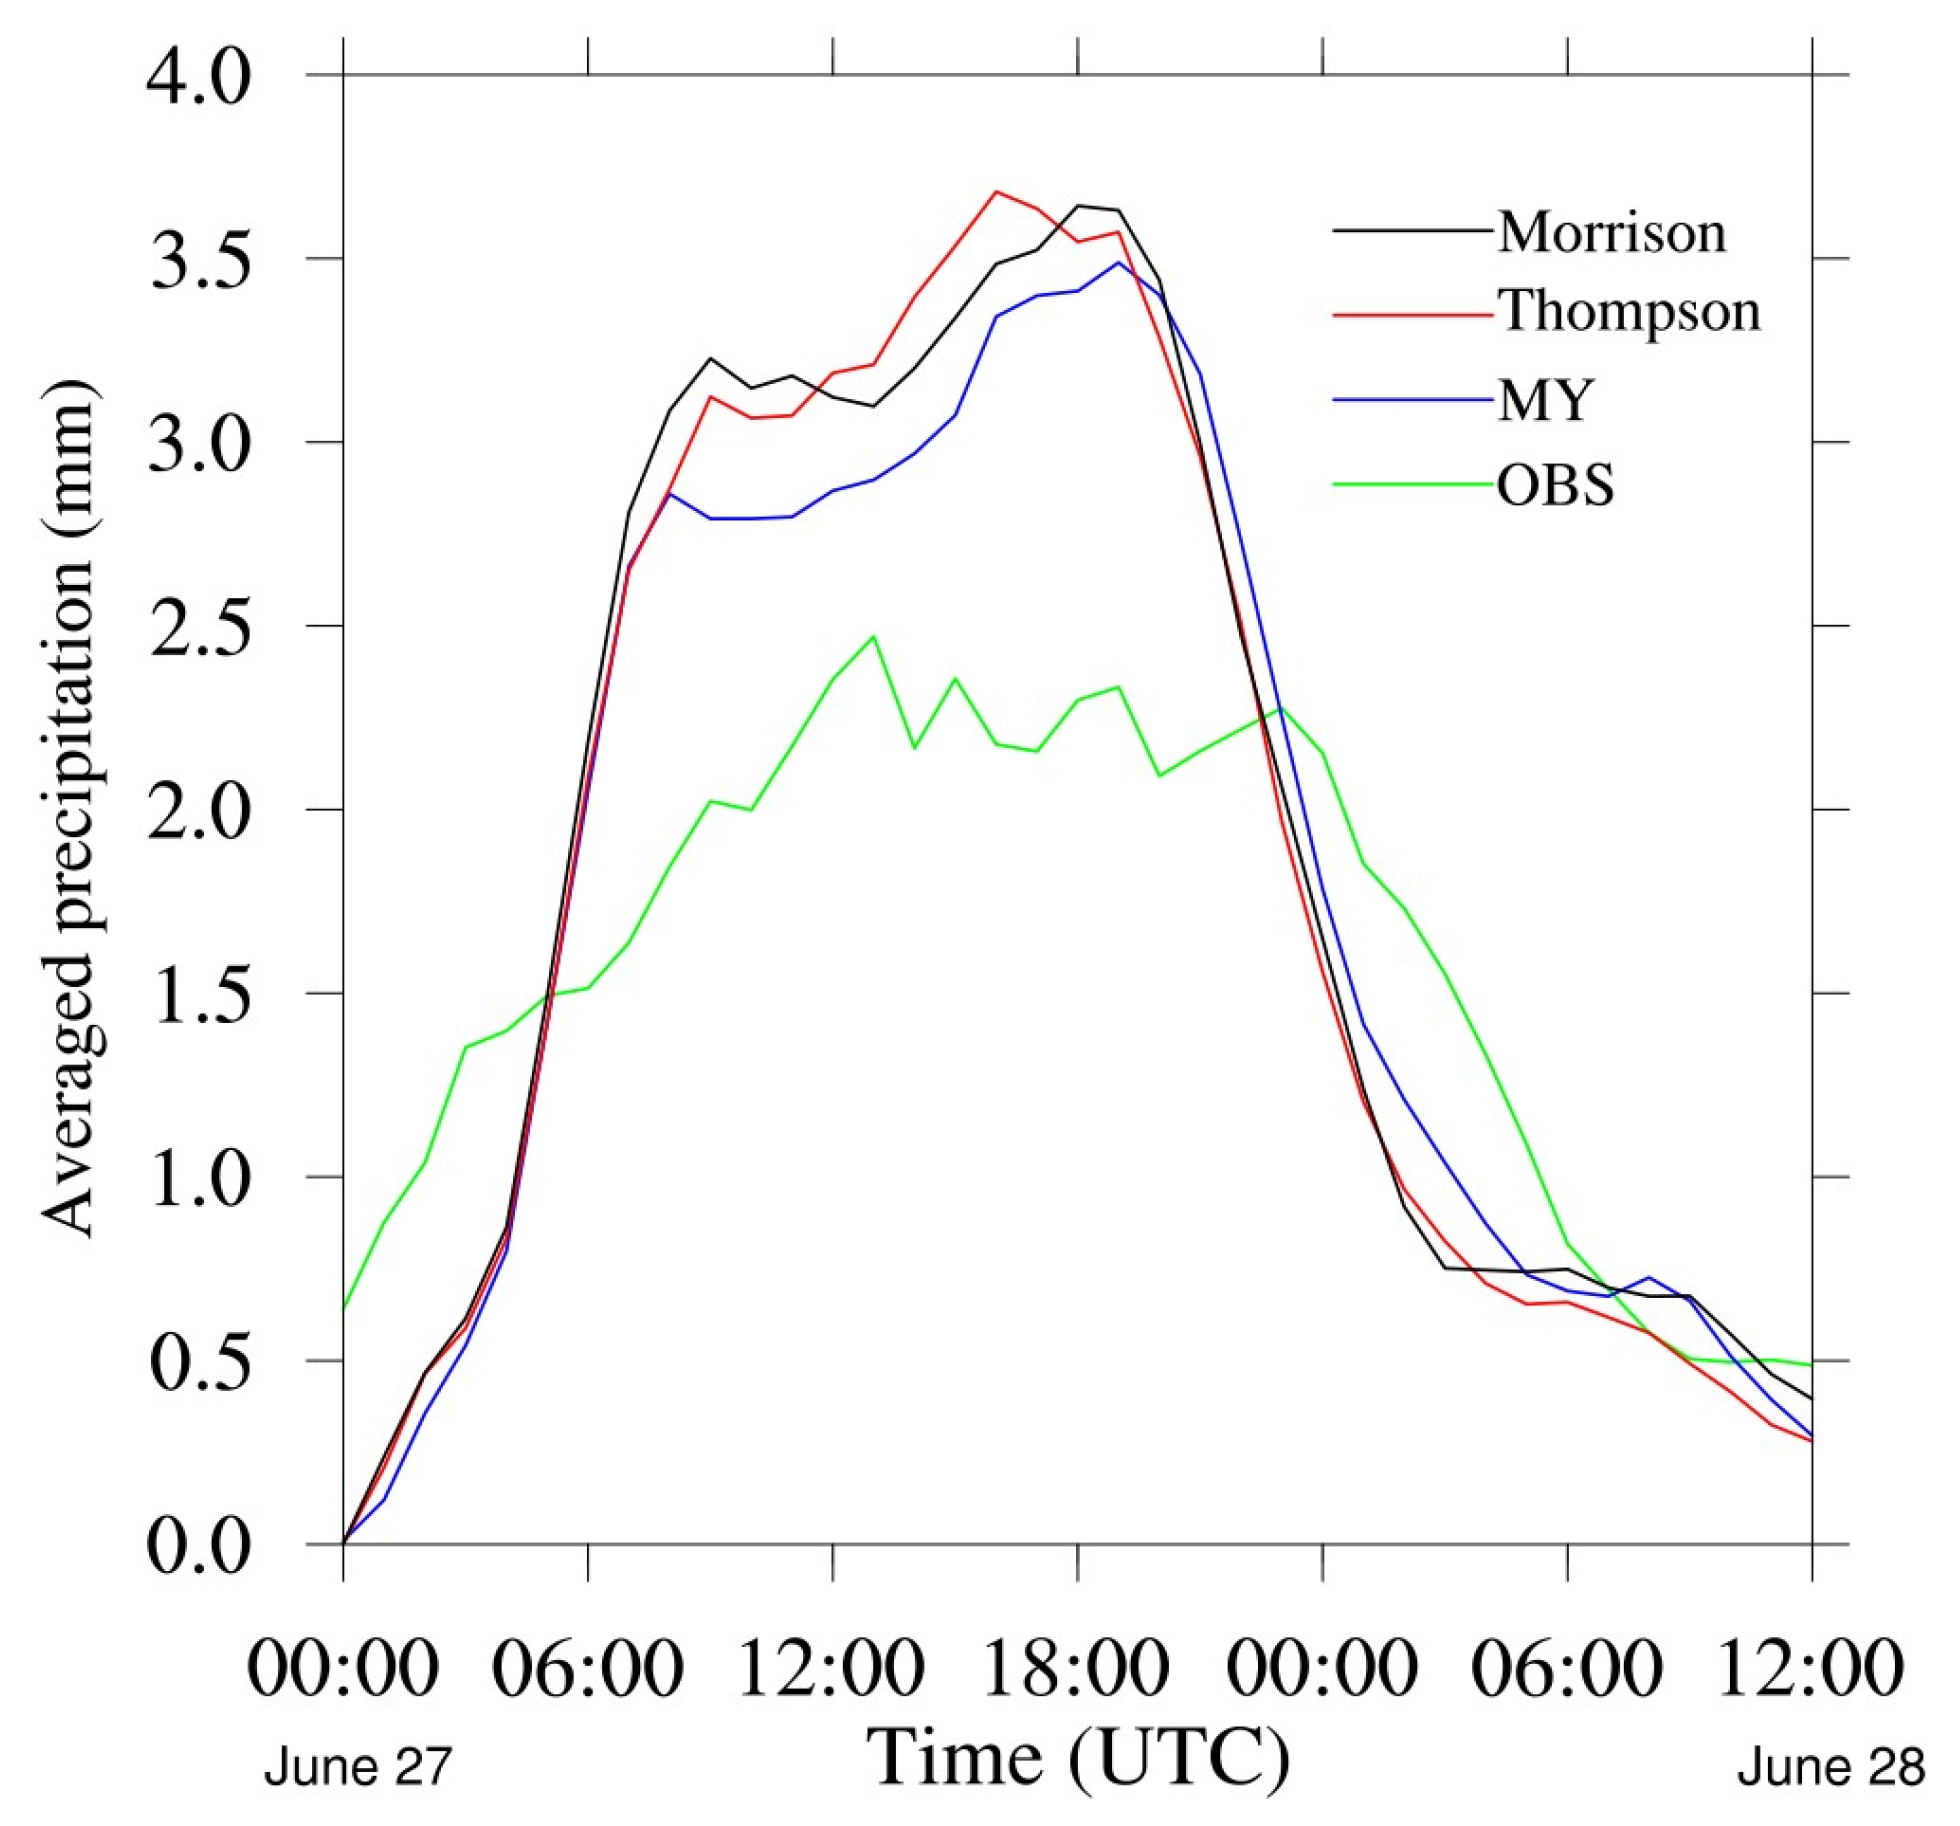
Figure 4 compares the 36 h time series of the averaged rainfall intensity (ave-Rain, hereafter) in the area indicated by the red rectangle in Figure 3.
Before 05:00 UTC 27 June and from 23:00 UTC 27 to 07:00 UTC 28 June, the ave-Rain is observed to be consistently higher than the modeled ave-Rain in all three runs. Furthermore, the evolution of the observed ave-Rain exhibits a smoother pattern, whereas the modeled ones show more pronounced fluctuations, which is similar to previous findings [30]. Notably, the MY run produces the relatively least (largest) ave-Rain when the rainfall intensity increases (decreases), making it closer to the observed results. In general, the time evolution of the modeled ave-Rain closely resembles the observations, with the MY run outperforming the other two runs. According to the results from Figure 4 and the synoptic situation mentioned in Figure 1, 08:00, 15:00 and 22:00 UTC on 27 June are chosen to represent the initial (development), mature and decay stages of the heavy rainfall event, respectively, in subsequent discussions.
The distribution of composite echo reflectivity at different times is compared among the simulated results and observed ones in Figure 5.
According to the synoptic circulation mentioned above, the precipitation of this event is mainly caused by two systems: the low vortex and the shear line. In Figure 5, the red rectangular area denotes both the observation area of the polarimetric radar and the region with strong echoes. To facilitate a comprehensive comparison and analysis of the simulated and observed results, the red rectangular area in the simulated outputs is shifted 0.3° north in comparison to the observations. Given that the numerical simulation conducted in this study is initialized with large-scale meteorological conditions without any mesoscale data assimilation, this slight deviation is acceptable [55,56]. At 08:00, the strong echo band on the southwest side (Label B) of the red rectangular area is caused by the southwest vortex, and the strong echo area with a “northwest-southeast” orientation (Label A) in the rectangle is caused by a warm shear line. At this time, the simulated echoes are stronger than the observed values in the red rectangular area. At 15:00, due to the strengthening of the southwest jet stream and the eastward movement of the system, the primary echo band mainly exhibits a “northeast-southwest” orientation, and its intensity experiences a notable increase. At 22:00, although the echoes on the east side of the red rectangular area in Figure 5 start to strengthen, the enhancement of echoes on the eastern side is beyond the scope of this study. The primary focus of this investigation is the precipitation evolution in the red rectangular area in Figure 3. Compared to 15:00, the echoes in the red rectangular area start to weaken at this time. Although the simulated echoes are relatively stronger compared to the observed ones, the overall agreement between the simulations and the observations is considered satisfactory. Additionally, the discrepancies among the simulated results themselves are not substantial.

4.1.2. Differential Reflectivity and Specific Differential Phase

The differential reflectivity (ZDR) and specific differential phase (KDP) are analyzed in this section to understand the differences between model results and observations. A statistical technique developed by Yuter and Houze [57] called Contoured Frequency with Altitude Diagram (CFAD) is used to quantitatively compare the model simulations and S-Pol polarimetric radar observations. It computes the probability density of a field as a function of altitude and provides insight into the structure of the cloud system.
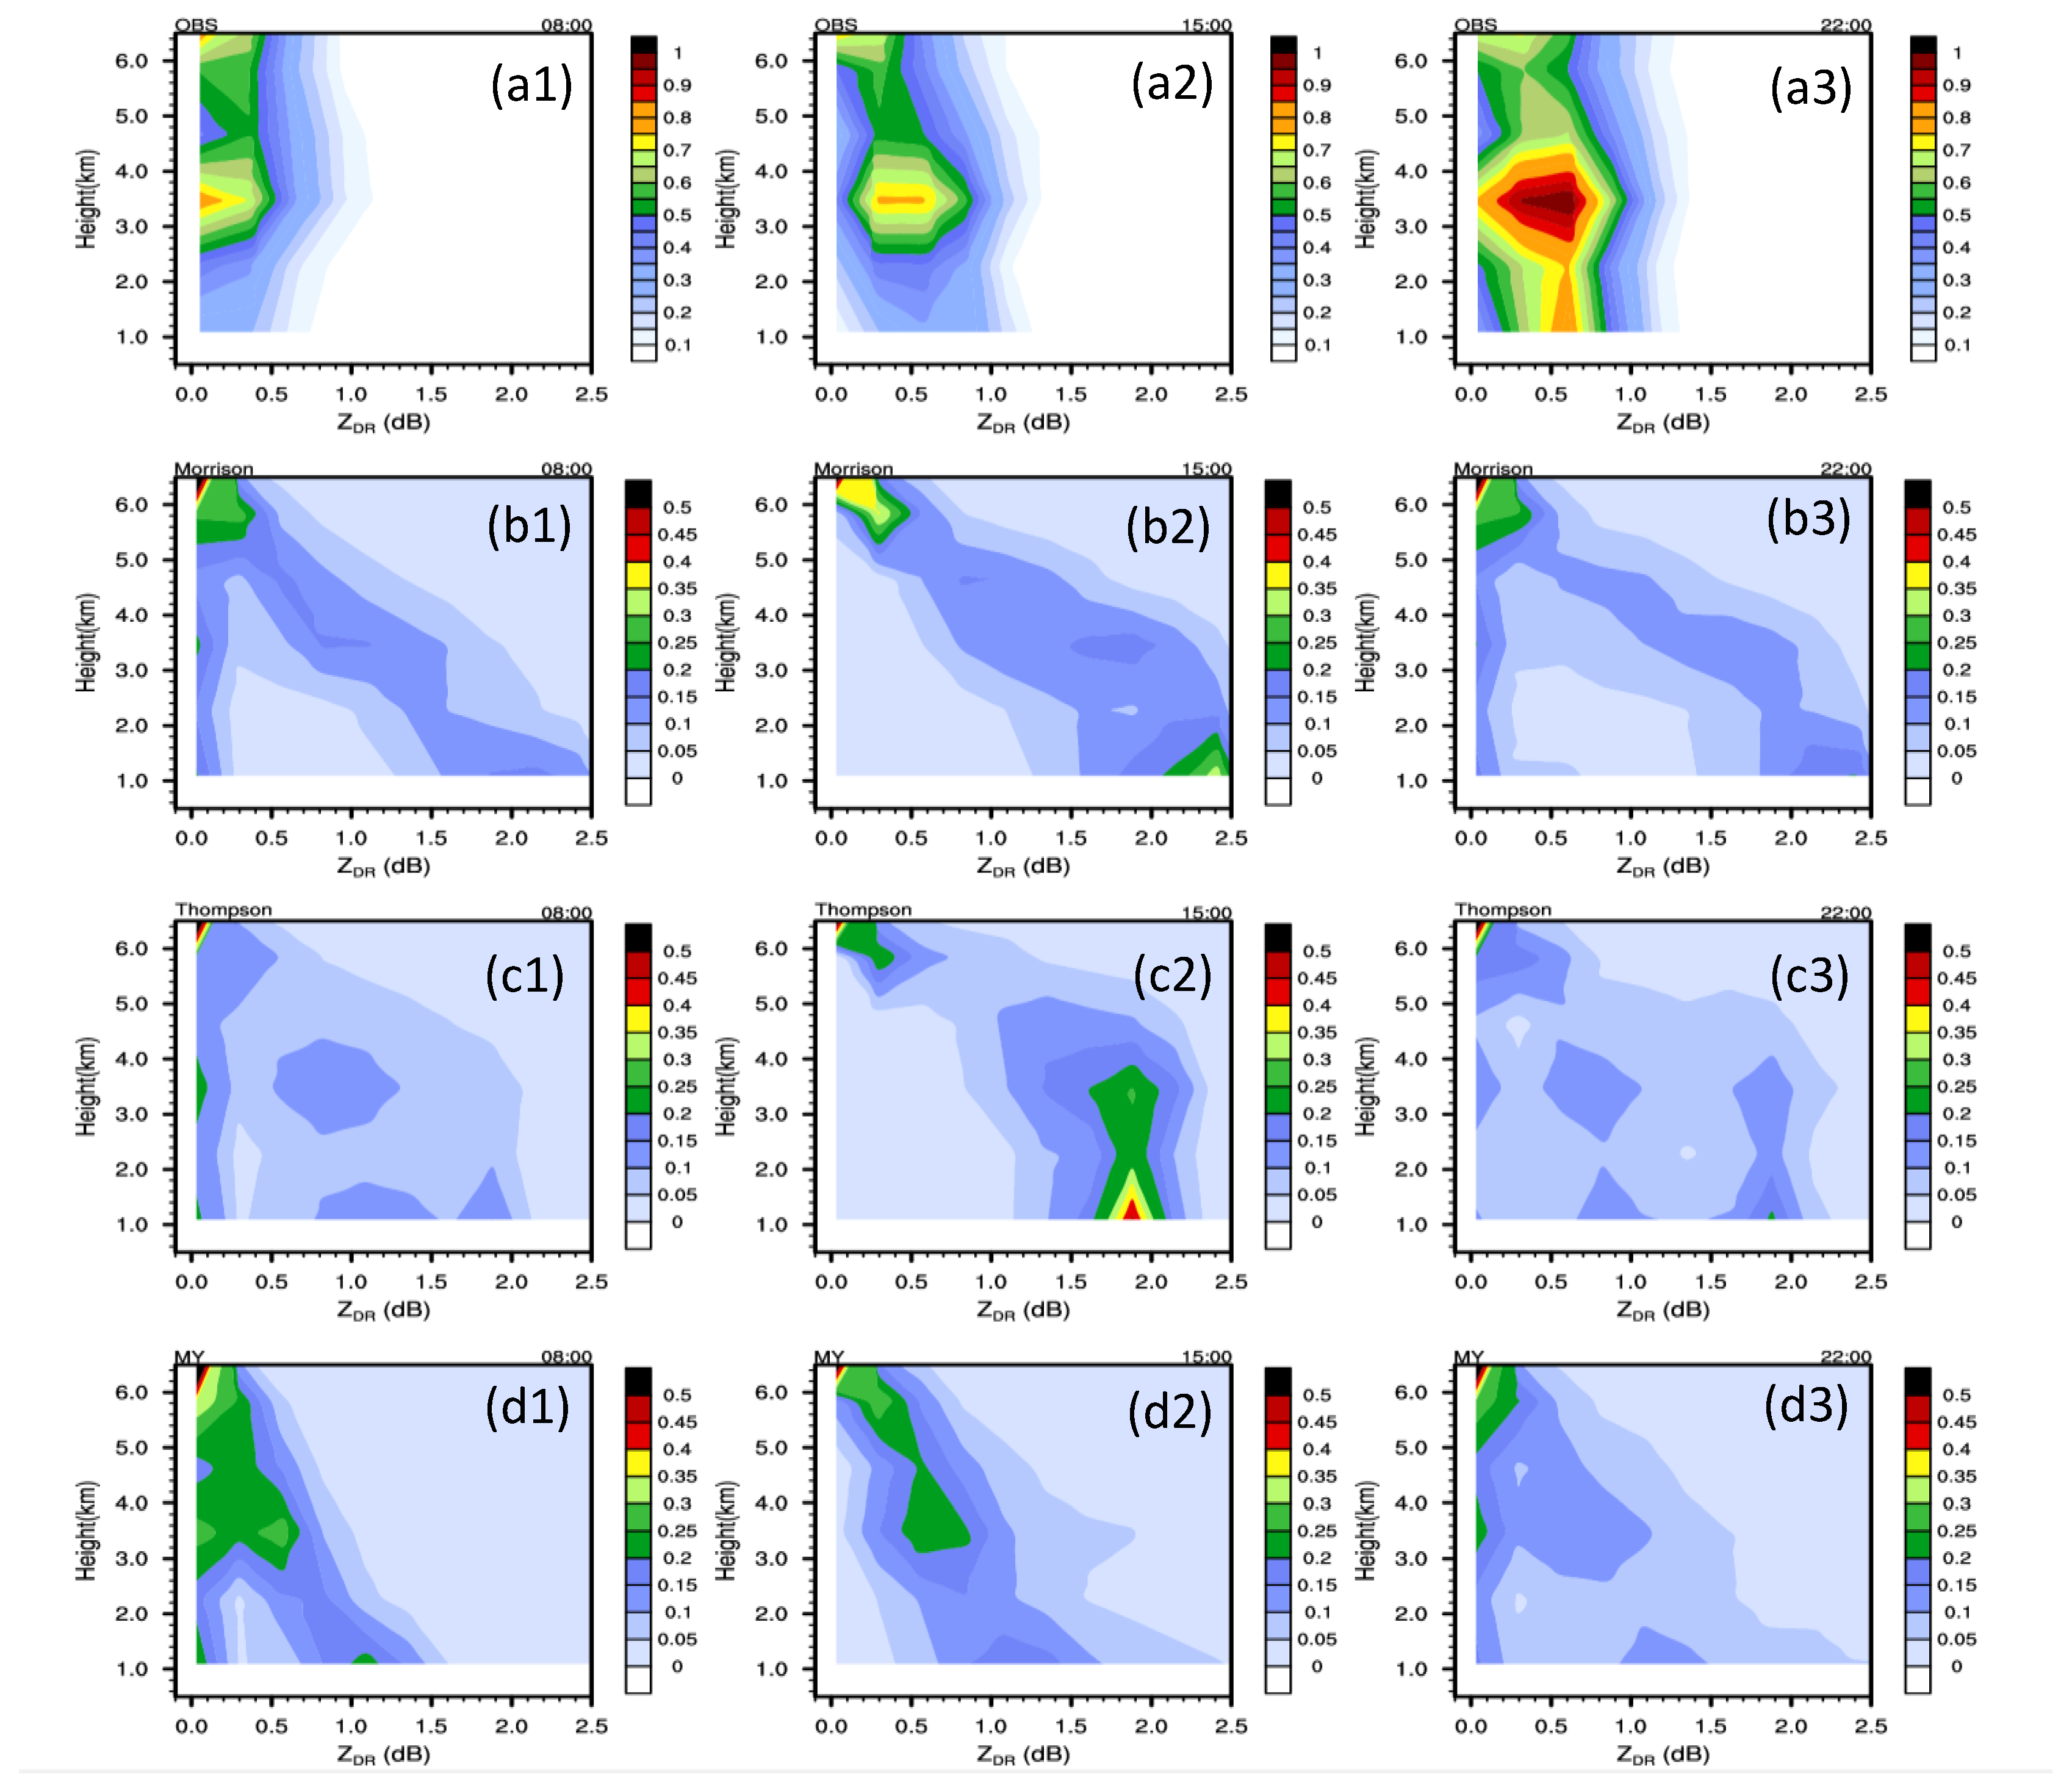
Figure 6 shows normalized CFADs of the differential reflectivity (ZDR) below 6.5 km (the zero-degree isotherm is at about 5.5 km) in different stages.
Notably, significant discrepancies are observed in the ZDR above the freezing level due to variations in the parameterization of ice-phase particles within numerical models. However, it should be noted that the analysis in Figure 6 solely focuses on the ZDR below 6.5 km. This is because there is a lower presence of raindrops above this altitude. Additionally, ZDR values below 0.2 dB are excluded from the analysis to avoid any potential errors from both the model and measurements [37].
Figure 6(a1–a3) depict the ZDR CFADs obtained from the S-Pol observations. The CFAD analysis reveals a distinct peak probability for the observed ZDR above the freezing level, which is generally consistent with all three simulation runs. However, the observed probabilities tend to be slightly higher than the simulated ones. To accurately represent this difference, a color bar with larger probabilities is employed for the observed data. At 08:00, as shown in Figure 6(a1), there exists another peak probability for the observed ZDR between 3 km and 4 km. The CFADs of ZDR at different levels are approximately reproduced by the three runs; however, notable differences are observed. Specifically, in the Morrison run, ZDR increases towards the ground when it exceeds 0.4 dB. Additionally, the probability distribution is wider, suggesting significantly larger raindrop diameters compared to the observations. (Figure 6(b1)). The Thompson run produces a slightly smaller ZDR compared to the Morrison run (Figure 6(c1)). In the MY scheme, the distribution of probabilities is narrower than that of the other two runs, which is more consistent with the characteristics of ZDR. However, it is worth noting that ZDR in the MY scheme increases towards the ground with a steeper slope compared to the Morrison run (Figure 6(d1)). Because the evolution of the simulated precipitation is more rapid, higher probabilities are observed near the surface in the three runs at this time and all the runs produce larger ZDR, indicating larger raindrops diameter compared to observations.
At 15:00, precipitation intensifies, the melting of ice phase hydrometeors and the accretion of cloud droplets by raindrops increase. The height of the peak probabilities remains constant, while the probabilities and ZDR increase dramatically. As the development of precipitation and the sedimentation of raindrops, the diameter of raindrops and ZDR near the ground increases. Apart from the higher probabilities near the surface, the CFADs of ZDR in the MY scheme demonstrate the closest agreement with the observed values. In the Morrison and Thompson runs, higher probabilities and larger ZDR near the ground indicate larger raindrops, which contrasts significantly with observations.
At 22:00, the peak probabilities for the observed ZDR increase significantly. And the probabilities exhibit a pronounced increase below 2 km due to the sedimentation of raindrops. Based on the aforementioned analysis, it is apparent that the simulated precipitation diminishes at a faster rate compared to the observed precipitation. Therefore, all the simulated peak probabilities of ZDR decrease, which is different from observations. Overall, there exist substantial disparities among the simulated probabilities for ZDR, with the MY run demonstrating better performance when compared to the other two runs.
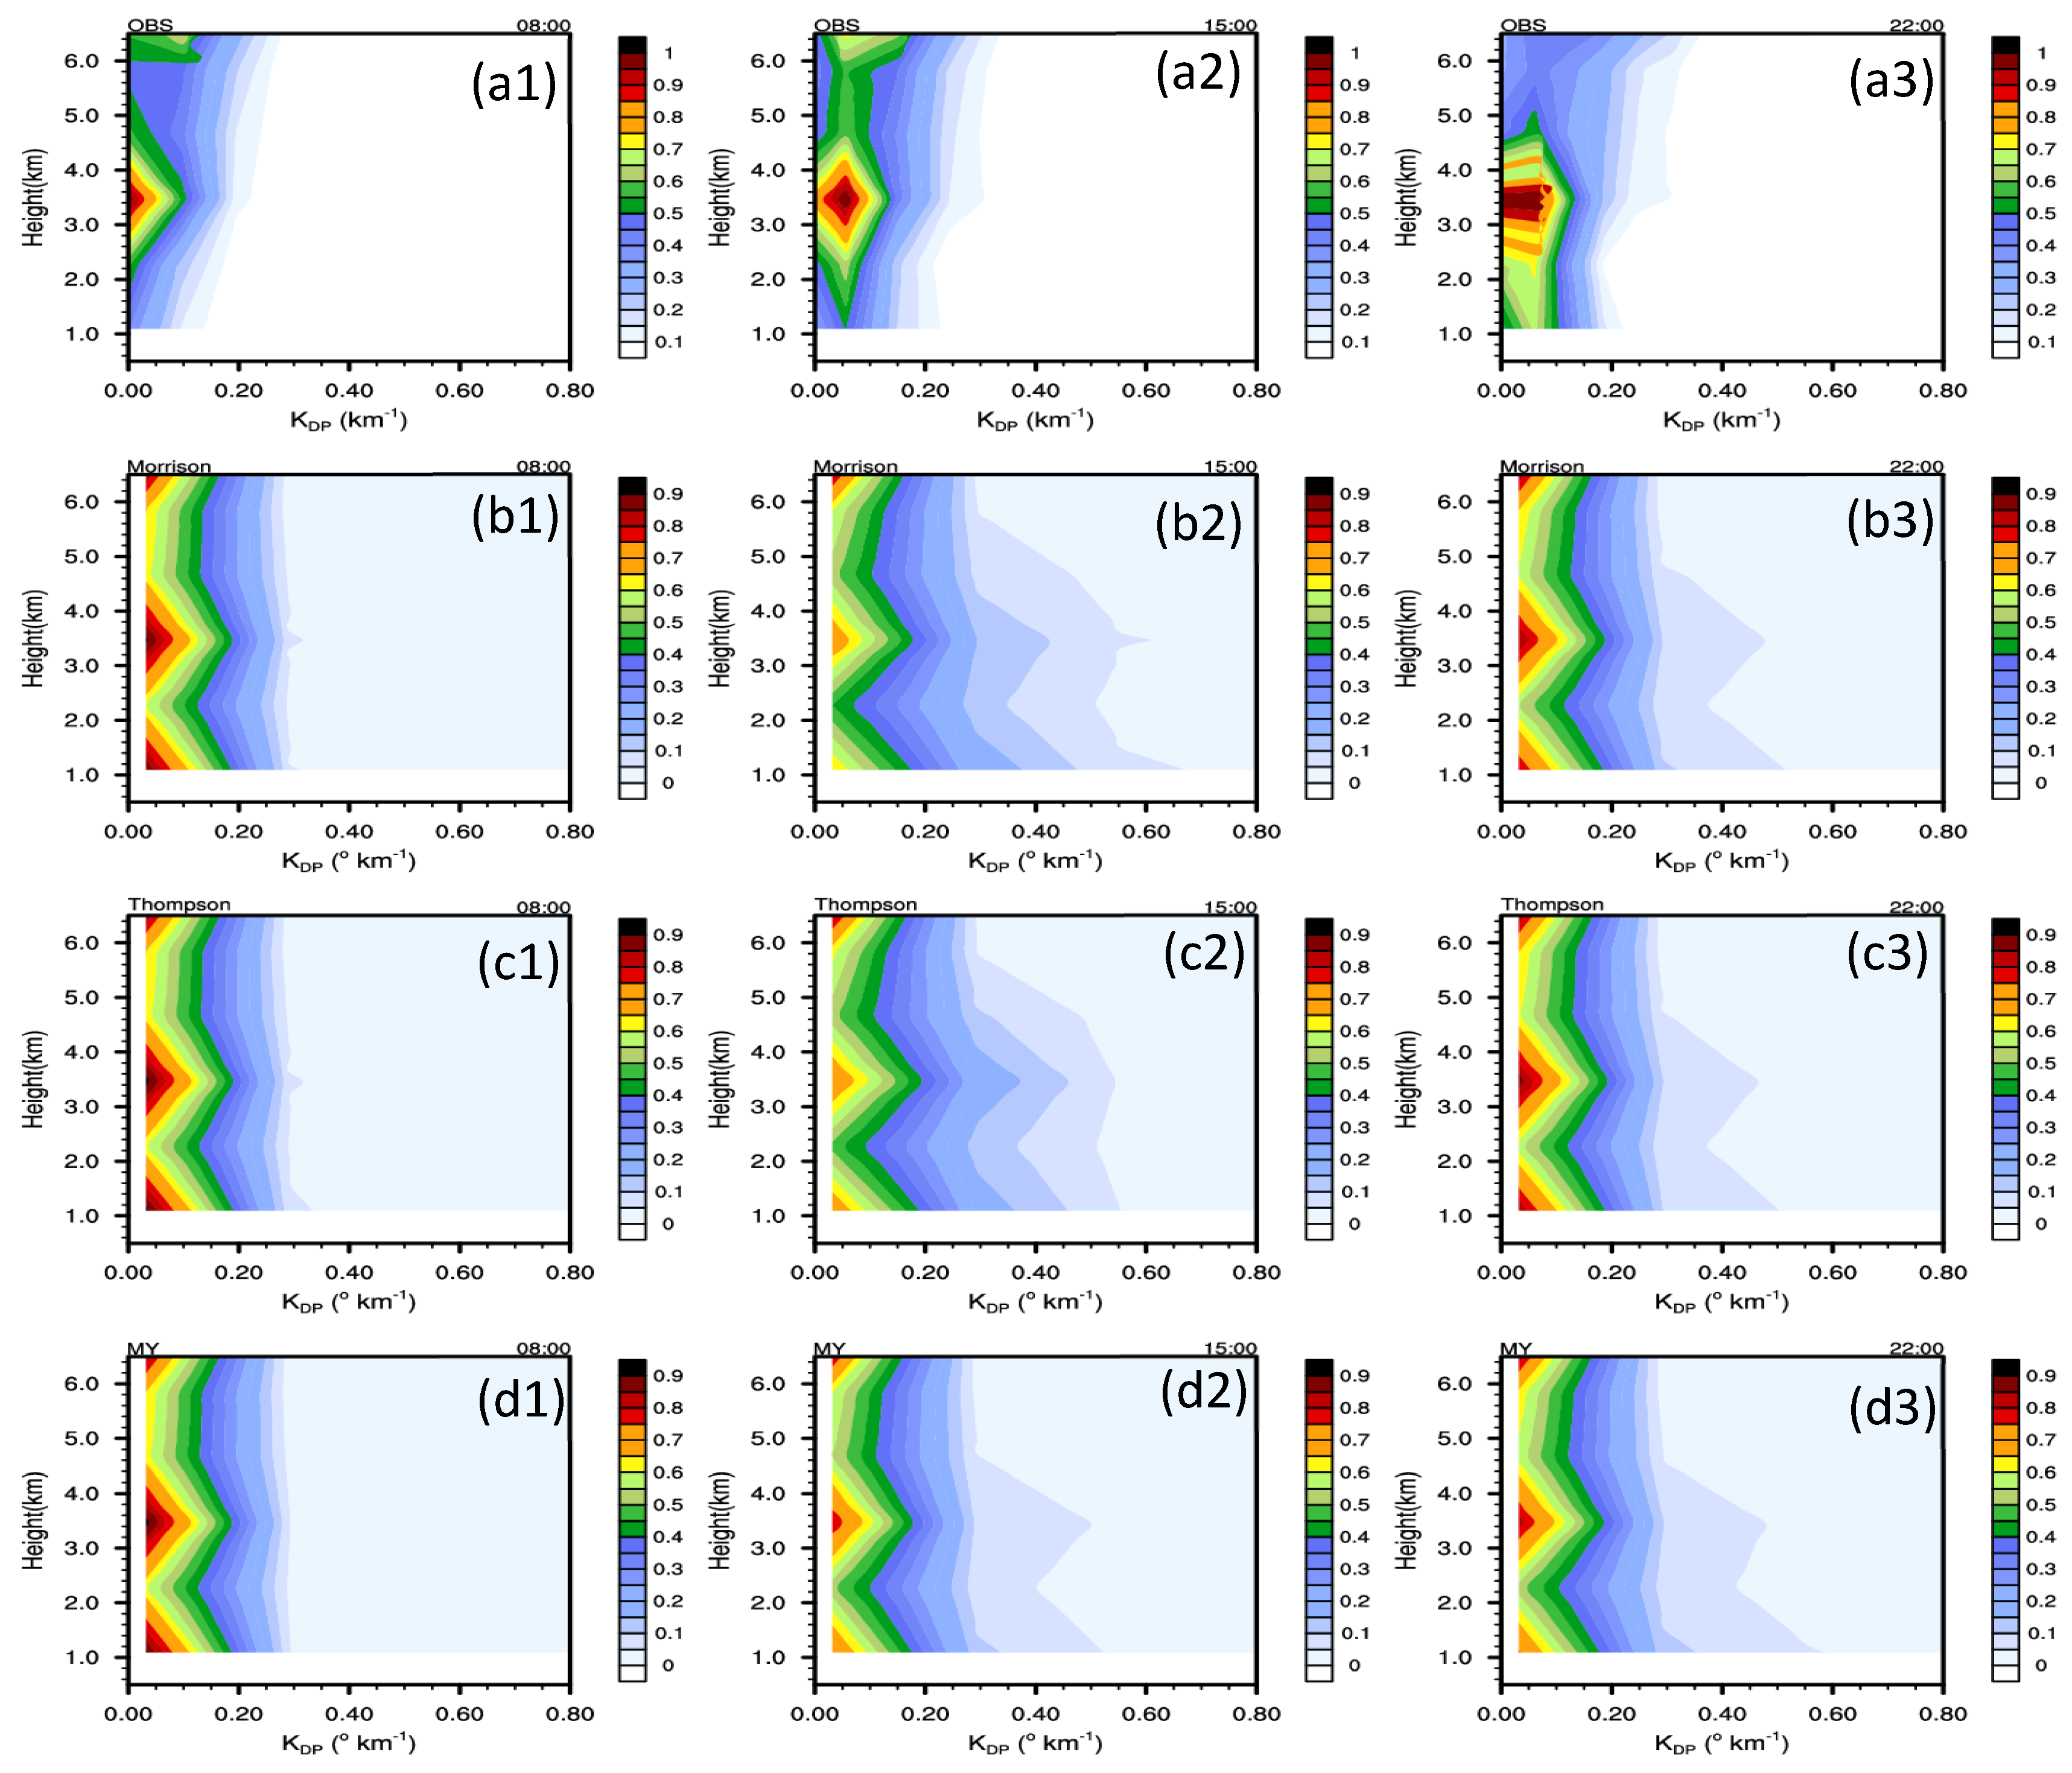
Figure 7 shows normalized CFADs of KDP below 6.5 km (the zero-degree isotherm is at about 5.5 km) in different stages.
Similar to Figure 6, there are two peak values of the probabilities for the observed KDP (Figure 7(a1–a3)). One is located above the freezing level, and the other is found between the levels of 3 and 4 km. At 15:00, the probabilities and KDP experience an increase while the height where the extreme values are located remains constant. At 22:00, the probabilities for KDP decrease obviously above the freezing level while they increase between the levels of 3 and 4 km. Additionally, it is worth noting that the higher probabilities near the ground primarily arise from the sedimentation of raindrops. At 08:00, all three runs produce similar probabilities for KDP, exhibiting higher probabilities and larger KDP than observations above freezing level. At 15:00, the simulated KDP from the three runs increases and the maximum KDP is larger than the observations. And the Morrison run produces the largest KDP while the MY run produces the smallest one. At 22:00, the probabilities below the level of 5 km increase in the three runs, which are consistent with observations. And the KDP values produced by the Morrison and Thompson runs exhibit a slight decrease compared with the values at 15:00. In contrast, the MY run demonstrates a less pronounced change in KDP values during this period. Generally, all three runs produce similar probabilities, which are generally consistent with observations, especially between 3 and 4 km.
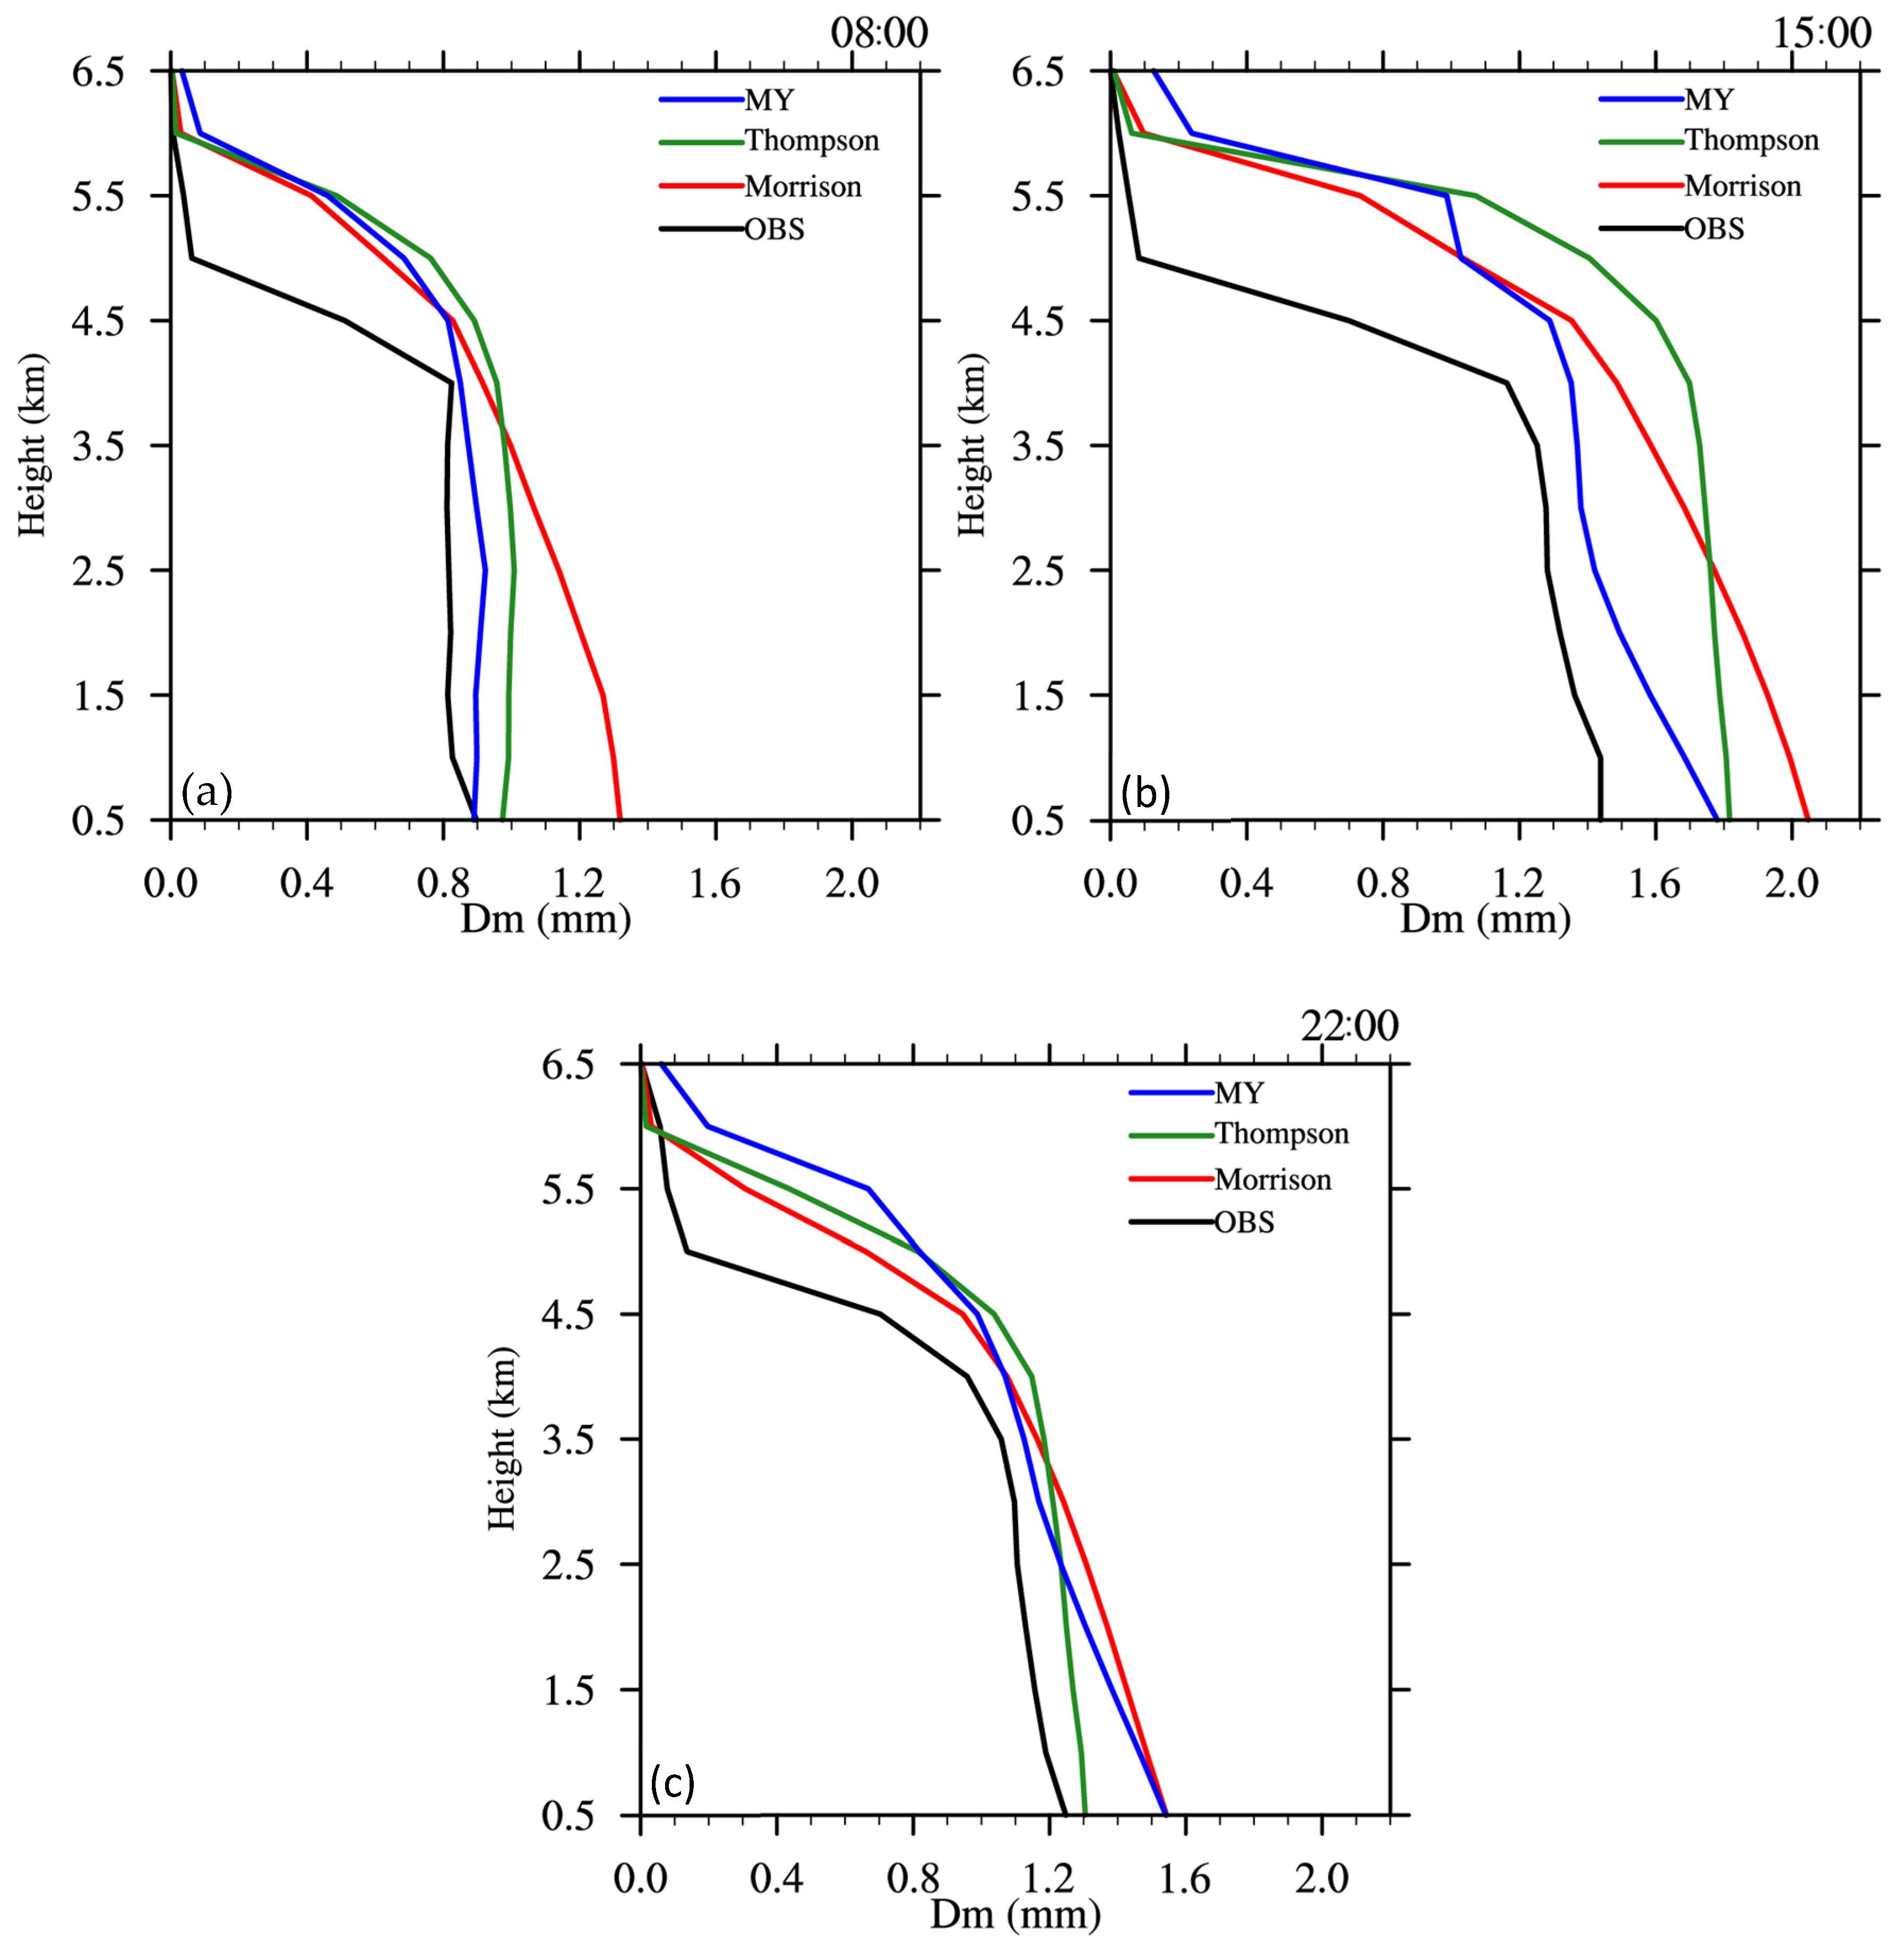
Figure 8 shows profiles of area-averaged Dm derived from observations and simulations over the domain represented by the red rectangle in Figure 5 on 26 June 2020.
The mass-weighted mean diameter Dm is calculated in the model with [37]
D m = ( 4 + α ) / λ ,
where α and λ are the shape factor and slope parameter, respectively.
Above the height of 6.5 km (approximately −5°), the value of Dm remains nearly zero. Consequently, the discussion of Dm is limited to below the 6.5 km level in this section. Analysis of the observed Dm values in various stages indicates that the most rapid growth in raindrop diameter occurs between 6.5 km and 5 km. From 5 to 4 km, Dm continues to grow rapidly, albeit at a slightly slower rate compared to the levels between 6.5 km and 5 km. Below 4 km, the evolution of Dm shows differences in different stages. At 08:00, the retrieved Dm exhibits a coherent pattern that is relatively invariant with height. The MY and Thompson runs yield Dm values that are similar to the observations, albeit slightly higher. However, the simulated Dm values from the Morrison run exhibit a notable deviation from the retrieved ones. Among all the three runs, the MY run performs relatively better than the other two runs.
At 15:00, both the simulated and the retrieved Dm increase dramatically. Despite the breakup process contributing to the increased number density of rain drops and decrease in diameter, the significant increase in Dm suggests that the collision–coalescence process dominates during this stage. Below 2.5 km level, the Thompson run produces the highest Dm, while the MY run produces the smallest. The Morrison run exhibits an increase in Dm towards the ground below the 2.5 km level, which is consistent with the retrieved data. Additionally, the Dm profile from the Thompson run closely resembles the distribution observed at 08:00, albeit with larger values. At 22:00, the simulated and the retrieved Dms are lower than those at 15:00 but higher than those at 08:00. Further, the differences between the retrieved Dm and the simulated Dm decrease. The Thompson run performs slightly better than the other two runs, especially below the level of 2.5 km. The difference between the retrieved Dm and the simulated one near the ground is less than 0.1 mm. And the Morrison run and the MY run produce nearly the same Dm near the ground. The difference between the retrieved Dm and the two runs is nearly 0.3 mm.
Overall, the simulated and retrieved Dm values are close, with the MY scheme demonstrating slightly better performance, followed by the Thompson scheme. However, the Morrison scheme displays the largest deviation in the simulation results.

4.2. Modification of Breakup and Coalescence Parameterization for the MY Run

It can be seen from Figure 8 that all of the three runs overestimate Dm and ZDR compared to the retrieved one. And the higher ZDR also indicates that unrealistic larger raindrops still exist.
The collision–coalescence–breakup process (CCB) and the drop size sorting dominate the shape of raindrop size distribution [58]. Even though the precipitation occurs from ice phase hydrometeors [59], it is still the CCB process that primarily controls the raindop DSD near the surface. Gao et al. [37] increased the collision and spontaneous breakup rates of raindrop by a factor of three to reduce the large particles in the microphysics scheme when simulating a mesoscale convective system in southwest China. Similarly, Zhou et al. [38] modified the cutoff diameter, the rain breakup efficiency and the rain evaporation rate in their simulation of a merger-formation bow echo in southeast China during the pre-summer rainy season to enhance the accuracy of the simulated raindrop size distribution. Collisional breakup plays a significant role in determining the slope parameter at the tail of raindrop distribution [60]. It has been investigated in depth by Low and List [61,62]. When considering both breakup and coalescence processes simultaneously, a new governing stochastic collection equation (SCE) is designed. It is so complex that it is preferable to interpret the breakup process as a perturbation affecting the formulation of the raindrop self-collection term (SCT). The introduction of a bulk collection efficiency Ec that reduces the overall coalescence efficiency in SCT was suggested by Verlinde and Cotten [63] and Verlinde et al. [64]:
E c = 1 ,                                                    i f    D r < 600   μ m ,   exp 2.5 10 3 D r 6 × 10 4 ,              i f   600   μ m   D r < 2000   μ m , 0 ,                                                    i f   D r 2000   μ m ,
where D is the cutoff diameter.
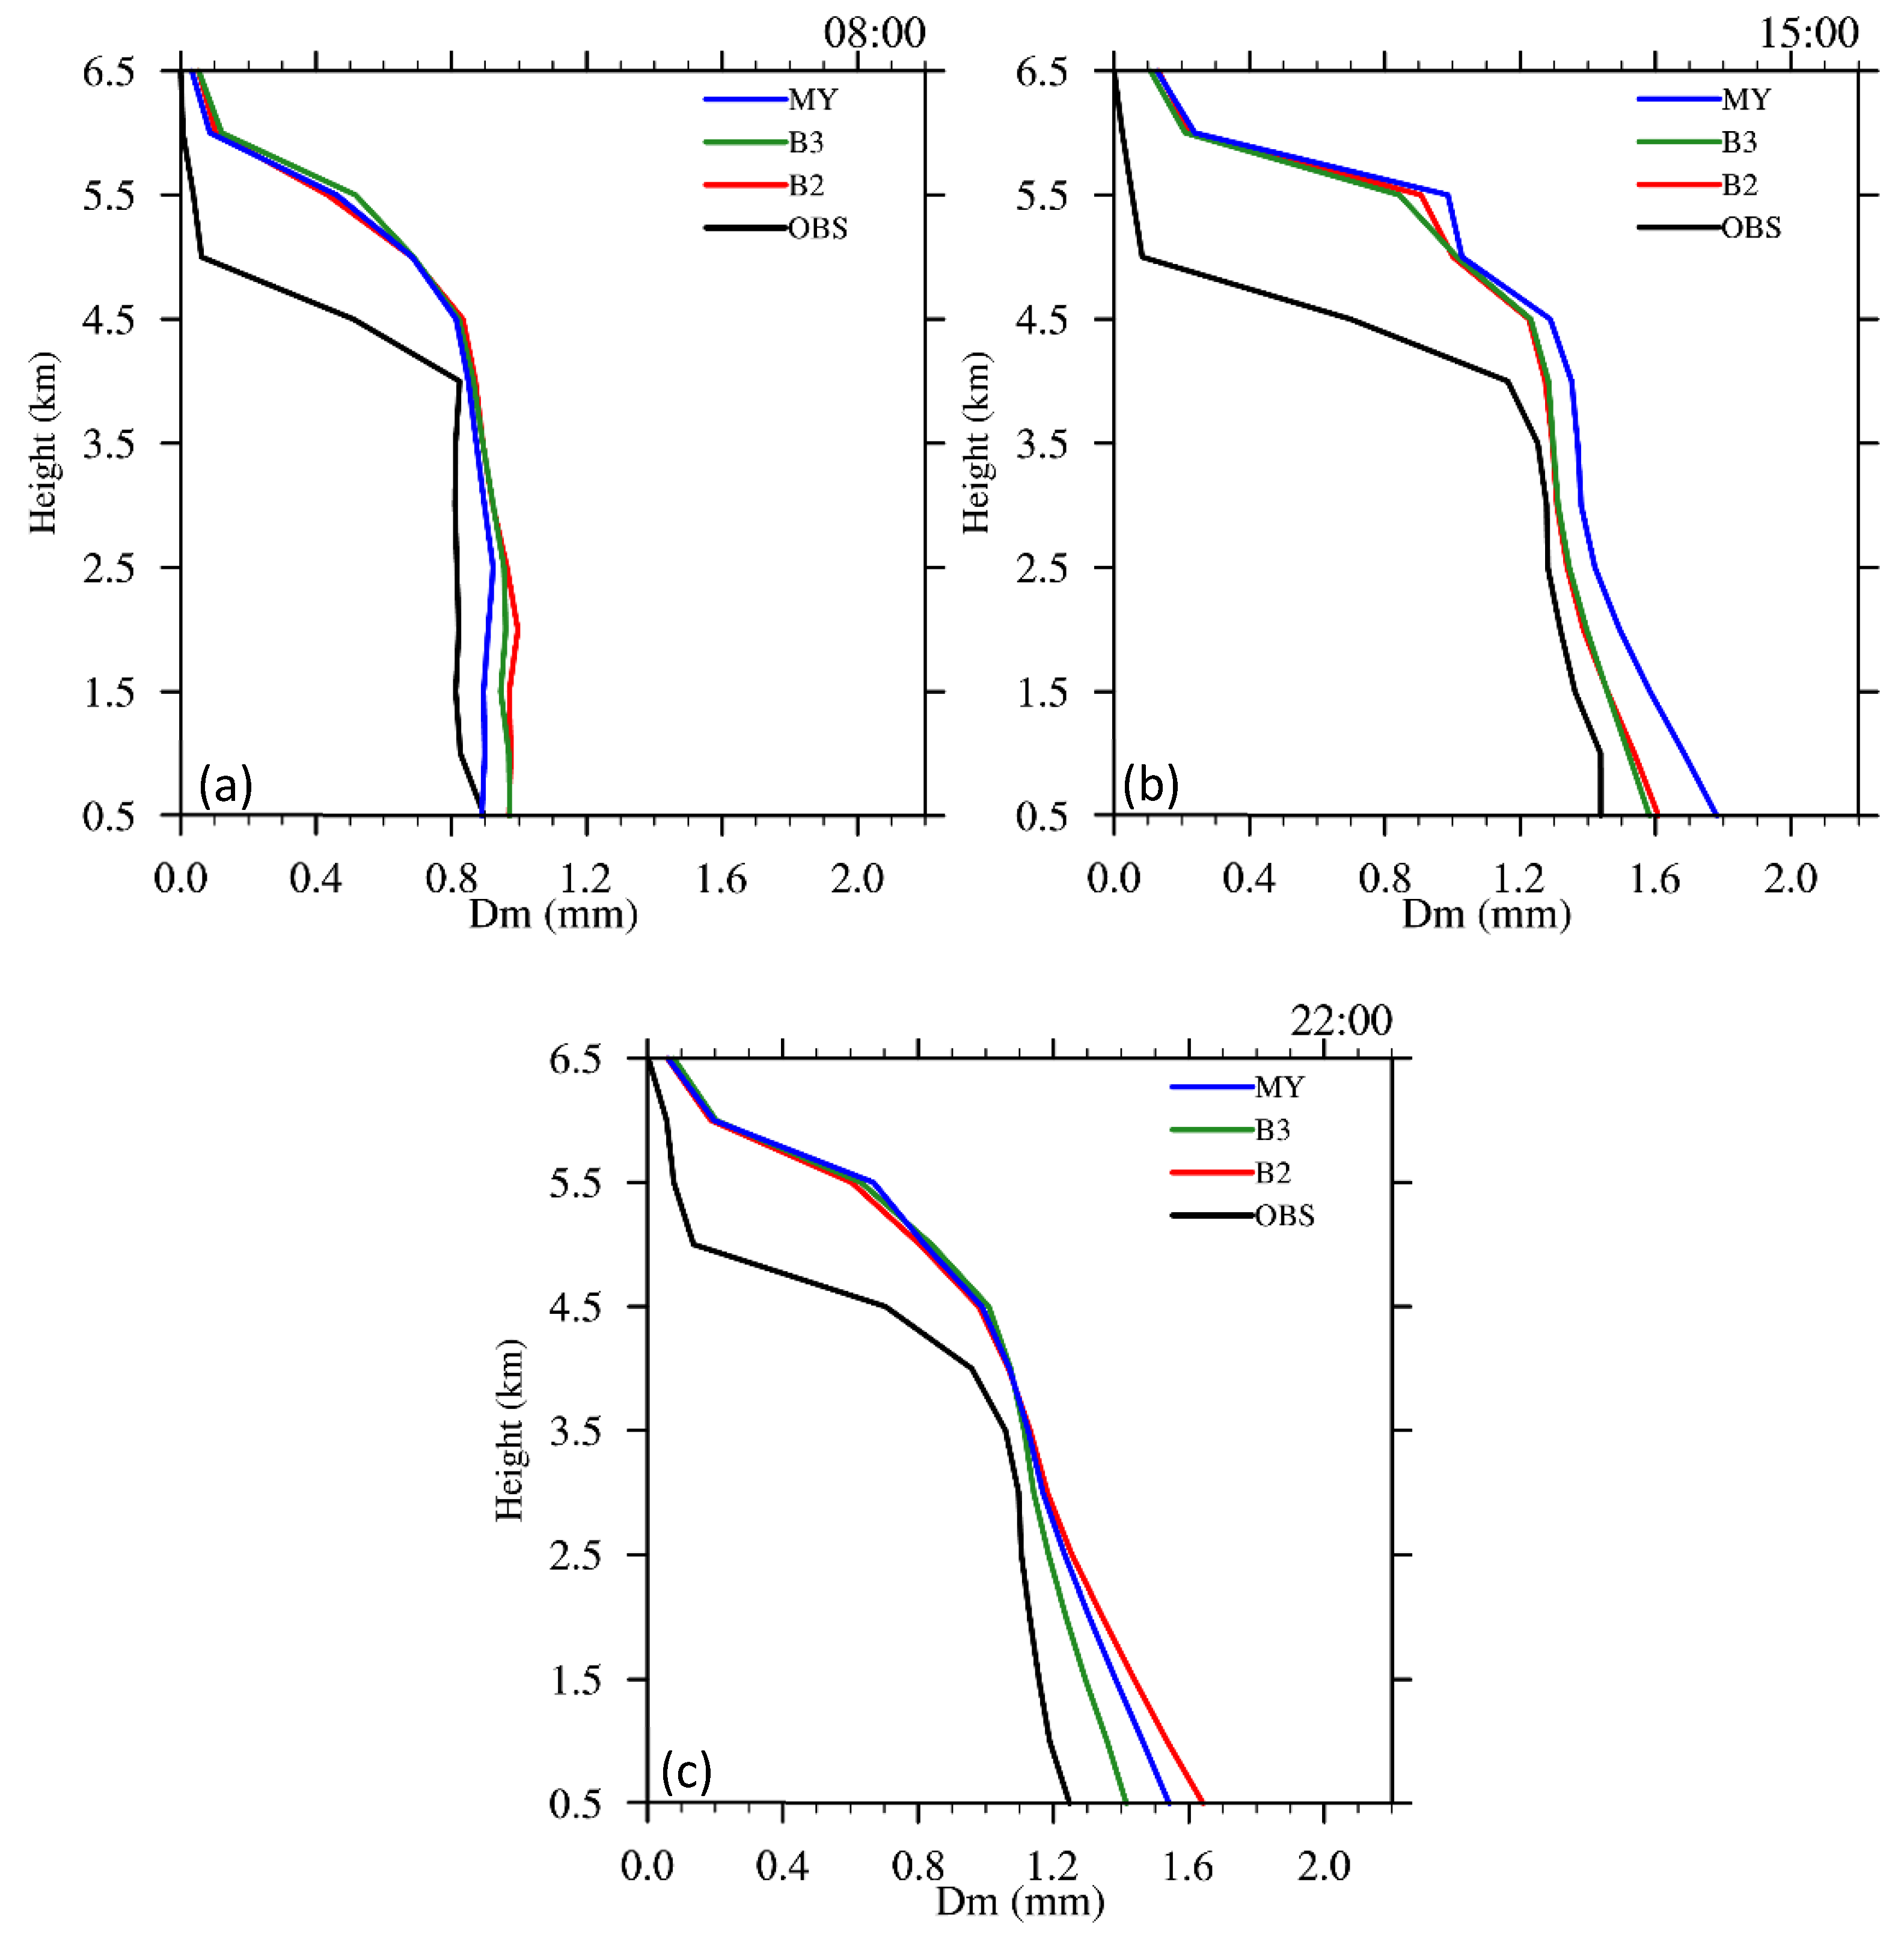
This parameterization is utilized in the MY scheme. The analysis mentioned above indicates that the simulated results from the MY run outperform those from the other two runs. To further improve the simulated results, two experiments relating to the rain breakup and coalescence parameterization for the MY run are conducted. In these experiments, the value of the coalescence efficiency parameter (Ec) is reduced when the raindrop diameter (Dr) falls within the range of 600 to 2000 μm. Consequently, the overall coalescence efficiency in SCT decreases accordingly. Specifically, two experiments (B2, B3) are run by reducing Ec to half and one-third of itself, respectively, when Dr is between 600 and 2000 μ m .
Figure 9 shows profiles of averaged Dm derived from observations and simulations over the domain represented by the red rectangle in Figure 5 on 26 June 2020.
It can be seen from Figure 9a that the difference between the B2 and B3 runs is not remarkable at 08:00. Compared to the control experiment (CTRL, Ec remains the default value), the B2 and B3 runs slightly overestimate Dm. However, the two runs successfully reproduce the characteristics of Dm, which remains relatively constant with increasing altitude below 4 km. At 15:00, the simulated Dm from the B2 and B3 runs is more closer to the retrieved one compared to the CTRL run. And the B3 run exhibits slightly better performance than the B2 run. At 22:00, a slight difference can be found among the simulations above the 3.5 km level. However, below the 3.5 km level, more significant differences exist, especially between the B2 and B3 runs. The B2 run produces the larger Dm than the CTRL run and the B3 run produces smaller Dm values that are more consistent with the retrieved Dm. Overall, Dm values from the B3 run show improvement compared to the CTRL and B2 run.
To understand the effect of Ec on Qr and Nr, Figure 10 summarizes the profiles of area-averaged differences between the B3 (B2) and the CTRL runs in different stages of the precipitation system.
At 08:00, the B2 and B3 runs produce a larger amount of Qr than the CTRL one (Figure 11(a1)). However, the difference of the averaged Nr shows a different distribution (Figure 11(b1)). The B2 and B3 runs produce fewer raindrop numbers than the CTRL run, respectively, below 2 km and between 5 and 6 km. Generally, the B2 (B3) run produces higher values of Qr and Nr above (below) 2.5 km. At 15:00, the B3 run produces higher values of Qr and Nr than the B2 run. And both of the two runs produce higher Qr and Nr than the CTRL run. At 22:00, at most heights, the B2 and B3 runs produce higher Qr and Nr than the CTRL run. Compared to the B2 run, the B3 run produces slightly lower (higher) Qr above (below) 4.5 km and produces higher (lower) Nr below (above) 4.5 km. Also, the B3 run produces slightly higher Nr than the B2 run between 8 and 9.5 km. In fact, compared to the B2 run, the B3 run produces more raindrop numbers at most of the times and heights. It can be seen that the B2 and B3 runs produce higher Qr in nearly all stages of the precipitation system, especially in the mature stage. However, the effect of Ec on Nr is more pronounced in the decay stage than in other stages. When the increase in Qr cannot keep pace with that in Nr, the Dm tends to increase; otherwise, it will decrease. In fact, after the initial stage of the precipitation system, the increase in Nr is significantly larger than that in Qr in the B3 run. Therefore, the simulated Dm is smaller in the B3 run, which is closer to the observation results.
To compare the relative importance of the microphysical process terms in the CTRL run and understand the effect of Ec on the microphysical process terms, vertical profiles of hourly variation of source and sink terms of Nr and Qr in different stages of the precipitation system will be discussed later.
Figure 11 shows the vertical profiles of area-averaged (over the red rectangle in Figure 5) source and sink terms of Nr of the CTRL run and the differences between the B2 (B3) and the CTRL (B2) runs in different stages of the precipitation system. It can be seen that autoconversion of cloud droplets to raindrops (Auto), breakup and coalescence (RBrk), evaporation of raindrop (EVap) and melting of ice phase hydrometeors (Melt) are the dominant pathways contributing to Nr. However, contributions of accretion of raindrop by ice phase hydrometeors (CLrx) are nearly negligible compared to other processes.
Figure 11(a1,c1) illustrate that magnitudes of NMelt and NRBrk increase (decrease) with the intensification (decaying) of the precipitation system. However, the evolution of NAuto and NEvap displays notable differences. In the decay stage of the precipitation system, NAuto contributes significantly to the increase in Nr, which may lead to more raindrop evaporation.
At 08:00, NAuto and Nmelt exhibit similar dominance in the microphysical process terms (Figure 11(a1)). NEVap contributes more to the decrease in Nr than NRBrk. The B2 run produces less NAuto and NEVap, but a little more NBrk and NMelt compared to the CTRL run (Figure 11(a2)). Compared to the B2 run, the B3 run produces more NAuto and NMelt, which causes more raindrop evaporation (Figure 11(a3)). However, the variation of NRBrk is almost negligible.
At 15:00, the CTRL run produces more NMelt than NAuto and the melting of ice phase hydrometeors is the dominant pathway (Figure 11(b1)). NRBrk contributes more to the decrease in Nr than NEVap. Compared to the CTRL run, the B2 run produces more NRBrk and less NMelt (Figure 11(b2)). And the B3 run produces a little more NMelt and NRBrk than THE B2 run (Figure 11(b3)).
At 22:00, less NMelt is produced by the CTRL run, while autoconversion of cloud droplets to raindrops contributes significantly more to the growth of Nr than the melting of ice phase hydrometeors. Consequently, NEvap increases rapidly caused by the rapid growth of Nr (Figure 11(c1)). Compared to the CTRL run, the B2 run produces more NAuto and NEVap, which is one order more than the variation of NRBrk and NMelt (Figure 11(c2)). The B3 run produces significantly less NAuto and NEvap than the B2 run (Figure 11(c3)).
It can be seen from Figure 11 that the effect of breakup and coalescence efficiency on Nr varies with the development of the precipitation system. The direct effect of Ec on NRBrk is more important at the mature stage. While its effect on NMelt, NAuto and NEVap is more important at other stages, especially in the decay stage. The smaller Ec in the B2 run leads to the decrease (increase) of NAuto in the initial (decay) stage. However, the B3 run produces more (less) NAuto in the initial (decay) stage with a smaller Ec compared to the B2 run.
Figure 12 shows the vertical profiles of area-averaged (over the red rectangle in Figure 5) source and sink terms of Qr of the CTRL run and the differences between the B2 (B3) and the CTRL (B2) runs in different stages of the precipitation system.
It can be seen from Figure 12 that the effect of Ec on Qr varies throughout the different stages of the precipitation system. Figure 12(a1–c1) demonstrates that the melting of ice phase hydrometeors (Melt), arretion of cloud droplets by rain drops (CLcr) and evaporation of rain drops (EVap) are the dominant pathways to the growth of rain drops. While the autoconversion of cloud droplets to raindrops plays a significant role in increasing Nr, its contribution to the increase in Qr is almost negligible. Additionally, the contribution of accretion of rain drops by ice phase hydrometeors (CLxr) is approximately one order of magnitude smaller than QMelt and QCLcr. It is noteworthy that the peak of QMelt is much larger than QCLcr, while their peak heights are nearly the same. It indicates that the melting of ice phase hydrometeors affects the accretion of cloud droplets by raindrops. A large amount of QMelt contributes to the growth of raindrops at the peak height where more raindrops collect cloud droplets. Similar to the dominant pathways, contributing to the increase in Nr, Melt, CLcr and Revp contribute more to the increase in Qr when the precipitation system intensifies and contribute less when the precipitation system weakens.
At 08:00, compared to the CTRL run, the B2 run produces more QMelt, QEVap and CLxr, while it produces less QCLcr (Figure 12(a2)). And the B3 run produces more QCLcr and QEVap and less QMelt and QCLxr than the B2 run (Figure 12(a3)). However, the differences between the two runs are not large. At 15:00, Figure 12(b2) shows that the amount of rain drops increases with the increase in the amount of melting ice phase hydrometeors in the B2 run compared to the CTRL run. And more cloud droplets are collected by raindrops. Therefore, more raindrops evaporate with the increase in the amount of raindrops. At the same time, a few more raindrops are collected by ice phase hydrometeors. Generally, the B3 run produces more QMelt, QCLcr and QEVap at most heights than the B2 run during the time (Figure 12(b3)). At 22:00 UTC on the 27th of June 2020, the differences of QCLcr and QCLxr between THE B2 run and CTRL run decreased rapidly compared to those at 15:00 UTC, while the difference of QMelt increases remarkably (Figure 12(c2)). And the difference in QMelt between the B2 run and the CTRL run decreases (increases) below (above) the height of 4.5 km. However, the difference in QMelt between the B3 run and the B2 run shows an exact opposite trend (Figure 12(c3)).
Similar to Figure 12, the effect of Ec on Qr is different from the development of a precipitation system. When in the initial stage, it is not as notable as that at other stages. The effect of Ec on QCLcr (QMelt) at the mature (decay) stage is more remarkable than that on QMelt (QCLcr). And the B2 run produces more QMelt and QCLcr leading to more simulated Qr at most times and heights. With a smaller Ec than the B2 run, the B3 run produces more QCLcr in the initial and decay stages and it produces less QCLcr in the mature stage. Caused by the difference in ice phase hydrometeors, the effect of Ec on QMelt is different with heights.

5. Summary and Conclusions

Three two-moment microphysics schemes (Morrison, Thompson and MY) in the WRF model are used to simulate a Meiyu front heavy rainfall event that occurred from 27 to 28 June 2020 during the (IMFRE) field campaign. Compared to observations, three runs produced similar cumulative precipitation while the MY run exhibited the best performance in simulating hourly precipitation. Additionally, the simulated cloud properties such as component reflectivity, differential reflectivity, specific differential phase and the mass-weighted mean diameter are compared with the ground-based S-Pol observations. Modifications are made to the MY scheme to improve its performance in simulating the mass-weighted mean diameter of raindrops.
Comparisons of simulated differential reflectivities, specific differential phase and the mass-weighted diameter with S-Pol observations show that the Morrison, Thompson and MY schemes overestimated the observed values. The evaluation reveals that all the three schemes have notable biases in describing the raindrop size distribution. And the MY scheme performs better than the other two.
To reduce the bias, the MY scheme is modified by reducing the overall coalescence efficiency, which includes the collision and breakup process of raindrops by a factor of 1/2 and 1/3 (the B2 run and the B3 run), respectively. It should be noted that the B2 and B3 runs exhibited slightly inferior performance in simulating the mass-weighted mean diameter of raindrops in the initial stage of the precipitation system. However, the B3 run produced better results than those from the CTRL and B2 runs in other stages of the precipitation system.
The B2 and B3 runs produce more Qr and Nr at most times and heights compared to the CTRL run. Furthermore, the differences in Qr and Nr between the two runs and the CTRL run vary with the development of the precipitation system. The differences of Qr are larger in the mature stage while those of Nr are larger in the decay stage. Given that the differences in Nr are approximately one order of magnitude larger than those in Qr, the variations in Dm (mass-weighted diameter) will be largely influenced by the variations in Nr. Melting of ice phase hydrometeros and autoconversion of droplets to raindrops are the dominant pathways for the increase in Nr while the effect of Ec on NMelt is not as remarkable as that on NAuto. The direct effect of Ec on NRBrk is more important at the mature stage, while the indirect effect of Ec is more important at other stages. Compared to the CTRL run, the B2 run produces less (more) NAuto at the initial (decay) stage with smaller Ec. However, smaller Ec in the B3 run leads to the increase (decrease) of NAuto, compared to the B2 run.
Although the autoconversion of cloud droplets to raindrops is important for the increase in Nr, its contribution to the increase in Qr is comparatively negligible when compared to other source terms. Instead, the melting of ice phase hydrometeors and accretion of cloud droplets by raindrops are the most important source terms for the increase in the Qr.
The effect of Ec on QCLcr (QMelt) at the mature (decay) stage is more prominent than that on QMelt (QCLcr). And the B2 run produces higher QMelt and QCLcr, leading to higher Qr at most times and heights. With a smaller Ec than the B2 run, the B3 run produces lower QCLcr in the mature stage than those in other stages. The effect of Ec on QMelt varies with heights due to differences in ice phase hydrometeors. Previous studies only compared profiles of the area- and time-averaged Dm. In this study, the area-averaged Dms are compared in different stages. At the same time, the effects of the B2 and B3 runs on Dm and microphysical processes are compared. From this study, we want to emphasize that even if the precipitation characteristics could be adequately reproduced, accurately simulating microphysical characteristics remains challenging. Although the MY scheme performs better than other schemes, there still exists a large discrepancy in the simulation of microphysics characteristics. Results from the modification on Ec highlight the need for adjustments even in the most physically based bulk parameterizations to achieve more accurate simulation. Further analysis and improvements including the ice phase microphysics are required to further improve model microphysical processes.

Author Contributions

Conceptualization, Z.Z.; methodology, Z.Z.; software, Z.Z., Y.G., Z.K., R.Y. and Y.H.; validation, Z.Z., M.D. and Y.H.; formal analysis, Z.Z.; investigation, Z.Z.; resources, M.D.; writing—original draft preparation, Z.Z. and Y.H.; writing—review and editing, Y.H.; visualization, Z.Z. and Y.H.; supervision, Y.H. and M.D. All authors have read and agreed to the published version of the manuscript.

Funding

This research was funded by the National Natural Science Foundation of China (grant number 42230612), the Open Project Fund of China Meteorological Administration Basin Heavy Rainfall Key Laboratory (2023BHR-Z03), the Joint Fund of Hubei Province Natural Science Foundation, grant number 2022CFD123, 2023AFD095 and the Open Grants of the State Key Laboratory of Severe Weather, grant number 2022LASW-B19.

Data Availability Statement

The polarimetric radar and precipitation data from the operational S-band radar in Suizhou are available for research from the China Meteorological Administration (CMA) upon request. The data used for the model runs are available from the ERA5 web interface (https://cds.climate.copernicus.eu/cdsapp#!/search?text=ERA5 (accessed on 13 August 2022)).

Conflicts of Interest

The authors declare no conflicts of interest.

References

  1. Ninomiya, K.; Kurihara, K. Forecast experiment of a long-lived meso-α-scale convective system in Baiu frontal zone. J. Meteor. Soc. Jpn. 1987, 65, 885–899. [Google Scholar] [CrossRef]
  2. Tao, S.Y.; Chen, L.X. A Review of Recent Research on the East Asian Summer Monsoon in China. In Monsoon Meteorology; Chang, C.P., Krishnamurti, T.N., Eds.; Oxford University Press: Oxford, UK, 1987; pp. 60–92. [Google Scholar]
  3. Ding, Y.H.; Chan, J.C.L. The East Asian summer monsoon: An overview. Meteorol. Atmos. Phys. 2005, 89, 117–142. [Google Scholar] [CrossRef]
  4. Ding, Y.H.; Liu, J.J.; Sun, Y.; Liu, Y.J.; He, J.H.; Song, Y.F. A study of the synoptic-climatology of the Meiyu system in East Asia. Chin. J. Atmos. Sci. 2007, 31, 1082–1101, (In Chinese with English Abstract). [Google Scholar] [CrossRef]
  5. Ding, Y.H.; Liang, P.; Liu, Y.J.; Zhang, Y.C. Multiscale variability of Meiyu and its prediction: A new review. J. Geophys. Res. Atmos. 2020, 125, e2019JD031496. [Google Scholar] [CrossRef]
  6. Sampe, T.; Xie, S.P. Large-scale dynamics of the Meiyu-Baiu rainband: Environmental forcing by the westerly Jet. J. Clim. 2010, 23, 113–134. [Google Scholar] [CrossRef]
  7. Geng, B. Case Study of a split front and associated precipitation during the Mei-Yu season. Weather Forecast. 2014, 29, 996–1002. [Google Scholar] [CrossRef]
  8. Ding, Y.H. Summer monsoon rainfalls in China. J. Meteorol. Soc. Jpn. 1992, 70, 373–396. [Google Scholar] [CrossRef]
  9. Zhang, G.F.; Sun, J.Z.; Brandes, E.A. Improving parameterization of rain microphysics with disdrometer and radar observations. J. Atmos. Sci. 2006, 63, 1273–1290. [Google Scholar] [CrossRef]
  10. Luo, Y.L.; Gong, Y.; Zhang, D.L. Initiation and organizational modes of an extreme-rain-producing mesoscale convective system along a Mei-Yu front in East China. Mon. Weather Rev. 2014, 142, 203–221. [Google Scholar] [CrossRef]
  11. Cui, C.; Wan, R.; Wang, B.; Dong, X.; Li, H.; Xu, G.; Wang, X.; Wang, Y.; Xiao, Y.; Zhou, Z.; et al. The Mesoscale Heavy Rainfall Observing System (MHROS) over the middle region of the Yangtze River in China. J. Geophys. Res. Atmos. 2015, 120, 10399–10417. [Google Scholar] [CrossRef]
  12. Fang, S.; Wang, K.; Wang, M.; Lv, Z. Hubei Climate Service Handbook: Climate Background; Wuhan Regional Climate Centre (WRCC): Wuhan, China, 2019; 137p. (In Chinese) [Google Scholar]
  13. Liu, M.L.; Wang, Q.Q. Anomalies of extreme precipitation during the Meiyu period of Jianghuai valleys and its general circulation characteristics. In Proceedings of the 2006 Annual Meeting of the Chinese Meteorological Society, Chinese Meteorological Society, Chengdu, China, 25–27 October 2006; pp. 1899–1908. (In Chinese). [Google Scholar]
  14. Hu, Y.; Deng, Y.; Zhou, Z.M.; Cui, C.G.; Dong, X.Q. A statistical and dynamical characterization of large-scale circulation patterns associated with summer extreme precipitation over the middle reaches of Yangtze River. Clim. Dyn. 2019, 52, 6213–6228. [Google Scholar] [CrossRef]
  15. Hu, Y.; Deng, Y.; Zhou, Z.M.; Cui, C.G.; Dong, X.Q. A synoptic assessment of the summer extreme rainfall over the middle reaches of Yangtze River in CMIP5 models. Clim. Dyn. 2019, 53, 2133–2146. [Google Scholar] [CrossRef]
  16. Hu, Y.; Lin, Y.; Deng, Y.; Bao, J. Summer extreme rainfall over the middle and lower reaches of Yangtze River: Role of synoptic patterns in historical changes and future projections. J. Geophys. Res. Atmos. 2023, 128, e2023JD039608. [Google Scholar] [CrossRef]
  17. Cui, W.J.; Dong, X.Q.; Xi, B.K.; Liu, M. Cloud and precipitation properties of MCSs along the Meiyu frontal zone in central and southern China and their associated large-scale environments. J. Geophys. Res. Atmos. 2020, 125, e2019JD031601. [Google Scholar] [CrossRef]
  18. Wang, W.C.; Gong, W.; Wei, H.L. A regional model simulation of the 1991 severe precipitation event over the Yangtze-Huai River valley. Part I: Precipitation and circulation statistics. J. Clim. 2000, 13, 74–92. [Google Scholar] [CrossRef]
  19. Yang, H.; Xu, G.Y.; Cui, C.G.; Wang, J.Y.; He, D.X. Quantitative analysis of water vapor transport during Mei-Yu front rainstorm period over the Tibetan plateau and Yangtze-Huai River basin. Adv. Meteorol. 2019, 2019, 6029027. [Google Scholar] [CrossRef]
  20. Cui, C.G.; Dong, X.Q.; Wang, B.; Xi, B.K.; Deng, Y.; Ding, Y.H. Integrative Monsoon Frontal Rainfall Experiment (IMFRE-I): A mid-term review. Adv. Atmos. Sci. 2021, 38, 357–374. [Google Scholar] [CrossRef]
  21. Cui, C.G.; Dong, X.Q.; Wang, B.; Hu, Y. Phase Two of the Integrative Monsoon Frontal Rainfall Experiment (IMFRE-II) over the middle and lower reaches of the Yangtze River in 2020. Adv. Atmos. Sci. 2021, 38, 346–356. [Google Scholar] [CrossRef]
  22. Hu, Y.; Deng, Y.; Lin, Y.; Zhou, Z.; Cui, C.; Dong, X. Dynamics of the spatiotemporal morphology of Mei-yu fronts: An initial survey. Clim. Dyn. 2021, 56, 2715–2728. [Google Scholar] [CrossRef]
  23. Hu, Y.; Deng, Y.; Lin, Y.; Zhou, Z.; Cui, C.; Li, C.; Dong, X. Indirect effect of diabatic heating on Mei-yu frontogenesis. Clim. Dyn. 2022, 59, 851–868. [Google Scholar] [CrossRef]
  24. Sun, Y.; Dong, X.; Cui, W.; Zhou, Z.; Fu, Z.; Zhou, L.; Deng, Y.; Cui, C. Vertical structures of typical Meiyu precipitation events retrieved from GPM-DPR. J. Geophys. Res. Atmos. 2020, 125, e2019JD031466. [Google Scholar] [CrossRef]
  25. Yang, J.; Li, J.; Li, P.; Sun, G.; Cai, Z.; Yang, X.; Cui, C.; Dong, X.; Xi, B.; Wan, R.; et al. Spatial distribution and impacts of aerosols on clouds under Meiyu frontal weather background over central China based on aircraft observations. J. Geophys. Res. Atmos. 2020, 125, e2019JD031915. [Google Scholar] [CrossRef]
  26. Zhou, L.; Dong, X.; Fu, Z.; Wang, B.; Leng, L.; Xi, B.; Cui, C. Vertical distributions of rain drops and Z-R relationships using microrain radar and 2Dvideo distrometer measurements during the Integrative Monsoon Frontal Rainfall Experiment (IMFRE). J. Geophys. Res. Atmos. 2020, 125, e2019JD031108. [Google Scholar] [CrossRef]
  27. Fu, Z.; Dong, X.; Zhou, L.; Cui, W.; Wang, J.; Wan, R.; Leng, L.; Xi, B. Statistical characteristics of rain drop size distributions and parameters in Central China during the Meiyu seasons. J. Geophys. Res. Atmos. 2020, 125, e2019JD031954. [Google Scholar] [CrossRef]
  28. Zhang, W.; Xu, G.; Xi, B.; Ren, J.; Wan, X.; Zhou, L.; Cui, C.; Wu, D. Comparative study of cloud liquid water and rain liquid water obtained from microwave radiometer and micro rain radar observations over central China during the monsoon. J. Geophys. Res. Atmos. 2020, 125, e2020JD032456. [Google Scholar] [CrossRef]
  29. Wang, P.; Yang, J. Observation and Numerical Simulation of Cloud Physical Processes Associated with Torrential Rain of the Meiyu Front. Adv. Atmos. Sci. 2003, 20, 77–96. [Google Scholar] [CrossRef]
  30. Zhou, Z.; Deng, Y.; Hu, Y.; Kang, Z. Simulating Heavy Meiyu Rainfall: A Note on the Choice of Model Microphysics Scheme. Adv. Meteorol. 2020, 2020, 17. [Google Scholar] [CrossRef]
  31. Barnes, H.C.; Houze, R.A. Comparison of observed and simulated spatial patterns of ice microphysical processes in tropical oceanic mesoscale convective systems. J. Geophys. Res. Atmos. 2016, 121, 8269–8296. [Google Scholar] [CrossRef]
  32. Johnson, M.; Jung, Y.; Dawson, D.; Supinie, T.; Xue, M.; Park, J.; Lee, Y.-H. Evaluation of unified model microphysics in high-resolution NWP simulations using polarimetric radar observations. Adv. Atmos. Sci. 2018, 35, 771–784. [Google Scholar] [CrossRef]
  33. Kumjian, M.R.; Mishra, S.; Giangrande, S.E.; Toto, T.; Ryzhkov, A.V.; Bansemer, A. Polarimetric radar and aircraft observations of saggy bright bands during MC3E. J. Geophys. Res. Atmos. 2016, 121, 3584–3607. [Google Scholar] [CrossRef]
  34. Morrison, H.; Tessendorf, S.A.; Ikeda, K.; Thompson, G. Sensitivity of a simulated midlatitude squall line to parameterization of rain drop breakup. Mon. Weather Rev. 2012, 140, 2437–2460. [Google Scholar] [CrossRef]
  35. Putnam, B.J.; Xue, M.; Jung, Y.; Snook, N.; Zhang, G. The analysis and prediction of microphysical states and polarimetric radar variables in a mesoscale convective system using double-moment microphysics, multinetwork radar data, and the ensemble Kalman filter. Mon. Weather Rev. 2014, 142, 141–162. [Google Scholar] [CrossRef]
  36. Wang, M.; Zhao, K.; Pan, Y.; Xue, M. Evaluation of simulated drop size distributions and microphysical processes using polarimetric radar observations for landfalling typhoon Matmo (2014). J. Geophys. Res. Atmos. 2020, 125, e2019JD031527. [Google Scholar] [CrossRef]
  37. Gao, W.; Sui, C.; Wang, C.C.; Chang, W.Y. An evaluation and improvement of microphysical parameterization from a two-moment cloud microphysics scheme and the Southwest Monsoon Experiment (SoWMEX)/Terrain- influenced Monsoon Rainfall Experiment (TiMREX) observations. J. Geophys. Res. Atmos. 2011, 116, D19101. [Google Scholar] [CrossRef]
  38. Zhou, A.; Zhao, K.; Lee, W.-C.; Ding, Z.; Lu, Y.; Huang, H. Evaluation and modification of microphysics schemes on the cold pool evolution for a simulated bow echo in southeast China. J. Geophys. Res. Atmos. 2022, 127, e2021JD035262. [Google Scholar] [CrossRef]
  39. Sun, Y.; Zhou, Z.; Gao, Q.; Li, H.; Wang, M. Evaluating Simulated Microphysics of Stratiform and Convective Precipitation in a Squall Line Event Using Polarimetric Radar Observations. Remote Sens. 2023, 15, 1507. [Google Scholar] [CrossRef]
  40. Shen, Y.; Zhao, P.; Pan, Y.; Yu, J. A high spatiotemporal gauge-satellite merged precipitation analysis over China. J. Geophys. Res. Atmos. 2014, 119, 3063–3075. [Google Scholar] [CrossRef]
  41. Hua, H.; Zhao, K.; Zhang, G.; Lin, Q.; Wen, L.; Chen, G.; Yang, Z.; Wang, M.; Hu, D. Quantitative precipitation estimation with operational polarimetric radar measurements in Southern China: A differential phase–based variational approach. J. Atmos. Ocean. Technol. 2018, 35, 1253–1271. [Google Scholar]
  42. Istok, M.J.; Fresch, M.; Jing, Z.; Smith, S.; Murnan, R.; Ryzhkov, A.; Saffle, R. WSR-88D dual polarization initial operational capabilities. In Proceedings of the 25th Conference on International Interactive Information and Processing Systems (IIPS) for Meteorology, Oceanography, and Hydrology, Phoenix, AZ, USA, 10 January 2009. [Google Scholar]
  43. Dixon, M. Radx C++ Software Package for Radial Radar Data. 2015. Available online: https://github.com/NCAR/lrose-core/tree/master/codebase/apps/Radx/src/Radx2Grid (accessed on 17 August 2023).
  44. Dolan, B.; Rutledge, S.A.; Lim, S.; Chandrasekar, V.; Thurai, M. A robust C-band hydrometeor identification algorithm and application to a long-term polarimetric radar dataset. J. Appl. Meteorol. Climatol. 2013, 52, 2162–2186. [Google Scholar] [CrossRef]
  45. Zhang, G.; Vivekanandan, J.; Brandes, E. A method for estimating rain rate and drop size distribution from polarimetric radar measurements. IEEE Trans. Geosci. Remote Sens. 2001, 39, 830–841. [Google Scholar] [CrossRef]
  46. Tewari, M.; Chen, F.; Wang, W.; Dudhia, J.; LeMone, M.A.; Mitchell, K.M.; Gayno, G.; Wegiel, J.; Cuenca, R.H. Implementation and verification of the unified NOAH land surface model in the WRF model. In Proceedings of the 20th Conference on Weather Analysis and Forecasting/16th Conference on Numerical Weather Prediction, Seattle, DC, USA, 12–16 January 2004; pp. 11–15. [Google Scholar]
  47. Janjic, Z.I. The Step–Mountain Eta Coordinate Model: Further developments of the convection, viscous sublayer, and turbulence closure schemes. Mon. Weather Rev. 1994, 122, 927–945. [Google Scholar] [CrossRef]
  48. Dudhia, J. Numerical study of convection observed during the Winter Monsoon Experiment using a mesoscale two–dimensional model. J. Atmos. Sci. 1989, 46, 3077–3107. [Google Scholar] [CrossRef]
  49. Mlawer Eli, J.; Steven, J.T.; Brown, P.D.; Iacono, M.J.; Clough, S.A. Radiative transfer for inhomogeneous atmospheres: RRTM, a validated correlated–k model for the longwave. J. Geophys. Res. Atmos. 1997, 102, 16663–16682. [Google Scholar] [CrossRef]
  50. Kain, J.S. The Kain–Fritsch convective parameterization: An update. J. Appl. Meteorol. 2004, 43, 170–181. [Google Scholar] [CrossRef]
  51. Morrison, H.; Milbrandt, J.A. Parameterization of cloud microphysics based on the prediction of bulk ice particle properties. Part I: Scheme description and idealized tests. J. Atmos. Sci. 2015, 72, 287–311. [Google Scholar] [CrossRef]
  52. Thompson, G.; Field, P.R.; Rasmussen, R.M.; Hall, W.D. Explicit forecasts of winter precipitation using an improved bulk microphysics scheme. Part II: Implementation of a new snow parameterization. Mon. Weather Rev. 2008, 136, 5095–5115. [Google Scholar] [CrossRef]
  53. Milbrandt, J.A.; Yau, M.K. A multimoment bulk microphysics parameterization. Part I: Analysis of the role of the spectral shape parameter. J. Atmos. Sci. 2005, 62, 3051–3064. [Google Scholar] [CrossRef]
  54. Milbrandt, J.A.; Yau, M.K. A multimoment bulk microphysics parameterization. Part II: A proposed three-moment closure and scheme description. J. Atmos. Sci. 2005, 62, 3065–3081. [Google Scholar] [CrossRef]
  55. Yin, J.; Gu, H.; Yu, M.; Bao, X.; Xie, Y.; Liang, X. Synergetic Roles of Dynamic and Cloud Microphysical Processes in Extreme Short-Term Rainfall: A Case Study. Q. J. R. Meteorol. Soc. 2020, 148, 3660–3676. [Google Scholar] [CrossRef]
  56. Yin, J.; Zhang, D.; Luo, Y.; Ma, R. On the Extreme Rainfall Event of 7 May 2017 over the Coastal City of Guangzhou. Part I: Impacts of Urbanization and Orography. Mon. Weather Rev. 2020, 148, 955–979. [Google Scholar] [CrossRef]
  57. Yuter, S.E.; Houze, R.A. Three-dimensional kinematic and microphysical evolution of Florida cumulonimbus. Part II: Frequency distributions of vertical velocity, reflectivity, and differential reflectivity. Mon. Weather Rev. 1995, 123, 1941–1963. [Google Scholar] [CrossRef] [PubMed]
  58. Atlas, D.; Ulbrich, C.W. Drop size spectra and integral remote sensing parameters in the transition from convective to stratiform rain. Geophys. Res. Lett. 2006, 33, L16803. [Google Scholar] [CrossRef]
  59. Hu, Z.; Srivastava, R.C. Cloud physical relationships in Califonia marine stratus. J. Appl. Meteorol. 1995, 34, 2655–2666. [Google Scholar]
  60. Srivastava, R.C. Parameterization of rain drop size distributions. J. Atmos. Sci. 1978, 35, 108–117. [Google Scholar] [CrossRef]
  61. Low, T.B.; List, R. Collision, coalescence and breakup of rain drops. Part I: Experimentally established coalescence efficiencies and fragment size distributions in breakup. J. Atmos. Sci. 1982, 39, 1591–1606. [Google Scholar] [CrossRef]
  62. Low, T.B.; List, R. Collision, coalescence and breakup of rain drops. Part II: Parameterization of fragment size distribution. J. Atmos. Sci. 1982, 39, 1607–1618. [Google Scholar] [CrossRef]
  63. Verlinde, J.; Cotton, W.R. Fitting microphysical observations of non-steady convective clouds to a numerical model: An application of the adjoint technique of data assimation to a kinematic model. Mon. Weather Rev. 1993, 121, 2776–2793. [Google Scholar] [CrossRef]
  64. Verlinde, J.; Flatau, P.J.; Cotton, W.R. Analytical solution to the collection growth equation: Comparison with approximate methods and application to cloud microphysics parameterization schemes. J. Atmos. Sci. 1990, 47, 2871–2880. [Google Scholar] [CrossRef]
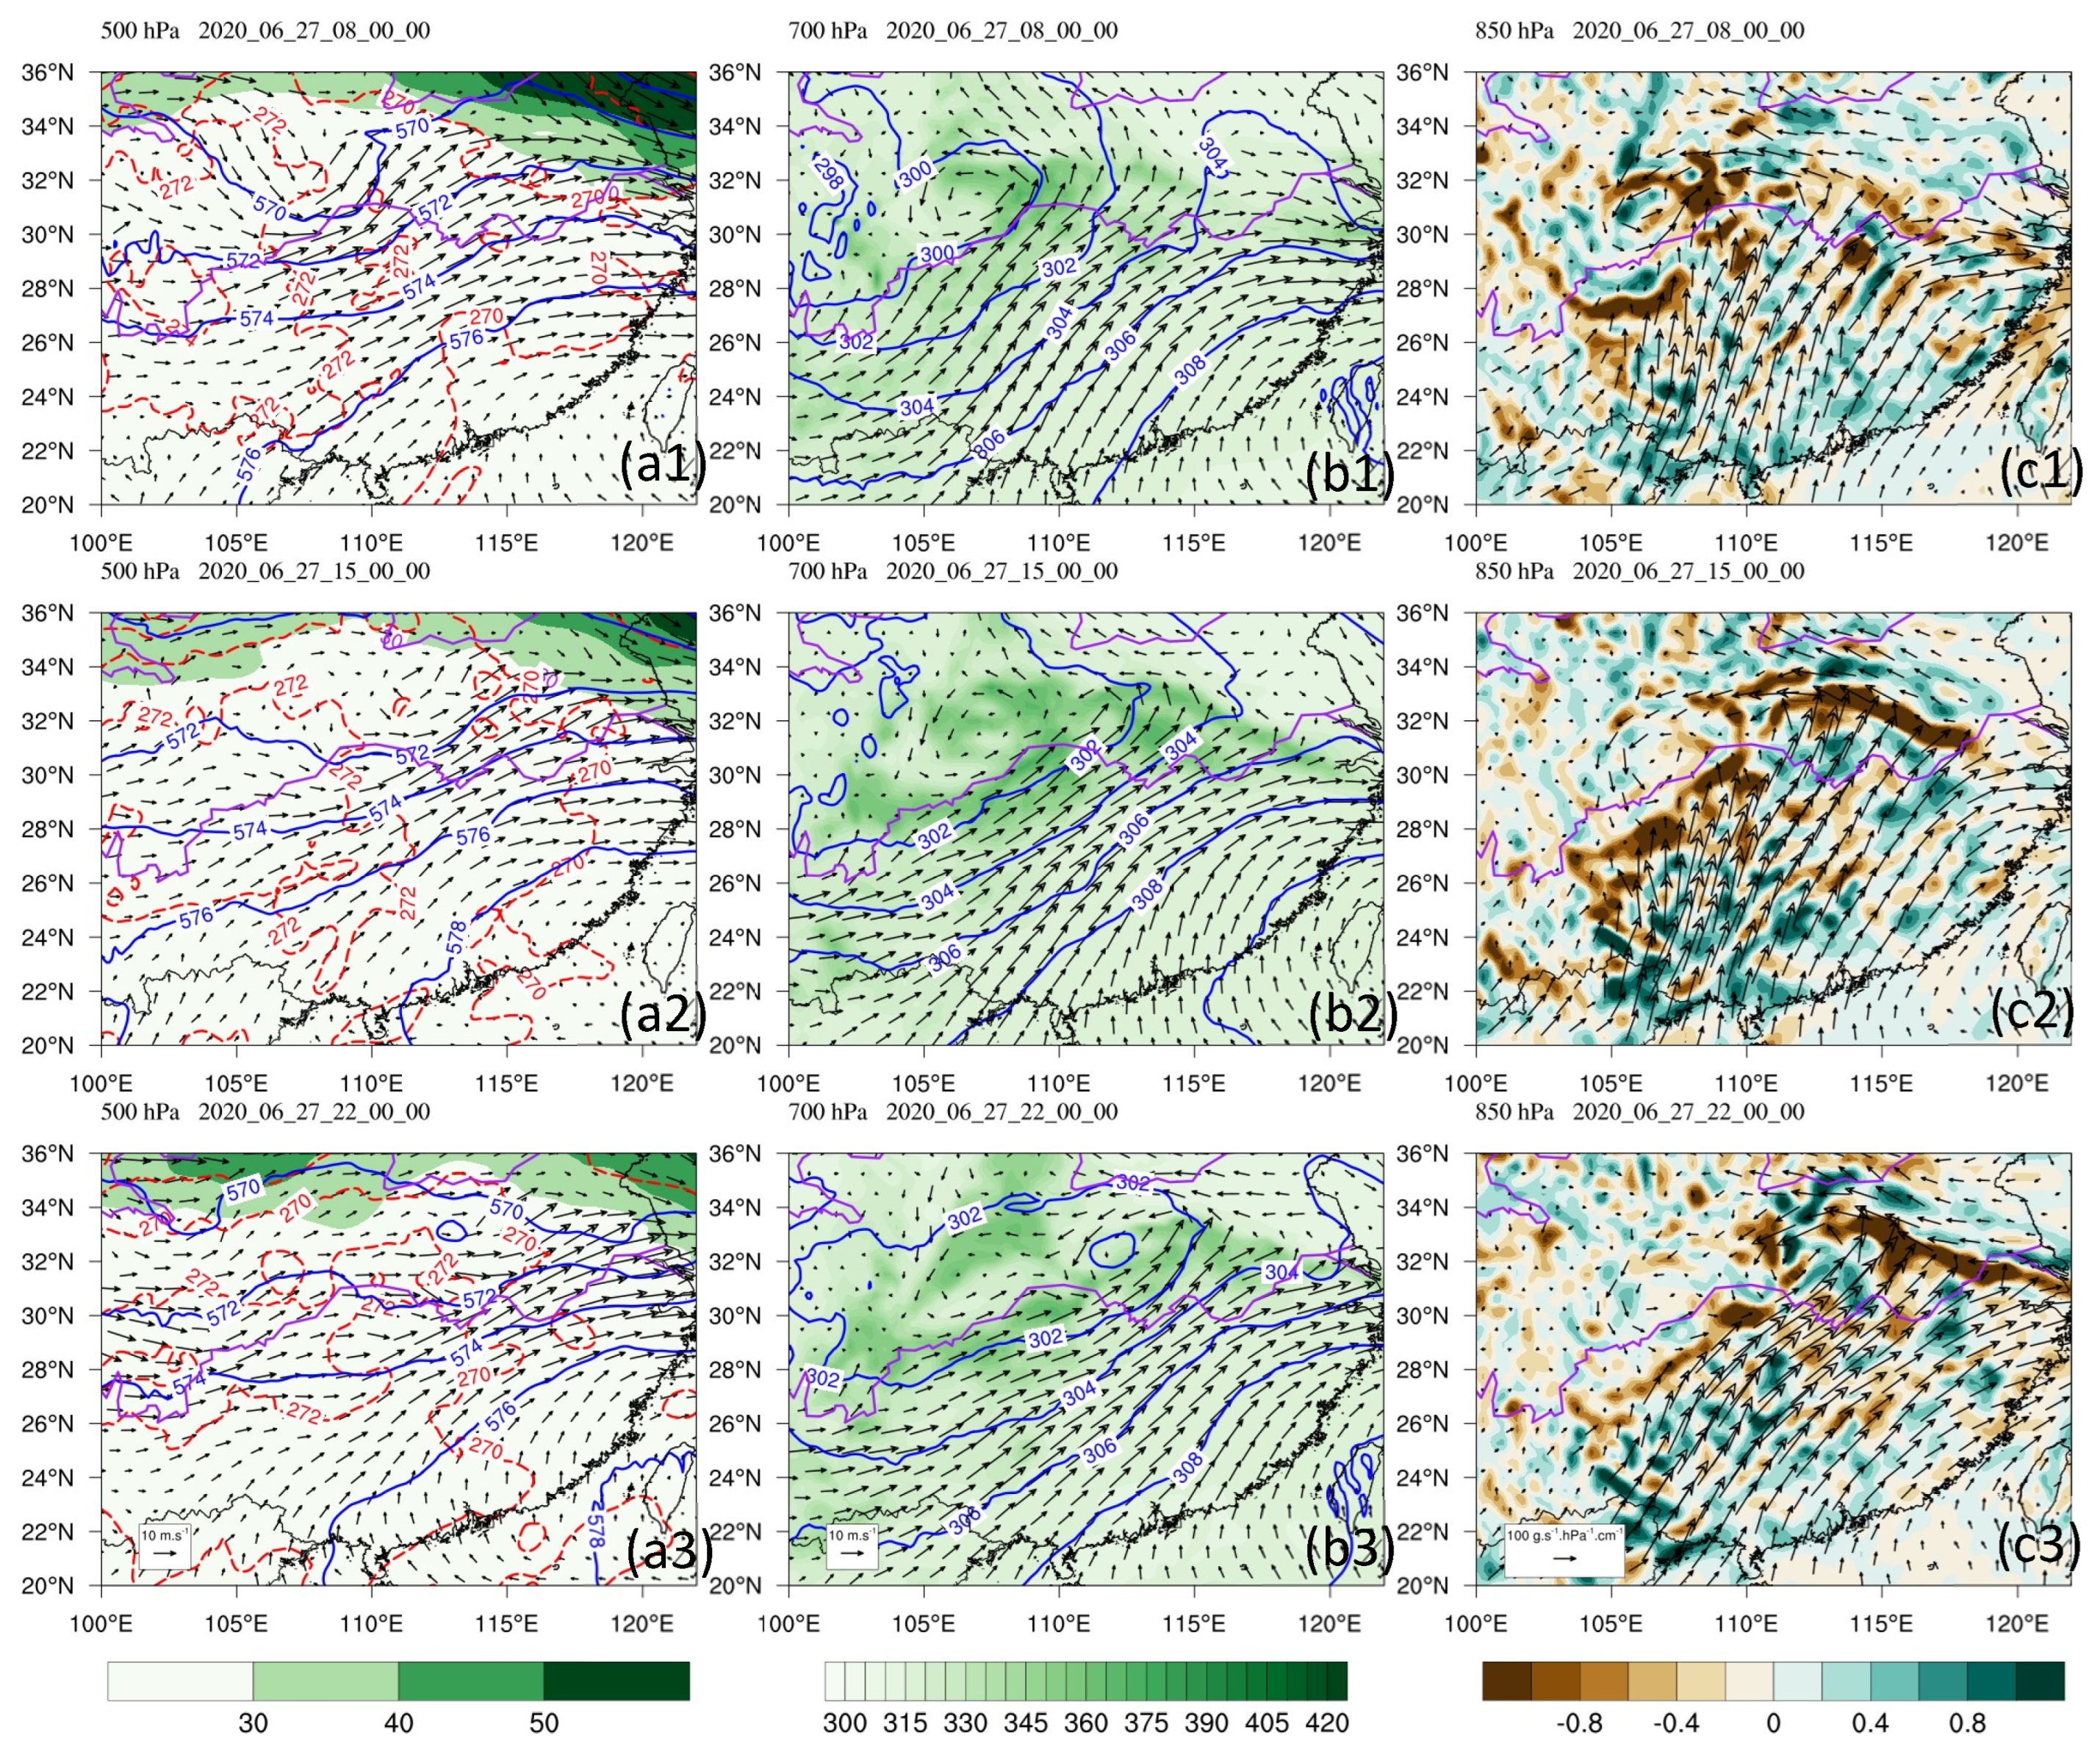
Figure 1. Background circulation at different times: (a1a3) high-level jet (shaded, unit: m/s) at 200 hPa; geopotential height (blue solid contours, units: 10 gpm), temperature (red solid contours, units: K) and winds (arrows, units: m s−1) at 500 hPa; (b1b3) generalized potential temperature (shaded, unit: K); geopotential height (blue solid contours, units: 10 gpm) and winds (arrows, units: m s−1) at 700 hPa; (c1c3) moisture flux (units: g s−1 hPa−1 cm−1) and moisture flux divergence (shaded; units: 10−7 g s−1 hPa−1 cm−2) at 850 hPa. 1 to 3 represent 00:00 UTC, 14:00 UTC and 23:00 UTC on 26 June 2020. The Yangtze River and Huang River are indicated by purple lines.
Remotesensing 16 01636 g001
Figure 2. Nested model domains. The red circle indicates the center of the domain.
Remotesensing 16 01636 g002
Figure 3. Spatial distribution of cumulative rainfall during 00:00 UTC 27th to 12:00 UTC 28th in 2020 for (a) the observations and (bd) the WRF simulations using three microphysics schemes: (b) Morrison, (c) Thompson, (d) MY. The red solid squares represent the regions of Hubei province, central China. And the black dashed rectangle represents the detecting area of the S-band polarimetric radar.
Remotesensing 16 01636 g003
Figure 4. The hourly precipitation averaged over the red rectangle in Figure 3. The green line is from observations, the blue line is from the MY run, the red line is from the Thompson run and the black line is from the Morrison run.
Remotesensing 16 01636 g004
Figure 5. Distribution of composite echo reflectivity at 08:00, 15:00 and 22:00 (represented by 1, 2 and 3, respectively) UTC 27 June 2020. (a1a3) obervations, (b1b3) Morrison run, (c1c3) Thompson run, (d1d3) MY run. The red rectangle in (a1a3) is chosen through the detection coverage of the polarimetric radar and the evolution of the composite echo reflectivity. The red rectangle in the modeled runs moves northward by 0.3°. Label A and B in (a1) and (b1) indicate the composite echo reflectivity by low vortex and shear line, respectively.
Remotesensing 16 01636 g005
Figure 6. Differential reflectivity (ZDR) contoured frequency with altitude diagrams (CFADs) for the region represented by a red rectangle in Figure 5 on 27 June 2020 derived from (a1a3) S-Pol radar observations, (b1b3) Morrison simulations, (c1c3) Thompson simulations and (d1d3) MY simulations. 1, 2 and 3 indicate 08:00, 15:00 and 22:00, respectively.
Remotesensing 16 01636 g006
Figure 7. Specific differential phase (KDP) contoured frequency with altitude diagrams (CFADs) for the region represented by a red rectangle in Figure 5 on 27 June 2020 derived from (a1a3) S-Pol radar observations, (b1b3) Morrison simulations, (c1c3) Thompson simulations and (d1d3) MY simulations. 1, 2 and 3 indicate 08:00, 15:00 and 22:00, respectively.
Remotesensing 16 01636 g007
Figure 8. Profiles of area-averaged Dm derived from observations and simulations over the domain represented by the red rectangle in Figure 5 on 26 June 2020: (a) 08:00, (b) 15:00, (c) 22:00.
Remotesensing 16 01636 g008
Figure 9. Profiles of area-averaged Dm derived from observations and simulations (the B2, B3 and MY) over the domain represented by the red rectangle in Figure 5 on 26 June 2020: (a) 08:00, (b) 15:00, (c) 22:00.
Remotesensing 16 01636 g009
Figure 10. The vertical profiles of the area-averaged (over the red rectangle in Figure 5) differences of rain drop content (Qr, left, unit: 10−3 g m−3) and raindrop number concentration (Nr, right, unit:m−3) between the B3 (red solid line) (B2, blue solid line) run and the CTRL run: (a1,b1): 08:00, (a2,b2): 15:00, (a3,b3): 22:00.
Remotesensing 16 01636 g010
Figure 11. The vertical profiles of area-averaged (over the red rectangle in Figure 5) source and sink terms of Nr on 27 June 2020: (a1c1) CTRL run (MY), (a2c2) difference between the B2 and CTRL runs, (a3c3) difference between B3 and the B2 runs. (a, b, and c) represent 08:00, 15:00 and 22:00, respectively.
Remotesensing 16 01636 g011
Figure 12. The vertical profiles of hourly variation of area-averaged (over the red rectangle in Figure 5) source and sink terms of Qr on 27 June 2020: (a1c1) control test (MY), (a2c2) difference between the B2 and CTRL runs, (a3c3) difference between the B3 and B2 runs. (a, b, and c) represent 08:00, 15:00 and 22:00, respectively.
Remotesensing 16 01636 g012
Table 1. Settings and parameters of SZ_SPOL.
ParametersSZ_SPOL
Transmitting frequency2.8 GHz
PRF300–1300 Hz
Pulse width1.57 μs
Peak power≥650 kw
Noise figure≤3.0 dB
Dynamic range≥90 dB
Minimum detectable signal power≤−107 dBm
Antenna gain≥44 dB
Antenna aperture8–9 m
Beamwidth≤1.0°
Polarimetric modeSimultaneous horizontal/vertical transmit and receive
Scanning modePPI, RHI, VOL
Range resolution250 m
Radar observationsZH, ZDR, ΦDP and other parameters
Table 2. List of microphysical processes.
SymbolDescription
AutoAutoconversion from cloud droplets to rain drops
CondCondensation of vapor to cloud droplets
CLcrAccretion of cloud droplets by rain drops
CLxrAccretion of raindrop by frozen hydrometeors (riming) and x represents all the frozen hydrometeors
MeltMelting of all the ice hydrometeors to raindrops
EvapEvaporation of raindrops to water vapor
RBrkBreakup and overall coalescence of rain drops
Disclaimer/Publisher’s Note: The statements, opinions and data contained in all publications are solely those of the individual author(s) and contributor(s) and not of MDPI and/or the editor(s). MDPI and/or the editor(s) disclaim responsibility for any injury to people or property resulting from any ideas, methods, instructions or products referred to in the content.