1. Introduction
Growing demand globally for food over the past 40 years has improved economic returns for the agricultural industry, but producers face higher risks because input costs and land values have also increased significantly [
1]. To reduce risk, increase energy efficiency, enhance productivity, improve profitability, and minimize environmental impacts agricultural producers are increasingly resorting to the use of information technologies to aid their decision making processes [
2]. In addition to land, labor, and capital, which have been agriculture’s traditional assets, information management has become increasingly important [
3]. The management strategy that uses information technologies to bring data from many sources for precise application of inputs to increase crop production has come to be known as precision agriculture.
Remote sensing imagery acquired from satellites and aircraft provides information in both the spatial and temporal dimensions that can potentially assist crop management. To maximize value to producers, the information has to be easily accessible in a timely manner and useable with a minimum of training [
4]. These challenges were magnified in the northern Great Plains region, where limited bandwidth available to producers in the vast and sparsely populated rural areas previously hindered information access. Recent technological advancements, however, have alleviated this problem. Adoption of remote sensing technology is also affected by the depths of scientific and technical knowledge required to analyze and interpret the data [
5], and producers are likely to have limited skills and/or interest in this area [
6]. One way to lower the barrier to adoption is to develop low or no-cost value-added products that can be easily interpreted. To a producer, the value of remote sensing images and derived products occurs when they enable management decisions that enhance productivity and reduces unwanted environmental impacts.
In response to these challenges, the Upper Midwest Aerospace Consortium (UMAC,
http://www.umc.org), a consortium of seven universities in the US Upper Midwest, executed a project that included the following: delivery of remote sensing data products of no-cost to the farmers and ranchers in the region; training of farmers and ranchers in the use of satellite imagery and derived products such as Normalized Difference Vegetation Index (NDVI) [
7]; and development and promotion of applications through a learning community approach [
8]. At the outset we realized that the dynamic nature of agriculture meant remote sensing products and services are useful only when made available in a timely manner and in an easy-to-use format. During the late 1990s and early 2000s, UMAC’s end users who lacked fast internet access were provided with DirecPC satellite internet connections to ensure timely delivery of products [
8]. In subsequent years, we designed and developed a web-based system, Digital Northern Great Plains (DNGP,
http://dngp.umac.org), to deliver archived and near real time remote sensing data and products. In this paper, we will describe the DNGP system and offer examples of how the system has been used by agricultural producers to lower costs, enhance productivity, and minimize environmental impacts.
The DNPG system represents one of our ongoing efforts to deliver societal benefits to a major regional user community by taking advantage of modern technologies. We are constantly evolving the DNGP system with an ultimate goal of providing an information infrastructure enabling a variety of decision-support systems.
2. Digital Northern Great Plains
UMAC has collected a rich archive of remote sensing imagery over North and South Dakota, Minnesota, Montana, Wyoming and Idaho spanning more than 30 years. Data include medium resolution (20–250 m) multispectral images from Landsat Multispectral Scanner (MSS), Thematic Mapper (TM) and Enhanced Thematic Mapper Plus (ETM+), Advanced Spaceborne Thermal Emission and Reflection Radiometer (ASTER), Moderate Resolution Imaging Spectroradiometer (MODIS); surface relief from the Shuttle Radar Topography Mission (SRTM); and high resolution (1–2 m) images from AeroCam [
9], a multispectral airborne camera that was developed and is operated by UMAC. To ensure consistency in temporal and spatial comparisons, all images have been geo-referenced and atmospherically corrected using the ATCOR software [
10].
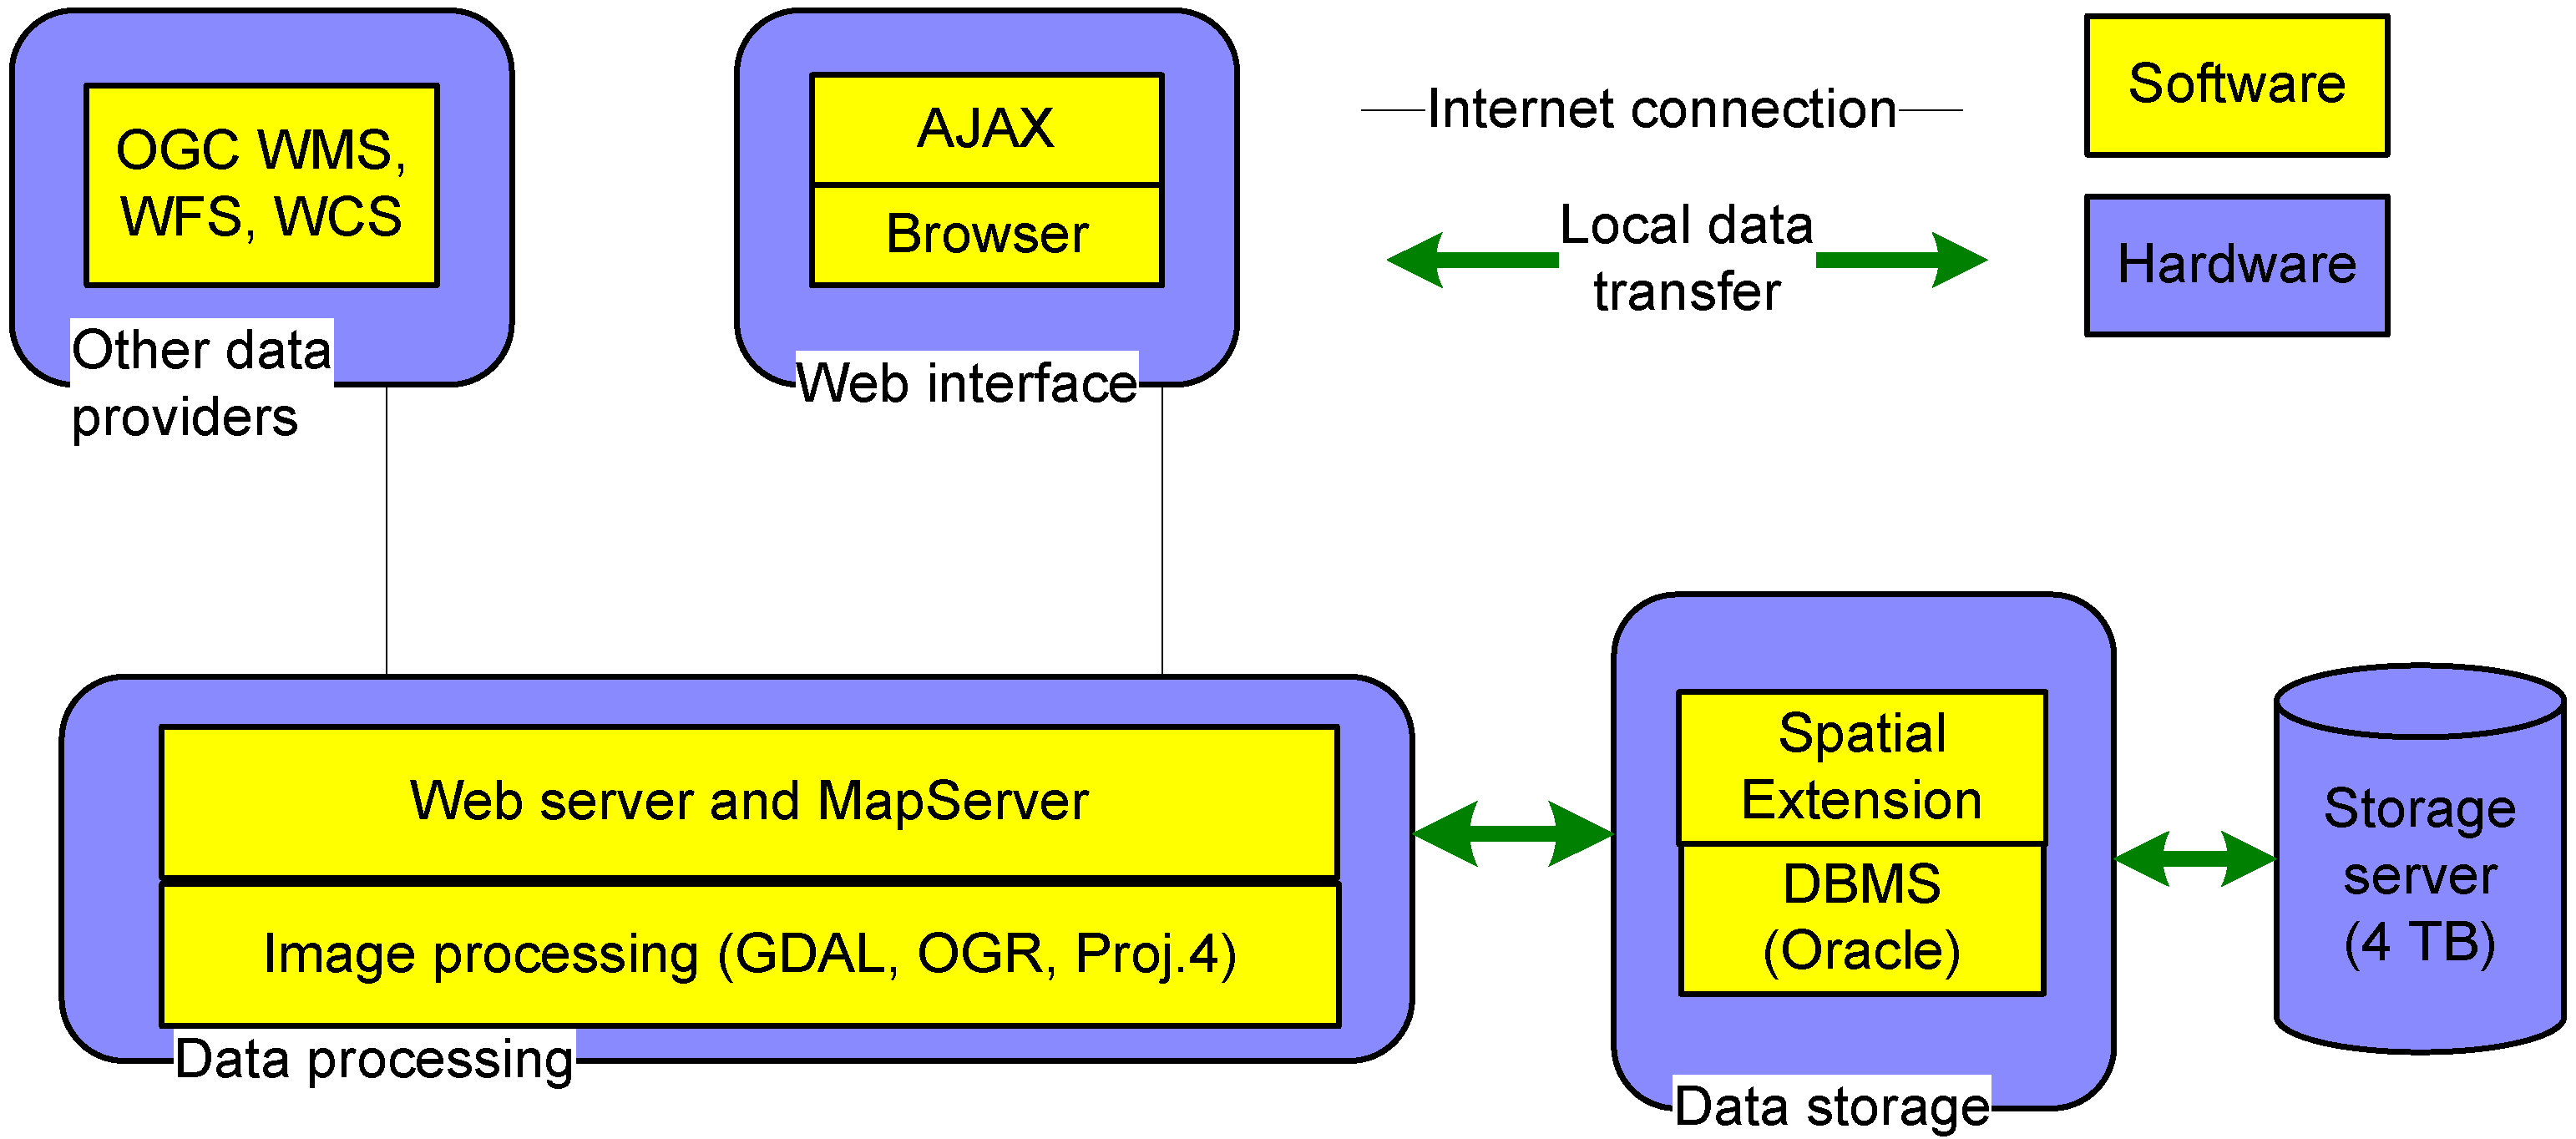
In designing the DNGP system we adopted “thin-client” architecture to ensure the minimum footprint on a client computer; all computing and analyses are carried out by the host server and results presented through a web interface accessible
via a web browser. The architecture has three tiers: client presentation, data processing, and data storage (
Figure 1).
Figure 1.
Schematic diagram of DNPG system architecture.
Figure 1.
Schematic diagram of DNPG system architecture.
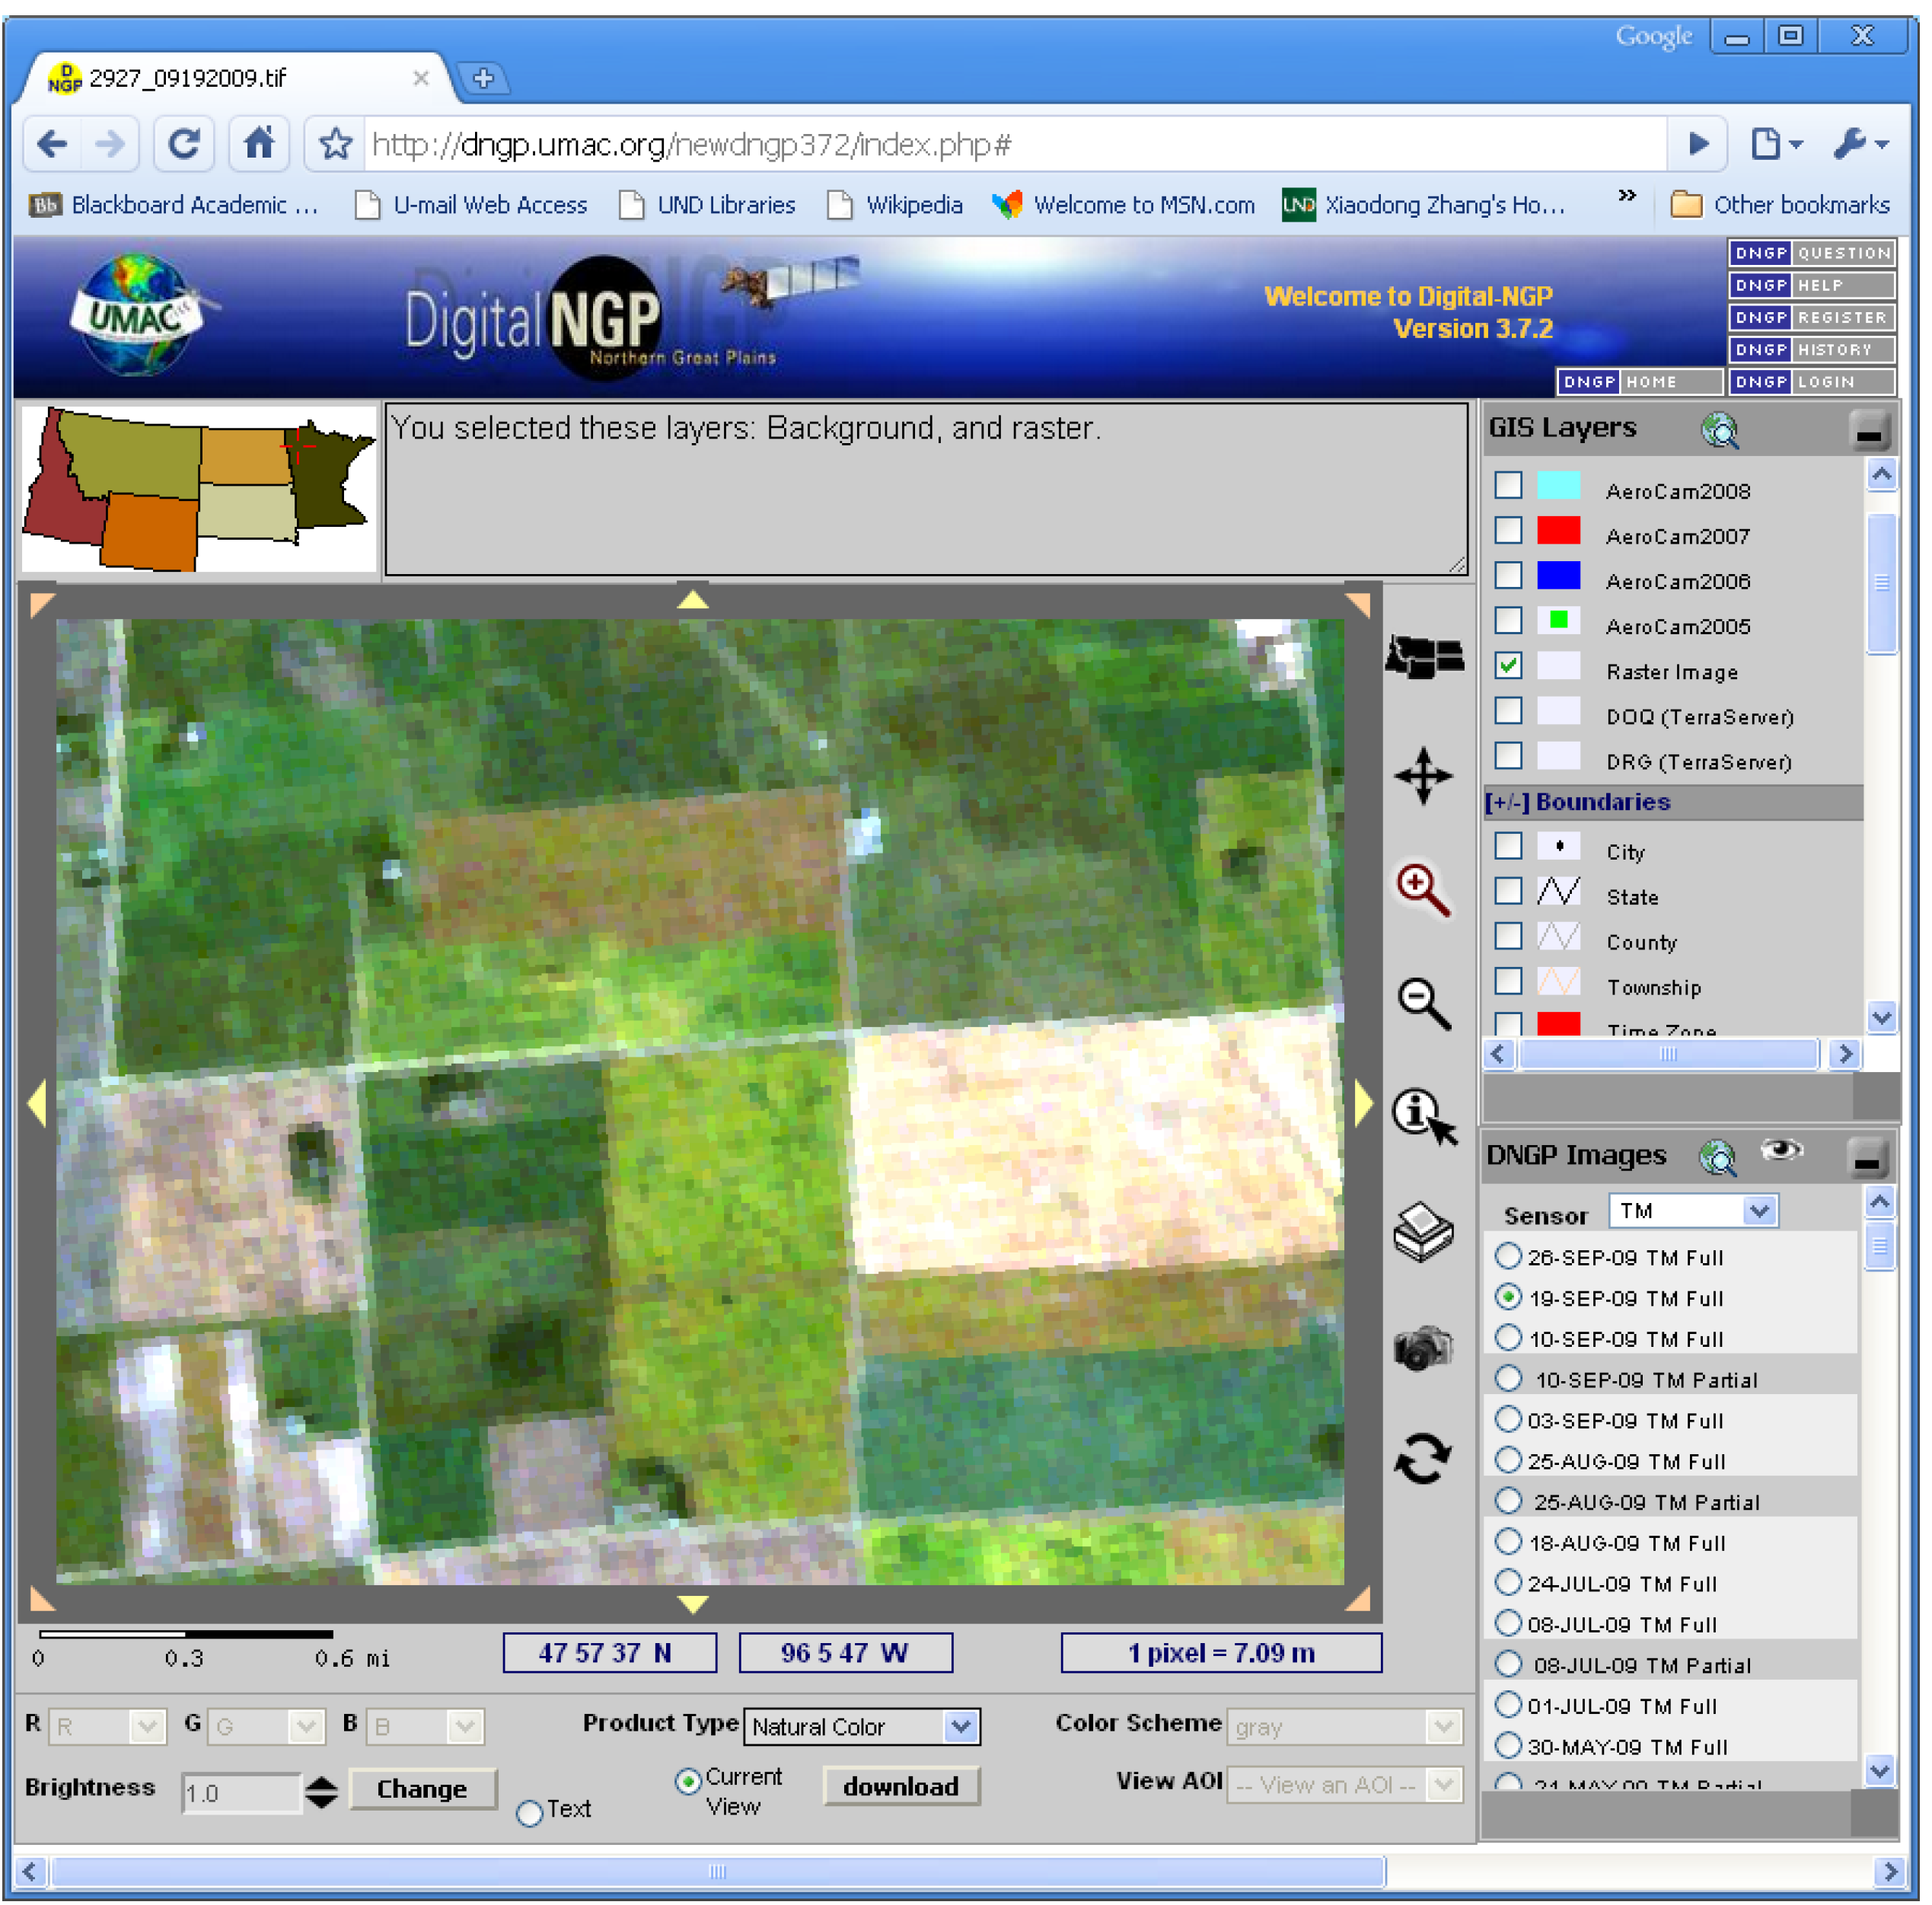
The client tier is a web interface, through which users interact with DNGP and its database. The web interface features a modularized design with three independent panels for image display, image list, and GIS layers (
Figure 2). Each panel communicates with the server through Asynchronous JaveScript and XML (AJAX) technology individually. With AJAX, only the web contents that need to be updated are refreshed, avoiding downloading redundant information, saving bandwidth and giving users a smoother viewing experience. For example, if a user navigates to a different area, both the view of the current image and the list of images covering the new area will be updated automatically, while the GIS layers panel remains unchanged.
Figure 2.
Screen-shot of the DNGP system displaying a Landsat TM image (color composite with bands 3, 2, and 1) acquired on September 19, 2009 farmland in Minnesota. Panels list available GIS layers (upper right) and all the images covering the area (lower right).
Figure 2.
Screen-shot of the DNGP system displaying a Landsat TM image (color composite with bands 3, 2, and 1) acquired on September 19, 2009 farmland in Minnesota. Panels list available GIS layers (upper right) and all the images covering the area (lower right).
The data processing tier, the main component of the DNGP implementation, is where the server side processing takes place, interacting with both the client and the database. This tier was implemented using Open Source applications. Raster and vector data are processed using the Geospatial Data Abstraction Library (GDAL) and OpenGIS Simple Features Reference Implementation (OGR) library, respectively. Various raster and vector layers are combined into a final image using another open source package, MapServer. We also used the PROJ.4 Cartographic Projections Library for coordinate conversion between different projections and datums.
All images are stored in a storage server and managed through an Oracle database system with a spatial operation extension. While Oracle allows storage of binary data such as images in the database, we chose to store images as external GeoTIFF files and to link the images to the database through their regular and spatial attributes. This barely affects the database performance, but offers advantages of containing the database’s size and hence the cost of managing it. Spatial operations such as intersection or containment enable images to be searched geographically. Spatial information on users’ areas of interest and the geographic extents of images is saved. The latter are detected automatically by an algorithm we have developed. This is particularly important for geo-referenced Landsat-type images, because they are tilted relative to North and therefore often covers a smaller area than the geo-extent of the file which is aligned with North.
The DNGP system has several features that enable users with low-bandwidth Internet connections to search and download remote sensing data and products easily and quickly. These features include:
(1) An intuitive user interface to allow users to conduct searches via spatial coordinates. This is critical because essentially a farm is a spatial object. With thousands of images archived, this allows a user to focus quickly on his or her area of interest.
(2) Capability to subset remote sensing images either spatially or spectrally. For example, a typical Landsat scene covers ~740,000 acres whereas a farm typically spans ~3,000 acres, or only 1/250th of a scene. Dynamic subsetting helps achieve timely delivery by eliminating data of no interest to a user and saving a significant amount of bandwidth.
(3) Products generated on the fly, which not only simplifies the database design but also allows users to access the improved or new products quickly. Currently, the data products include color and false-color composites, NDVI, green NDVI, and sugar beet yield [
11]. The differences in spectral response functions affect the estimate of vegetation indices [
12]. But for the sensors whose imagery is hosted in DNGP, the differences are <10% and therefore are not considered in the current products.
(4) Compatibility with a wide range of application software. In addition to GeoTIFF format, in which the original images are saved, images or products can also be rendered as ASCII text files.
(5) A multitude of vector layers, including township, highways, lakes, rivers, and other geographic features has been incorporated into the system to help users identify their targets.
(6) A single interface design with dynamic content update to provide a smooth user experience.
A user of DNGP can have seamless access to images hosted by other data providers through Open Geospatial Consortium, Inc. (OGC) Web Map Service (WMS), Web Feature Service (WFS), or Web Coverage Service (WCS) [
13]. Currently, DNGP provides access to 1 meter Digital Ortho Quarter Quads (DOQQ) aerial photographs hosted by TerraServer [
14]. Through these web services, users have access to a much wider range of data and information than a single system, such as DNGP, could possibly provide.
From designing the DNGP system to promoting its use among the end user community, we followed the innovation adoption/diffusion model of Rogers [
15]. While remote sensing technology’s potential for improving productivity is generally accepted by agricultural producers, endorsement of the technology by a few key early adopters accelerated widespread adoption of the innovation. To identify and engage early adopters, we followed a learning community approach [
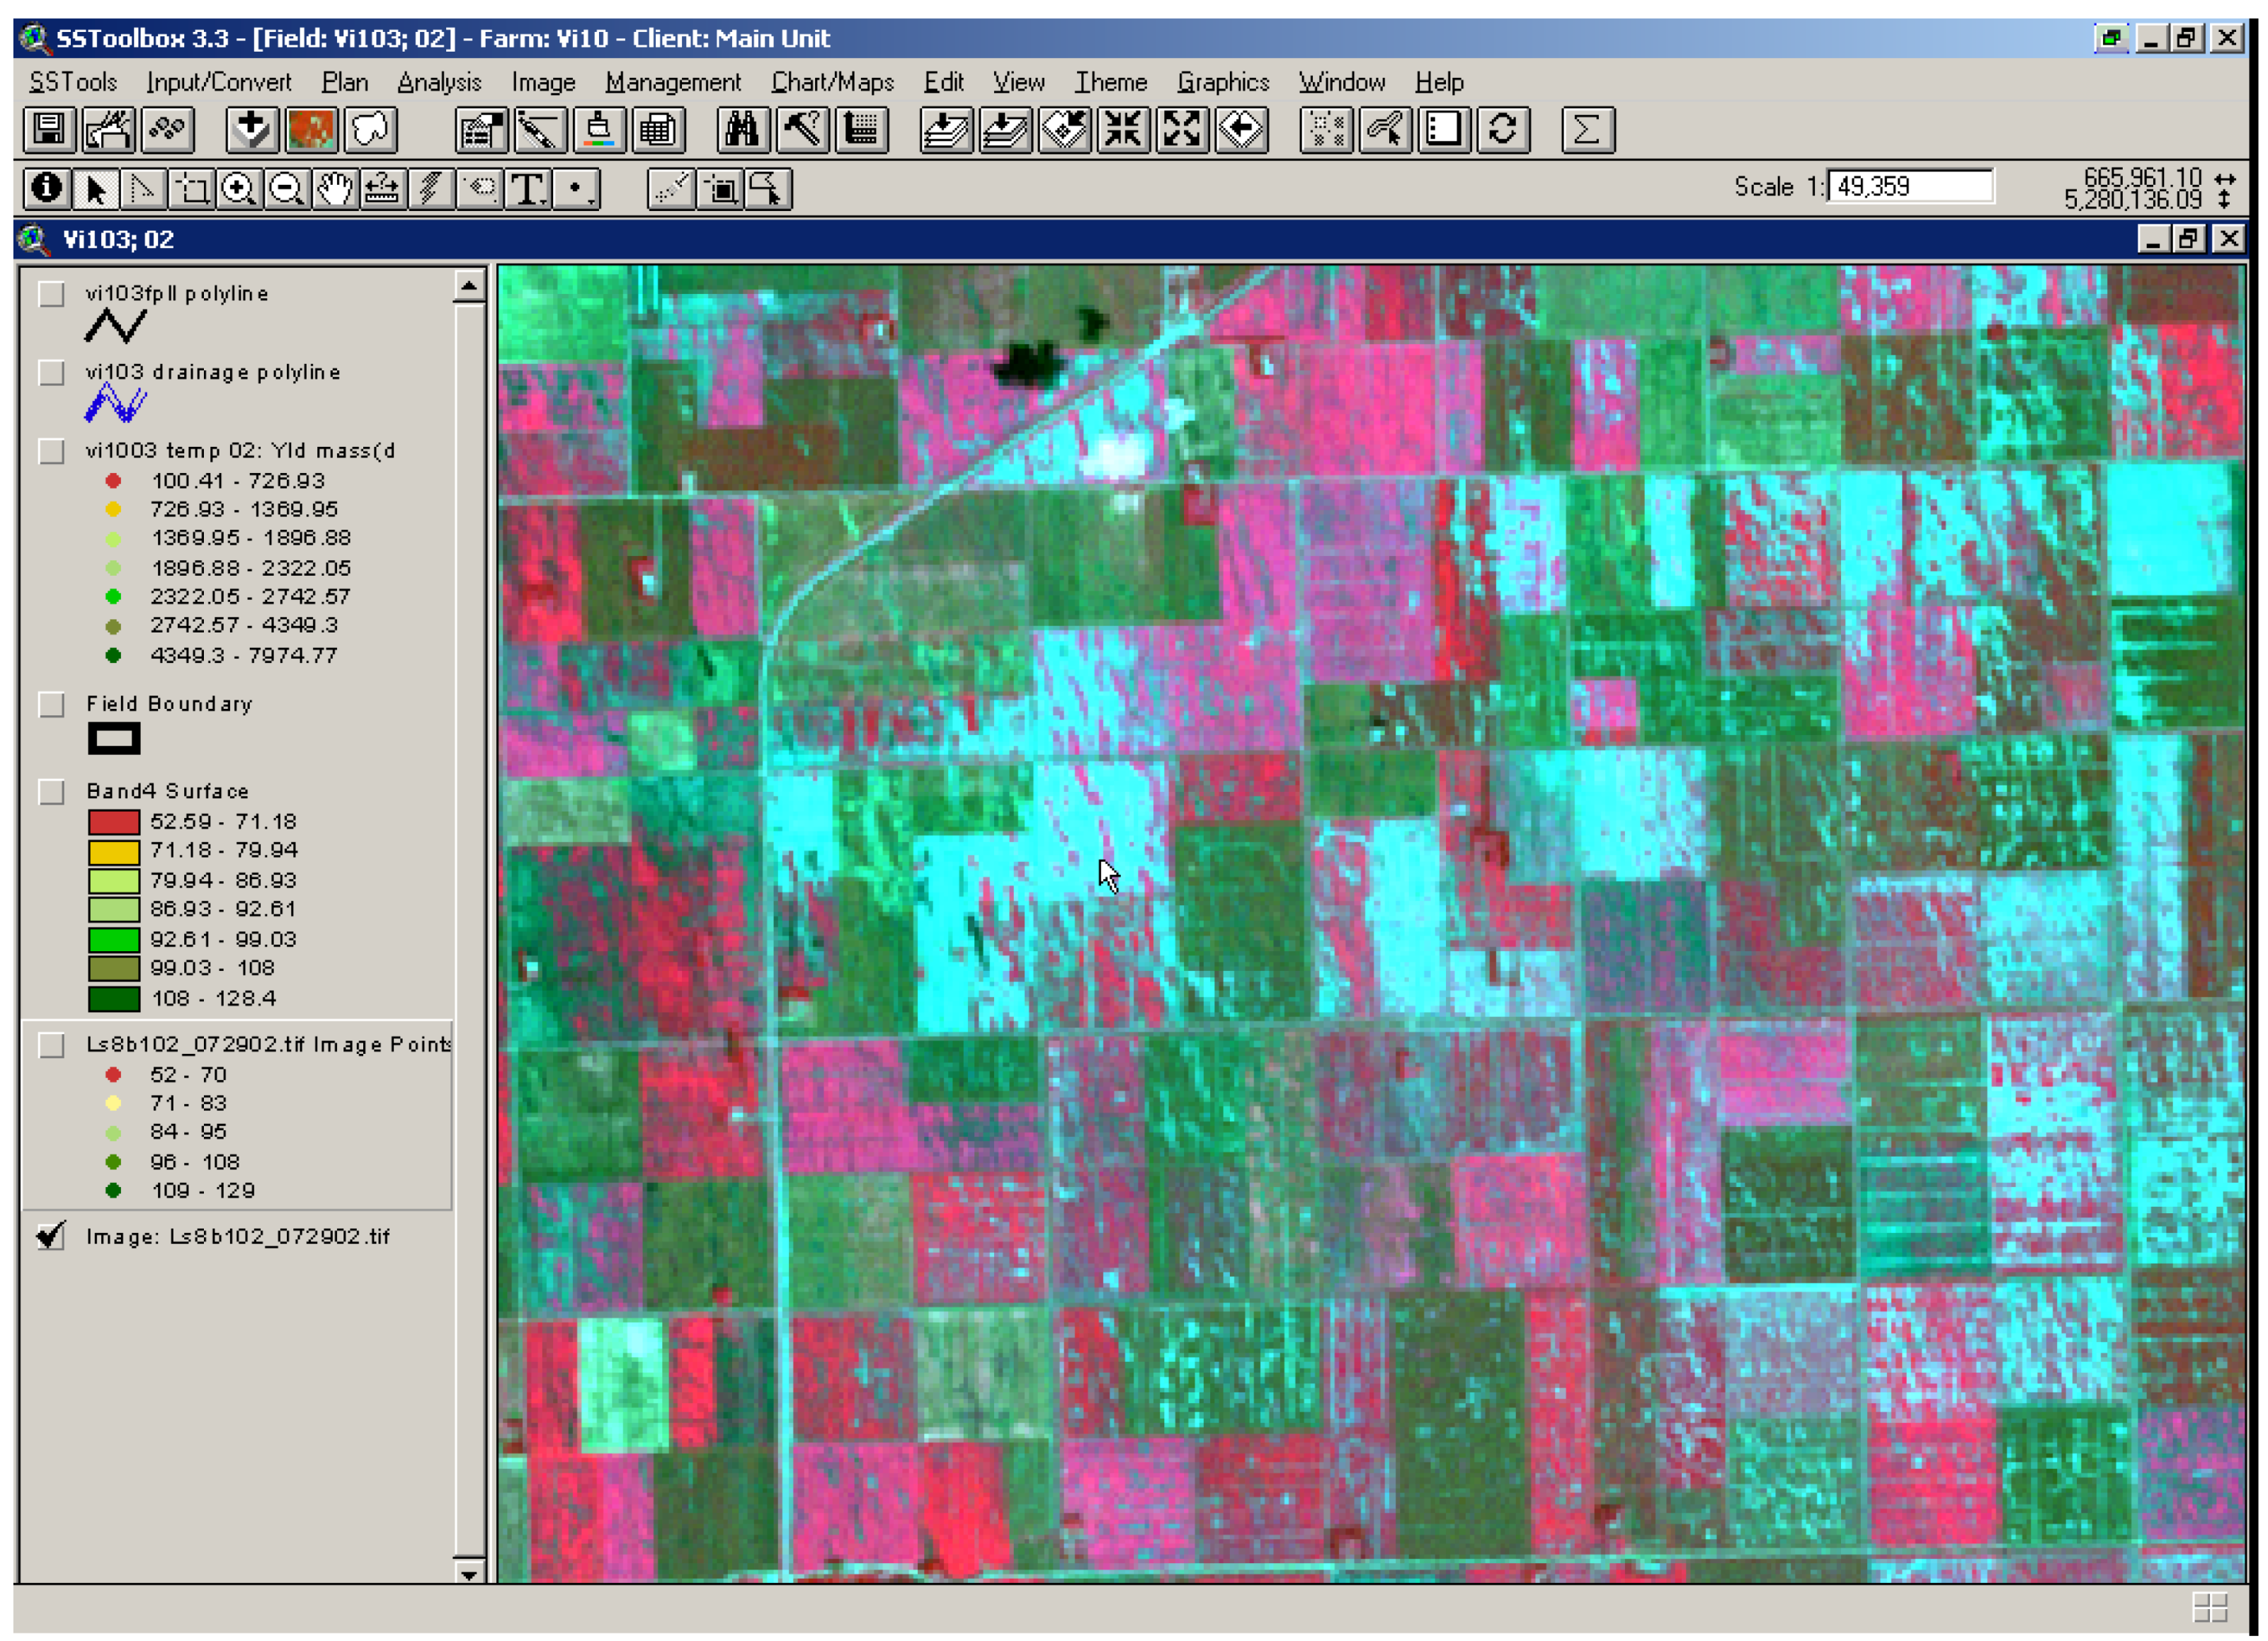
8], where producers were treated as full partners and not as clients of researchers. This led to the design of DNGP to be practical with tools and products that end users need. For example, many software applications still being used by agricultural producers cannot ingest geo-referenced raster images directly. Permitting users to download images in ASCII text format extended the functions of these legacy applications while saving the expense of acquiring and the investment of time learning new software. Also, information on cost-benefits is freely shared within the learning community, leading to trust and confidence in the use of the technology. Training workshops were conducted regularly across the UMAC region to expand the learning community by assimilating more early adopters.
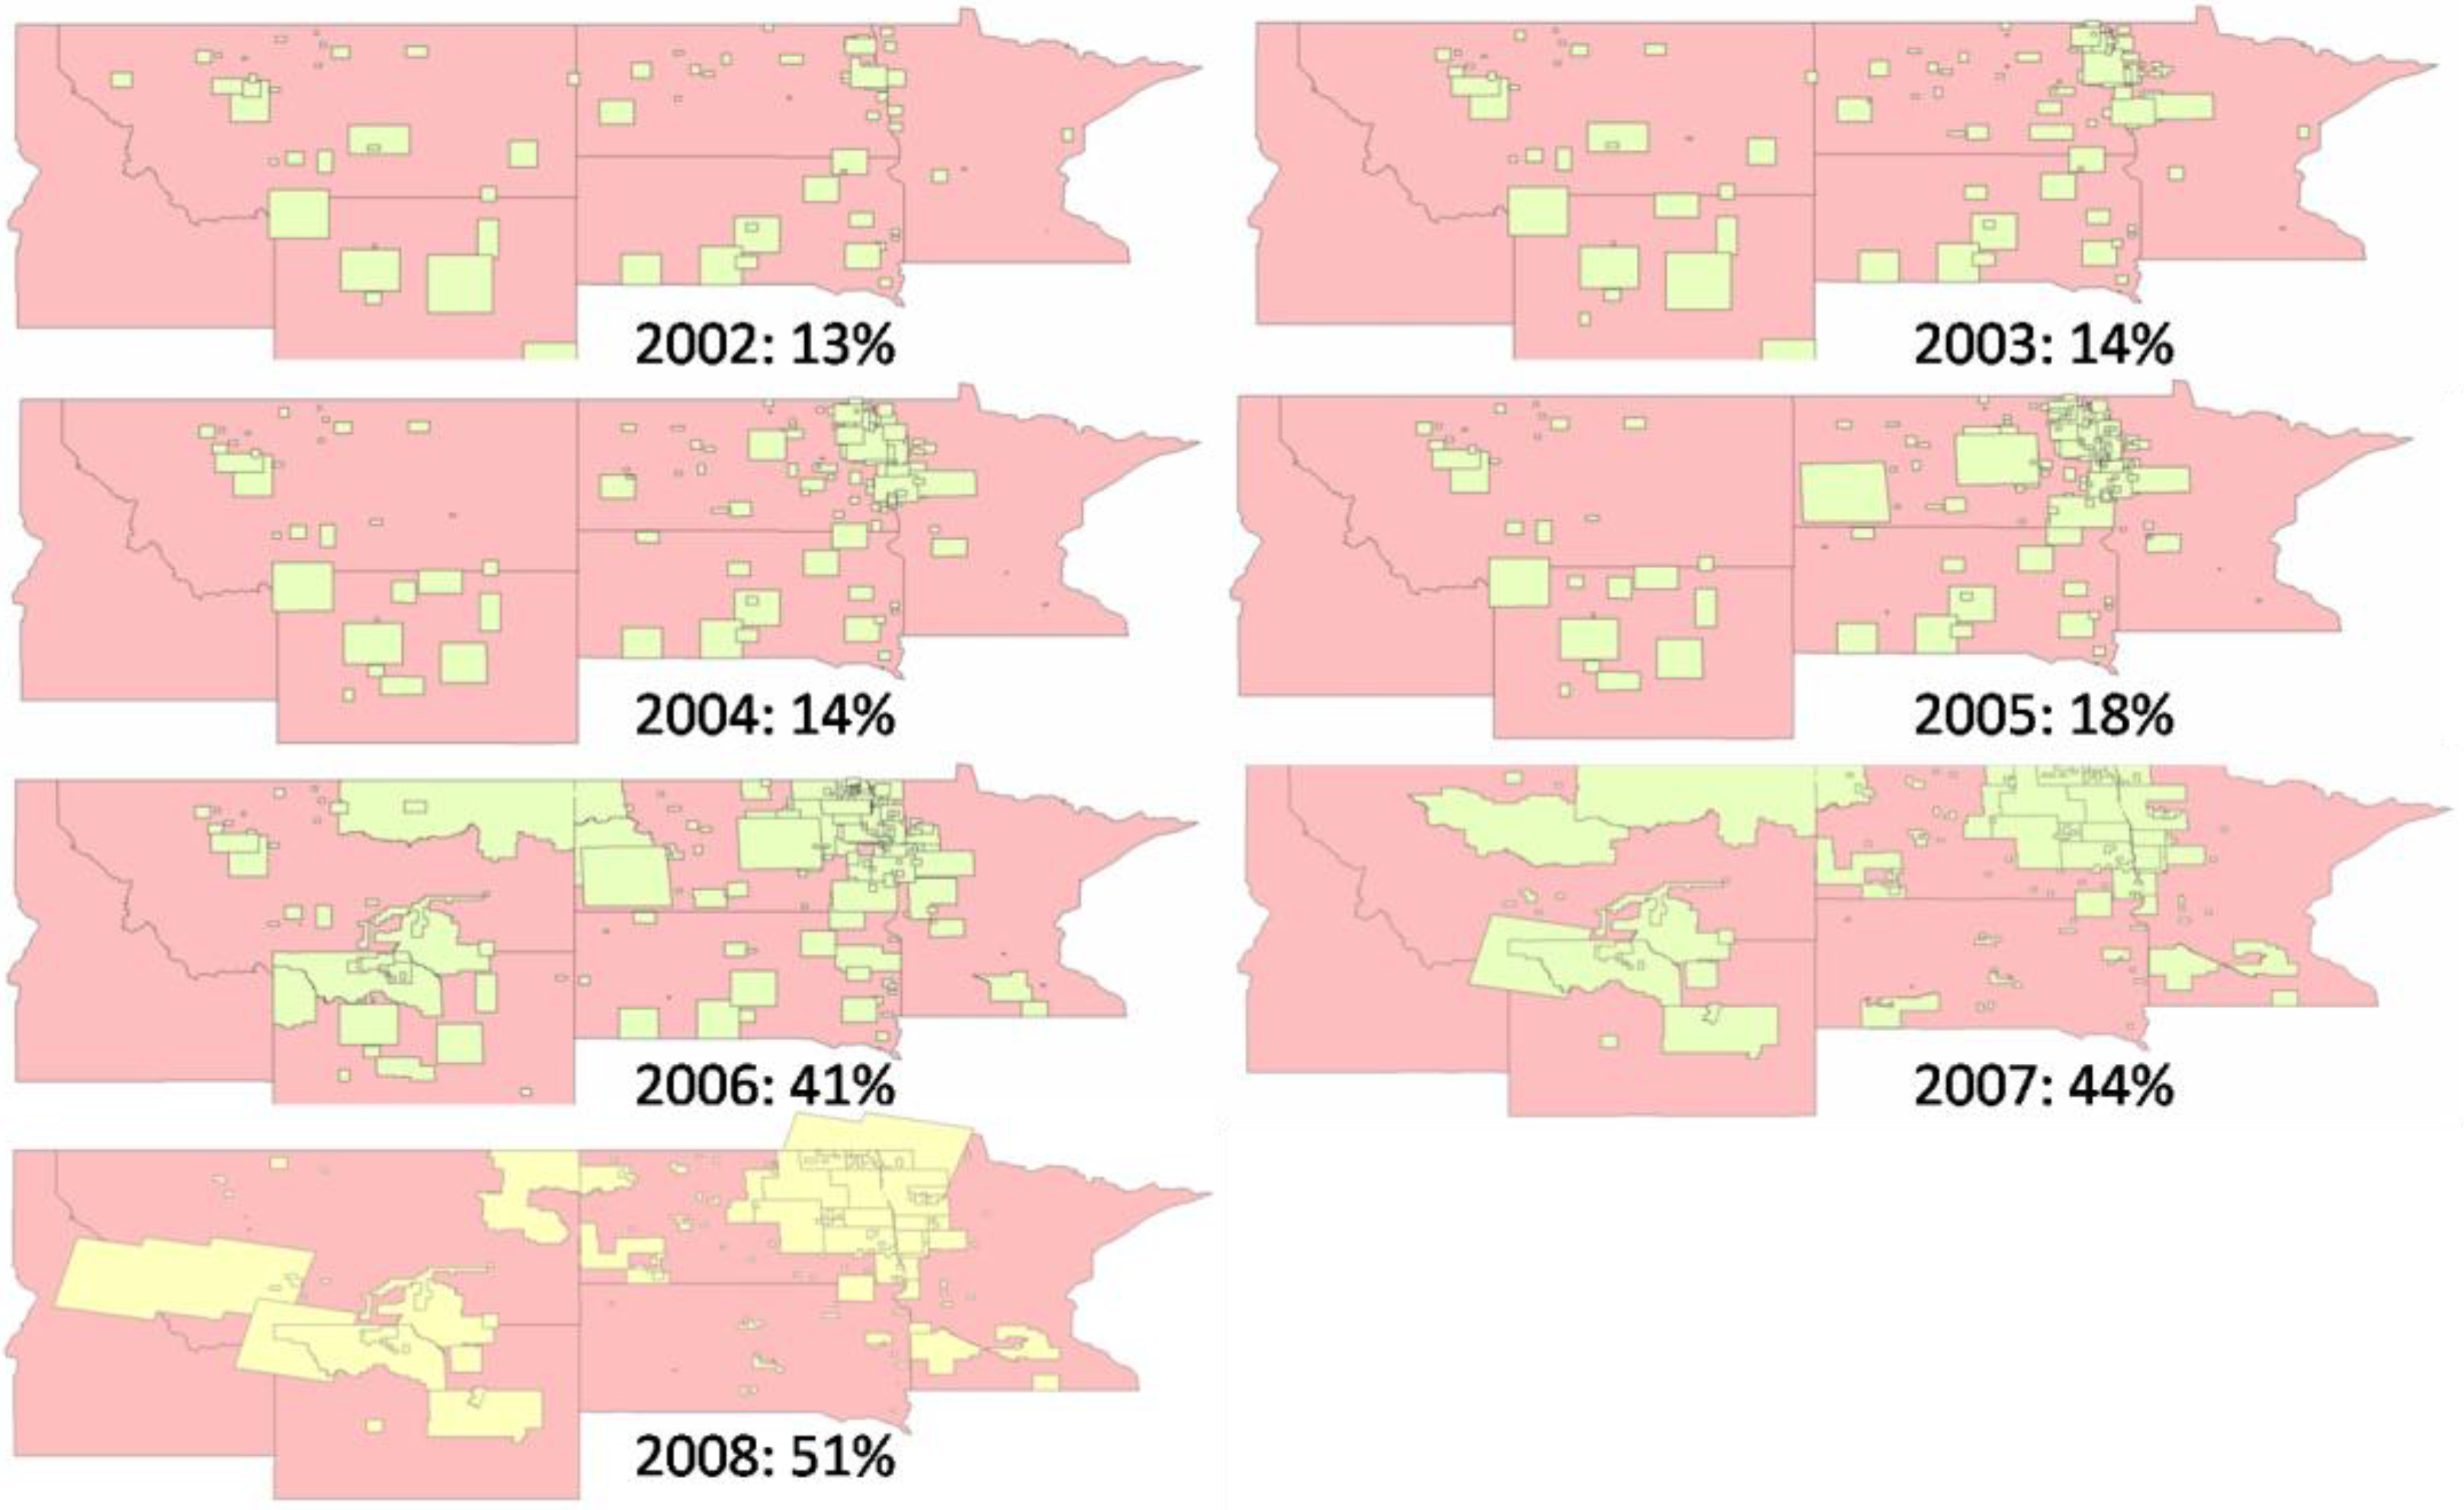
The success of DNGP is illustrated in
Figure 3, showing steady growth in areas of interest for which users have requested images. Prior to the development of the DNGP system, FTP and postal mail were the primary means for delivery of imagery and the coverage of images requested amounted to only about 14% of the total UMAC region. Since its initial release in 2004, the DNGP system has enabled more and more agricultural producers to apply remote sensing technology in practice. The total areas of interest have expanded steadily from <20% of total UMAC area before 2005 to ~50% in less than four years.
Figure 3.
Areas of interest for which users have requested remote sensing images between 2002 to 2008 are overlaid on a map of six states of North and South Dakota, Minnesota, Montana, Wyoming, and Idaho. Numbers after each year indicate the percentage of AOI relative to the total geographic area.
Figure 3.
Areas of interest for which users have requested remote sensing images between 2002 to 2008 are overlaid on a map of six states of North and South Dakota, Minnesota, Montana, Wyoming, and Idaho. Numbers after each year indicate the percentage of AOI relative to the total geographic area.
While remote sensing images hosted in DNGP have provided services to a broad community ranging from K-12 teachers to government agencies, the majority has been used for agricultural management.
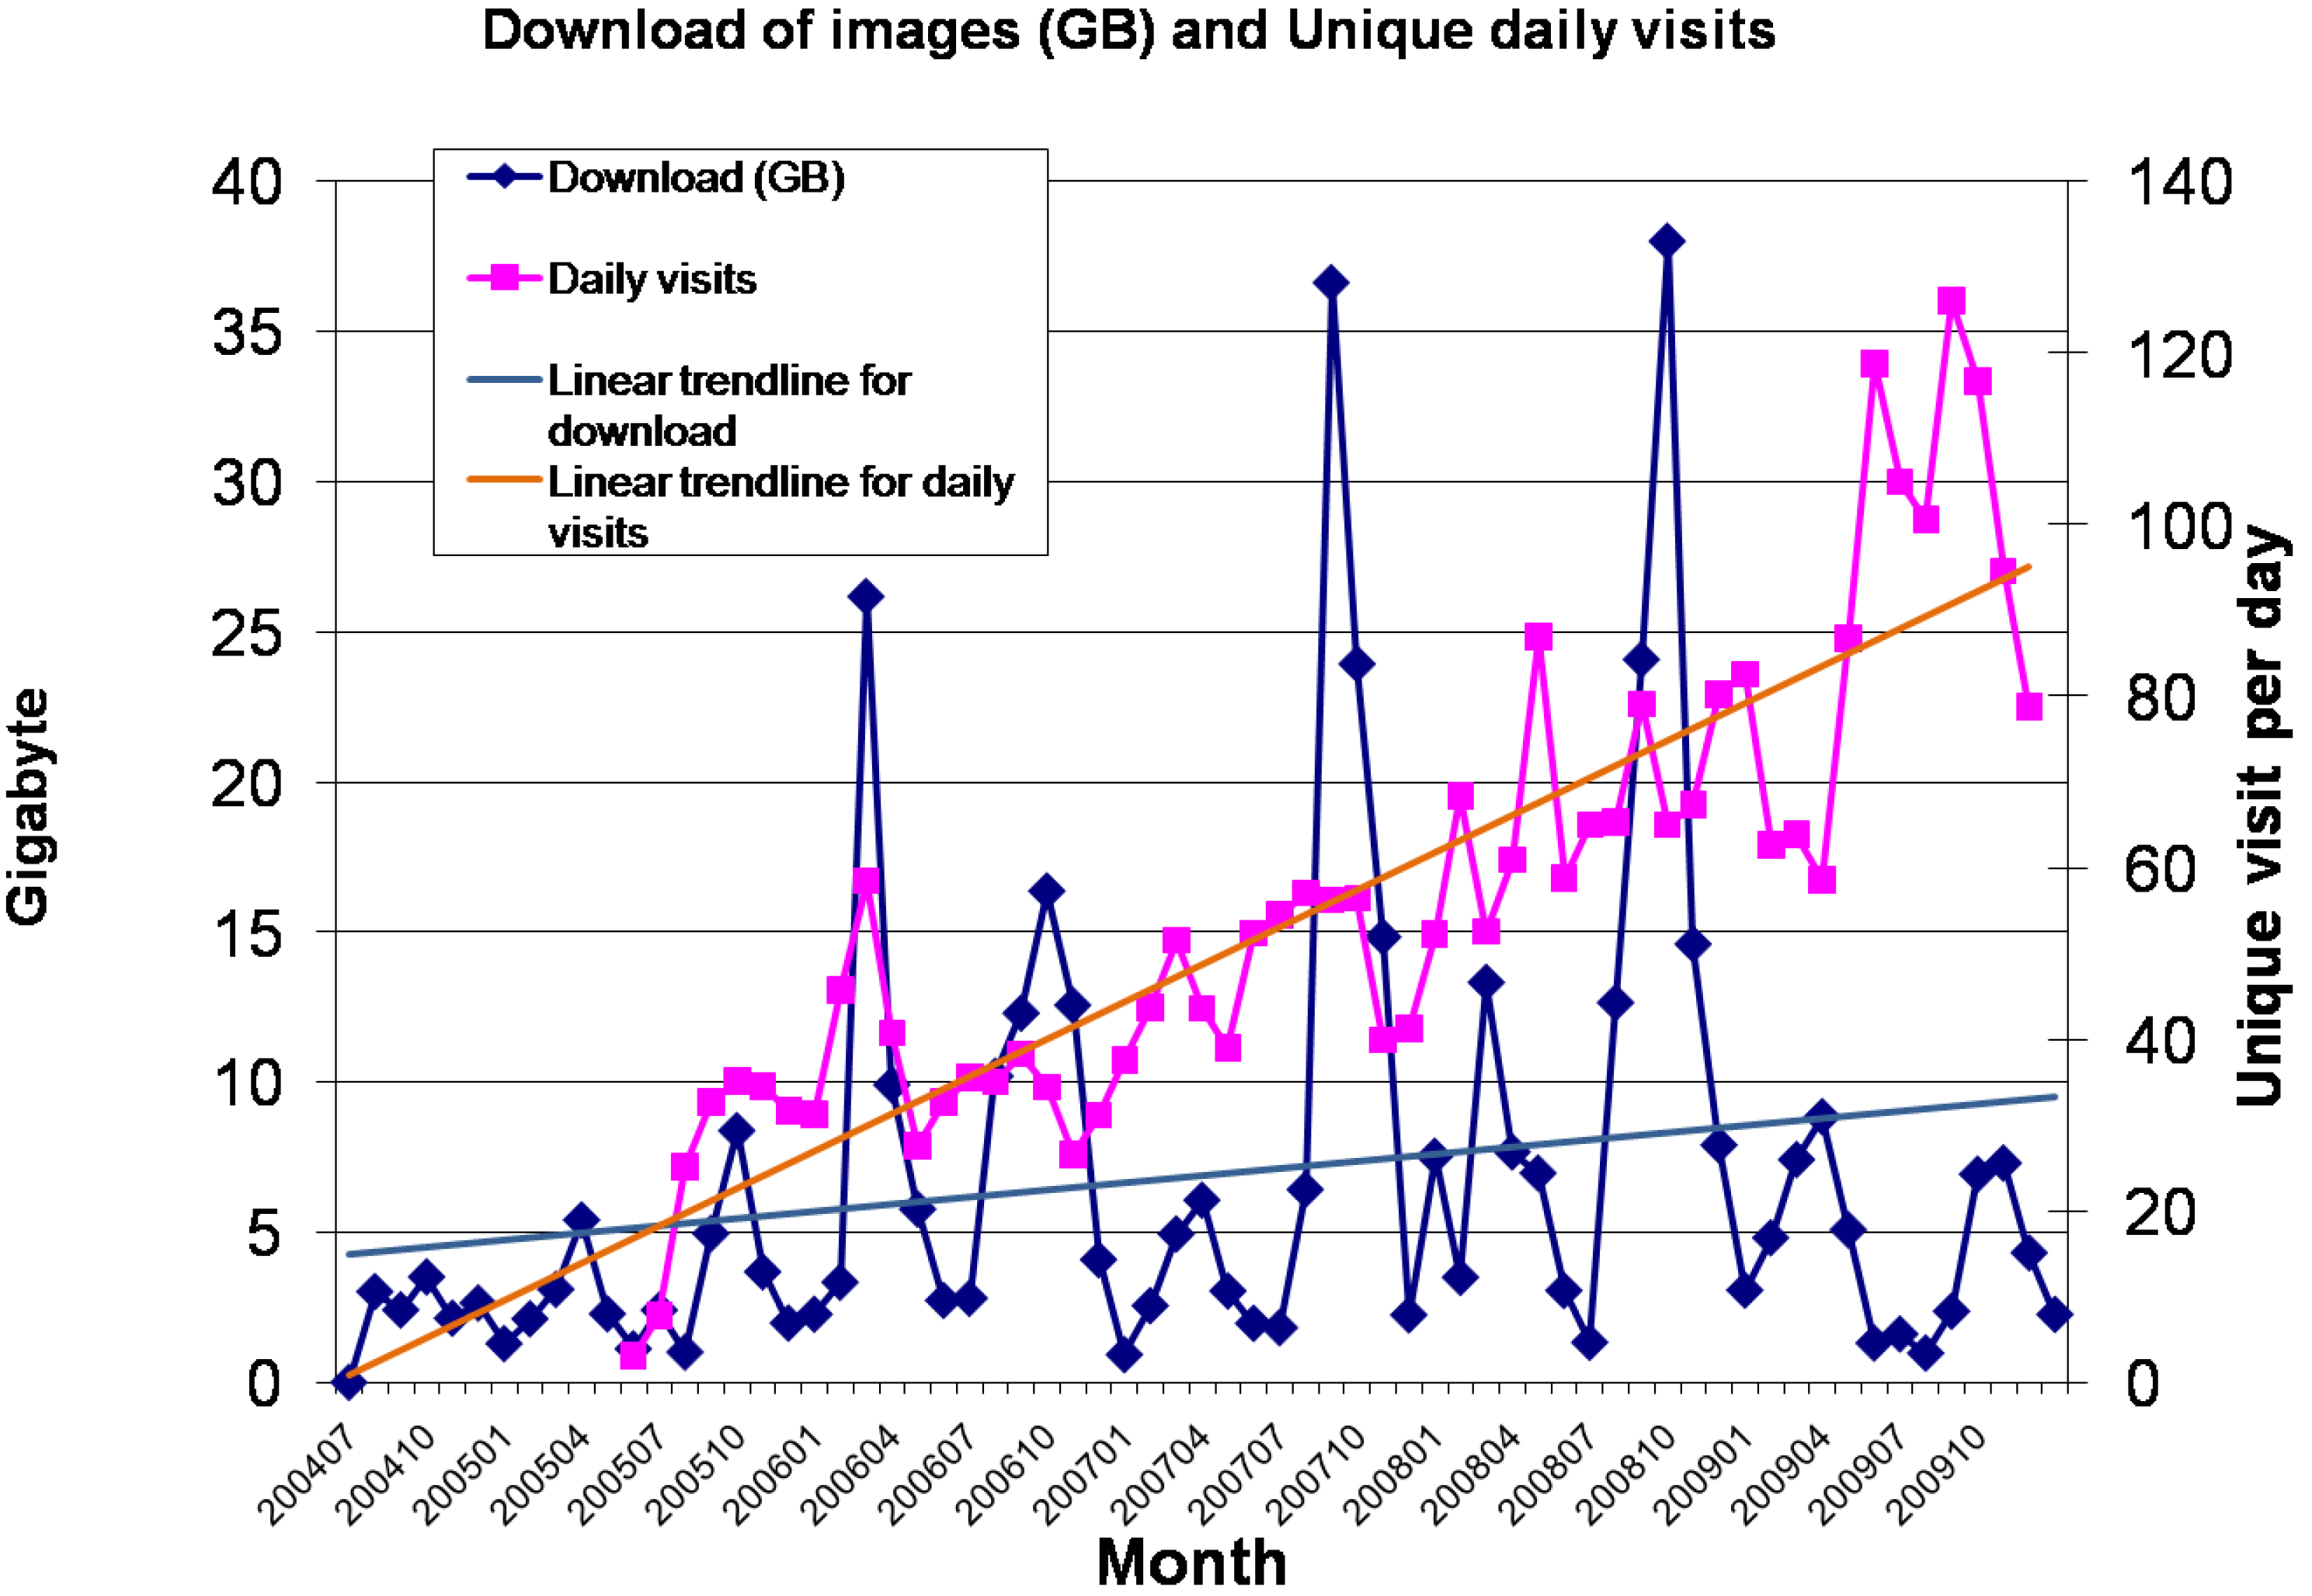
Figure 4 shows the number of unique daily visits, averaged monthly, to the DNGP website as well as the total quantity of data downloaded in Gigabytes. In addition to the overall growth trends, these two parameters also exhibit a strong seasonal pattern, with two peaks occurring around April and October annually. These peaks coincide with the spring planting and fall harvesting seasons in UMAC’s region. Comparison of
Figure 3 and
Figure 4 indicates that the significant increase in actual download of images during 2006–2008 was due to the great expansion in the number of users and their area of interests. For example, for the four months from July to October in 2008, a total of 72 GB of images and products were downloaded, with an accumulated area about half the size of the UMAC’s region.
The two parameters shown in
Figure 4 have diverged since 2009: the daily visits continue to rise, but the quantity of data downloaded has decreased as compared to the previous years. The reason is because UMAC released a new extension to DNGP in 2008, Zone Mapping Application for Precision-farming (ZoneMAP) [
16]. ZoneMAP further expanded the service by DNGP in two aspects: (1) the source of data was extended to include field measurements by end users; and (2) instead of raw data, management zones can be delineated automatically based on the selection of data. The decrease in downloading images was accompanied by an increase in use of ZoneMAP. The divergence is explained by the fact that producers are more interested in value-added products that can be used directly for decision making than in the images themselves.
Figure 4.
Unique daily visits averaged monthly and total downloads of DNGP images in Gigabytes between July 2004 and December 2009.
Figure 4.
Unique daily visits averaged monthly and total downloads of DNGP images in Gigabytes between July 2004 and December 2009.
The design of DNGP allows value-added products to be added easily and quickly, because only imagery is permanently saved and all imagery products are generated on the fly. Our ultimate goal is to use DNGP as a backbone for delivering remote sensing data and information, from which various specific decision-support systems can be developed. In the following, we will describe several applications using the DNGP system which have the potential to evolve into decision-support systems targeted for specific applications.


