Article

The Intercomparison of X-Band SAR Images from COSMO‑SkyMed and TerraSAR-X Satellites: Case Studies

Institute of Applied Physics "Nello Carrara" (IFAC-CNR), Via Madonna del Piano, 10, I-50019 Sesto Fiorentino (FI), Italy
*
Author to whom correspondence should be addressed.
Remote Sens. 2013, 5(6), 2928-2942; https://doi.org/10.3390/rs5062928
Submission received: 4 April 2013 / Revised: 14 May 2013 / Accepted: 4 June 2013 / Published: 6 June 2013
(This article belongs to the Special Issue Advances in Remote Sensing of Agriculture)

Abstract

:
The analysis of experimental data collected by X-band SAR of COSMO-SkyMed (CSK®) and TerraSAR-X (TSX) images on the same surface types has shown significant differences in the signal level of the two sensors. In order to investigate the possibility of combining data from the two instruments, a study was carried out by comparing images collected with similar orbital and sensor parameters (e.g., incidence angle, polarization, look angle) at approximately the same date on two Italian agricultural test sites. Several homogenous agricultural fields within the observed area common to the two sensors were selected. Some forest plots have also been considered and used as a reference target). Direct comparisons were then performed between CSK and TSX images in different acquisition modes. The analysis carried out on the agricultural fields showed that, in general, the backscattering coefficient is higher in TSX Stripmap images with respect to CSK-Himage (about 3 dB), while CSK-Ping Pong data showed values lower than TSX of about 4.8 dB. Finally, a difference in backscattering of about 2.5 dB was pointed out between CSK-Himage and Ping-Pong images on agricultural fields. These results, achieved on bare soils, have also been compared with simulations performed by using the Advanced Integral Equation Model (AIEM).

1. Introduction

With the launch of COSMO-SkyMed (CSK) and TerraSAR-X (TSX) missions, a significant quantity of X-band backscattering data, useful in several hydrological applications, was made available to the scientific community [13].
The presence of these SAR satellites represents an excellent opportunity to monitor the parameters involved in the hydrological cycle, thanks to a very short revising time in convenient and various configurations of incidence angles and polarizations.
Some preliminary considerations on the sensitivity of X-band SAR to surface parameters have been mostly performed in the framework of the SIR-C/X-band experiment [46]. Thanks to the COSMO-SkyMed Announcement of Opportunity funded by the Italian Space Agency (ASI), significant experimental studies for exploiting the capabilities of the X-band SAR mission in monitoring soil and vegetation parameters were recently carried out. Among them, the project ASI/1720 HydroCOSMO demonstrated a considerable sensitivity of X-band backscatter to soil, snow and vegetation features [7,8]. Although this frequency is not the optimal one for the investigation into soil and vegetation cover, a reasonable sensitivity to soil moisture and vegetation biomass of agricultural crops has been observed [912]. Analogous results have been obtained from the exploitation of TSX data, as it has been demonstrated in [13] and [14].
Complementary information can be derived from the data fusion of these two sensors, for a better scene understanding, which is very useful for all the techniques of change detection [15,16]. However, absolute radiometric calibration, geometric differences due to conditions of acquisition and temporal decorrelation make the joint use of multi-modality images a very challenging task, especially in the case of multi-sensor satellite SAR images, for which relatively few works have been proposed until now [17,18].
The synergism between CSK and TSX missions and the interchangeability of SAR data coming from different X-band sensors is, therefore, an added contribution to scientific research, in general, and to hazard management and monitoring [19,20], which are applications where the revisit time is of vital importance. The opportunity of obtaining information about the seasonal variations of soil moisture, vegetation biomass and snow cover at the X-band is, in general, very important for hydrology, water management, climatology and natural hazards. However, if these satellites have different calibration, their datasets cannot be directly compared, hampering their combined use in inversion algorithms and, consequently, the retrieval of geophysical parameters. For this reason, a comparative analysis of these SAR sensor images is essential. This study aims to compare data from the two missions, and in this paper, some comparisons have been made between CSK and TSX images in different acquisition modes. The data processing was carried out by using standard calibration procedures provided by the space agencies, implemented by commercial software (i.e., SARSCAPE ©). The work, which was focused on image comparison, took into consideration some natural surfaces (i.e., forests and agricultural bare soils) used as reference targets. The choice of the images was then carried out so that the natural targets did not change significantly during the acquisition period. The final goal of this investigation was to provide useful information and some advice for the simultaneous use of SAR images acquired by different sensors. The comparison between TSX-Stripmap and CSK-Ping Pong was performed on an agricultural test site located in the watershed of the Scrivia River, in Northwest Italy. The other comparisons were performed on a test site located close to Florence in Tuscany (Central Italy). A further analysis of the data acquired by both TSX and CSK sensors was carried out by using the Advanced Integral Equation Model (AIEM) [21,22], in order to check the level of backscatter. The backscatter of bare soil was simulated for different fields, taking into account the values of soil moisture and surface roughness measured on the ground. Although the AIEM is not always able to fit the SAR signal correctly, this model is the most currently used for this type of analysis, also thanks to its extended validity limits. It should be noted that the results shown in this paper are based on a limited quantity of data and, consequently, require further data analysis and confirmation.

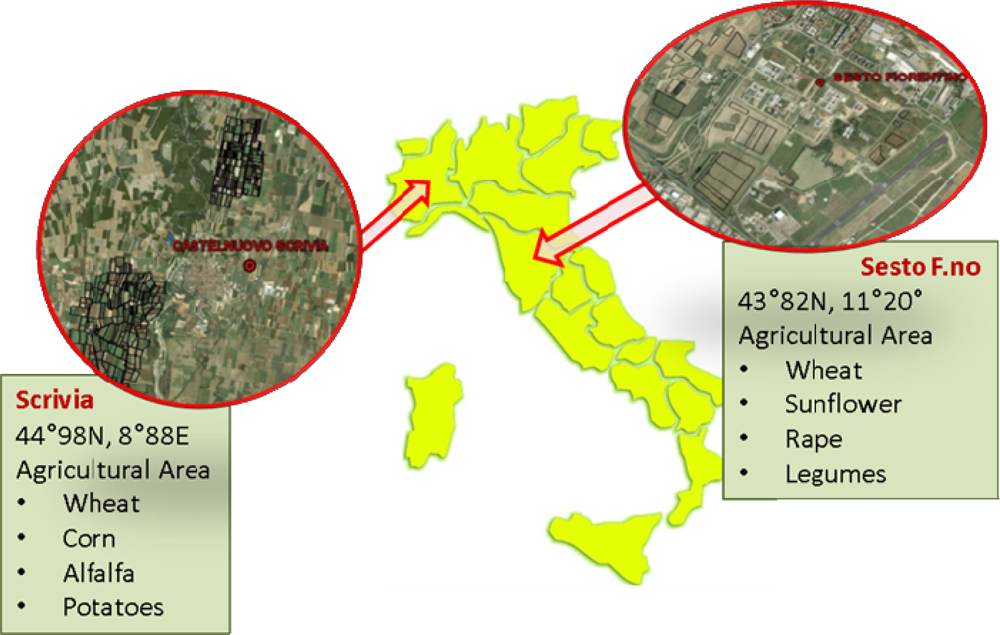
2. The Experimental Data and the Test Sites

A picture of the selected test areas is shown in Figure 1. The watershed of Scrivia is a flat alluvial plain of about 300 km2 located near the confluence of the Scrivia and the Po rivers in Northwest Italy (central coordinates: 44.98°N, 8.88°E). It is characterized by large, homogeneous, agricultural fields of wheat, corn, sugar beet and potatoes and has been the test site for other SAR investigations [23]. The Tuscany area, called Sesto, is a flat plain close to Florence of about 50 m (a.s.l.) (central coordinates: 43.81°N, 11.20°E). Forests are also present, mainly in the northern side of the agricultural test site features, and are mainly constituted by closed (greater than 40%) broad-leaved deciduous forests (oaks and hashes), with an average height greater than 5 m. A smaller part of the forest is represented by closed (greater than 40%) needle-leaved evergreen forest (black pine, white spruce), with an average height greater than 5 m [7,8]. Most images were acquired in HH polarization (except for a few images acquired on the Tuscany test site) and the look direction was ‘right’ for the entire dataset. In Table 1, a summary of SAR images collected on these test areas is represented. The SAR data were required in ‘single look complex’ format both for CSK (Single-look Complex Slant product Balanced, SCS-B) and TSX (Single-look Slant Range Complex representation, SSC), and the imaging mode is ‘Stripmap’ for the two sensors. The ‘Stripmap’ mode represents the best compromise between spatial resolution (few meters) and the extent of the observed surface in a single acquired SAR frame (tens of kilometers). The other configurations have, on one hand, too low spatial resolution with respect to the size of the selected agricultural fields (i.e., Scansar) and, on the other hand, a small frame in terms of observed surface (i.e., Spotlight). The task of this paper required that SAR images be acquired, as much as possible, at the same time and with similar instrument and orbital parameters (i.e., incidence angle, polarization and spatial resolution). However, since CSK is a dual (civil and military) mission, the planning of the exact acquisition time on a test area is problematic. For this reason, the matching with TSX was extremely difficult and the common acquired dataset very slim.
The land cover classification of the test site was obtained through the Coordination of Information on the Environment (CORINE) land cover data, which was used to classify the surface in four broad classes: anthropic, forest, water bodies and agricultural areas. Moreover, three ground campaigns were performed close to the satellite passes on 12–13 May, 2010, on the Scrivia test site and on 16 March and 17 April 2012, on the Sesto (Tuscany) test site.
The ground measurements on the test sites consisted of the classification of agricultural crops and the collection of the main vegetation and soil parameters: fresh vegetation biiomass (in kg/m2), plant water content (obtained as the difference between fresh and dry weight, in kg/m2), soil moisture content (SMC, in m3·m−3) by using a time domain reflectometer (TDR, IMKO TRIME-IT) probe and surface roughness of bare soils by using a needle profilometer. Soil surface roughness was expressed by the two usual parameters of height standard deviation (Hstd, in cm) and correlation length (Lc, in cm), which ranged from 1 to 2.5 cm and 8 to 12 cm, respectively. Thirteen agricultural fields were sampled in the Sesto and 14 in the Scrivia areas for each campaign. At least four measurements per field for SMC and soil roughness have been carried out. In Figure 2, the measured SMC values in each investigated agricultural field in the Sesto area, during the ground campaigns carried out on 16 March and 17 April 2012, are shown. The monitored fields did not present a predominant row direction with respect to north. No significant patterns related to the surface anisotropy have been observed, at least for the fields taken into consideration. Meteorological data of the area were also available in the period of the satellite passes (i.e., air temperature and humidity, rainfall, wind speed and direction). As an example in Figure 3, daily rainfall (a) and average air temperature (b) data are reported.

3. Experimental Results

In order to compare the acquired data, the SAR images were geocoded and calibrated with a standard procedure, using slant range single-look complex data for both sensors, by means of a commercial software (SARscape ©) that implements the radiometric calibration according to the official documents of the corresponding space agencies [2426]. The acquired images have been processed by using the following usual procedures. Multi-look detected images were generated from single-look complex data by averaging the intensity in azimuth (10 looks for CSK and 5 looks for TSX) and range (5 for CSK and TSX) direction. The number of looks was chosen in order to filter the speckle and retrieve a square pixel in the multilooked image. The geocoding was performed to convert the position of the backscatter elements from SAR geometry to three-dimensional object coordinates by using a DEM (derived from the SRTM mission) and the satellite orbital parameters. The geocoded images have a pixel size of 10 × 10m2. In addition, layover and shadow effects in every acquired image were identified. Finally, the stack of images was generated and merged with the classification map of the observed area. The noise equivalent sigma zero (NESZ) was neglected, since the value is −19 dB for TSX and −22 dB for CSK, in the worst cases, as it can be observed in [24] and [25]. A preliminary investigation of the characteristics of the images acquired by the two different sensors was carried out on a rather stable and homogenous target, such as a forest area, previously described in Section 2. The histogram of the mean σ° values is presented in Figure 4 for different satellites: CSK1, 2 and 3 and TSX1. In general, it can be observed that CSK Ping Pong (PP) σ° data show the lowest values (average: −13.17 dB, standard deviation, SD = 3.41 dB) and a very spread histogram, whereas TSX σ° in HH polarization shows the highest values (−8.11, −8.61 dB, SD ≈ 2.4 dB) and generally higher than the corresponding CSK Himage (HI) in HH polarization too (see Table 2). Although at X-band, σ°, on forest is not necessary as stable as σ° at the L-band, due to the wind and the presence and absence of leaves, the differences observed between the various sensors and, in particular, between CSK2-PP and the others, seem indeed rather high for a forest area. This fact suggested a more in-depth investigation of the performances of CSK and TSX satellites.

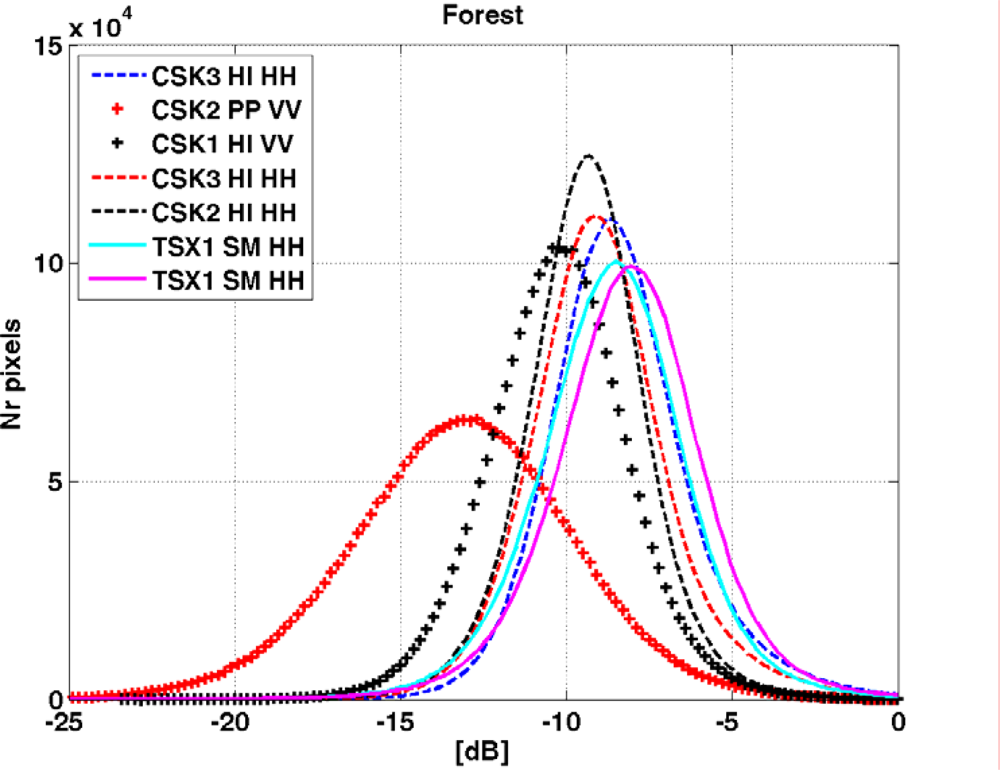
3.1. Comparison of COSMO-SkyMed Stripmap Mode: Himage (HI) and Ping Pong (PP)

The first comparison was carried out between the CSK Himage (HI) and Ping Pong (PP) data (Image 4 and 5 in Table 1), in VV and VV/VH polarization, respectively. In this case, the Sesto test site was observed by COSMO-SkyMed constellation on 15 February 2011, acquiring two images in PP and HI modes, with very similar incidence angle and heading and a difference in the acquisition time of about 48 minutes. No rain events took place between the two acquisitions. Two main types of surfaces have been selected within the area that was common to the two images, agricultural fields and urban areas, and are highlighted in Figure 5. Table 3 shows σ° values averaged over two main selected classes in HI and PP mode: agricultural bare fields (ROI: A, D, H with average dimensions of 200 × 200 m2, corresponding to a number of pixels ranging from 900 to 1,400) and urban areas (ROI: F, G). It can be noted that the difference between PP and HI ranged from 2.44 to 2.85 dB for the agricultural fields and from 0 to 1.78 dB for urban areas.

3.2. COSMO-SkyMed Ping Pong and TerraSAR-X Comparison

A comparison was then carried out between CSK-PP and TSX Stripmap images acquired on the ‘Scrivia’ test site (Image 1 and 2 in Table 1). It should be noted that, for this assessment, it has been possible to obtain images close in time, but not acquired at the same incidence angle. As a first step, selected portion of the image common to the two sensors was selected of about 12 × 19 km2 (Figure 6). The land use of this area is mainly agricultural with some sparse urban areas, forests and water bodies. We observed that σ° values averaged on this common area are around −11.5 dB for CSK-PP and −9.0 dB for TSX, with a difference between the two images higher than 2.5 dB. Since the incidence angle of the two satellites is rather different (CSK 23° and TSX 41°) and σ° should be higher at 23° than at 41°, this result was unexpected. In order to investigate this issue, a field by field analysis was carried out, by extrapolating CSK σ° at 41° for some agricultural bare fields of the selected area. This correction was performed by using the AIEM model [21,22] simulating the backscattering at both 23° and 41° and, consequently, correcting the CSK data. The input parameters of AIEM (i.e., soil moisture and surface roughness) have been derived from ground measurements. In Figure 7, the comparison of σ° of TSX and CSK-PP, corrected for the incidence angle, is shown for bare soils only. The final mean difference between the two images was 4.82 dB for bare soils. This result confirmed that TSX values are usually higher than CSK-PP, at least on bare soil surfaces. It should be noted that this difference could not be attributed to variations in soil moisture or surface roughness or other environment conditions, since the images were very close in time and no rainfall or agricultural practices occurred in between.

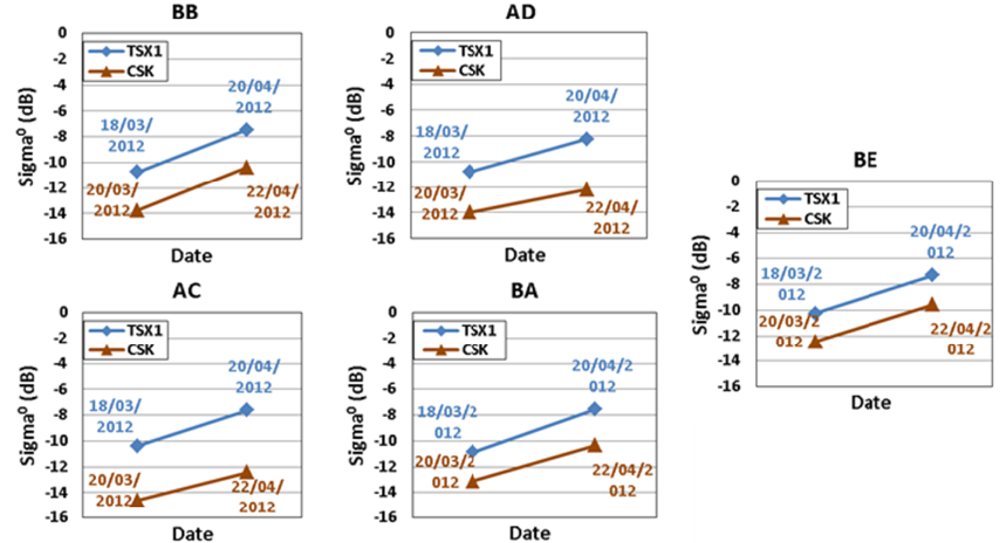
3.3. COSMO-SkyMed and TerraSAR-X Comparison

A further comparison was performed considering the CSK and TSX images acquired in March/April 2012, in agricultural areas (Image 6–9 of Table 1). In this case, two couples of images were acquired at two different dates, with a time delay of two days for each couple. σ° was extracted and averaged for each bare agricultural field, in order to compare it with the ground truth data. As can be noted from Table 1, only the CSK3 data were acquired at an incident angle of 26°, while TerraSAR-X and CSK2 data were acquired at 35°. The AIEM model was also applied to the CSK σ° of 20 March, in order to correct the data for the different incidence angle. Also in this case, the effect of anisotropic soil roughness pattern has been investigated. This consideration is especially important when the CSK3 (20 March), where the heading angle is different from the other selected SAR images.
Figure 8 represents the value of σ° measured with the two satellites over bare soils on the two dates. As a general consideration, we can note that σ° increases with time, coherently with the soil measurements and rainfall data of that period (see Figure 2 and 3), which showed an increase of SMC due to heavy rainfall events. The differences between the CSK-TSX of March and April are reported in Table 4, with a mean difference of about 3 dB. It should be noted that, although a small precipitation event (2.6 mm in total) occurred on March 19 (see Figure 3(a)), with a maximum of precipitation less than 1 mm, the difference between the CSK-TSX data is too large to be explained by this rain event. The observed differences are, in fact, larger than 2 dB, as can be noted from Table 4.

4. Comparison between Observed and Simulated Data of Bare Soils

In order to further investigate the observed differences between the two sensors, an analysis was carried out by using the AIEM model [21,22]. The σ° values have been simulated for bare soils, taking into account the real values of soil moisture and surface roughness measured on the ground. The results of this analysis are shown in Figure 9.
Backscattering measurements of bare fields have been extracted from two couples of images acquired on the Sesto test area in March and April 2012, and compared to the AIEM simulations obtained using the ground measurements of soil moisture and surface roughness as inputs. In the comparison, the CSK3 corrected at 35° data were used. Two types of surfaces have been identified: smooth and arrowed soils, with a standard deviation of the heights (Hstd) of 0.5 cm and 2 cm, respectively. An average value of 8–10 cm has been assumed for the correlation length (Lc). With this parameterization, the model simulations resulted in a good agreement with the TSX acquisitions, as is shown in the diagram of Figure 9. The results obtained for CSK measurements are, instead, rather far from the 1:1 line, and the model seems to be less able to reproduce the actual values. In the case of CSK, the model needs a field by field parameterization of surface roughness to simulate the data, forcing Lc to values outside the range of ground measurements (Lc > 12 cm). A check for the different azimuth angles of the images was also carried out, since one CSK image (20 March 2012) has a different Heading. However, points corresponding to this image are randomly distributed inside the CSK data cluster. Therefore, no significant effect of anisotropic soil roughness pattern, influencing data response to surface roughness, was observed. The obtained regression lines for both TSX and CSK measured and simulated backscattering values are the following:
σ ° sim = 0.90 σ ° meas 1.00 ( R 2 = 0.92 ) TSX
σ ° sim = 0.65 σ ° meas 1.41 ( R 2 = 0.51 ) CSK

5. Conclusions

A cross comparison of CSK and TSX data taken on extended targets has been carried out to exploit the possibility of using combined data from the two sensor systems. For this comparison, several pairs of images from TSX and CSK with similar orbital parameters (in terms of date, time, incidence angle and polarization) have been selected. The comparison was carried out on flat agricultural areas only, in order to reduce the effect of the orography and on bare soils. The performed analysis has shown that CSK and TSX sensors produce different σ° values for the same surface types. More in detail, it has been observed that TSX Stripmap generally shows higher backscattering values than CSK Himage, with a mean difference of 3.15 dB (±0.90 dB). In turn, CSK-HI images show higher σ° (2.4 dB ± 0.02 dB) than the corresponding Ping Pong. It should be noted that CSK Ping Pong values are in some cases close to the noise level, which in general is about −22 dB. Model simulations, carried out by using the AIEM, resulted in good agreement with the TSX acquisitions, whereas the model was less able to reproduce CSK data, which can be simulated by forcing some of the surface roughness parameters beyond the range of ground measurements.
The results obtained from the performed comparisons lead to the following preliminary observations:
  • ▪ The comparison between CSK/TSX presented in Section 3 and 3.3 did not show discrepancies attributed to evident target variations.
  • ▪ The comparison between CSK Himage and Ping Pong, presented in Section 3.1, is considered a very stable target, due to the absence of rainfall events during the acquisitions and the presence of similar orbital parameters.
  • ▪ The comparison between CSK-PP and TSX, presented in Section 3.2 (after that the necessary corrections for the different incidence angles have been applied), showed differences between the two sensors on bare soils that cannot be due to the observed target.
  • ▪ The most anomalous data seem to correspond to CSK-PP images, which showed very low values of about 4 dB compared to TSX data.
  • ▪ From the analysis of ground-truth data, they did not present features able to justify the differences in the measured σ°.
  • ▪ As a general consideration, we can suppose that the observed discrepancies can be attributed to different calibration procedures and calibration coefficients applied to the raw data of the various sensors.
We know that the relatively small SAR dataset used for this comparison, which is due to the extreme difficulty in obtaining simultaneous acquisitions (with similar orbital parameters) of the two satellites, hampers the generalization of the results. A higher number of images on different land types would therefore be necessary for achieving more universal results on a wider dynamic range of backscattering. Nevertheless, we find the obtained results to be a significant and useful guide to those who plan to combine X-band data from the two satellite systems for land applications. Taking into account TSX data as a reference, on bare soils, CSK data can be therefore corrected according to the differences found in this analysis (i.e., by adding about 4 dB in PP mode and about 2.5 dB in HI mode). This is maybe a little too simplistic of a procedure, but the possibility of combining TSX and CSK data in order to shorten the revisit time of X-band SAR images is very important in various applications, such as disaster management.

Acknowledgments

This research was supported by the Italian Space Agency (ASI) through the Hydro-COSMO 1720 project. ASI also provided the COSMO-SkyMed X-band SAR images necessary for the analysis. TerraSAR-X images were obtained through the CAL179.
  • Conflict of InterestThe authors declare no conflict of interest.

References

  1. Covello, F.; Battazza, F.; Coletta, A.; Manoni, G.; Valentini, G. COSMO-SkyMed Mission Status: Three Out of Four Satellites in Orbit. Proceedings of Geoscience and Remote Sensing Symposium, Cape Town, South Africa, 12–17 July 2009; pp. 773–776.
  2. Werninghaus, R.; Buckreuss, S. The TerraSAR-X mission and system design. IEEE Trans. Geosci. Remote Sens 2009, 39, 873–884. [Google Scholar]
  3. Covello, F.; Battazza, F.; Coletta, A.; Lopinto, E.; Fiorentino, C.; Pietranera, L.; Valentini, G.; Zoffoli, G. COSMO-SkyMed an existing opportunity for observing the Earth. J. Geodyn 2010, 49, 171–180. [Google Scholar]
  4. Macelloni, G.; Paloscia, S.; Pampaloni, P.; Sigismondi, S.; De Matthaeis, P.; Ferrazzoli, P.; Schiavon, G.; Solimini, D. The SIR-C/X-SAR experiment on montespertoli: Sensitivity to hydrological parameters. Int. J. Remote Sens 2009, 20, 2597–2612. [Google Scholar]
  5. Ranson, K.J.; Saatchi, S.; Sun, G. Boreal forest ecosystem characterization with SIR-C/XSAR. IEEE Trans. Geosci. Remote Sens 1995, 33, 867–876. [Google Scholar]
  6. Stolz, R.; Mauser, W. First Evaluations of Shuttle SIR-C and X-SAR Data for Landcover Classifications. Proceedings of the IEEE International Geoscience and Remote Sensing Symposium, Firenze, Italy, 10–14 July 1995; pp. 1058–1060.
  7. Pettinato, S.; Santi, E; Brogioni, M.; Paloscia, S.; Palchetti, E.; Xiong, C. The potential of COSMO-SkyMed SAR images in monitoring snow cover characteristics. IEEE Geosci. Remote Sens. Lett 2013, 10, 9–13. [Google Scholar]
  8. Santi, E.; Pettinato, S.; Paloscia, S.; Brogioni, M.; Fontanelli, G; Pampaloni, P.; Macelloni, G.; Montomoli, G. The Potential of Multi-Temporal COSMO-SkyMed SAR Images in Monitoring Soil and Vegetation. Procedding of IEEE International Geoscience and Remote Sensing Symposium (IGARSS), Vancouver, BC, Canada, 24–29 July 2011; pp. 1532–1535.
  9. Balenzano, A.; Satalino, G.; Belmonte, A.; D’Urso, G.; Capodici, F.; Iacobellis, V.; Gioia, A.; Rinaldi, M.; Ruggieri, S.; Mattia, F. On the Use of Multi-Temporal Series of COSMO-SkyMed Data for LANDcover Classification and Surface Parameter Retrieval over Agricultural Sites. Proceedings of IEEE International Geoscience and Remote Sensing Symposium, Vancouver, BC, Canada, 24–29 July 2011; pp. 142–145.
  10. Kweon, S.K.; Hwang, J.H.; Oh, Y. COSMO SkyMed AO Projects-soil Moisture Detection for Vegetation Fields Based on a Modified Water-cloud Model Using COSMO-SkyMed SAR Data. Proceedings of the IEEE International Geoscience and Remote Sensing Symposium (IGARSS), Munich, Germany, 22–27 July 2012; pp. 1204–1207.
  11. Santi, E.; Fontanelli, G.; Montomoli, G.; Brogioni, M.; Macelloni, G.; Paloscia, S.; Pettinato, S.; Pampaloni, S. The Retrieval and Monitoring of Vegetation Parameters from COSMO-SkyMed Images. Proceedings of the IEEE International Geoscience and Remote Sensing Symposium (IGARSS), Munich, Germany, 22–27 2012; pp. 7031–7034.
  12. Satalino, G.; Panciera, R.; Balenzano, A.; Mattia, F.; Walker, J. COSMO-SkyMed Multi-temporal data for Land Cover Classification and Soil Moisture Retrieval over an Agricultural Site in Southern Australia. Proceedings of the IEEE International Geoscience and Remote Sensing Symposium (IGARSS), Munich, Germany, 22–27 July 2012; pp. 5701–5704.
  13. Baghdadi, N.; Zribi, M.; Loumagne, C.; Ansart, P.; Paris Anguela, T. Analysis of TerraSAR-X data and their sensitivity to soil surface parameters over bare agricultural fields. Remote Sens. Environ 2008, 112, 4370–4379. [Google Scholar]
  14. Paris Anguela, T.; Zribi, M.; Baghdadi, N.; Loumagne, C. Analysis of local variation of soil surface parameters with TerraSAR-X radar data over bare agricultural fields. IEEE Trans. Geosci. Remote Sens 2010, 48, 874–881. [Google Scholar]
  15. Fallourd, R.; Harant, O.; Trouve, E.; Nicolas, J.M.; Gay, M.; Walpersdorf, A.; Mugnier, J.L.; Serafini, J.; Rosu, D.; Bombrun, L.; et al. Monitoring temperate glacier displacement by multi-temporal TerraSAR-X images and continuous GPS measurements. IEEE J. Sel. Top. Appl. Earth Obs. Remote Sens 2011, 4, 372–386. [Google Scholar]
  16. Poulain, V.; Inglada, J.; Spigai, M.; Tourneret, J.Y.; Marthon, P. Fusion of High Resolution Optical and SAR Images with Vector Data Bases for Change Detection. Proceedings of IEEE International Geoscience and Remote Sensing Symposium (IGARSS’09), Cape Town, South Africa, 8–11 July 2009; pp. 956–959.
  17. Sportouche, H.; Tupin, F.; Nicolas, J.M.; Perciano, T.; Deledalle, C.A. How to Combine TerraSAR-X and COSMO-SkyMed High-Resolution Images for a Better Scene Understanding? Proceeding of IEEE Geoscience and Remote Sensing Symposium (IGARSS), Munich, Germany, 22–27 July 2012; pp. 178–181.
  18. Liao, M.; Balz, T.; Zhang, L.; Pei, Y.; Jiang, H. Analyzing TerraSAR-X and COSMO-SkyMed High-Resolution SAR Data of Urban Areas. Proceedings of the ISPRS Workshop on HR Earth Imaging for Geospatial Information, Hannover, Germany, 2–5 June 2009.
  19. Chini, M.; Pulvirenti, L; Pierdicca, N. Analysis and interpretation of the COSMO-SkyMed observations of the 2011 Japan tsunami. IEEE Geosci. Remote Sens. Lett 2012, 9, 467–471. [Google Scholar]
  20. Pulvirenti, L.; Pierdicca, N.; Chini, M.; Guerriero, L. Monitoring flood evolution in agricultural areas using COSMO-SkyMed data: the Tuscany 2009 case study. IEEE J. Sel.Top. Appl. Earth Obs. Remote Sens 2013, in press.. [Google Scholar]
  21. Fung, A.K. Microwave Scattering and Emission Models and Their Applications; Artech House: Norwood, MA, USA, 1994. [Google Scholar]
  22. Wu, T.D.; Chen, K.S. A reappraisal of the validity of the IEM model for backscattering from rough surfaces. IEEE Trans. Geosci. Remote Sens 2004, 42, 743–753. [Google Scholar]
  23. Paloscia, S.; Pampaloni, P.; Pettinato, S.; Santi, E. A Comparison of algorithms for retrieving soil moisture from Envisat/ASAR images. IEEE Trans. Geosci. Remote Sens 2008, 46, 3274–3284. [Google Scholar]
  24. Radiometric Calibration of TerraSAR-X Data. 2008. Available online: http://www2.astrium-geo.com/files/pmedia/public/r465_9_tsxx-itd-tn-0049-radiometric_calculations_i1.00.pdf (accessed on 30 May 2013).
  25. Torre, A.; Calabrese, D.; Porfilio, M. COSMO-SkyMed: Image Quality Achievements, Recent Advances in Space Technologies (RAST). Proceedings of the 5th International Conference on Digital Object Identifier, Istanbul, Turkey, 6–8 June 2011; pp. 861–864.
  26. Discussion for Those Using Improving GDAL (Geospatial Data Abstraction Library). Available online: http://www.e-geos.it/products/pdf/COSMO-SkyMed-Image_Calibration.pdf (accessed on 30 May 2013).
Figure 1. The geographic location of the two agricultural test sites.
Remotesensing 05 02928f1
Figure 2. The soil moisture content (SMC) measured in the agricultural fields at the two dates in the Sesto area: 16 March and 17 April 17 2012.
Remotesensing 05 02928f2
Figure 3. (a) Daily rainfall data and (b) daily air temperature measured in the period of March–April 2012, in the Sesto area (courtesy of Consorzio LAMMA).
Remotesensing 05 02928f3aRemotesensing 05 02928f3b
Figure 4. Histogram of σ° from COSMO-SkyMed (CSK) and TerraSAR-X (TSX) satellites over a forest area.
Remotesensing 05 02928f4
Figure 5. Sesto area image with the selected targets (Courtesy of ASI, © ASI 2012). Note: A, D, H are agricultural fields; F, G are urban areas (B, C, E are water bodies).
Remotesensing 05 02928f5
Figure 6. The common area for the two satellites in the Scrivia test site (12 km × 19 km).
Remotesensing 05 02928f6
Figure 7. The σ° extracted from some bare agricultural soils of the Scrivia test area. Blue lines refer to TSX data and red lines to CSK data. Numbers correspond to the investigated agricultural fields.
Remotesensing 05 02928f7
Figure 8. Temporal trends of σ° data measured from CSK (triangles) and TSX (rhombs) on bare soils of the Sesto area. Values of CSK on March 20 have been corrected for the incidence angle by using the Advanced Integral Equation Model (AIEM).
Remotesensing 05 02928f8
Figure 9. σ° measured and simulated with AIEM for both CSK (triangles) and TSX (rhombs) data of bare soils.
Remotesensing 05 02928f9
Table 1. List of the SAR images acquired on the two test areas and used for the comparison. Inc. Ang., incidence angle; Pol., polarization; deg., degrees; Asc, ascending; Desc, descending.
NrSensorModeOrbitDateHour (UTC)Inc. Ang. (deg.)Heading (deg.)Pol.Test Site
1CSK2Ping PongAsc12/05/201005:09:0323°189.91HH/HVScrivia
2TSX1StripmapAsc13/05/201017:16:2341°348.45HHScrivia
3CSK3HimageAsc14/02/201104:59:2430°349.03HHSesto
4CSK2Ping PongDesc15/02/201117:21:2738°189.91VV/VHSesto
5CSK1HimageDesc15/02/201118:09:2841°197.82VVSesto
6CSK3HimageAsc20/03/201204:55:3626°348.91HHSesto
7CSK2HimageDesc22/04/201217:17:2335°189.94HHSesto
8TSX1StripmapDesc18/03/201205:27:4335°190.3HHSesto
9TSX1StripmapDesc20/04/201205:27:4435°190.3HHSesto
Table 2. Mean and SD of backscattering values collected from CSK and TSX in different configurations over a forest plot in Sesto area.
DateSatellite ConfigurationMean (dB)SD (dB)
02/14/2011CSK3 HI HH−8.352.23
02/15/2011CSK2 PP VV−13.173.41
02/15/2011CSK1 HI VV−10.242.17
03/20/2012CSK3 HI HH−8.942.21
04/22/2012CSK2 HI HH−9.371.93
03/18/2012TSX SM HH−8.612.37
04/20/2012TSX SM HH−8.112.41
Table 3. σ° values, averaged for each selected target (agricultural fields and urban areas) for both Himage (HI) and Ping Pong (PP) CSK images (in VV and VV/VH polarization, respectively) acquired on 15 February 2011.
HI [dB]PP [dB]Difference [dB]SurfaceROI
−0.11−12.962.85Agricultural areaA
−11.57−14.062.49Agricultural areaD
−9.01−11.442.44Agricultural areaH
9.7612.192.43Agricultural areaAverage values
−3.4−3.380.02Urban areaF
−2.2−3.991.78Urban areaG
Table 4. The σ° differences between each CSK-TSX couple observed on five bare soils on the two dates (the names BB, BE, BA, AC, AD refer to the label of each investigated field).
DatesBBBEBAACADMean
Δσ° March [dB]3.002.182.244.203.192.96
Δσ° April [dB]2.932.262.794.823.963.35

