1. Introduction
Industrialization, rapid urbanization and military activities in particular geographic locations are sources of soil pollution with toxic metals in many parts of the world [
1,
2,
3,
4,
5,
6]. In urban and industrial areas, human exposure to enormous amounts of toxic metals, especially arsenic (As), chromium (Cr), nickel (Ni), copper (Cu), lead (Pb) and zinc (Zn), causes serious health disorders, including disruption of the nervous and digestive systems (e.g., acne, allergies, anemia, anorexia, arthritis, sciatica, schizophrenia), the normal functioning of internal organs (e.g., lungs, kidneys, liver), damage to the circulatory system (e.g., asthma and chronic bronchitis) and the blood composition and many other unfavorable consequences [
7,
8,
9,
10,
11].
This situation is particularly true in the case of Qatar where the population has increased from about 0.74–1.7 million from 2000 to 2010. Such a rapid increase has been associated with the erection of residential buildings in the urban coastal area of the capital (Doha City), where around 85% of the Qatari and non-Qatari citizens reside [
12,
13]. For the last two decades, Qatar has had the highest per-capita carbon dioxide emissions in the world, at 49.1 metric tons per person in 2008 [
14]. In 2014, the World Health Organization ranked Qatar as the second most polluted (air pollution) country in the world.
For human and ecological risk assessment, the prediction of toxic metals accumulation in soils has been determined using a variety of geostatistical methods and environmental data at various scales [
15,
16,
17,
18,
19,
20,
21,
22]. Lado et al. [
16] used regression-kriging with a large number of auxiliary variables (1-km resolution) as predictors (e.g., land cover, geology, night-lights images) to model and map the distribution of eight toxic metals (As, Cd, Cr, Cu, Hg, Ni, Pb, Zn) for the topsoil in Europe. The cross-validation results showed that the overall accuracy of these maps was relatively low. They also provided two possible explanations for the low accuracy: (1) regression-kriging and ordinary kriging are not capable of dealing with many hotspots (sporadic high values); and (2) a relatively coarse resolution of the predictors is a limitation to mapping accuracy. Xie et al. [
23] applied four different interpolation methods (inverse distance weighting, local polynomial, ordinary kriging and radial basis functions) to map the spatial distribution of three toxic metals (Cd, Cu, Pb) in soil in a small area (605 km
2) in Beijing. The results showed that all of the interpolation methods provided a high accuracy based on cross-validation. However, compared to traditional interpolation techniques, such as kriging or inverse distance weighting, recent studies have been using data-mining tools, e.g., Cubist (
www.rulequest.com), in modeling soil and environmental properties and processes [
24]. One of the several advantages of Cubist is that it is able to quantify linear, as well as non-linear relationships among variables and quantifies the importance of environmental variables used in prediction.
In the last ten years, the potential of using remote sensing (RS) techniques (aerial or satellite data) for mapping toxic metals in soils has received more attention. Melendez-Pastor et al. [
25] comprehensively reviewed the role of RS in soil toxic metals’ detection and found it to be an efficient tool for detecting sources of toxic metals’ contamination in soils. This is despite the fact that toxic metals in soils appear in low or moderate concentrations (e.g., Cr and Cu <4000 mg·kg
−1) and are spectrally featureless, although they can easily bind to minerals and organic matter [
26,
27,
28]. Especially the reflectance spectral information of minerals in soils plays an important role in predicting toxic metals because the spectral assignments’ position of minerals can change with their chemical composition and surface activity [
27,
29,
30,
31,
32]. This indirect mechanism allows the relationships between spectral information and soil toxic metals to be deduced since the information of Fe-oxides, clays and organic matter in soils or vegetation cover can be extracted from the RS spectra [
33,
34,
35]. Therefore, RS technology is able to map the spatial distribution of toxic metals in soils. In Spain, Kemper T. and Sommer S. [
36] successfully mapped residual toxic metals in soils after a mining accident using airborne hyperspectral data. The images were collected by a HyMap sensor in 128 wavebands over the range 403–2480 nm with a spectral resolution of 13–17 nm. When Choe et al. [
32] derived parameters from ground spectra associated with toxic metals in soils, the results showed significant correlations between Pb, Zn, Cu and As and different spectral absorption features (e.g., peak depth, area, asymmetry and band ratio). Afterwards, they applied these parameters to hyperspectral images (HyMAP data) to map an area affected by toxic metals. The different gradient maps of spectral parameters showed similar spatial patterns to different, kriged soil toxic metals’ concentration maps. Using multi-temporal observation from satellite images to map the large-scale spatial distribution of toxic metals in soils has, to our knowledge, never been tested on arid zones. Thus, the novelty of this work is using advanced data mining tools combined with multi-temporal satellite images for digital soil mapping in a desert zone and finding the seasonal dependency of multi-temporal satellite images on soil toxic metals’ determination.
In this context, the objective of the study was to facilitate the mapping of the toxic metal accumulation on a large scale and to demonstrate the toxic metals’ contamination of many years of mining and industrialization in Qatar. More specifically, the aim of this study was to use as predictors the multi-temporal images of a Landsat 8 sensor (covering a span of nine months), selected spectral indices derived from the Landsat images and environmental variables to map the spatial distribution of six chosen toxic metals (As, Cr, Ni, Pb, Cu, Zn) in Qatar. As the potential public health risk is probably associated with the intake of these six elements, we focused our study on them. Our assumption for this approach was that spatial modelling with multi-spectral images integrated with other data sources (geopedological, geomorphology anthropogenic information) could provide important information on toxic metals’ accumulation in soils.
3. Results and Discussion
3.1. General Statistics of Toxic Metals Data
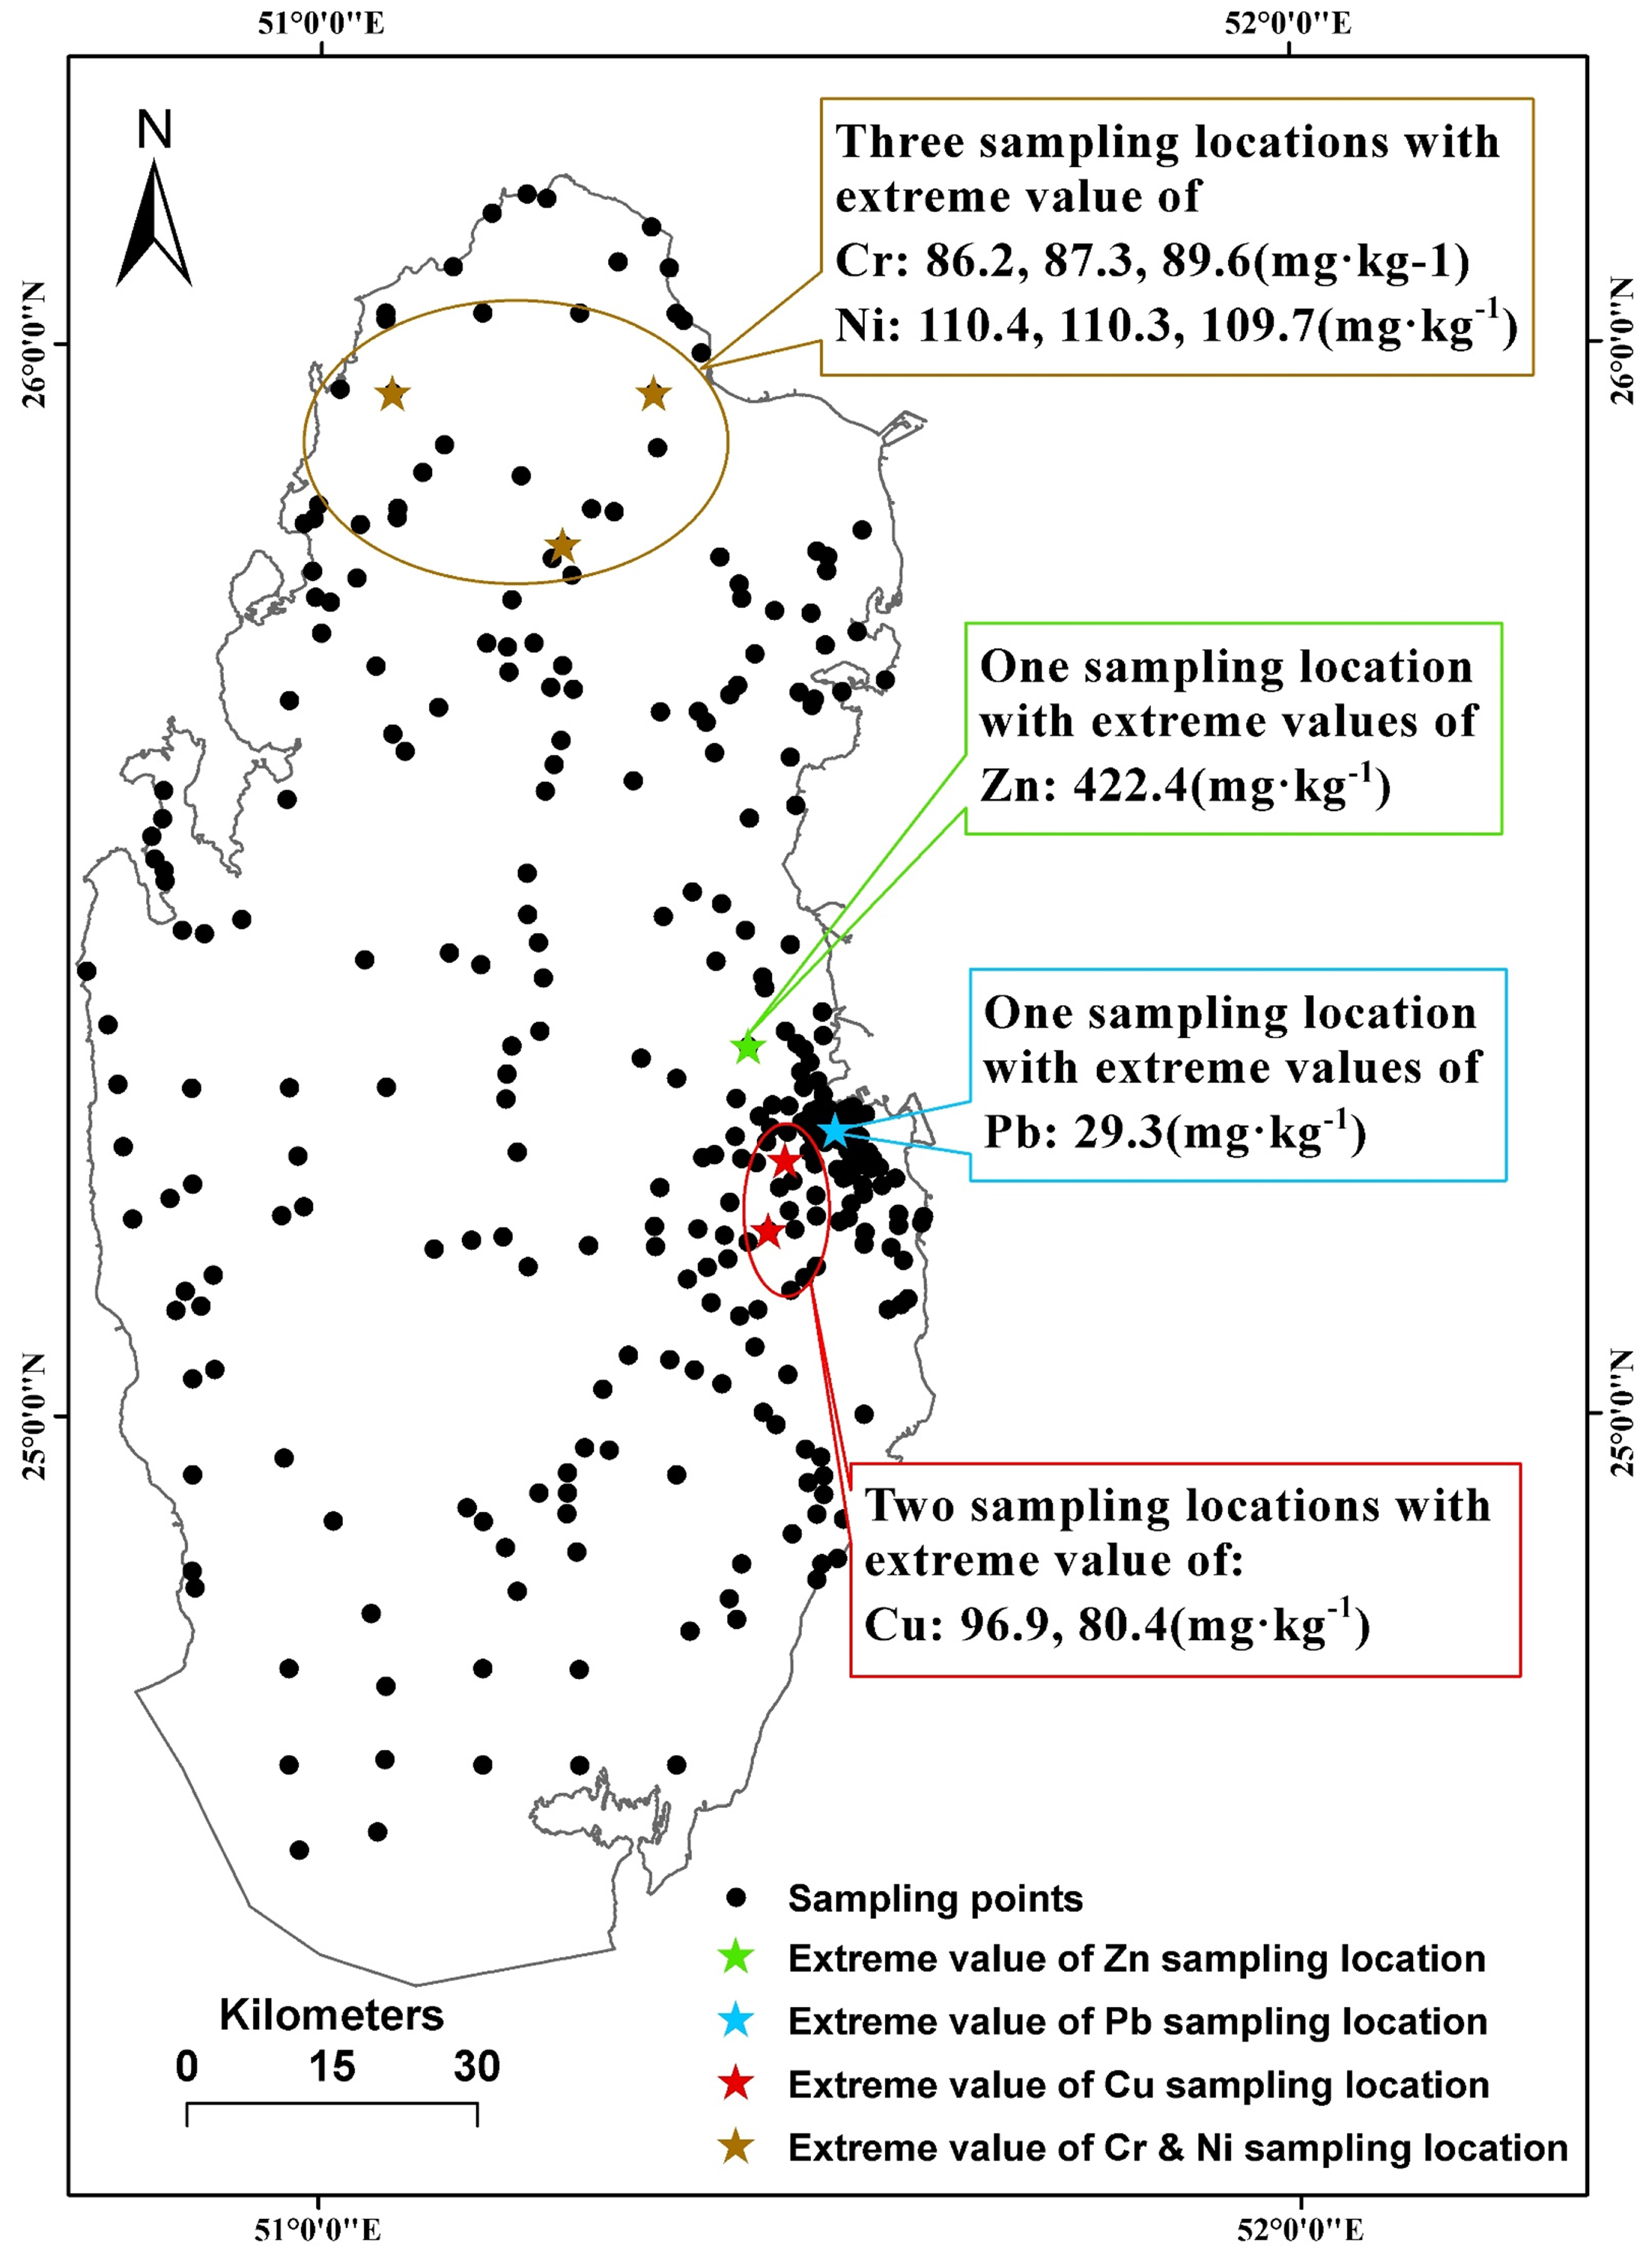
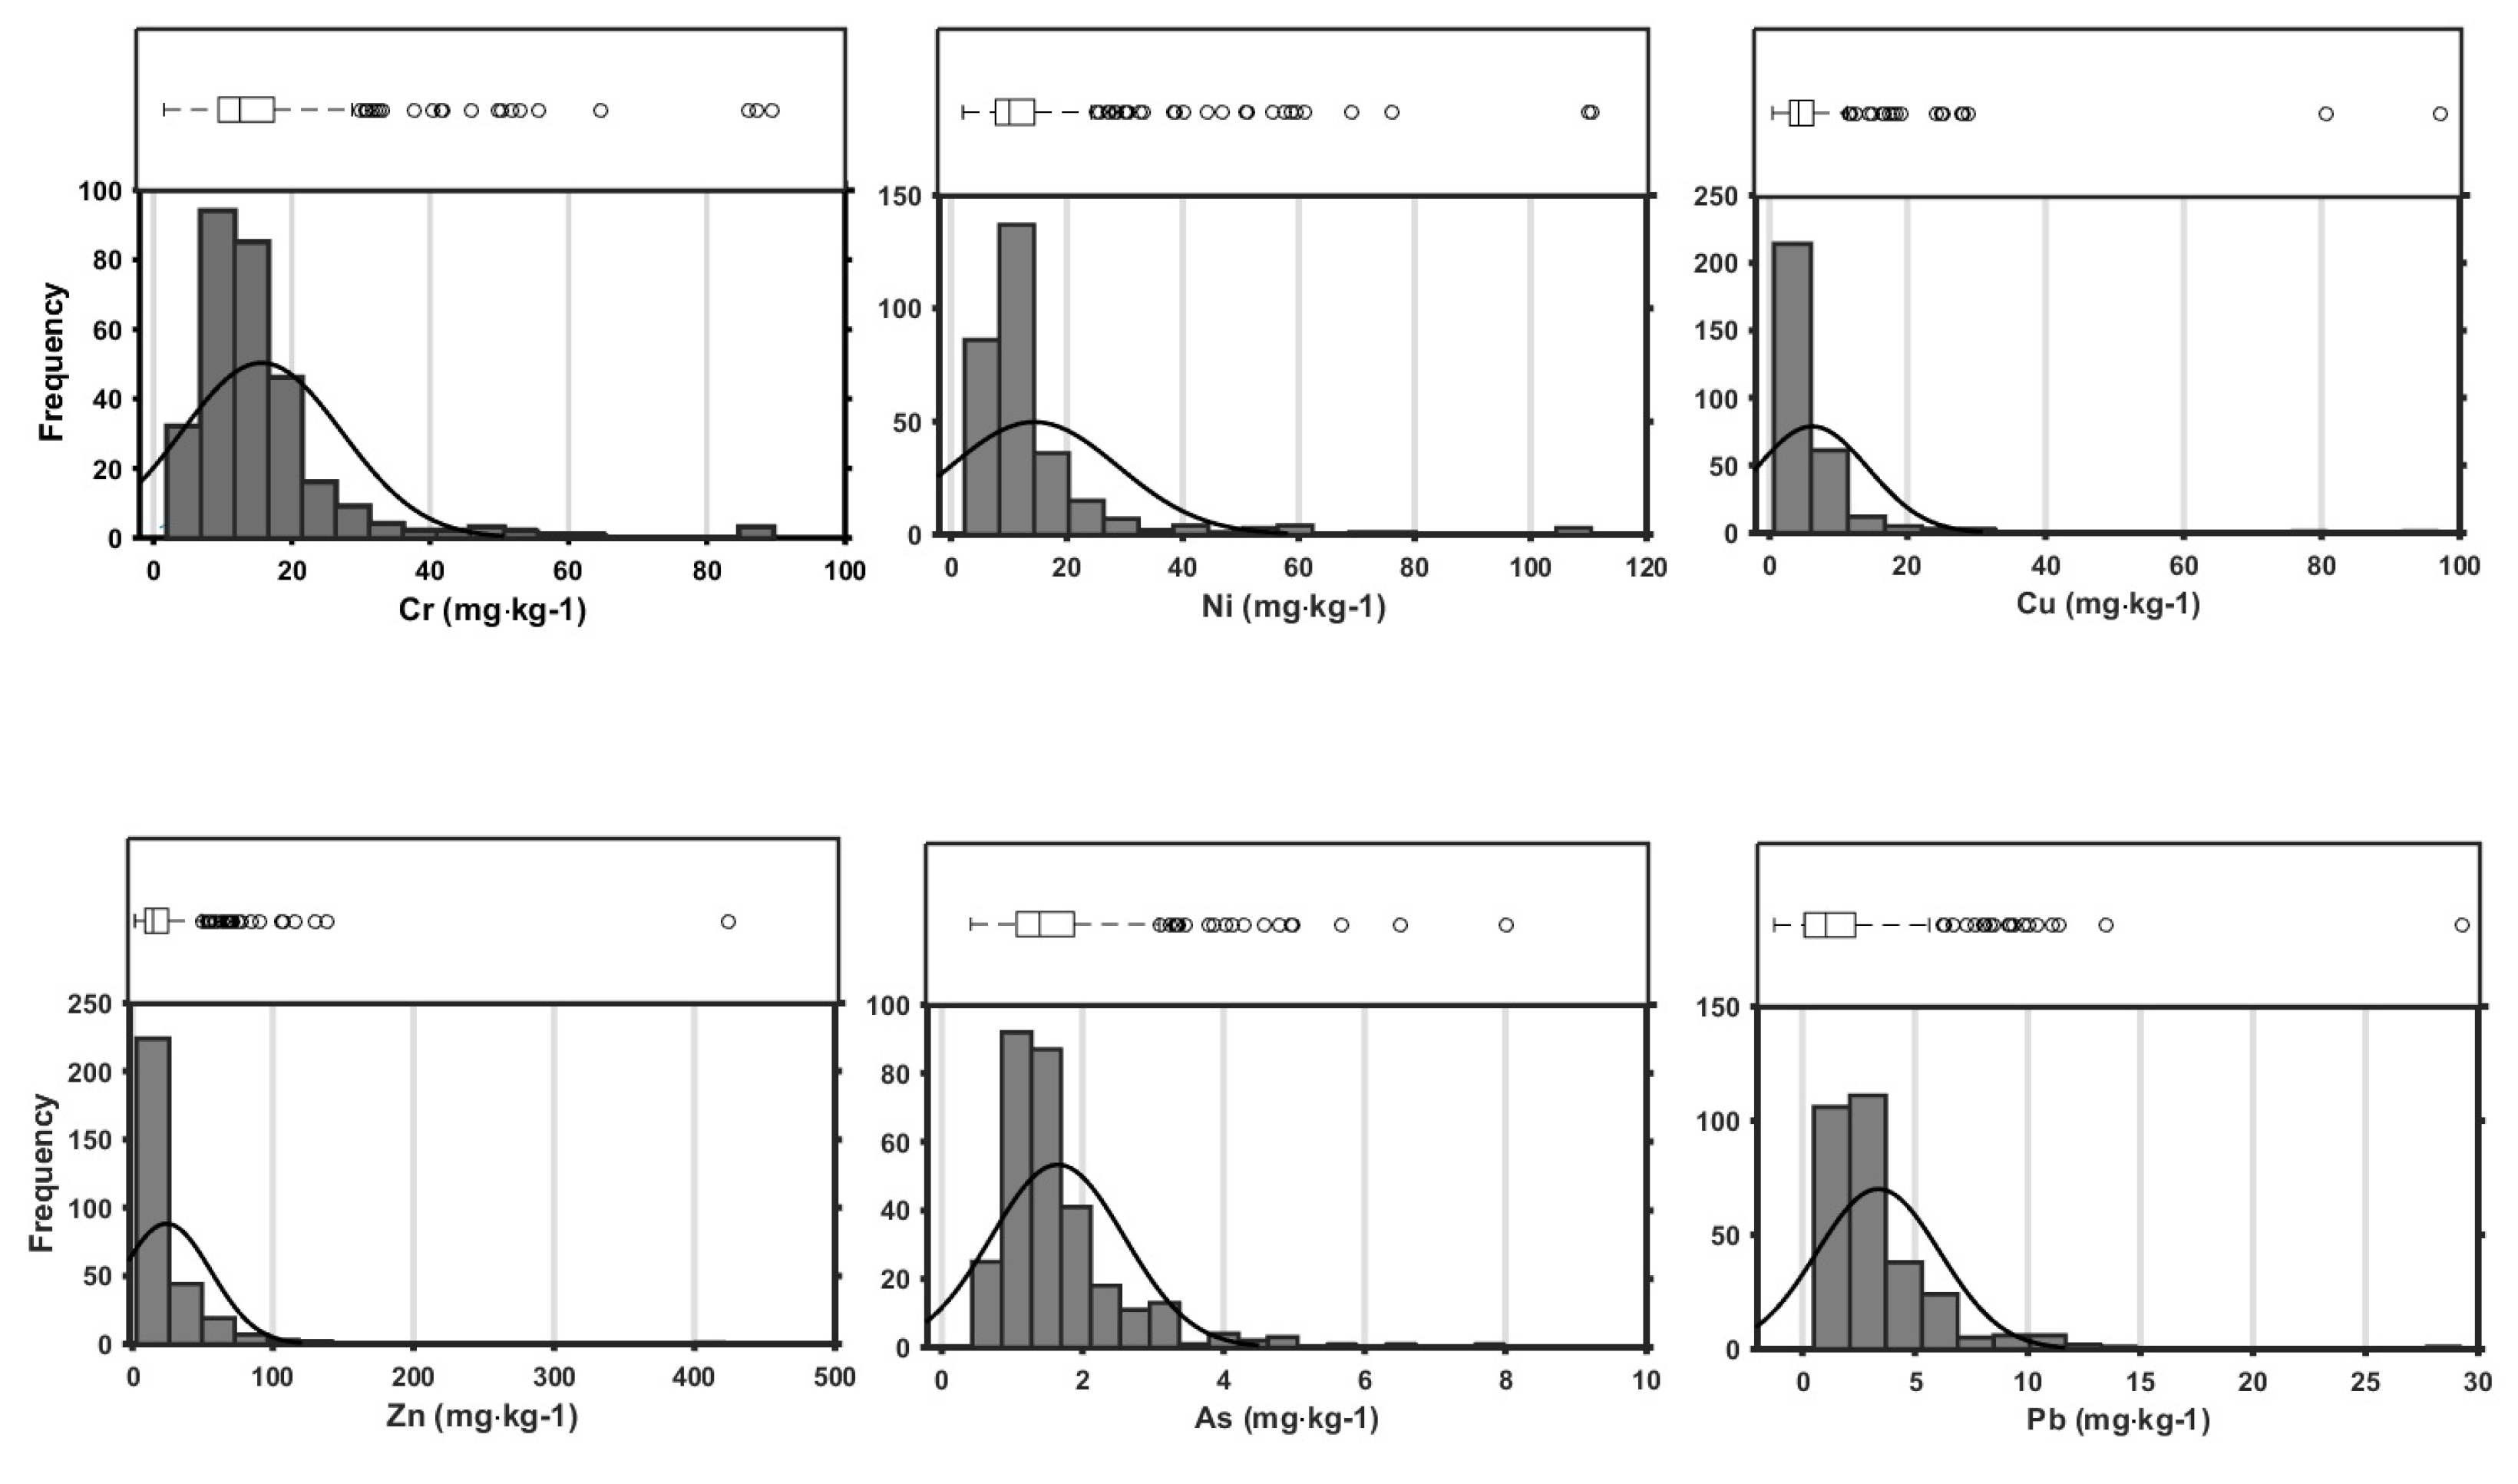
A histogram and a box-plot of the elements (
Figure 3) showed that the distribution of the elements is positively skewed in all cases. A wide range of variation was observed for all of the targeting elements, especially a large variation of the Zn, Cr and Ni was observed. Some of the soil samples from a few locations had extremely high values of different metals (e.g., Cr > 86 mg·kg
−1, Ni > 109 mg·kg
−1, Zn > 422 mg·kg
−1, Pb > 29 mg·kg
−1 and Cu > 80 mg·kg
−1). The geographical locations of those samples are shown in
Figure 1. These extreme values as outliers and these sampling points most likely represent hotspots. We decided to exclude those samples because the extreme values or the local hotspots might influence the prediction based on the regression modeling [
16].
The significant variability in toxic metal content is related to the different intensity levels of agriculture, urbanization and industrialization in the different areas of Qatar. Hotspots of Pb, Zn and Cu were, for example, found around the Doha City area (
Figure 1), indicating that the soil contamination of these three elements was most likely affected by human activities [
16,
62,
63,
64]. Hotspots of Cr and Ni soils were found in the same three locations, and all located in the northern part of Qatar (
Figure 1), where the parent material is partly silty alluvium and land use is dominated by irrigated agriculture. This suggests that the Cr and Ni elements in soils can be linked to various processes of soil formation, including human interference [
16,
62,
63,
64]. This variability in distribution affects the development of correlations between environmental parameters (natural and anthropogenic) and toxic metal pollution.
General statistics for calibration and validation sample sets are shown in
Table 3. After excluding the extreme values for each element, we had 299 samples for Zn, 298 samples for Cu, 297 samples for Cr and Ni, 299 samples for Pb and 300 samples for As for modeling. Ranges in contents (mg·kg
−1) were: As from 0.44 to 7.99, Cr from 1.91 to 64.93, Zn from 2.89 to 130.9, Cu from 0.65 to 28.85, Ni from 0.44 to 7.99 and Pb from 0.5 to 14.1 mg·kg
−1 (
Table 3).
Table 4 shows the Pearson correlation coefficients between different toxic metals in Qatari soils. A significant correlation was found between Cr and Ni (r = 0.95), Cr and As (r = 0.73) and Ni and As (r = 0.71). The results showed that these three elements can be grouped together and that soil contamination of these three elements in Qatar might have similar levels and sources.
3.2. Spatial Calibration and Validation
For the calibration, the Cubist model produces many linear equations for the target element based on different rules. To set the initial rule conditions for modeling Cr and Ni, for example, over 60% of the models selected soil type and geology map. For linear equation building, it is not necessary to include all of the predictors for each linear equation. Here, we show an example of the rule used for Ni predictions in the model:
Rule 1: (126 cases, mean 11.4, range 3.0–33.4, estimation error 3.9)
If:
Soil type in (1, 2, 3, 5) (the numbers indicate different soil types in Qatar)
Jan_Band2 ≤ 0.1645
Then:
Ni = 6.8 − 13,238 × wetness (Jan) − 10,271 × Band 6 (Jan) − 7254 × Band 7 (Jan) + 8651 × BCI (Jan) − 2203 × Band 4 (Jan) + 929 × Band 5 (Jan) + 1305 × Band 2 (Jan) − 379 × Band 4 (Feb) − 255 × Wetness (Feb) + 371 × Band 3 (Feb).
The results of the spatial prediction of the different toxic metals in Qatari soils are shown in
Table 5. In general, all calibration models showed good predictive capabilities for the metals based on RMSE, R
2, RPD and RPIQ. Of all of the prediction results, Cu had the highest R
2 and RPD values (0.74 and 1.88, respectively), followed by As > Pb > Cr > Zn > Ni. In this work, Pb and Ni gave the lowest RPD values at 1.37 and 1.36, respectively. However, their RPIQ values of, respectively, 1.1 and 1.0 were higher than for Zn (0.8). This was mainly because the calculation of the RPIQ value relies on a skewed data distribution [
60]. Since all datasets in this study presented a highly skewed distribution, the RPIQ value reflected much more prediction accuracy information than the RPD value described.
Compared with previous studies, our models showed better predictive ability. Our study area was much smaller, and the resolution of all of our environmental predictors, including RS images, was finer (30 m) than in the European soil toxic metals maps (1-km resolution) made by Lado et al. [
16]. This means that our models were carried out with much more accurate input data in terms of image spatial resolution. On the other hand, the climate environmental conditions between Qatar and Europe are completely different: Qatar is a desert zone; the soil parent material is also not as diverse as European soils. Therefore, the use of predictors for spatial modelling in both study areas could be different, making a comparison of modeling toxic metals in Europe and Qatar not straightforward. The variation in the European soil toxic metals database is also much higher than in the Qatar database. For example, in the European database, the median values of Zn, Cu, Cr, Pb, Ni and As were 52, 14, 22, 16, 16 and 6 mg·kg
−1, respectively, but the median values of the same elements in the Qatari database were 16, 4, 13, 2, 10 and 1 mg·kg
−1. The median value of As in the European database was almost five-times larger than in the Qatari database. In this situation, an empirical modeling approach would perform better within a less variable dataset than in a large dataset, like the European database. In the present study, very few samples of extreme values were excluded from modelling since we could not find any hard evidence to prove that these sampling sites were heavily contaminated by any heavy metals. We considered that these samples with extreme values were due to sampling errors.
Kemper T. and Sommer S. [
36] validated Pb and As concentrations in soils after a mining accident in Spain using HyMap data in an area measuring a few thousand hectares. Their validation results showed a stronger coefficient for Pb (R
2 = 0.85) and As (R
2 = 0.73) than in our results because of their study area’s very high contamination with these two elements. Therefore, the hyperspectral image was able to catch the spectral feature of the toxic metals in the soil directly from the soils. Furthermore, HyMap data provide 128 wavebands over the 403–2480-nm range with a spectral resolution of 13–17 nm and a 5-m spatial resolution, which have improved the accuracy of input data for their modeling.
3.3. Variable Importance of Cubist Models for Predicting Different Elements
From the Cubist model output (usage of each variable) for the target elements, we can see that the models did not use all of the variables for calibration. For example, only RS data from January and February were chosen for all of the target elements modeled.
Table 6 shows the top 10 predictors selected by the Cubist models for various toxic metals and their attribute usage ranking. In general, most of the reflectance spectral bands from January provided very high attribute usage for all of the models. Some of the spectral indices from January and February also provided high attribute usage for different elements, such as tasseled cap transformation and BCI. Furthermore, some of the geopedological, geomorphology and anthropogenic parameters were selected as important variables. For example, distance to geological structures contributed 25% of the usage for modeling Cr; the importance of distance to the drainage line for modeling Ni ranked as number 10; for the modeling of Pb, 46% and 56% of the linear models selected proximity to road and night light image as the predictor, respectively.
From the relative importance of the predictors, we can see that Cr and Ni were highly affected by geopedological factors. Three geopedological predictors were included in the top 10 predictors for the modeling of these two elements, and two geopedological factors (soil type and geology) were selected as the most frequent rule-setting predictors for modeling Cr and Ni. On the other hand, for modeling Zn, Pb and Cu, anthropogenic parameters, such as proximity to road, night light image and distance to environmental hotspots, were of high relative importance. For example, in the Pb modelling process, the predictor “proximity of roads” showed a 42% relative importance value; this means that this variable matched almost half of the Cubist models. Besides RS data, “proximity of roads” was the second most contributed ancillary data after “night light image”. This indicates that soil toxic metals’ contamination with these three elements is highly affected by human activities. These results are much in line with previous studies [
16,
62,
63,
64].
3.4. Seasonal Dependency on Soil Toxic Metals’ Determination
This study found that of all of the RS images from eight different months, only images from January and February were selected in the modeling of each target element. To our knowledge, this study is the first that used RS data covering all of the seasons during a year to spatially model soil toxic metals’ concentrations. The parent material in Qatar soils is dominated by dolomite and limestone and normally has very low organic matter, clay and iron contents [
38], and the toxic metals’ concentrations in Qatar soils are generally low. Therefore, it would be difficult to capture spectral features of toxic metals directly from the soils, even though most of the soil in Qatar is bare [
26,
27,
29,
32,
36,
65].
We suggest two possible explanations of why winter images were very important for the determination of soil toxic metals’ accumulation in Qatari soils. Both explanations are mainly based on the fact that RS images indirectly obtain soil toxic metals’ information from the vegetation cover.
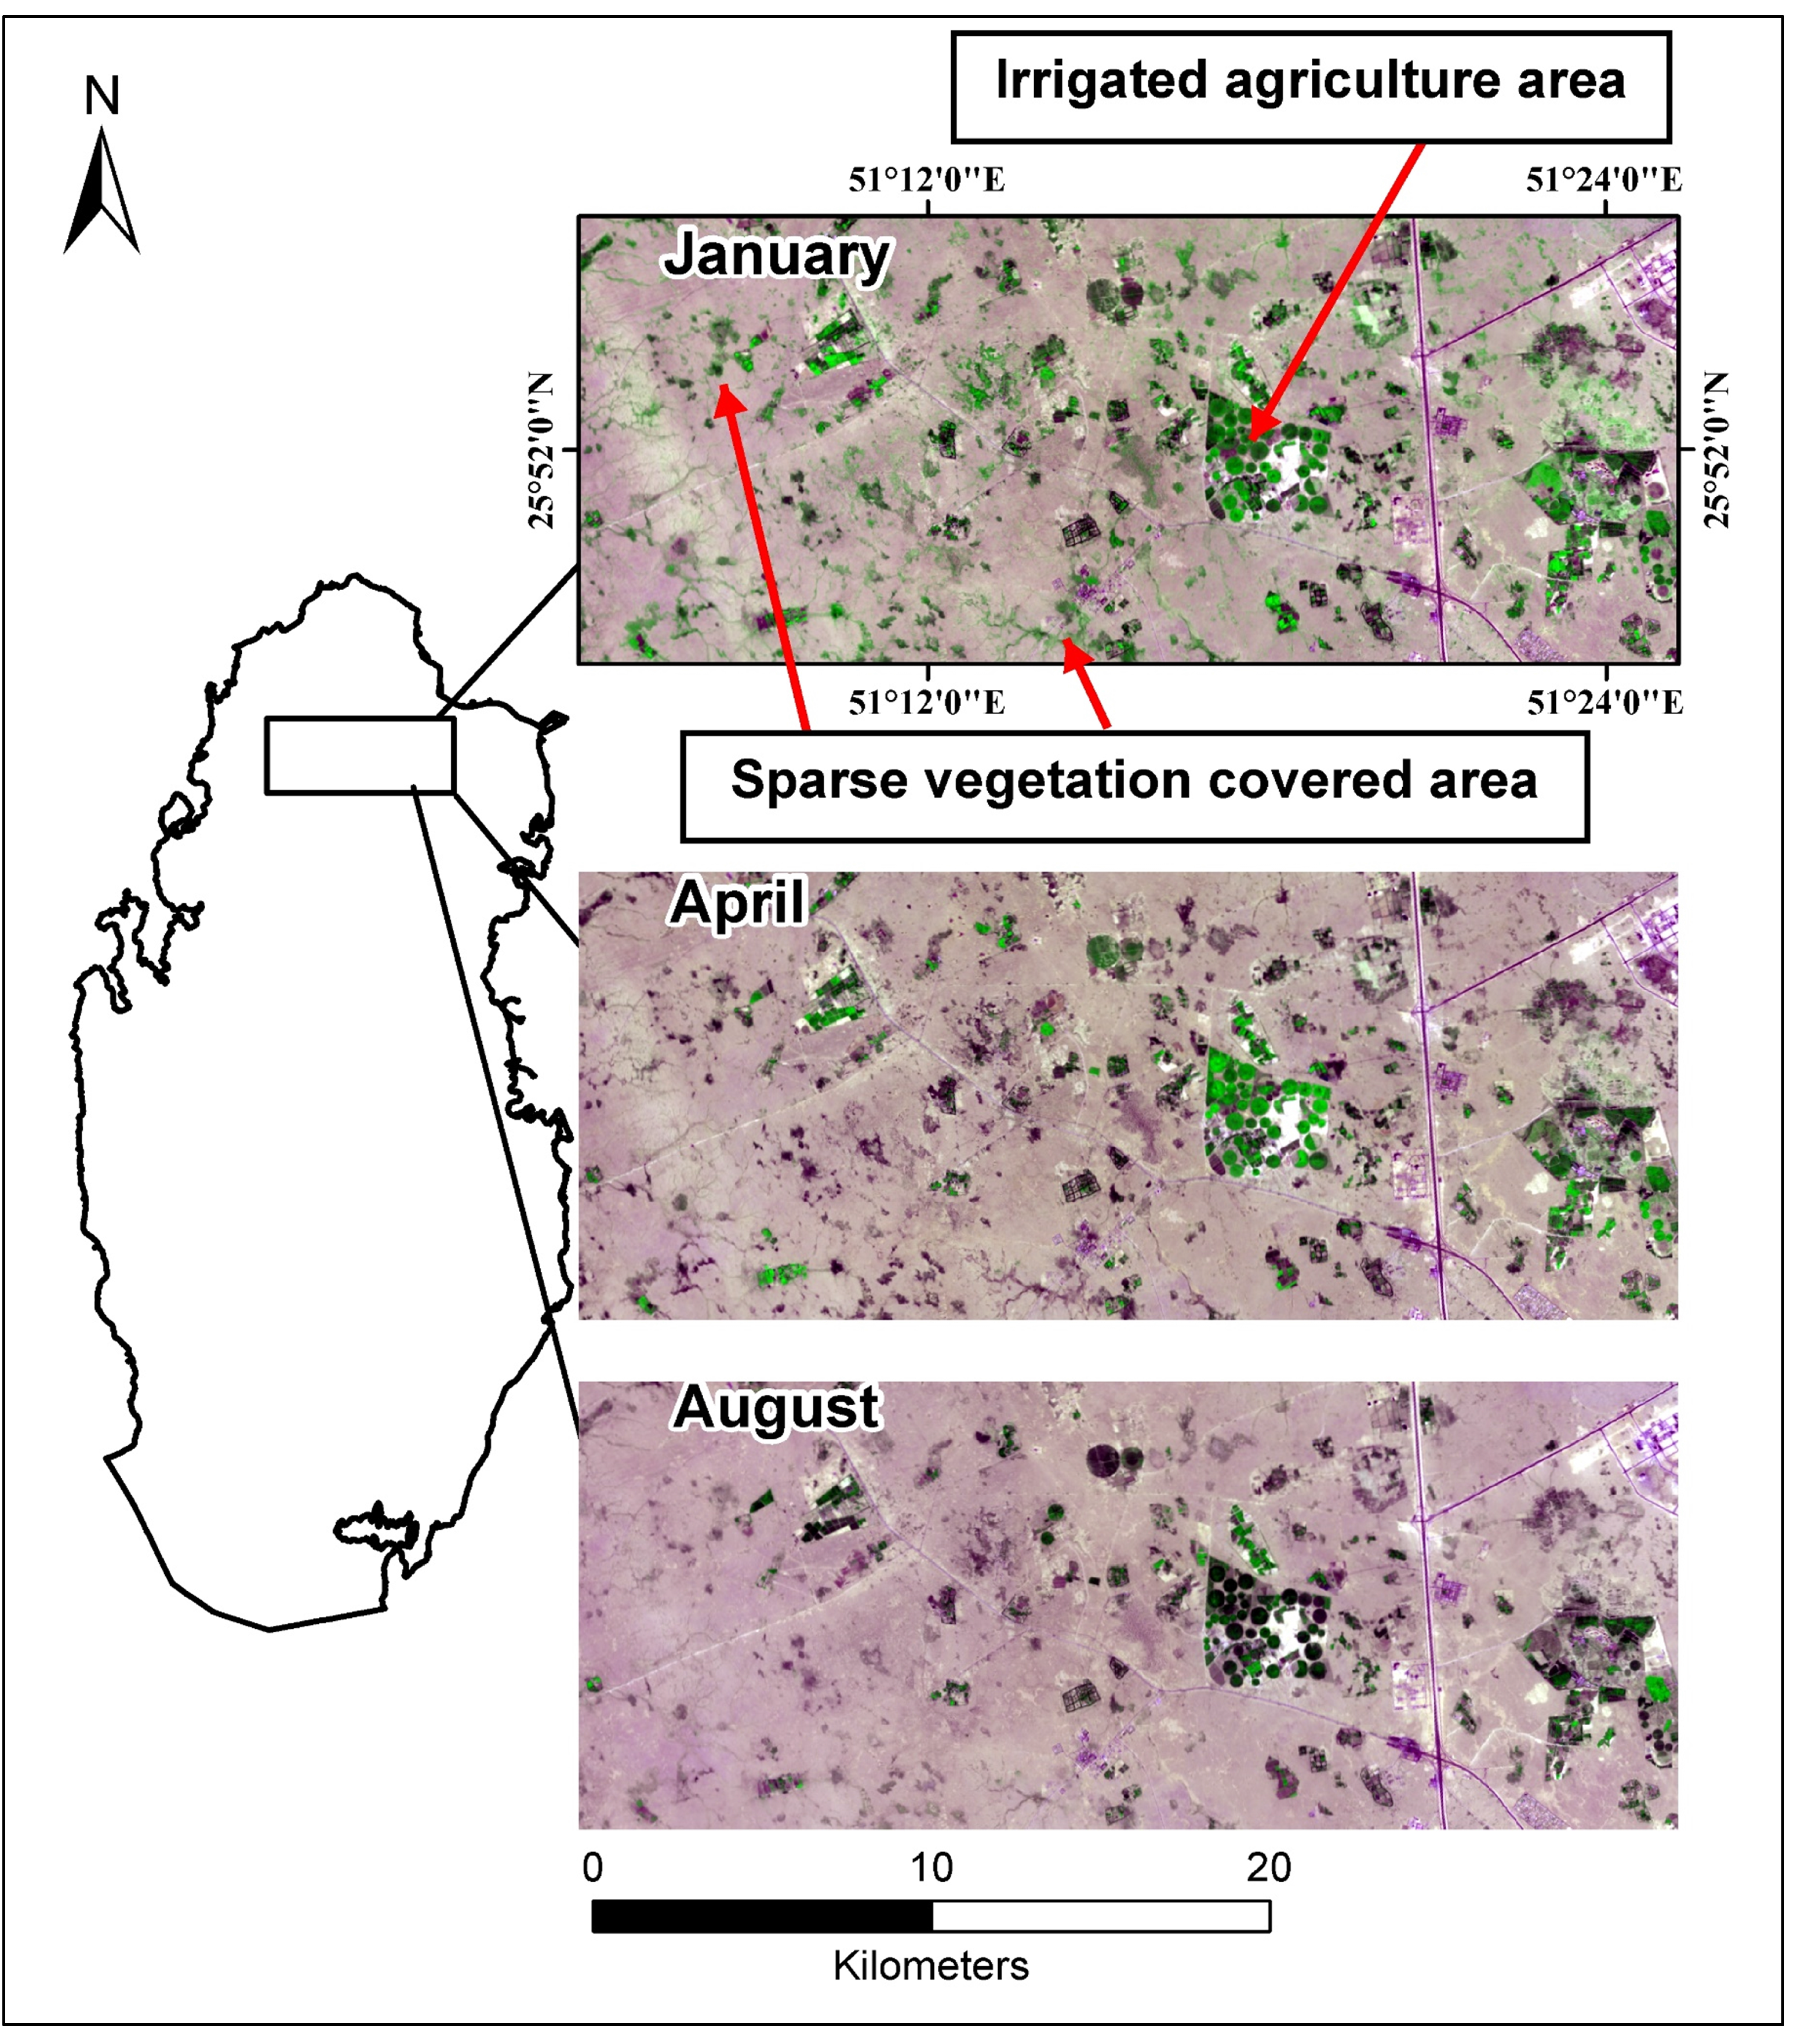
Figure 4 presents extracts of Landsat 8 images from different seasons in 2014 for a small area located to the north of Qatar. We can clearly see that the amount of vegetation or plants decreased dramatically after the winter season, and almost no vegetation cover was present during the summer, even for irrigated agricultural areas. This phenomenon is mainly due to the very limited precipitation and very high temperature after winter.
Firstly, Qatar has a relatively flat to undulating desert landscape with gently varying topography. In winter, rainwater transports some of the soil from more elevated to low-lying areas where more vegetation grows. Flooding may also occur in Qatar during heavy rainfall, and water can temporarily accumulate in lowlands. This may lead to the movement and accumulation of various toxic metals with mineral particles to lowland areas. Therefore, we observed relatively higher toxic metals’ concentrations in the soils on vegetated lowland areas.
Secondly, the local climate of the study area needs to be considered. Because the rainfall occurs in the winter season and the mean temperature is around 25 °C, the conditions are best at this time of the year for germinating and growing vegetation. Some toxic metals in soil can apparently affect the germination process or plant growth. Toxic metals in high concentrations have been reported to progressively inhibit the early phases of seed germination. This also affects the reactivation of oxygen, changes in metabolic energy and the mobilization of sugars and phosphoro-organic compounds, along with changes in protein synthesis in seeds during germination [
66,
67,
68]. All of these toxic metals at high concentrations in soil can inhibit germination, plant growth, chlorophyll production, reduce the germination rate and suppress yield, probably due to the toxic effects of various metabolic processes [
69,
70]. Different plant and vegetation phenotyping is detectable by RS data, for example the comparison between reflectance in the NIR band and the red band enable an analysis of vegetation vigor and biomass based on the chlorophyll concentration [
71,
72]. Therefore, the raw bands (reflectance values) are very important attributes in the modeling process (
Table 6).
3.5. RS Indices for Toxic Metals’ Prediction
Some of the RS spectral indices also had a high attribute usage for modeling the target elements (
Table 6). The tasseled cap transformation and BCI were the most frequently-used indices. The tasseled cap transformation ranked in the top 10 predictors for As, Zn, Pb and Cu, while the BCI index ranked in the top 10 predictors for Cr, Ni, Zn and Pb.
The tasseled cap transformation is a global vegetation index. It can be applied for disaggregation of the amount of soil brightness, vegetation and moisture content in each pixel of the Landsat data. Urbanized areas are particularly evident in the brightness image; the greater the biomass, the brighter the pixel value in the greenness image; the wetness image is related to soil features, providing information of the moisture status in the observed area. Therefore, these indices can be very good indicators for vegetation status, classification of urban area and observing soil moisture content. The advantage of using the BCI index (the development of which is based on the tasseled cap transformation) is the more accurate prediction of vegetation abundance by the ability through enhanced contrast to separate impervious surfaces from soils and vegetation [
43]. In this study, we could not find any accurate land use map as the environmental parameter for spatial modelling. Therefore, this index not only provides information of vegetation cover, but also identifies urban areas (impervious surfaces).
The indices NDVI, EVI and SAVI ranked in the top 10 variables for the modeling of As only. This can be explained by the major sources of As contamination in soils being pesticides and fertilizers from agriculture [
63,
73]. These three indices indicate changes in the amount of green biomass. In agriculture, heavy applications of pesticides and fertilizers produce greener biomass, leaving a high concentration of As in soils. We also found a Pearson correlation coefficient value between As and each of the three indices of over 0.3 and levels of significance:
p < 0.05. Thus, our results suggest a strong positive relationship between the level of As contamination in soils and the amount of green biomass produced on agricultural land in Qatar.
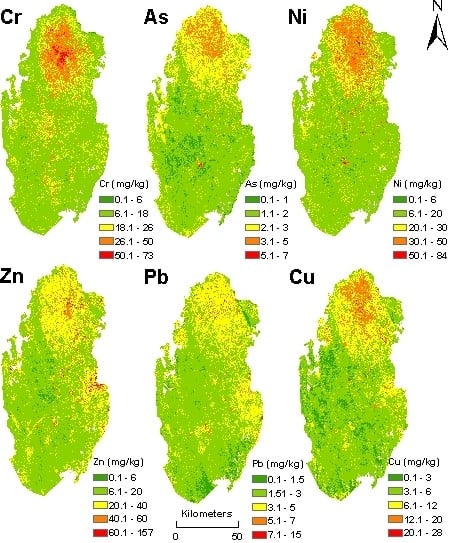
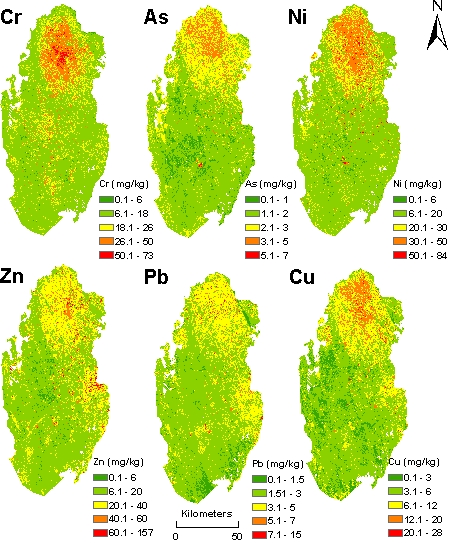
3.6. Predicted Maps of Toxic Metals in Soil
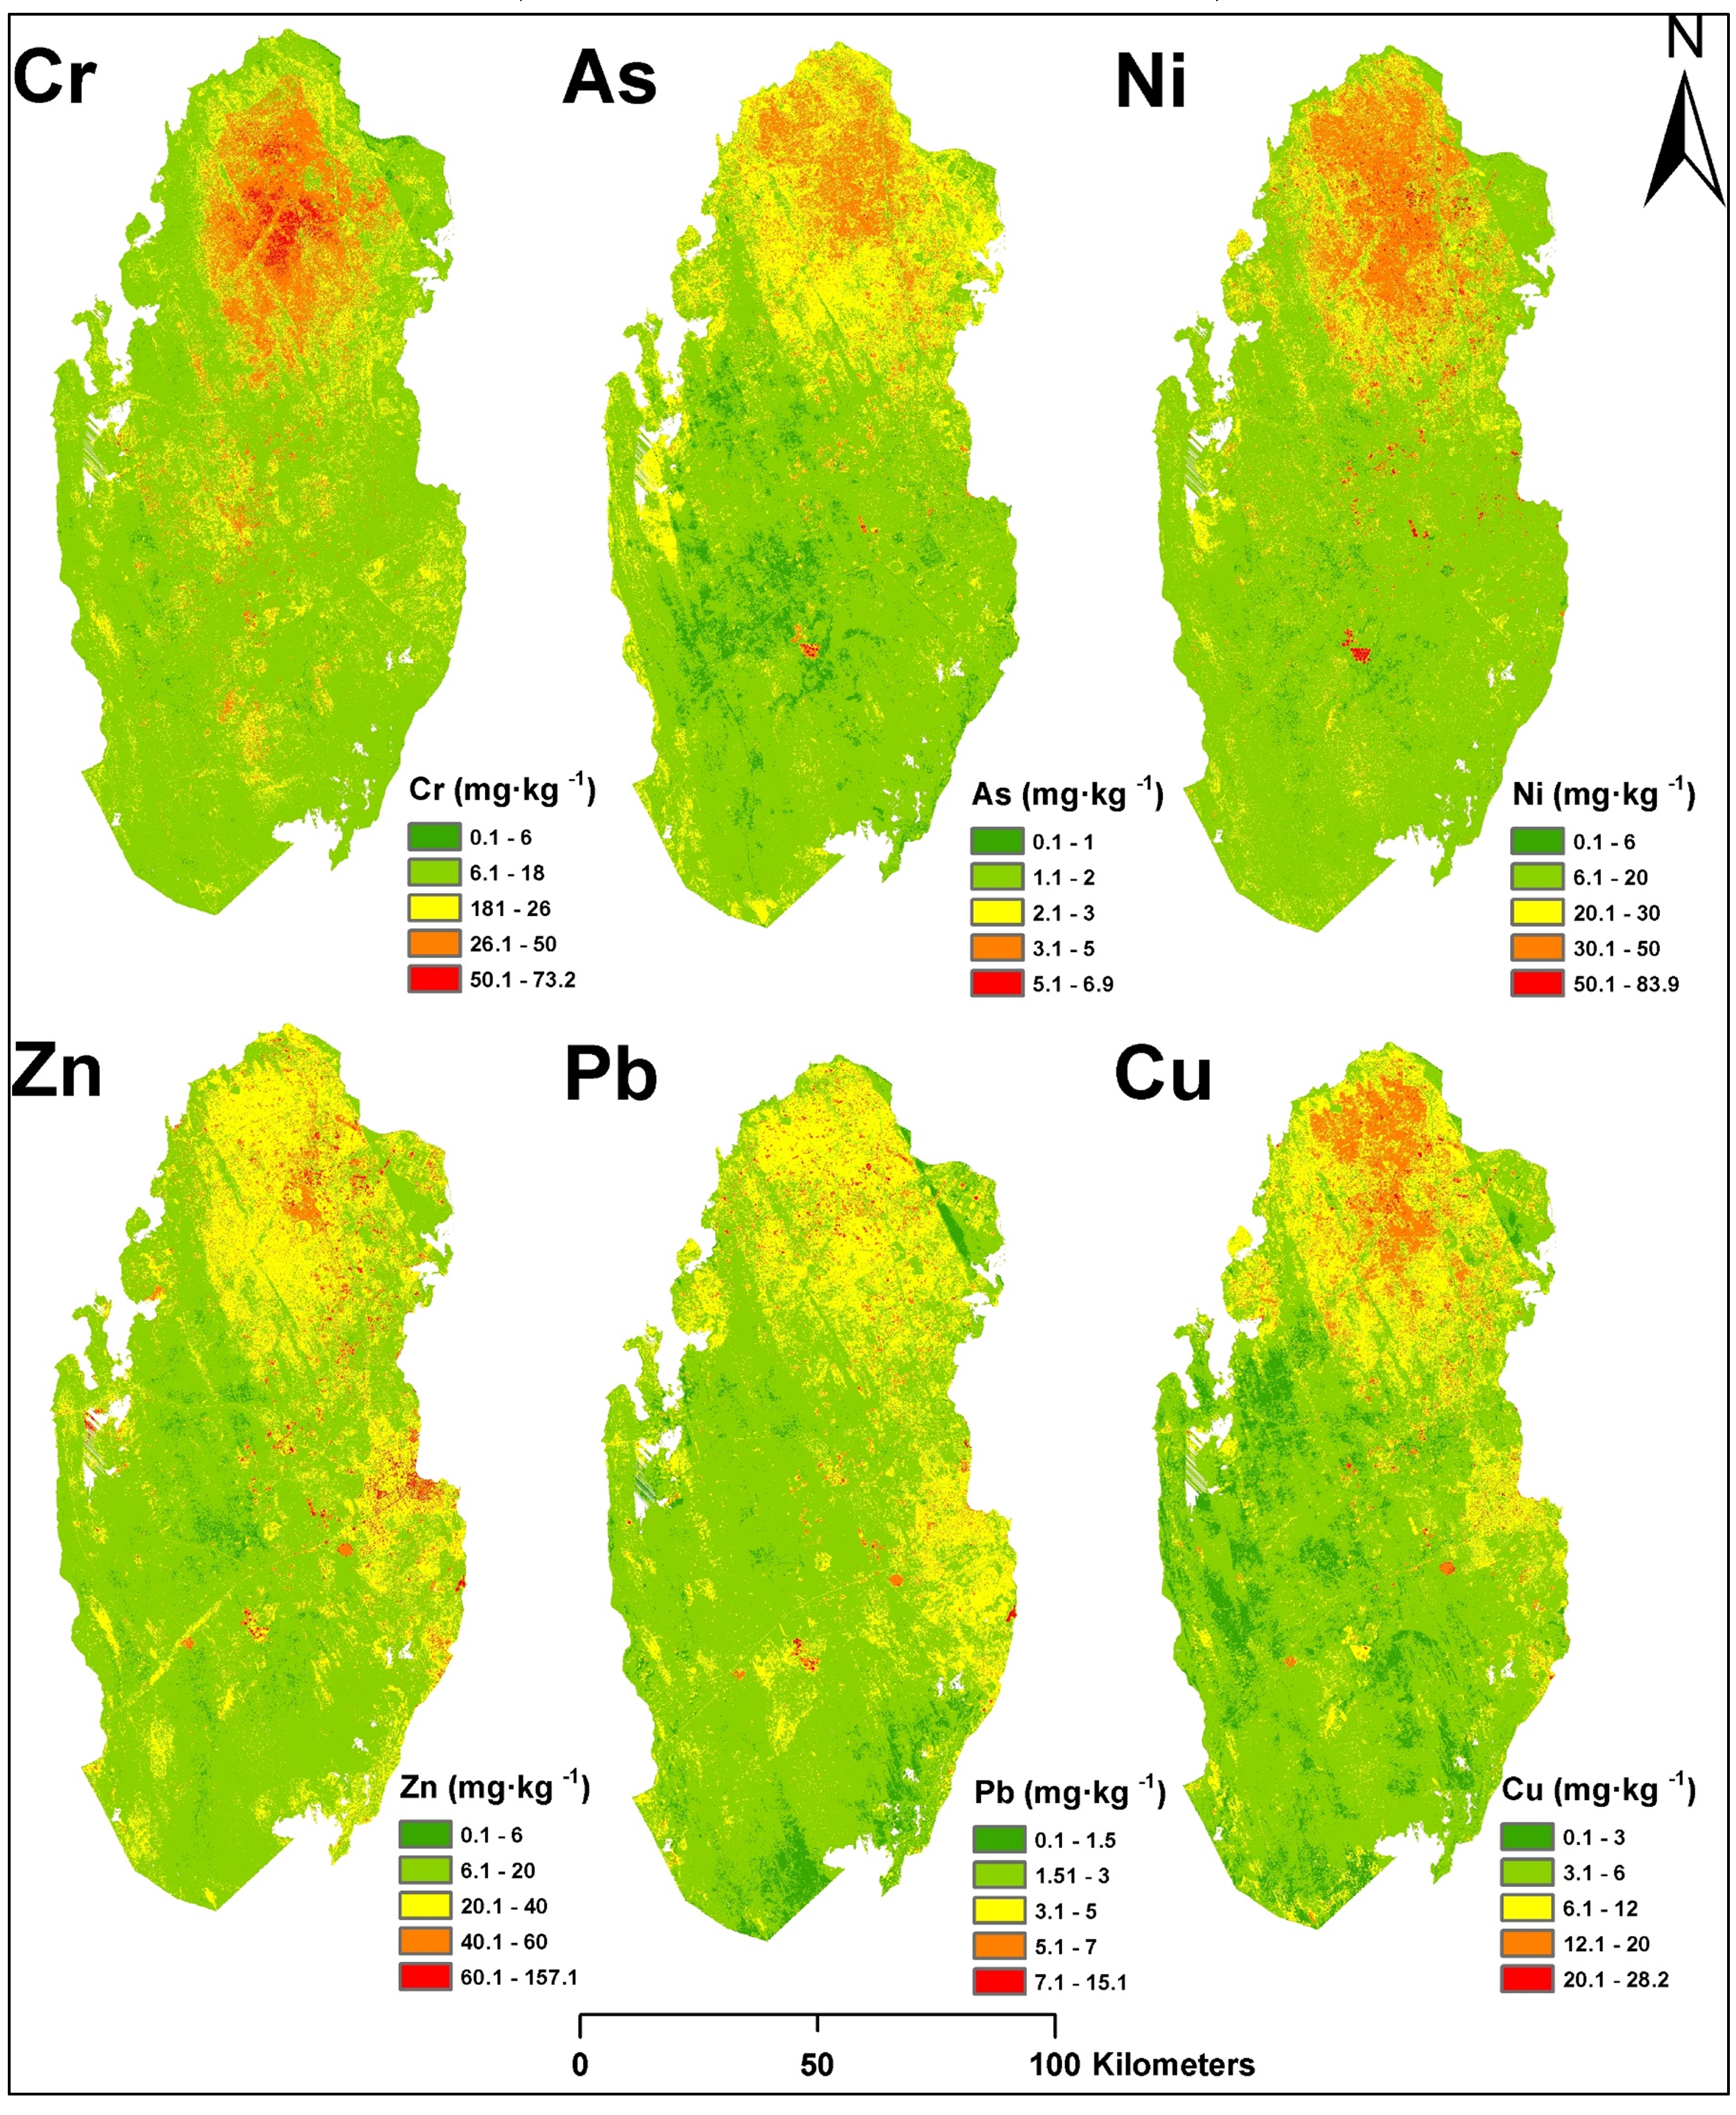
Six predicted maps of toxic metals accumulations are shown in
Figure 5. Based on these maps, we can easily identify relationships between chaotic urbanization and rapid industrialization and soil accumulation of toxic metals, as confirmed also in other studies [
2,
10,
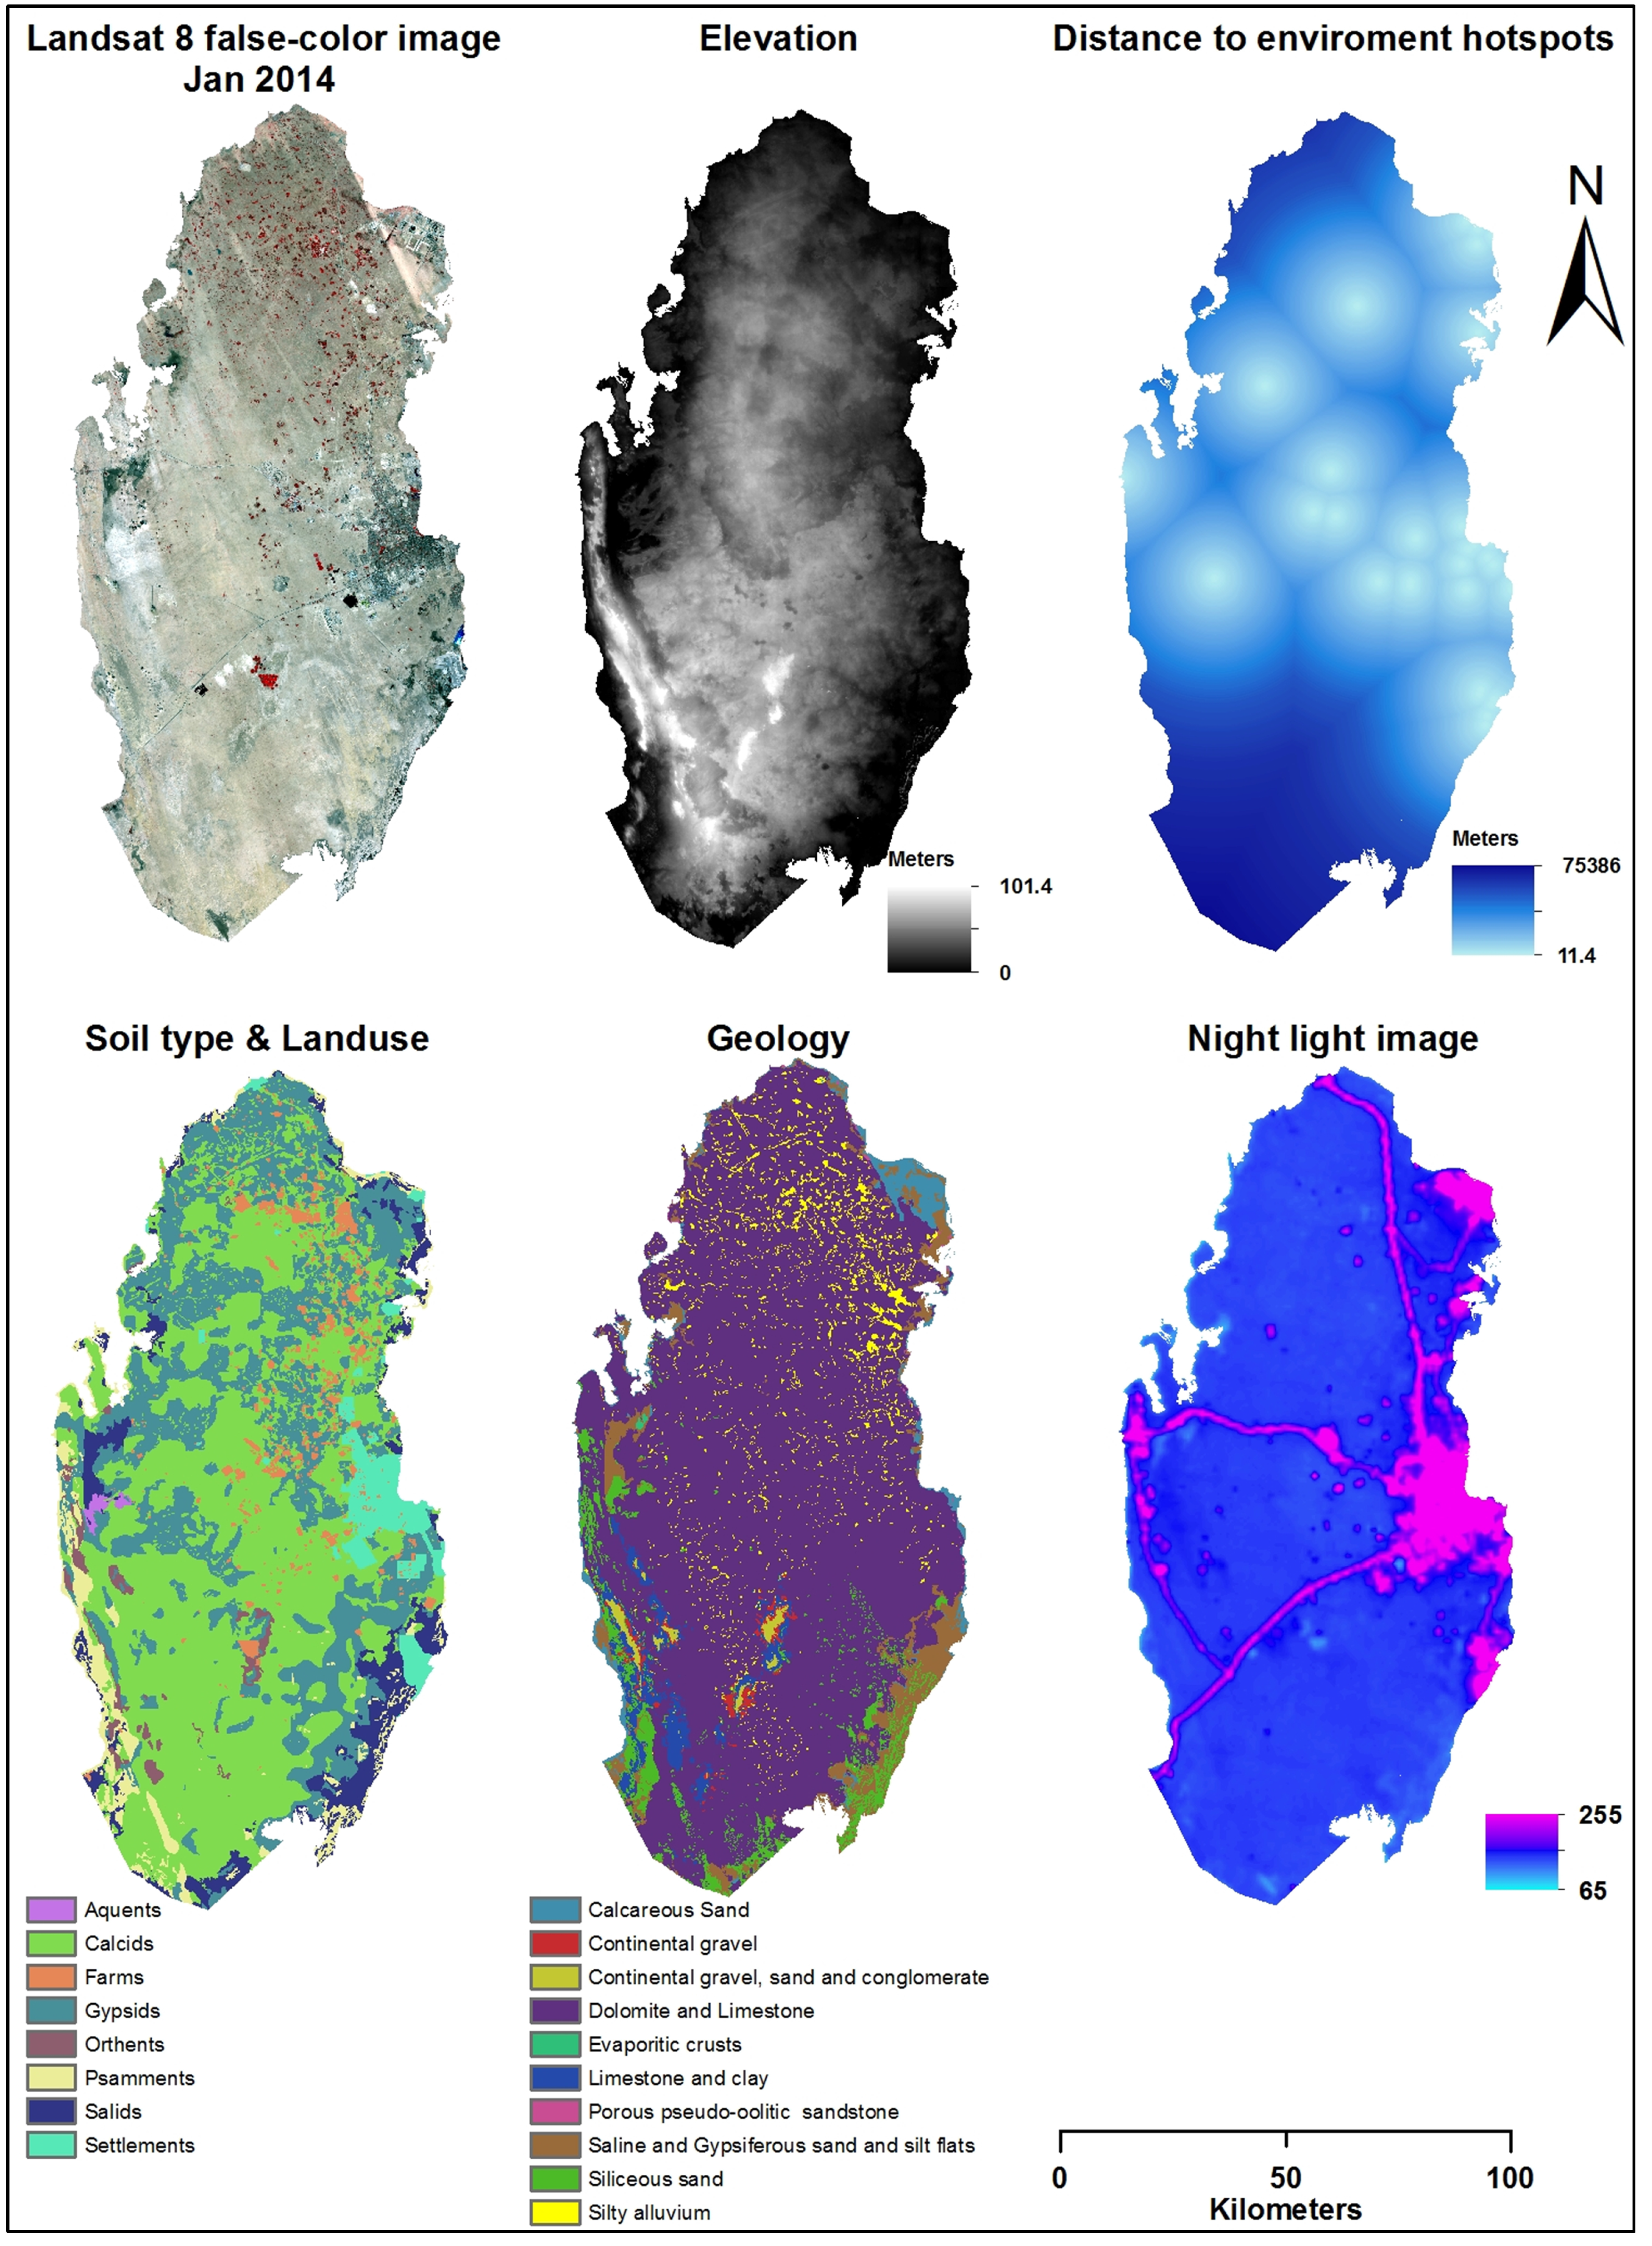
74]. All of the predicted maps showed similar spatial distributions, such as a higher toxic metals’ accumulation in the northern part of Qatar than in the south. This can be explained by anthropic activity and geopedological impact. First, most of the agriculture and industry is located in the northern part of the country (
Figure 2). Second, the parent material in this area is partly silty alluvium where the soil has been eroded and reshaped by water in some form and redeposited in a non-marine setting. This influence is strongly related to the adsorption of toxic metals to sediments or soil particles that result from the alteration of parent materials.
The maps of elements Zn, Pb and Cu also show high accumulations in the eastern part of country (Doha City area). Many studies have reported accumulations of toxic metals (Zn, Pb and Cu) in urban soils, mainly derived from vehicle emissions and industrial consumption [
16,
62,
63,
64,
75]. Higher accumulations of these three elements have also been observed closer to highways, mainly from aerial deposition of metal particulates from motor vehicles. Due to the very high correlation between Cr, As and Ni, the maps of these three elements also show very similar spatial distributions. Higher values were observed in the northern part of the country when compared to urban areas.
However, due to the issue of cloudiness, the present study included satellite images from only nine months of 2015. This problem was apparent, for example, on images from March that could not be used for spatial modelling. However, according to our findings, spring images contributed the most to calibration; therefore, the calibration model might be improved if images from March were involved in this study. The issue of cloud coverage is one of the major constraints when applying optical satellite images. Thus, alternatives for dealing with this issue might be the utilization of imagery from the Sentinel-2 sensor that assures the most frequent revisit period and increases the chances for the collection of cloud-free images.
4. Conclusions
The use of various sets of environmental parameters (geopedological, geomorphology, anthropogenic), Landsat 8 images and spectral indices for predicting As/Cr/Ni/Zn/Cu/Pb contents in Qatari soils using Cubist regression rules showed promising predictive capabilities. One of the biggest findings of this study was that, because of the seasonal variation in the climate in Qatar, the RS images from January and February provided the most important vegetation information for predicting toxic metals’ accumulation in soils. The modeling process also showed that different spectral indices, such as tasseled cap transformation and BCI, were able to enhance spectral features to indirectly reveal various toxic metals in soils. The spatial distribution of Cu, Zn and Pb was highly affected by anthropogenic parameters, such as the distance to environmental hotspots, proximity to roads and night light image. The spatial distribution of As, Cr and Ni, on the other hand, was influenced more by geopedological and geomorphology parameters.
The predictive maps can be used by environmental authorities and land managers when choosing remediation measures (preventive, protective and restorative) in urbanized and industrialized arid landscapes based on the dominant environmental cause. The maps can be considered as valuable decision-support systems (predictive tools) for all kinds of users when more sophisticated technologies and datasets are not available and do not require special skills to use. In addition, they can be applied to land evaluation, planning and management, as well as environmental protection strategies.
The overall accuracies of the spatial models can be increased by: (i) improving the scales and resolutions of the environmental parameters considered to better reflect soil pollution variation or (ii) adding other environmental parameters, such as a land use map or climate and vegetation data, if available.
Continuation of the current work relies on testing the ability of the multi-spectral images to predict other toxic metals (cadmium, Cd, mercury, Hg, uranium, U) prevailing in arid urbanized and industrialized landscapes. Furthermore, it will be interesting to compare the use of images with higher spatial resolutions or testing the fusion of images from different sensors for spatial modeling (such as WorldView, Sentinel-2, GeoEye, etc.).


 ,
, 


